Attached files
| file | filename |
|---|---|
| EX-99.1 - EX-99.1 - First Western Financial Inc | myfw-20200723xex99d1.htm |
| 8-K - 8-K - First Western Financial Inc | myfw-20200723x8k.htm |
Exhibit 99.2
| First Western Financial, Inc. The First, Western-Based Private Trust Bank Second Quarter 2020 Conference Call |

| Safe Harbor 2 This presentation contains “forward-looking statements” within the meaning of Section 27A of the Securities Act of 1933, as amended, and Section 21E of the Securities Exchange Act of 1934, as amended. These forward-looking statements reflect the current views of First Western Financial, Inc.’s (“First Western”) management with respect to, among other things, future events and First Western’s financial performance. These statements are often, but not always, made through the use of words or phrases such as “may,” “should,” “could,” “predict,” “potential,” “believe,” “will likely result,” “expect,” “continue,” “will,” “anticipate,” “seek,” “estimate,” “intend,” “plan,” “project,” “future” “forecast,” “goal,” “target,” “would” and “outlook,” or the negative variations of those words or other comparable words of a future or forward-looking nature. These forward-looking statements are not historical facts, and are based on current expectations, estimates and projections about First Western’s industry, management’s beliefs and certain assumptions made by management, many of which, by their nature, are inherently uncertain and beyond First Western’s control. Accordingly, First Western cautions you that any such forward-looking statements are not guarantees of future performance and are subject to risks, assumptions and uncertainties that are difficult to predict. Although First Western believes that the expectations reflected in these forward-looking statements are reasonable as of the date made, actual results may prove to be materially different from the results expressed or implied by the forward-looking statements. Those following risks and uncertainties, among others, could cause actual results and future events to differ materially from those set forth or contemplated in the forward-looking statements: the COVID-19 pandemic and its effects; integration risks in connection with acquisitions; the risk of geographic concentration in Colorado, Arizona, Wyoming and California; the risk of changes in the economy affecting real estate values and liquidity; the risk in our ability to continue to originate residential real estate loans and sell such loans; risks specific to commercial loans and borrowers; the risk of claims and litigation pertaining to our fiduciary responsibilities; the risk of competition for investment managers and professionals; the risk of fluctuation in the value of our investment securities; the risk of changes in interest rates; and the risk of the adequacy of our allowance for credit losses and the risk in our ability to maintain a strong core deposit base or other low-cost funding sources. Additional information regarding these and other risks and uncertainties to which our business and future financial performance are subject is contained in our Annual Report on Form 10-K filed with the U.S. Securities and Exchange Commission (“SEC”) on March 12, 2020 and other documents we file with the SEC from time to time. All subsequent written and oral forward-looking statements attributable to First Western or persons acting on First Western’s behalf are expressly qualified in their entirety by this paragraph. Forward-looking statements speak only as of the date of this presentation. First Western undertakes no obligation to publicly update or otherwise revise any forward-looking statements, whether as a result of new information, future events or otherwise (except as required by law). Certain of the information contained herein may be derived from information provided by industry sources. The Company believes that such information is accurate and the sources from which it has been obtained are reliable; however, the Company cannot guaranty the accuracy of such information and has not independently verified such information. This presentation contains certain non-GAAP financial measures intended to supplement, not substitute for, comparable GAAP measures. Reconciliations of non-GAAP financial measures to GAAP financial measures are provided at the end of this presentation. Numbers in the presentation may not sum due to rounding. |
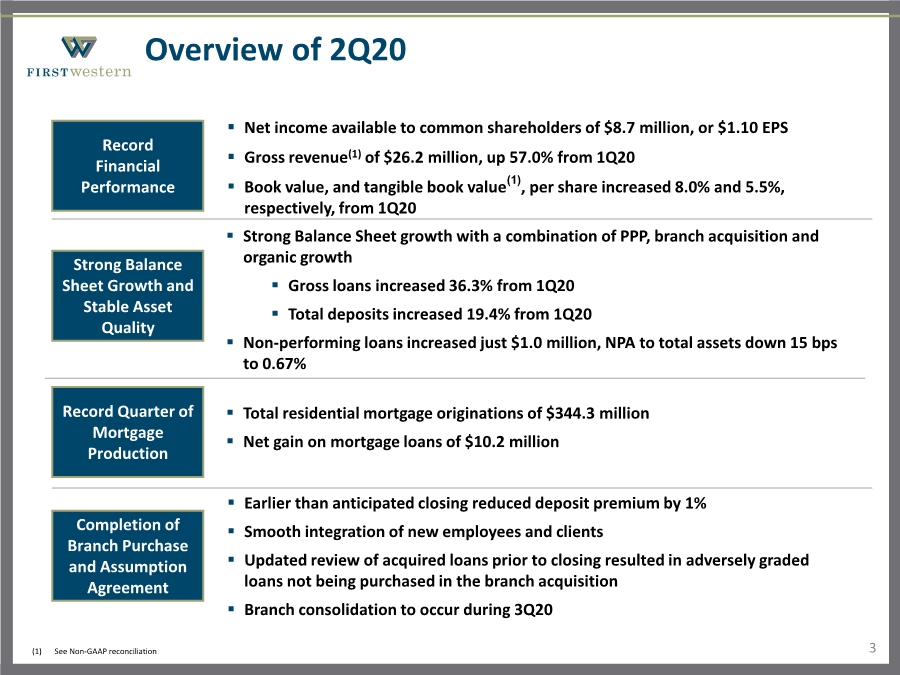
| Overview of 2Q20 Record Quarter of Mortgage Production Record Financial Performance Strong Balance Sheet Growth and Stable Asset Quality . Strong Balance Sheet growth with a combination of PPP, branch acquisition and organic growth . Gross loans increased 36.3% from 1Q20 . Total deposits increased 19.4% from 1Q20 . Non-performing loans increased just $1.0 million, NPA to total assets down 15 bps to 0.67% . Earlier than anticipated closing reduced deposit premium by 1% . Smooth integration of new employees and clients . Updated review of acquired loans prior to closing resulted in adversely graded loans not being purchased in the branch acquisition . Branch consolidation to occur during 3Q20 Completion of Branch Purchase and Assumption Agreement . Total residential mortgage originations of $344.3 million . Net gain on mortgage loans of $10.2 million 3 . Net income available to common shareholders of $8.7 million, or $1.10 EPS . Gross revenue(1) of $26.2 million, up 57.0% from 1Q20 . Book value, and tangible book value(1), per share increased 8.0% and 5.5%, respectively, from 1Q20 (1) See Non-GAAP reconciliation |
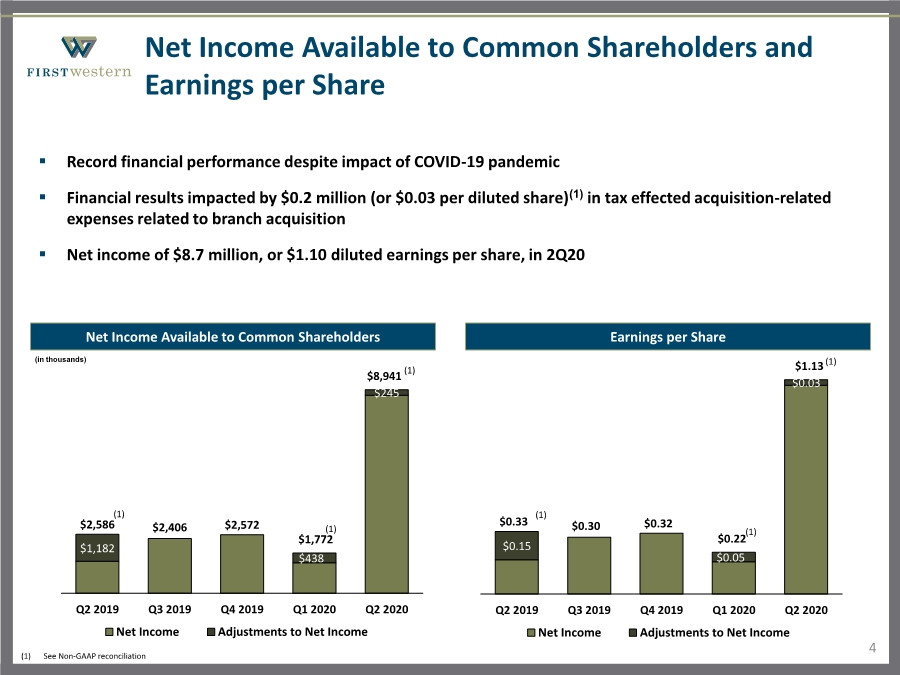
| Net Income Available to Common Shareholders and Earnings per Share 4 Net Income Available to Common Shareholders . Record financial performance despite impact of COVID-19 pandemic . Financial results impacted by $0.2 million (or $0.03 per diluted share)(1) in tax effected acquisition-related expenses related to branch acquisition . Net income of $8.7 million, or $1.10 diluted earnings per share, in 2Q20 Earnings per Share (in thousands) $1,182 $438 $245 $2,586 $2,406 $2,572 $1,772 $8,941 Q2 2019 Q3 2019 Q4 2019 Q1 2020 Q2 2020 Net Income Adjustments to Net Income (1) (1) See Non-GAAP reconciliation (1) (1) $0.15 $0.05 $0.03 $0.33 $0.30 $0.32 $0.22 $1.13 Q2 2019 Q3 2019 Q4 2019 Q1 2020 Q2 2020 Net Income Adjustments to Net Income (1) (1) (1) |
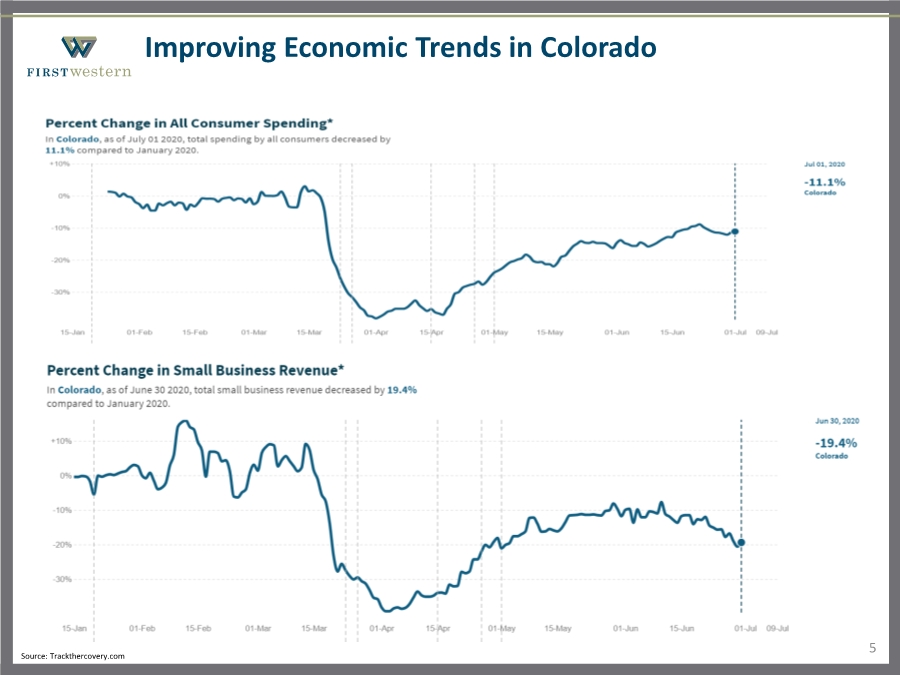
| Improving Economic Trends in Colorado 5 Source: Trackthercovery.com |
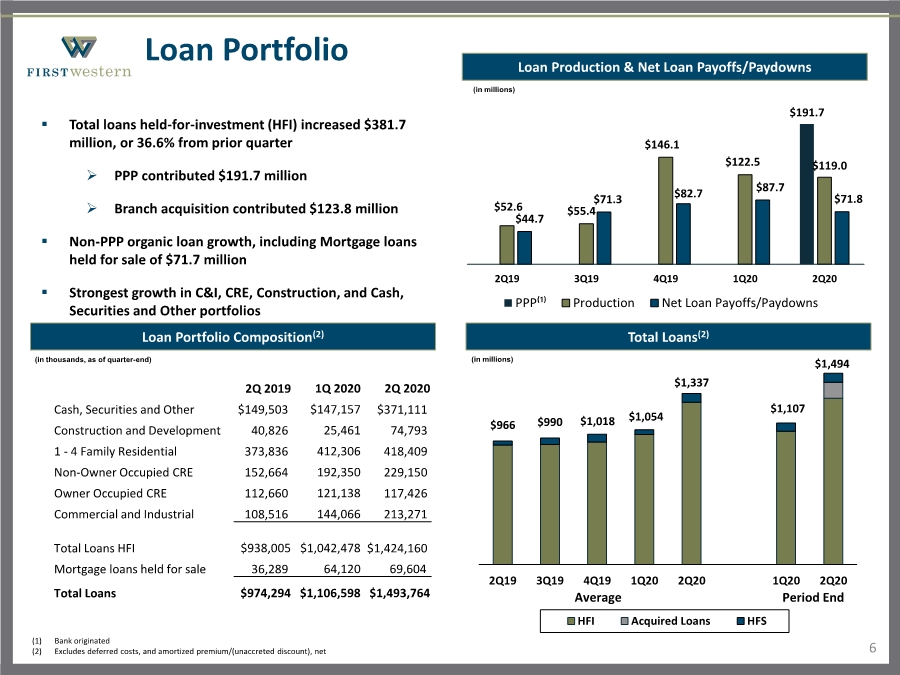
| $966 $990 $1,018 $1,054 $1,337 $1,107 $1,494 2Q19 3Q19 4Q19 1Q20 2Q20 1Q20 2Q20 HFI Acquired Loans HFS Average Period End Loan Portfolio 6 Loan Portfolio Composition(2) . Total loans held-for-investment (HFI) increased $381.7 million, or 36.6% from prior quarter PPP contributed $191.7 million Branch acquisition contributed $123.8 million . Non-PPP organic loan growth, including Mortgage loans held for sale of $71.7 million . Strongest growth in C&I, CRE, Construction, and Cash, Securities and Other portfolios (in thousands, as of quarter-end) Total Loans(2) (in millions) (1) Bank originated (2) Excludes deferred costs, and amortized premium/(unaccreted discount), net 2Q 2019 1Q 2020 2Q 2020 Cash, Securities and Other $149,503 $147,157 $371,111 Construction and Development 40,826 25,461 74,793 1 - 4 Family Residential 373,836 412,306 418,409 Non-Owner Occupied CRE 152,664 192,350 229,150 Owner Occupied CRE 112,660 121,138 117,426 Commercial and Industrial 108,516 144,066 213,271 Total Loans HFI $938,005 $1,042,478 $1,424,160 Mortgage loans held for sale 36,289 64,120 69,604 Total Loans $974,294 $1,106,598 $1,493,764 Loan Production & Net Loan Payoffs/Paydowns $191.7 $52.6 $55.4 $146.1 $122.5 $119.0 $44.7 $71.3 $82.7 $87.7 $71.8 2Q19 3Q19 4Q19 1Q20 2Q20 PPP⁽¹⁾ Production Net Loan Payoffs/Paydowns (in millions) |
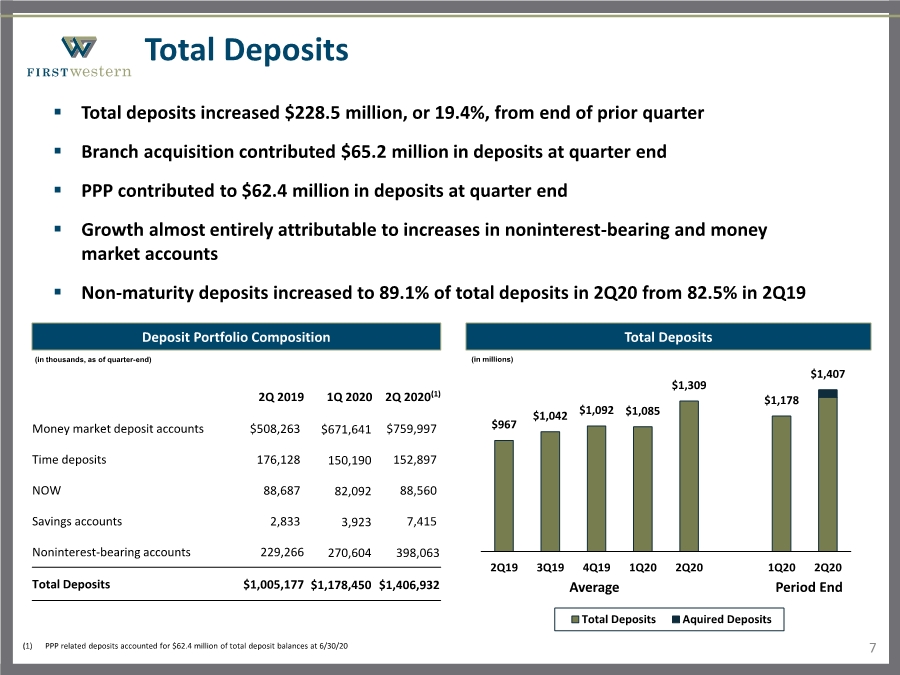
| $967 $1,042 $1,092 $1,085 $1,309 $1,178 $1,407 2Q19 3Q19 4Q19 1Q20 2Q20 1Q20 2Q20 Total Deposits Aquired Deposits Average Period End Total Deposits 7 Deposit Portfolio Composition . Total deposits increased $228.5 million, or 19.4%, from end of prior quarter . Branch acquisition contributed $65.2 million in deposits at quarter end . PPP contributed to $62.4 million in deposits at quarter end . Growth almost entirely attributable to increases in noninterest-bearing and money market accounts . Non-maturity deposits increased to 89.1% of total deposits in 2Q20 from 82.5% in 2Q19 2Q 2019 1Q 2020 2Q 2020(1) Money market deposit accounts $508,263 $671,641 $759,997 Time deposits 176,128 150,190 152,897 NOW 88,687 82,092 88,560 Savings accounts 2,833 3,923 7,415 Noninterest-bearing accounts 229,266 270,604 398,063 Total Deposits $1,005,177 $1,178,450 $1,406,932 (in thousands, as of quarter-end) Total Deposits (in millions) (1) PPP related deposits accounted for $62.4 million of total deposit balances at 6/30/20 |
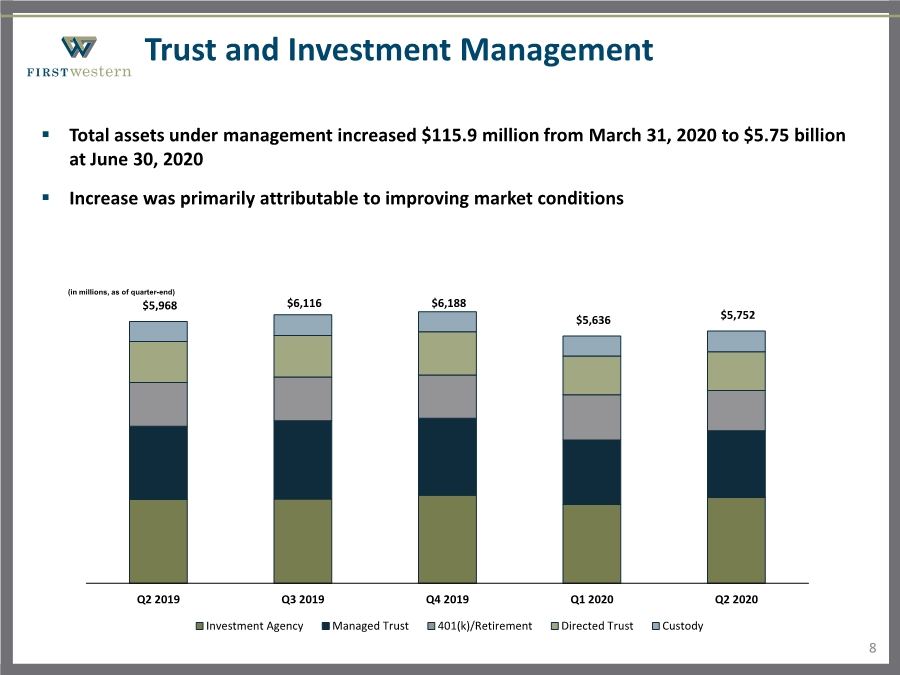
| Trust and Investment Management . Total assets under management increased $115.9 million from March 31, 2020 to $5.75 billion at June 30, 2020 . Increase was primarily attributable to improving market conditions $5,968 $6,116 $6,188 $5,636 $5,752 Q2 2019 Q3 2019 Q4 2019 Q1 2020 Q2 2020 Investment Agency Managed Trust 401(k)/Retirement Directed Trust Custody (in millions, as of quarter-end) 8 |
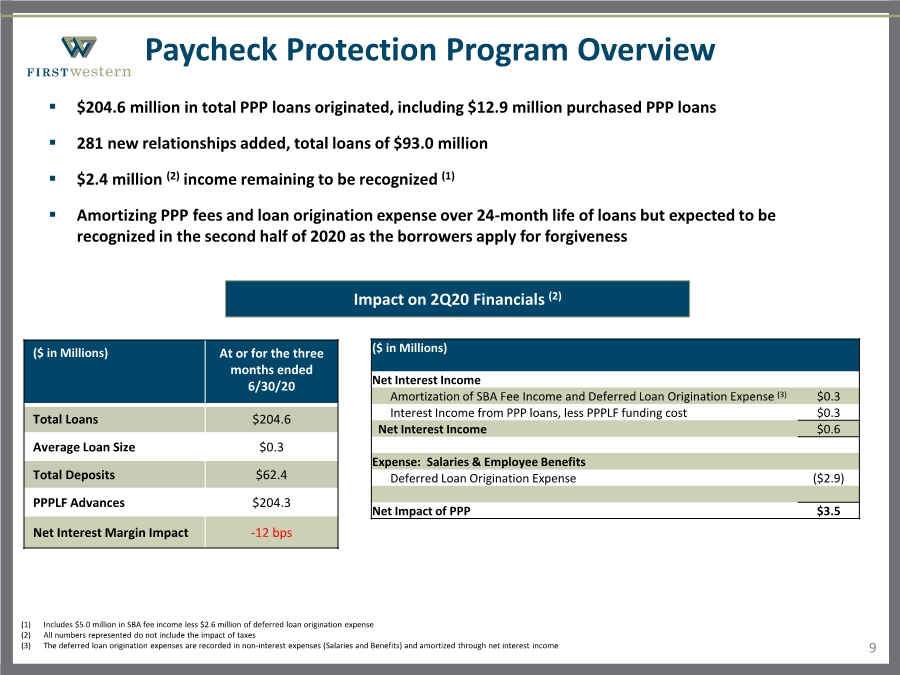
| Paycheck Protection Program Overview 9 ($ in Millions) At or for the three months ended 6/30/20 Total Loans $204.6 Average Loan Size $0.3 Total Deposits $62.4 PPPLF Advances $204.3 Net Interest Margin Impact -12 bps . $204.6 million in total PPP loans originated, including $12.9 million purchased PPP loans . 281 new relationships added, total loans of $93.0 million . $2.4 million (2) income remaining to be recognized (1) . Amortizing PPP fees and loan origination expense over 24-month life of loans but expected to be recognized in the second half of 2020 as the borrowers apply for forgiveness Impact on 2Q20 Financials (2) (1) Includes $5.0 million in SBA fee income less $2.6 million of deferred loan origination expense (2) All numbers represented do not include the impact of taxes (3) The deferred loan origination expenses are recorded in non-interest expenses (Salaries and Benefits) and amortized through net interest income ($ in Millions) Net Interest Income Amortization of SBA Fee Income and Deferred Loan Origination Expense (3) $0.3 Interest Income from PPP loans, less PPPLF funding cost $0.3 Net Interest Income $0.6 Expense: Salaries & Employee Benefits Deferred Loan Origination Expense ($2.9) Net Impact of PPP $3.5 |
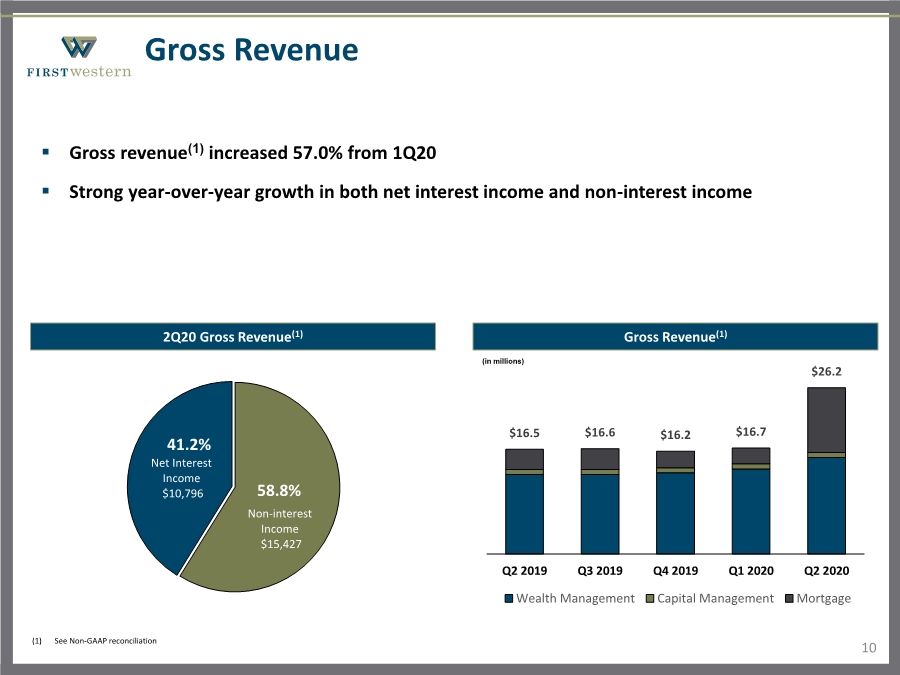
| Non-interest Income $15,427 Net Interest Income $10,796 41.2% 58.8% Gross Revenue 10 (1) See Non-GAAP reconciliation 2Q20 Gross Revenue(1) . Gross revenue(1) increased 57.0% from 1Q20 . Strong year-over-year growth in both net interest income and non-interest income Gross Revenue(1) $16.5 $16.6 $16.2 $16.7 $26.2 Q2 2019 Q3 2019 Q4 2019 Q1 2020 Q2 2020 Wealth Management Capital Management Mortgage (in millions) |
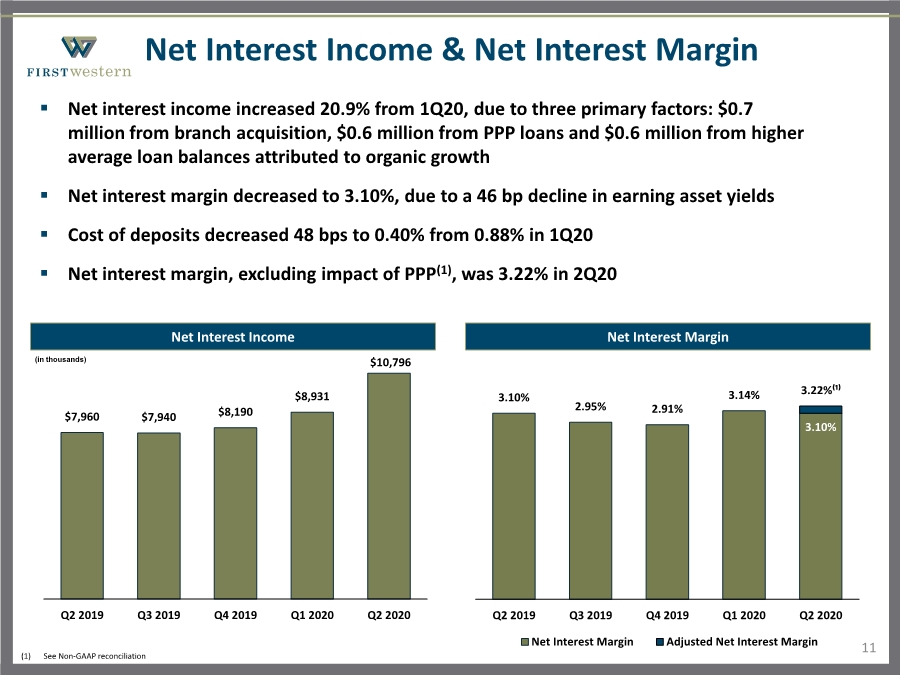
| Net Interest Income & Net Interest Margin 11 Net Interest Income . Net interest income increased 20.9% from 1Q20, due to three primary factors: $0.7 million from branch acquisition, $0.6 million from PPP loans and $0.6 million from higher average loan balances attributed to organic growth . Net interest margin decreased to 3.10%, due to a 46 bp decline in earning asset yields . Cost of deposits decreased 48 bps to 0.40% from 0.88% in 1Q20 . Net interest margin, excluding impact of PPP(1), was 3.22% in 2Q20 Net Interest Margin 3.10% 3.10% 2.95% 2.91% 3.14% 3.22%⁽¹⁾ Q2 2019 Q3 2019 Q4 2019 Q1 2020 Q2 2020 Net Interest Margin Adjusted Net Interest Margin $7,960 $7,940 $8,190 $8,931 $10,796 Q2 2019 Q3 2019 Q4 2019 Q1 2020 Q2 2020 (in thousands) (1) See Non-GAAP reconciliation |
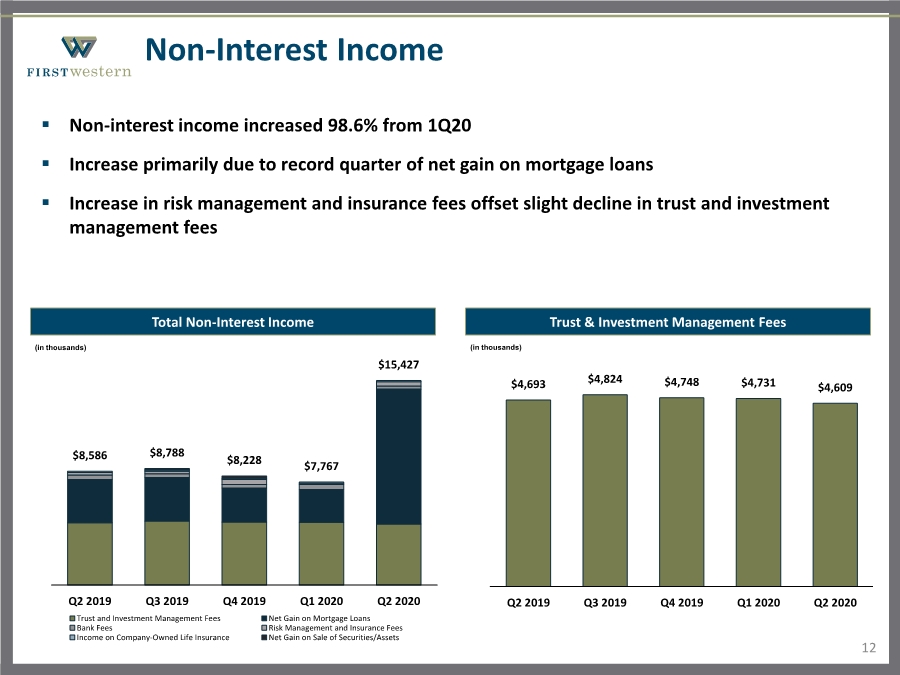
| $4,693 $4,824 $4,748 $4,731 $4,609 Q2 2019 Q3 2019 Q4 2019 Q1 2020 Q2 2020 Non-Interest Income 12 Total Non-Interest Income . Non-interest income increased 98.6% from 1Q20 . Increase primarily due to record quarter of net gain on mortgage loans . Increase in risk management and insurance fees offset slight decline in trust and investment management fees Trust & Investment Management Fees $8,586 $8,788 $8,228 $7,767 $15,427 Q2 2019 Q3 2019 Q4 2019 Q1 2020 Q2 2020 Trust and Investment Management Fees Net Gain on Mortgage Loans Bank Fees Risk Management and Insurance Fees Income on Company-Owned Life Insurance Net Gain on Sale of Securities/Assets (in thousands) (in thousands) |
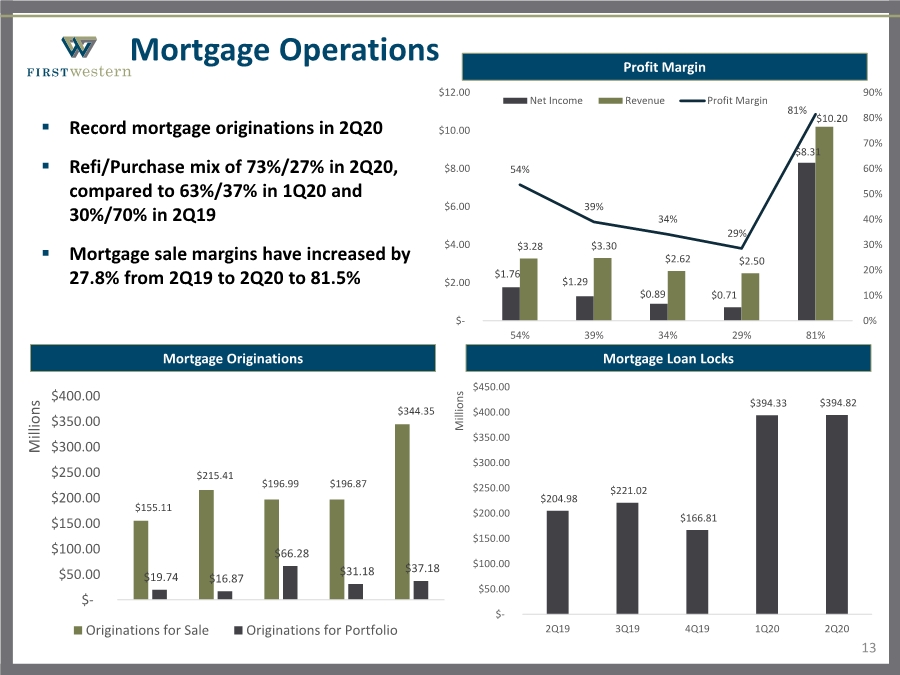
| Mortgage Operations 13 Mortgage Originations . Record mortgage originations in 2Q20 . Refi/Purchase mix of 73%/27% in 2Q20, compared to 63%/37% in 1Q20 and 30%/70% in 2Q19 . Mortgage sale margins have increased by 27.8% from 2Q19 to 2Q20 to 81.5% Mortgage Loan Locks Profit Margin $155.11 $215.41 $196.99 $196.87 $344.35 $19.74 $16.87 $66.28 $31.18 $37.18 $- $50.00 $100.00 $150.00 $200.00 $250.00 $300.00 $350.00 $400.00 Millions Originations for Sale Originations for Portfolio $1.76 $1.29 $0.89 $0.71 $8.31 $3.28 $3.30 $2.62 $2.50 $10.20 54% 39% 34% 29% 81% 0% 10% 20% 30% 40% 50% 60% 70% 80% 90% $- $2.00 $4.00 $6.00 $8.00 $10.00 $12.00 54% 39% 34% 29% 81% Millions Net Income Revenue Profit Margin $204.98 $221.02 $166.81 $394.33 $394.82 $- $50.00 $100.00 $150.00 $200.00 $250.00 $300.00 $350.00 $400.00 $450.00 2Q19 3Q19 4Q19 1Q20 2Q20 Millions |
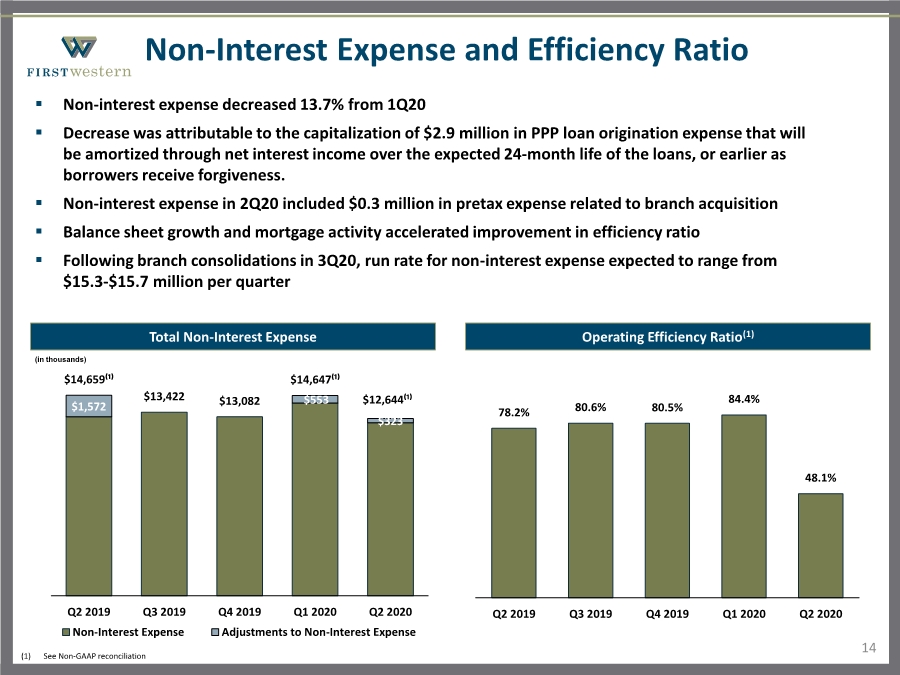
| Non-Interest Expense and Efficiency Ratio 14 Total Non-Interest Expense . Non-interest expense decreased 13.7% from 1Q20 . Decrease was attributable to the capitalization of $2.9 million in PPP loan origination expense that will be amortized through net interest income over the expected 24-month life of the loans, or earlier as borrowers receive forgiveness. . Non-interest expense in 2Q20 included $0.3 million in pretax expense related to branch acquisition . Balance sheet growth and mortgage activity accelerated improvement in efficiency ratio . Following branch consolidations in 3Q20, run rate for non-interest expense expected to range from $15.3-$15.7 million per quarter Operating Efficiency Ratio(1) 78.2% 80.6% 80.5% 84.4% 48.1% Q2 2019 Q3 2019 Q4 2019 Q1 2020 Q2 2020 $1,572 $553 $323 $14,659⁽¹⁾ $13,422 $13,082 $14,647⁽¹⁾ $12,644⁽¹⁾ Q2 2019 Q3 2019 Q4 2019 Q1 2020 Q2 2020 Non-Interest Expense Adjustments to Non-Interest Expense (in thousands) (1) See Non-GAAP reconciliation |
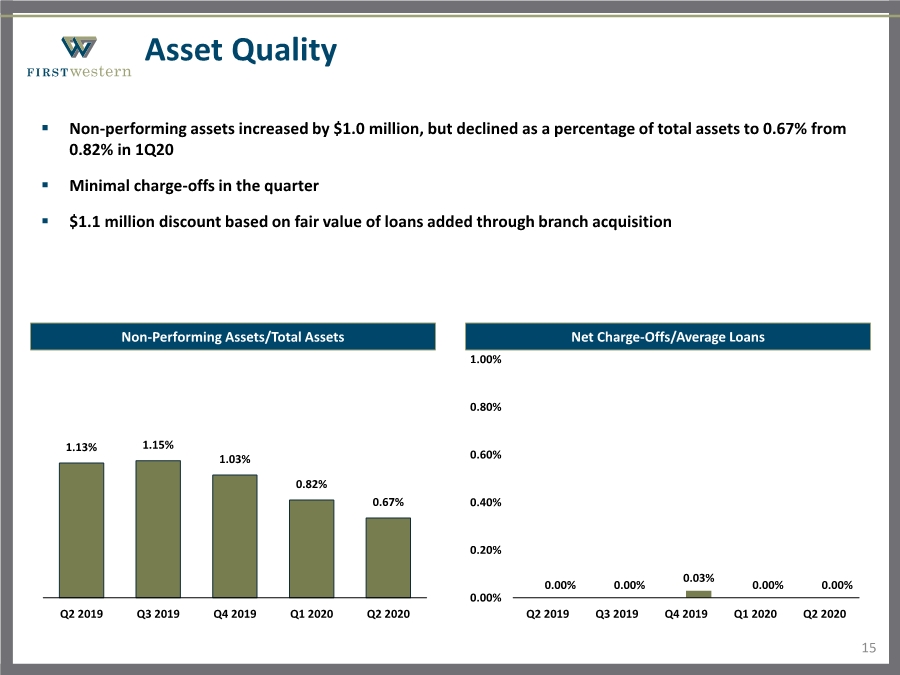
| Asset Quality 15 Non-Performing Assets/Total Assets . Non-performing assets increased by $1.0 million, but declined as a percentage of total assets to 0.67% from 0.82% in 1Q20 . Minimal charge-offs in the quarter . $1.1 million discount based on fair value of loans added through branch acquisition Net Charge-Offs/Average Loans 0.00% 0.00% 0.03% 0.00% 0.00% 0.00% 0.20% 0.40% 0.60% 0.80% 1.00% Q2 2019 Q3 2019 Q4 2019 Q1 2020 Q2 2020 1.13% 1.15% 1.03% 0.82% 0.67% Q2 2019 Q3 2019 Q4 2019 Q1 2020 Q2 2020 |
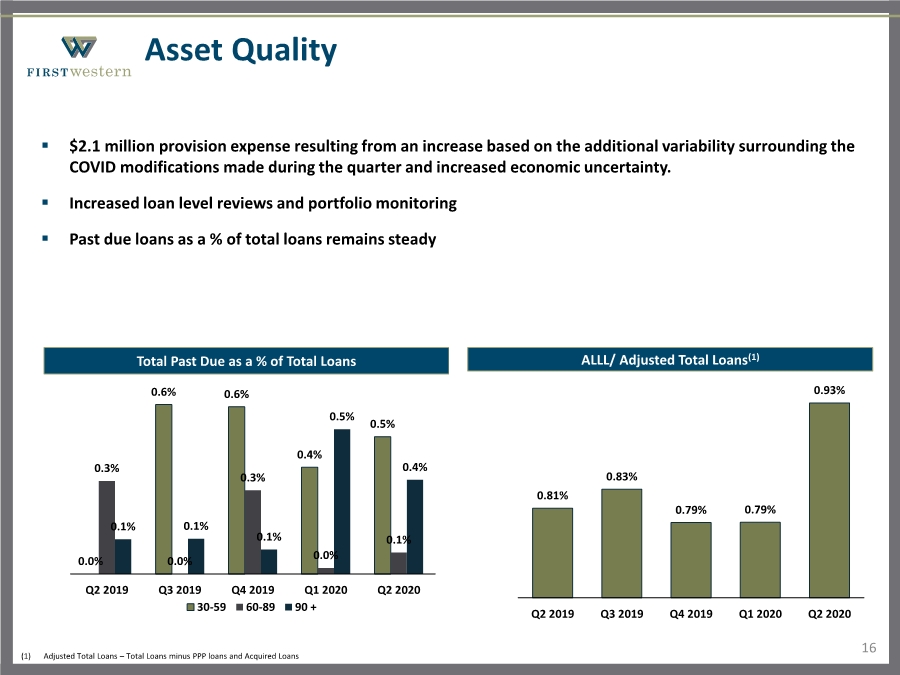
| Asset Quality 16 . $2.1 million provision expense resulting from an increase based on the additional variability surrounding the COVID modifications made during the quarter and increased economic uncertainty. . Increased loan level reviews and portfolio monitoring . Past due loans as a % of total loans remains steady ALLL/ Adjusted Total Loans(1) 0.81% 0.83% 0.79% 0.79% 0.93% Q2 2019 Q3 2019 Q4 2019 Q1 2020 Q2 2020 0.0% 0.6% 0.6% 0.4% 0.5% 0.3% 0.0% 0.3% 0.0% 0.1% 0.1% 0.1% 0.1% 0.5% 0.4% Q2 2019 Q3 2019 Q4 2019 Q1 2020 Q2 2020 30-59 60-89 90 + Total Past Due as a % of Total Loans (1) Adjusted Total Loans – Total Loans minus PPP loans and Acquired Loans |
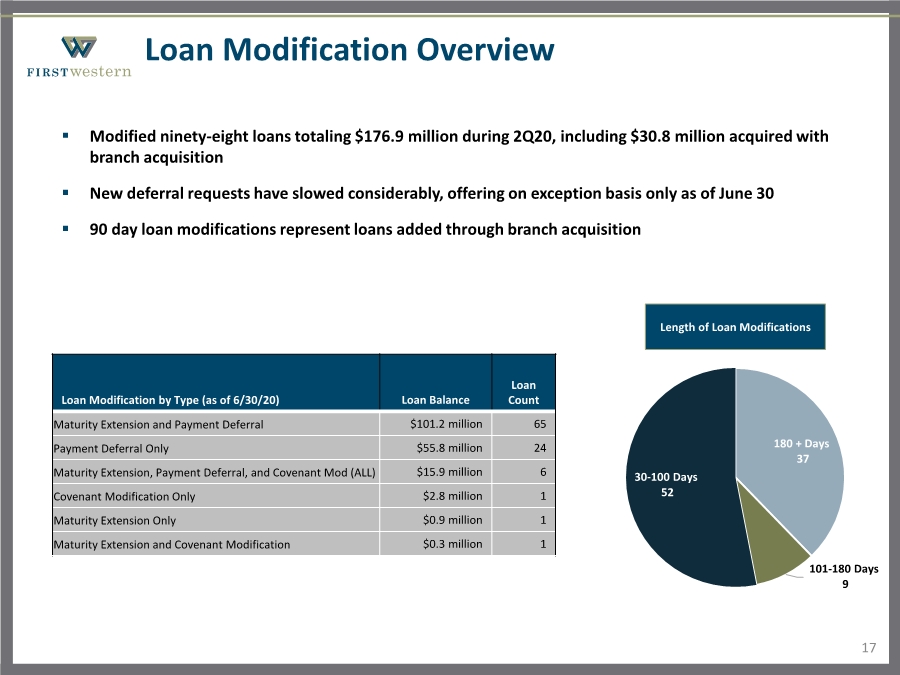
| Loan Modification Overview 17 . Modified ninety-eight loans totaling $176.9 million during 2Q20, including $30.8 million acquired with branch acquisition . New deferral requests have slowed considerably, offering on exception basis only as of June 30 . 90 day loan modifications represent loans added through branch acquisition 180 + Days 37 101-180 Days 9 30-100 Days 52 Length of Loan Modifications Loan Modification by Type (as of 6/30/20) Loan Balance Loan Count Maturity Extension and Payment Deferral $101.2 million 65 Payment Deferral Only $55.8 million 24 Maturity Extension, Payment Deferral, and Covenant Mod (ALL) $15.9 million 6 Covenant Modification Only $2.8 million 1 Maturity Extension Only $0.9 million 1 Maturity Extension and Covenant Modification $0.3 million 1 |
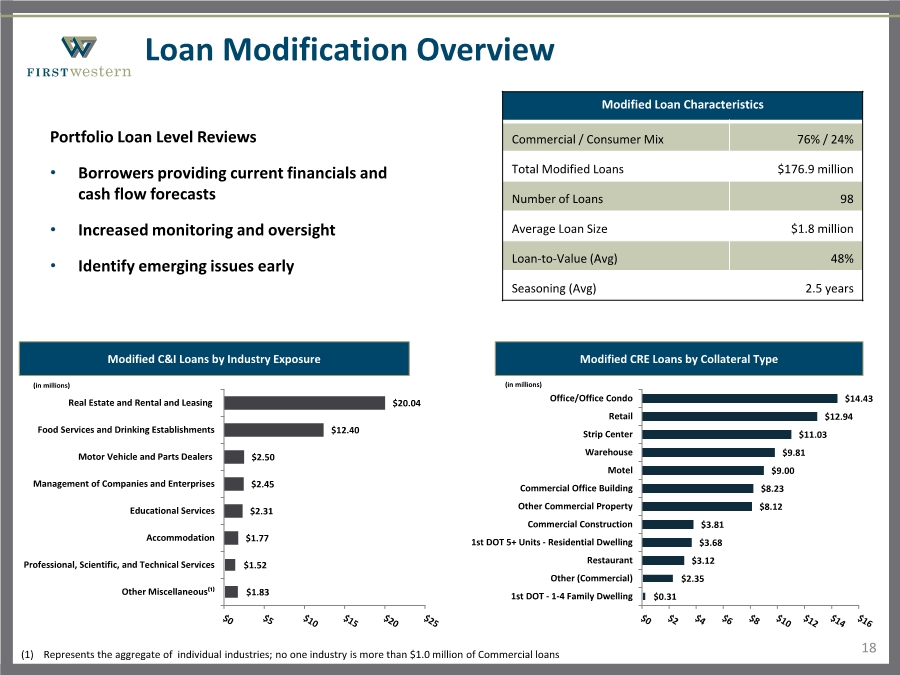
| Loan Modification Overview 18 Portfolio Loan Level Reviews • Borrowers providing current financials and cash flow forecasts • Increased monitoring and oversight • Identify emerging issues early $1.83 $1.52 $1.77 $2.31 $2.45 $2.50 $12.40 $20.04 Other Miscellaneous⁽¹⁾ Professional, Scientific, and Technical Services Accommodation Educational Services Management of Companies and Enterprises Motor Vehicle and Parts Dealers Food Services and Drinking Establishments Real Estate and Rental and Leasing Modified C&I Loans by Industry Exposure Modified Loan Characteristics Commercial / Consumer Mix 76% / 24% Total Modified Loans $176.9 million Number of Loans 98 Average Loan Size $1.8 million Loan-to-Value (Avg) 48% Seasoning (Avg) 2.5 years Modified CRE Loans by Collateral Type $0.31 $2.35 $3.12 $3.68 $3.81 $8.12 $8.23 $9.00 $9.81 $11.03 $12.94 $14.43 1st DOT - 1-4 Family Dwelling Other (Commercial) Restaurant 1st DOT 5+ Units - Residential Dwelling Commercial Construction Other Commercial Property Commercial Office Building Motel Warehouse Strip Center Retail Office/Office Condo (in millions) (in millions) (1) Represents the aggregate of individual industries; no one industry is more than $1.0 million of Commercial loans |
| Near-Term Outlook and Expectations 19 . Healthy loan pipeline should continue to drive organic loan growth in second half of 2020 . Strong mortgage originations continuing in 3Q20 . Net interest margin expected to expand as earning asset yields stabilize and deposit costs continue to decline . Positive trends in fee income resulting from higher AUM . Asset quality continues to show strength despite continuation of pandemic . Initial synergies realized from branch acquisition |
| Appendix |

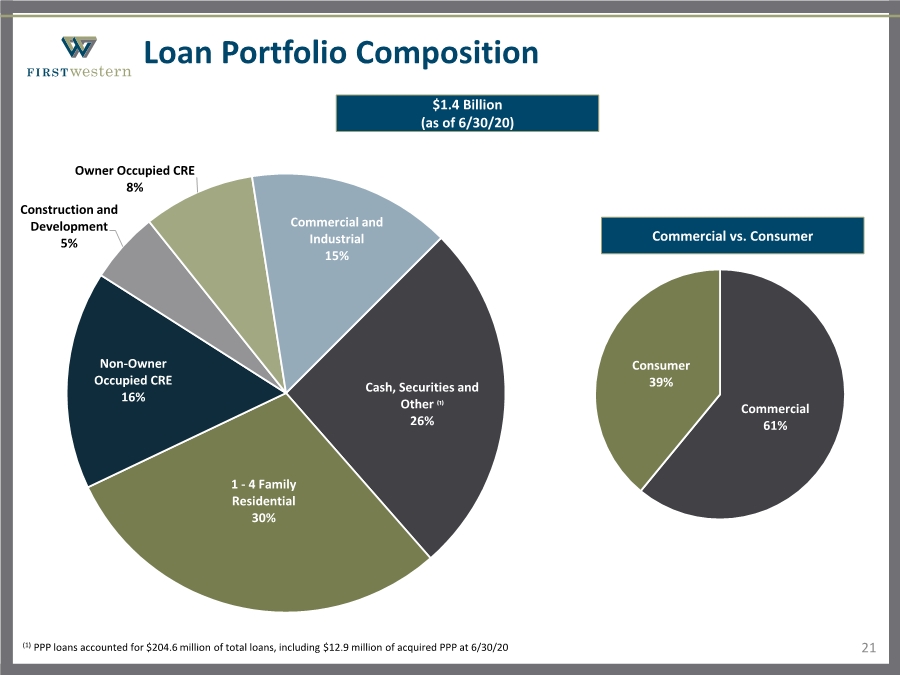
| Loan Portfolio Composition 21 Cash, Securities and Other ⁽¹⁾ 26% 1 - 4 Family Residential 30% Non-Owner Occupied CRE 16% Construction and Development 5% Owner Occupied CRE 8% Commercial and Industrial 15% Commercial 61% Consumer 39% $1.4 Billion (as of 6/30/20) Commercial vs. Consumer (1) PPP loans accounted for $204.6 million of total loans, including $12.9 million of acquired PPP at 6/30/20 |
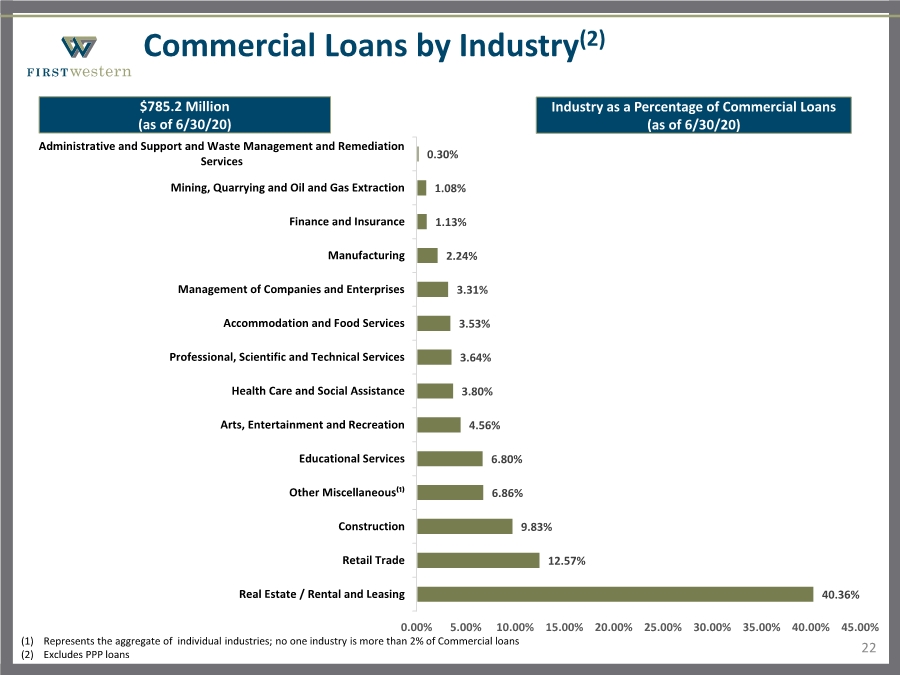
| Commercial Loans by Industry(2) 22 40.36% 12.57% 9.83% 6.86% 6.80% 4.56% 3.80% 3.64% 3.53% 3.31% 2.24% 1.13% 1.08% 0.30% Real Estate / Rental and Leasing Retail Trade Construction Other Miscellaneous⁽¹⁾ Educational Services Arts, Entertainment and Recreation Health Care and Social Assistance Professional, Scientific and Technical Services Accommodation and Food Services Management of Companies and Enterprises Manufacturing Finance and Insurance Mining, Quarrying and Oil and Gas Extraction Administrative and Support and Waste Management and Remediation Services 0.00% 5.00% 10.00% 15.00% 20.00% 25.00% 30.00% 35.00% 40.00% 45.00% $785.2 Million (as of 6/30/20) Industry as a Percentage of Commercial Loans (as of 6/30/20) (1) Represents the aggregate of individual industries; no one industry is more than 2% of Commercial loans (2) Excludes PPP loans |
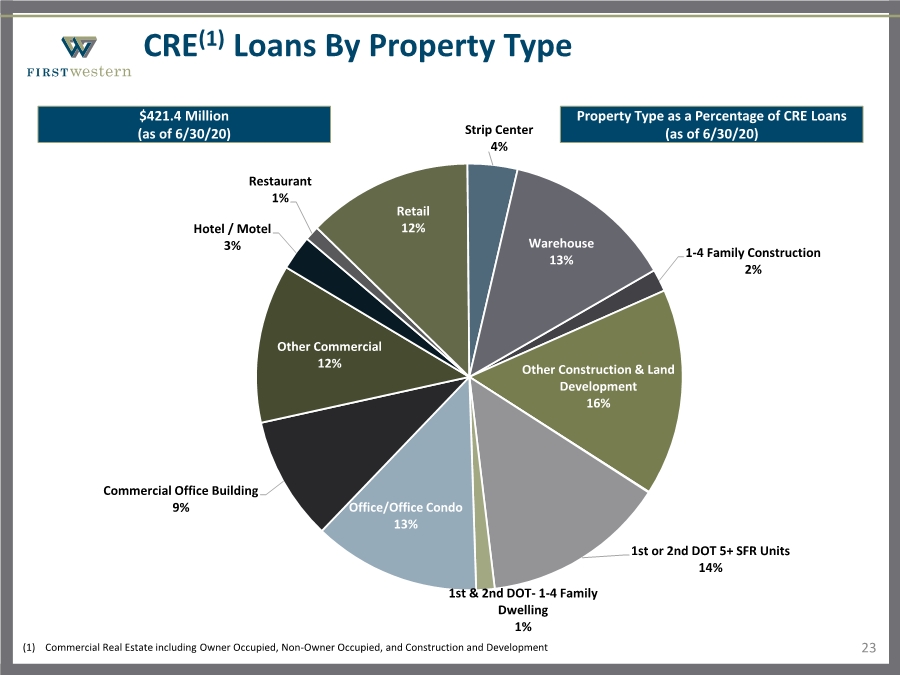
| CRE(1) Loans By Property Type 23 1-4 Family Construction 2% Other Construction & Land Development 16% 1st or 2nd DOT 5+ SFR Units 14% 1st & 2nd DOT- 1-4 Family Dwelling 1% Office/Office Condo 13% Commercial Office Building 9% Other Commercial 12% Hotel / Motel 3% Restaurant 1% Retail 12% Strip Center 4% Warehouse 13% (1) Commercial Real Estate including Owner Occupied, Non-Owner Occupied, and Construction and Development $421.4 Million (as of 6/30/20) Property Type as a Percentage of CRE Loans (as of 6/30/20) |
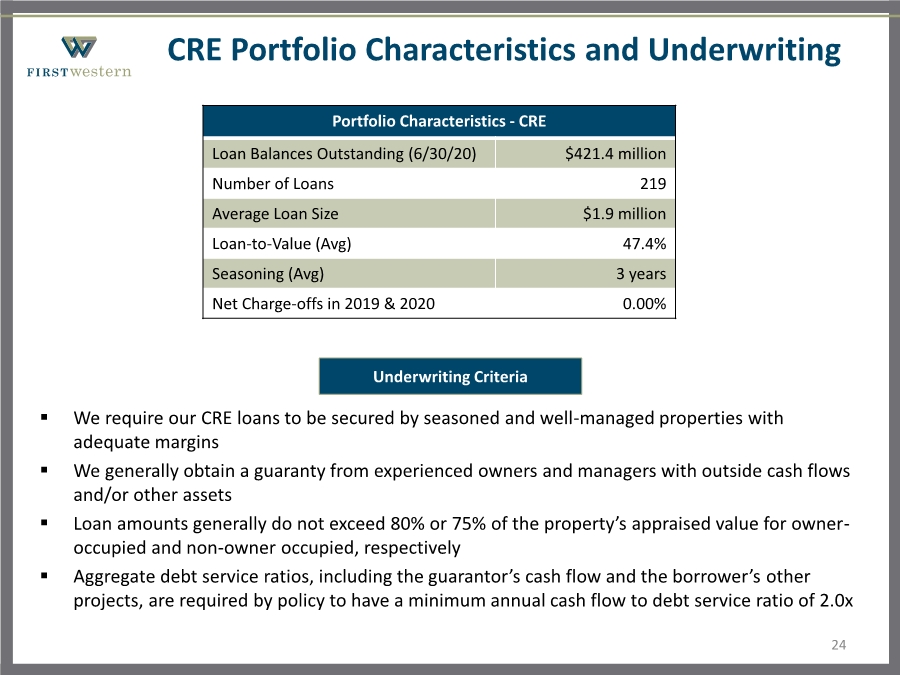
| . We require our CRE loans to be secured by seasoned and well-managed properties with adequate margins . We generally obtain a guaranty from experienced owners and managers with outside cash flows and/or other assets . Loan amounts generally do not exceed 80% or 75% of the property’s appraised value for owner- occupied and non-owner occupied, respectively . Aggregate debt service ratios, including the guarantor’s cash flow and the borrower’s other projects, are required by policy to have a minimum annual cash flow to debt service ratio of 2.0x CRE Portfolio Characteristics and Underwriting 24 Portfolio Characteristics - CRE Loan Balances Outstanding (6/30/20) $421.4 million Number of Loans 219 Average Loan Size $1.9 million Loan-to-Value (Avg) 47.4% Seasoning (Avg) 3 years Net Charge-offs in 2019 & 2020 0.00% Underwriting Criteria |
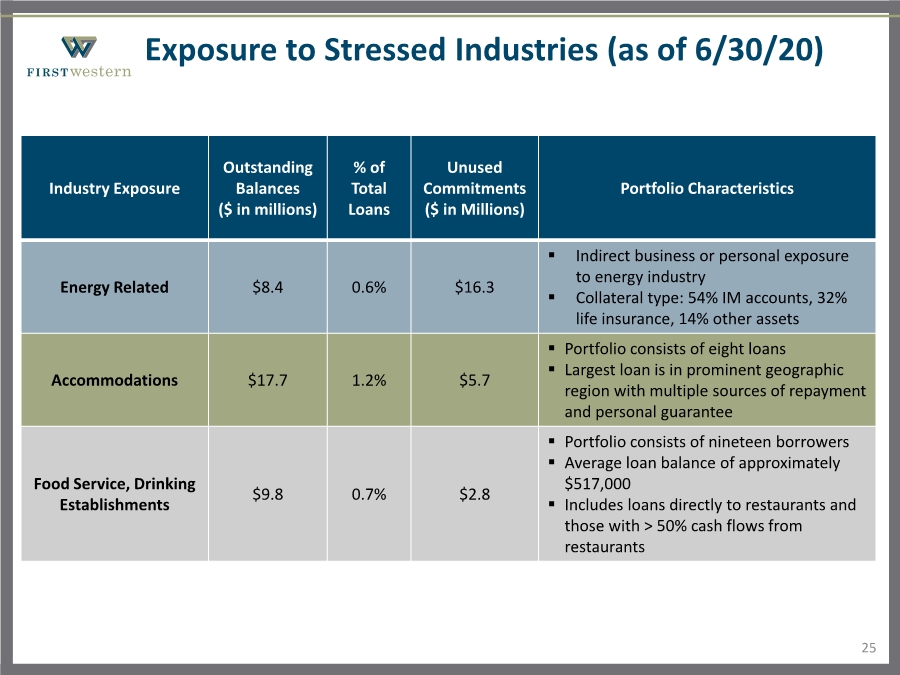
| Exposure to Stressed Industries (as of 6/30/20) 25 Industry Exposure Outstanding Balances ($ in millions) % of Total Loans Unused Commitments ($ in Millions) Portfolio Characteristics Energy Related $8.4 0.6% $16.3 . Indirect business or personal exposure to energy industry . Collateral type: 54% IM accounts, 32% life insurance, 14% other assets Accommodations $17.7 1.2% $5.7 . Portfolio consists of eight loans . Largest loan is in prominent geographic region with multiple sources of repayment and personal guarantee Food Service, Drinking Establishments $9.8 0.7% $2.8 . Portfolio consists of nineteen borrowers . Average loan balance of approximately $517,000 . Includes loans directly to restaurants and those with > 50% cash flows from restaurants |
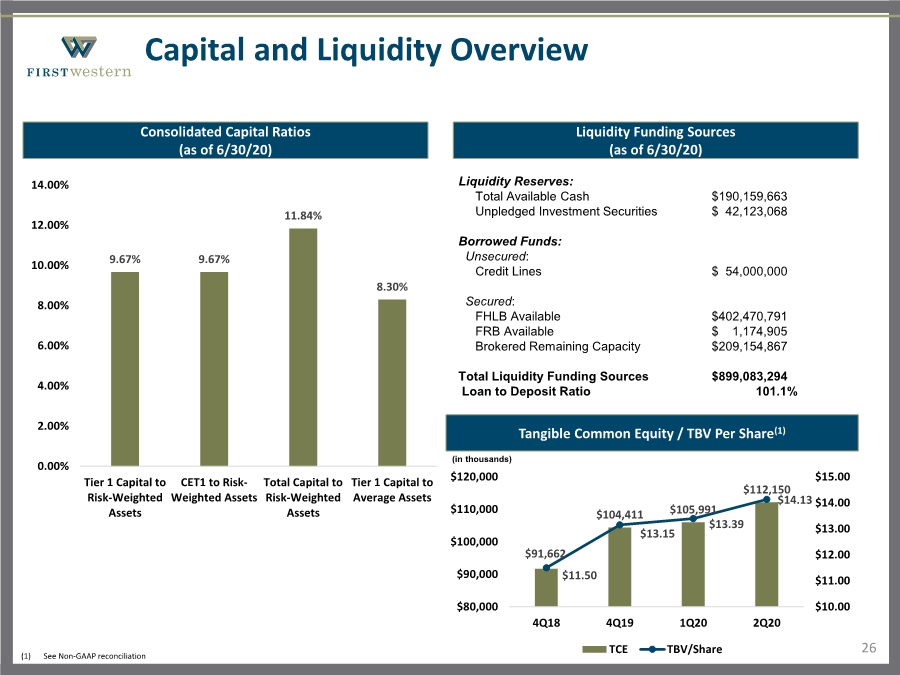
| Capital and Liquidity Overview 26 Liquidity Funding Sources (as of 6/30/20) Liquidity Reserves: Total Available Cash $190,159,663 Unpledged Investment Securities $ 42,123,068 Borrowed Funds: Unsecured: Credit Lines $ 54,000,000 Secured: FHLB Available $402,470,791 FRB Available $ 1,174,905 Brokered Remaining Capacity $209,154,867 Total Liquidity Funding Sources $899,083,294 Loan to Deposit Ratio 101.1% Consolidated Capital Ratios (as of 6/30/20) 9.67% 9.67% 11.84% 8.30% 0.00% 2.00% 4.00% 6.00% 8.00% 10.00% 12.00% 14.00% Tier 1 Capital to Risk-Weighted Assets CET1 to Risk- Weighted Assets Total Capital to Risk-Weighted Assets Tier 1 Capital to Average Assets Tangible Common Equity / TBV Per Share(1) (in thousands) $91,662 $104,411 $105,991 $112,150 $11.50 $13.15 $13.39 $14.13 $10.00 $11.00 $12.00 $13.00 $14.00 $15.00 $80,000 $90,000 $100,000 $110,000 $120,000 4Q18 4Q19 1Q20 2Q20 TCE TBV/Share (1) See Non-GAAP reconciliation |
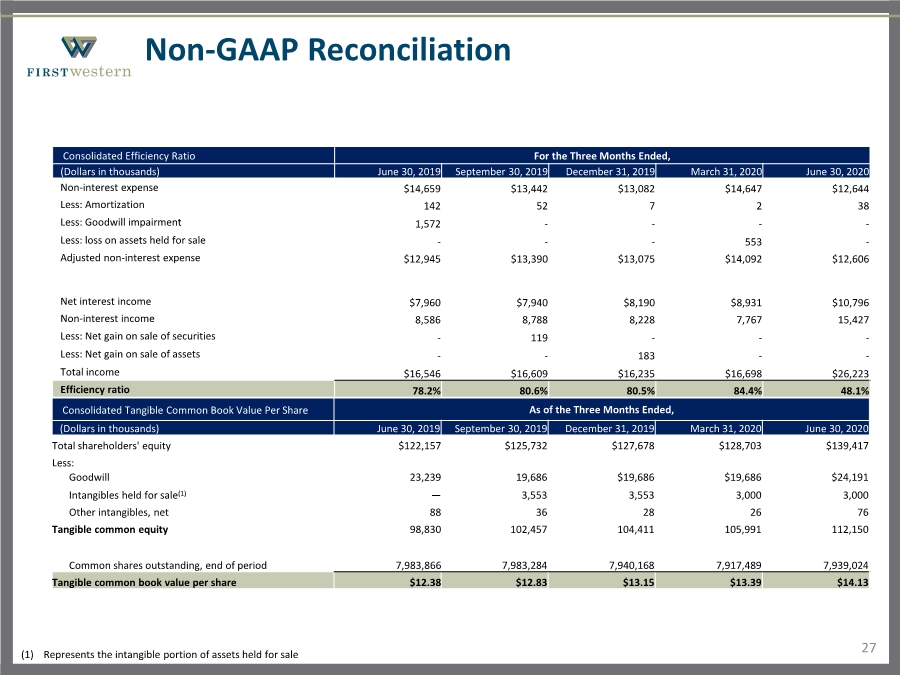
| 27 Non-GAAP Reconciliation Consolidated Efficiency Ratio For the Three Months Ended, (Dollars in thousands) June 30, 2019 September 30, 2019 December 31, 2019 March 31, 2020 June 30, 2020 Non-interest expense $14,659 $13,442 $13,082 $14,647 $12,644 Less: Amortization 142 52 7 2 38 Less: Goodwill impairment 1,572 ---- Less: loss on assets held for sale --- 553 - Adjusted non-interest expense $12,945 $13,390 $13,075 $14,092 $12,606 Net interest income $7,960 $7,940 $8,190 $8,931 $10,796 Non-interest income 8,586 8,788 8,228 7,767 15,427 Less: Net gain on sale of securities - 119 --- Less: Net gain on sale of assets -- 183 -- Total income $16,546 $16,609 $16,235 $16,698 $26,223 Efficiency ratio 78.2% 80.6% 80.5% 84.4% 48.1% Consolidated Tangible Common Book Value Per Share As of the Three Months Ended, (Dollars in thousands) June 30, 2019 September 30, 2019 December 31, 2019 March 31, 2020 June 30, 2020 Total shareholders' equity $122,157 $125,732 $127,678 $128,703 $139,417 Less: Goodwill 23,239 19,686 $19,686 $19,686 $24,191 Intangibles held for sale(1) — 3,553 3,553 3,000 3,000 Other intangibles, net 88 36 28 26 76 Tangible common equity 98,830 102,457 104,411 105,991 112,150 Common shares outstanding, end of period 7,983,866 7,983,284 7,940,168 7,917,489 7,939,024 Tangible common book value per share $12.38 $12.83 $13.15 $13.39 $14.13 (1) Represents the intangible portion of assets held for sale |
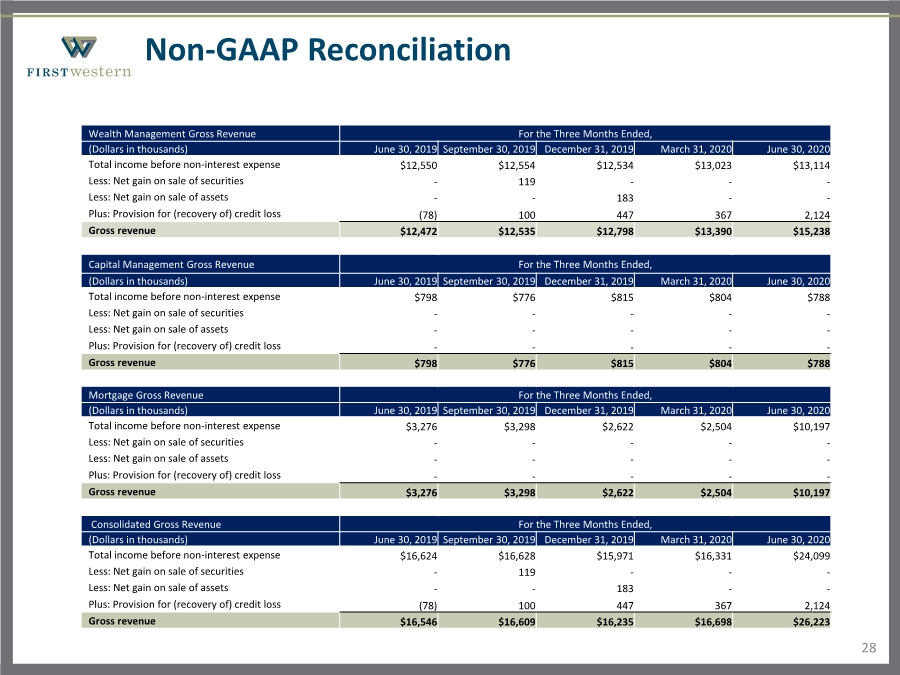
| 28 Non-GAAP Reconciliation Wealth Management Gross Revenue For the Three Months Ended, (Dollars in thousands) June 30, 2019 September 30, 2019 December 31, 2019 March 31, 2020 June 30, 2020 Total income before non-interest expense $12,550 $12,554 $12,534 $13,023 $13,114 Less: Net gain on sale of securities - 119 --- Less: Net gain on sale of assets -- 183 -- Plus: Provision for (recovery of) credit loss (78) 100 447 367 2,124 Gross revenue $12,472 $12,535 $12,798 $13,390 $15,238 Capital Management Gross Revenue For the Three Months Ended, (Dollars in thousands) June 30, 2019 September 30, 2019 December 31, 2019 March 31, 2020 June 30, 2020 Total income before non-interest expense $798 $776 $815 $804 $788 Less: Net gain on sale of securities ----- Less: Net gain on sale of assets ----- Plus: Provision for (recovery of) credit loss ----- Gross revenue $798 $776 $815 $804 $788 Mortgage Gross Revenue For the Three Months Ended, (Dollars in thousands) June 30, 2019 September 30, 2019 December 31, 2019 March 31, 2020 June 30, 2020 Total income before non-interest expense $3,276 $3,298 $2,622 $2,504 $10,197 Less: Net gain on sale of securities ----- Less: Net gain on sale of assets ----- Plus: Provision for (recovery of) credit loss ----- Gross revenue $3,276 $3,298 $2,622 $2,504 $10,197 Consolidated Gross Revenue For the Three Months Ended, (Dollars in thousands) June 30, 2019 September 30, 2019 December 31, 2019 March 31, 2020 June 30, 2020 Total income before non-interest expense $16,624 $16,628 $15,971 $16,331 $24,099 Less: Net gain on sale of securities - 119 --- Less: Net gain on sale of assets -- 183 -- Plus: Provision for (recovery of) credit loss (78) 100 447 367 2,124 Gross revenue $16,546 $16,609 $16,235 $16,698 $26,223 |
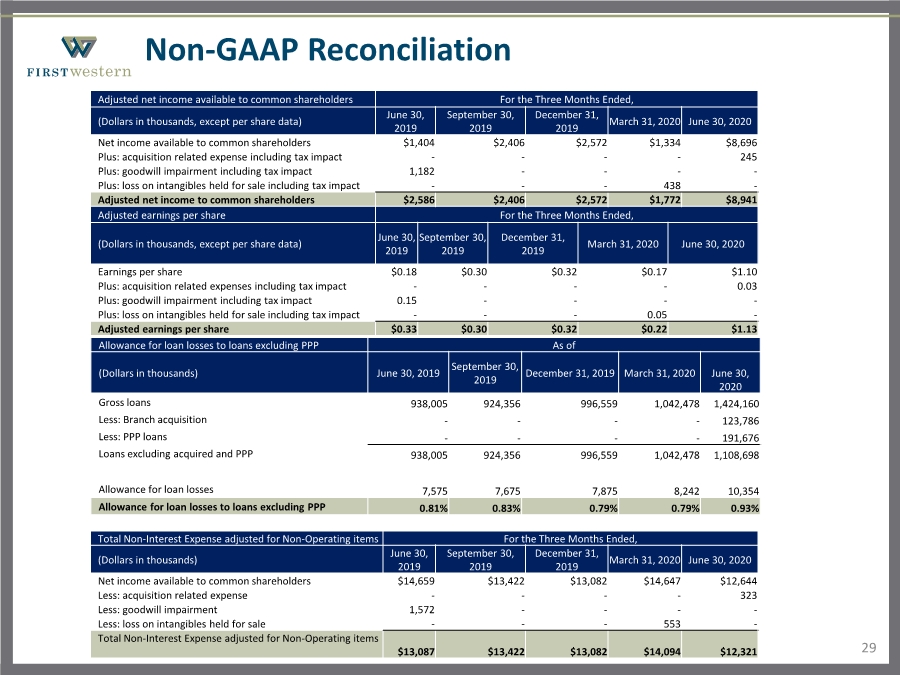
| 29 Non-GAAP Reconciliation Adjusted net income available to common shareholders For the Three Months Ended, (Dollars in thousands, except per share data) June 30, 2019 September 30, 2019 December 31, 2019 March 31, 2020 June 30, 2020 Net income available to common shareholders $1,404 $2,406 $2,572 $1,334 $8,696 Plus: acquisition related expense including tax impact ---- 245 Plus: goodwill impairment including tax impact 1,182 ---- Plus: loss on intangibles held for sale including tax impact --- 438 - Adjusted net income to common shareholders $2,586 $2,406 $2,572 $1,772 $8,941 Adjusted earnings per share For the Three Months Ended, (Dollars in thousands, except per share data) June 30, 2019 September 30, 2019 December 31, 2019 March 31, 2020 June 30, 2020 Earnings per share $0.18 $0.30 $0.32 $0.17 $1.10 Plus: acquisition related expenses including tax impact ---- 0.03 Plus: goodwill impairment including tax impact 0.15 ---- Plus: loss on intangibles held for sale including tax impact --- 0.05 - Adjusted earnings per share $0.33 $0.30 $0.32 $0.22 $1.13 Allowance for loan losses to loans excluding PPP As of (Dollars in thousands) June 30, 2019 September 30, 2019 December 31, 2019 March 31, 2020 June 30, 2020 Gross loans 938,005 924,356 996,559 1,042,478 1,424,160 Less: Branch acquisition ---- 123,786 Less: PPP loans ---- 191,676 Loans excluding acquired and PPP 938,005 924,356 996,559 1,042,478 1,108,698 Allowance for loan losses 7,575 7,675 7,875 8,242 10,354 Allowance for loan losses to loans excluding PPP 0.81% 0.83% 0.79% 0.79% 0.93% Total Non-Interest Expense adjusted for Non-Operating items For the Three Months Ended, (Dollars in thousands) June 30, 2019 September 30, 2019 December 31, 2019 March 31, 2020 June 30, 2020 Net income available to common shareholders $14,659 $13,422 $13,082 $14,647 $12,644 Less: acquisition related expense ---- 323 Less: goodwill impairment 1,572 ---- Less: loss on intangibles held for sale --- 553 - Total Non-Interest Expense adjusted for Non-Operating items $13,087 $13,422 $13,082 $14,094 $12,321 |
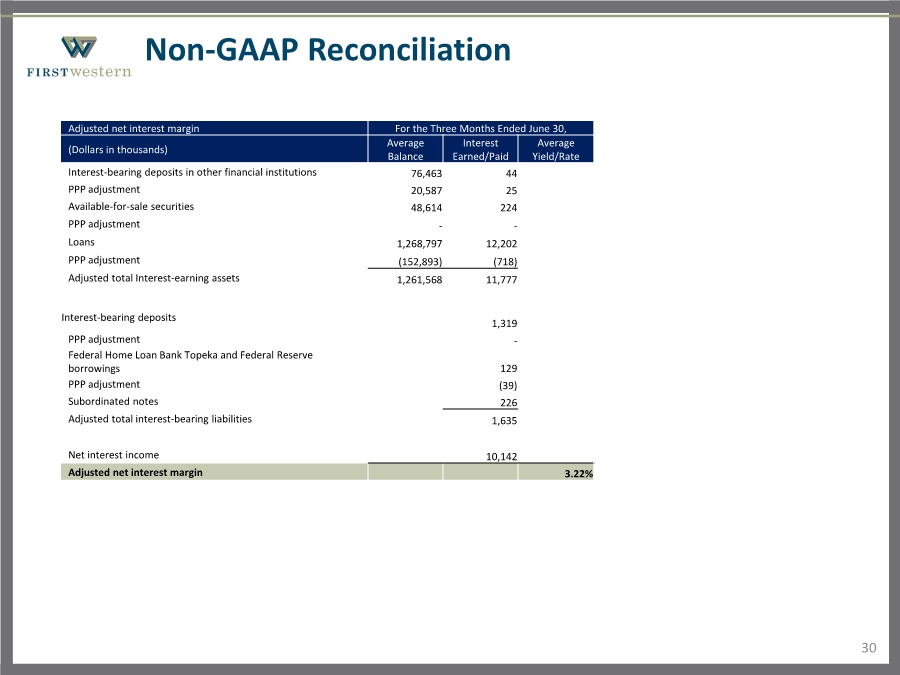
| 30 Non-GAAP Reconciliation Adjusted net interest margin For the Three Months Ended June 30, (Dollars in thousands) Average Balance Interest Earned/Paid Average Yield/Rate Interest-bearing deposits in other financial institutions 76,463 44 PPP adjustment 20,587 25 Available-for-sale securities 48,614 224 PPP adjustment -- Loans 1,268,797 12,202 PPP adjustment (152,893) (718) Adjusted total Interest-earning assets 1,261,568 11,777 Interest-bearing deposits 1,319 PPP adjustment - Federal Home Loan Bank Topeka and Federal Reserve borrowings 129 PPP adjustment (39) Subordinated notes 226 Adjusted total interest-bearing liabilities 1,635 Net interest income 10,142 Adjusted net interest margin 3.22% |