Attached files
| file | filename |
|---|---|
| 8-K - 8-K - First Foundation Inc. | ffwm-20200723x8k.htm |
Exhibit 99.1
| ● ● |
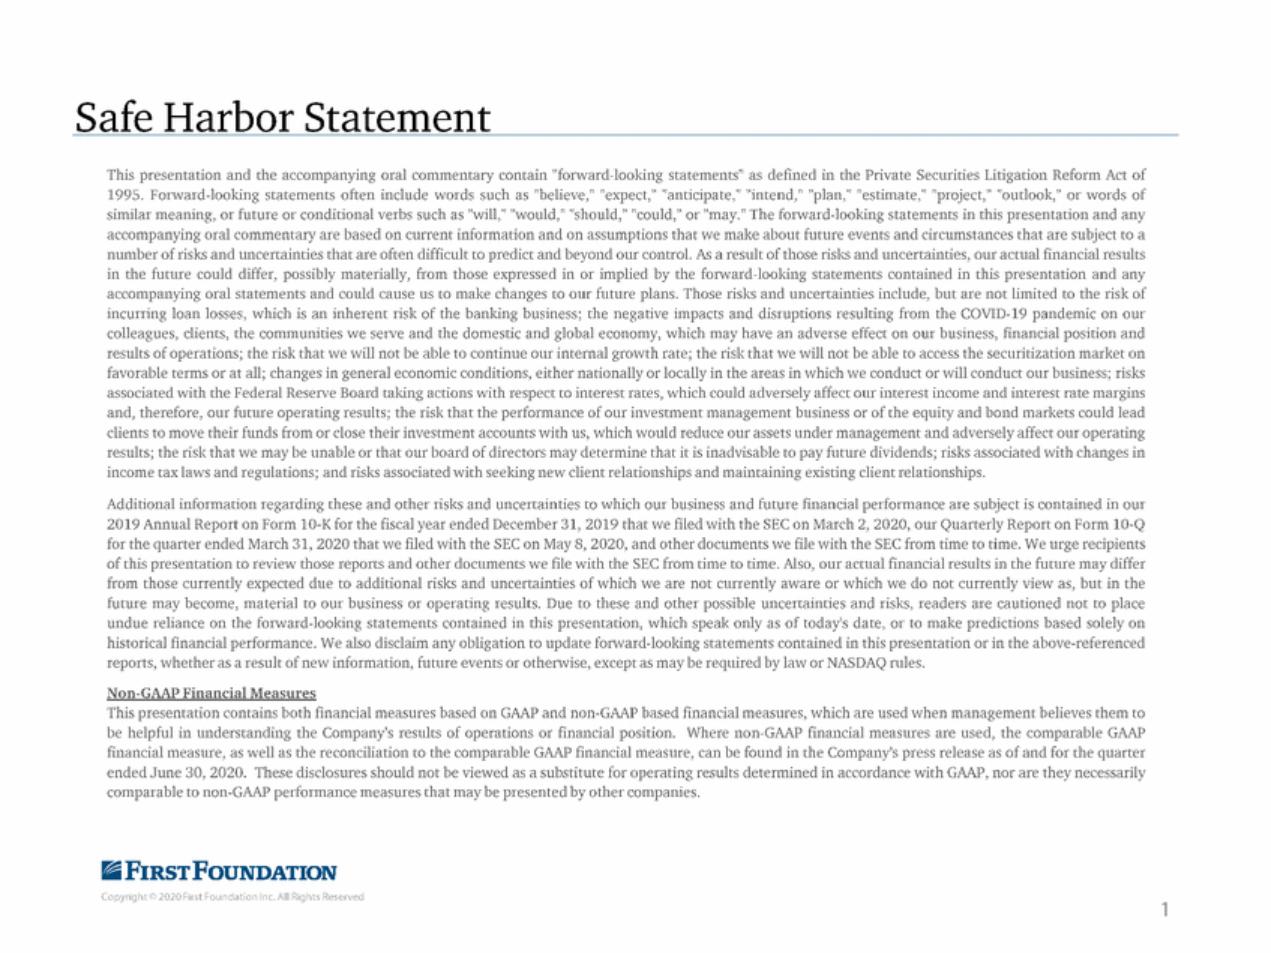
| Safe Harbor Statement This presentation and the accompanying oral commentary contain ''forward-looking statements" as defined in the Private Securities Litigation Reform Act of 1995. Forward-looking statements often include words such as "believe," "expect," ''anticipate,'' "intend," "plan,'' "estimate,'' "project," ''outlook," or words of similar meaning, or future or conditional verbs such as "will,'' "would," ''should," "could," or "may." The forward-looking statements in this presentation and any accompanying oral commentary are based on current information and on assumptions that we make about future events and circumstances that are subject to a number of risks and uncertainties that are often difficult to predict and beyond our control. Ail a result of those risks and uncertainties, our actual financial results in the future could differ, possibly materially, from those expressed in or implied by the forward-looking statements contained in this presentation and any accompanying oral statements and could cause us to make changes to our future plans. Those risks and uncertainties include, but are not limited to the risk of incurring loan losses, which is an inherent risk of the banking business; the negative impacts and disruptions resulting from the COVID-19 pandemic on our colleagues, clients, the communities we serve and the domestic and global economy, which may have an adverse effect on our business, financial position and results of operations; the risk that we will not be able to continue our internal growth rate; the risk that we will not be able to access the securitization market on favorable terms or at all; changes in general economic conditions, either nationally or locally in the areas in which we conduct or will conduct our business; risks associated with the Federal Reserve Board taking actions with respect to interest rates, which could adversely affect our interest income and interest rate margins and, therefore, our future operating results; the risk that the performance of our investment management business or of the equity and bond markets could lead clients to move their funds from or close their investment accounts with us, which would reduce our assets under management and adversely affect our operating results; the risk that we may be unable or that our board of directors may determine that it is inadvisable to pay future dividends; risks associated with changes in income tax laws and regulations; and risks associated with seeking new client relationships and maintaining existing client relationships. Additional information regarding these and other risks and uncertainties to which our business and future financial performance are subject is contained in our 2019 Annual Report on Form 10-K for the fiscal year ended December 31, 2019 that we filed with the SEC on March 2, 2020, our Quarterly Report on Form 10-Q for the quarter ended March 31, 2020 that we filed with the SEC on May 8, 2020, and other documents we file with the SEC from time to time. We urge recipients of this presentation to review those reports and other documents we file with the SEC from time to time. Also, our actual financial results in the future may differ from those currently expected due to additional risks and uncertainties of which we are not currently aware or which we do not currently view as, but in the future may become, material to our business or operating results. Due to these and other possible uncertainties and risks, readers are cautioned not to place undue reliance on the forward-looking statements contained in this presentation, which speak only as of today's date, or to make predictions based solely on historical financial performance. We also disclaim any obligation to update forward-looking statements contained in this presentation or in the above-referenced reports, whether as a result of new information, future events or otherwise, except as may be required by law or NASDAQ rules. Non-GAAP Financial Measures This presentation contains both financial measures based on GAAP and non-GAAP based financial measures, which are used when management believes them to be helpful in understanding the Company's results of operations or financial position. Where non-GAAP financial measures are used, the comparable GAAP financial measure, as well as the reconciliation to the comparable GAAP financial measure, can be found in the Company's press release as of and for the quarter ended June 30, 2020. These disclosures should not be viewed as a substitute for operating results determined in accordance with GAAP, nor are they necessarily comparable to non-GAAP performance measures that may be presented by other companies. IiiFIRsTFouNDATION Copyright© 2020First Foundation Inc. All Rights Reserved |
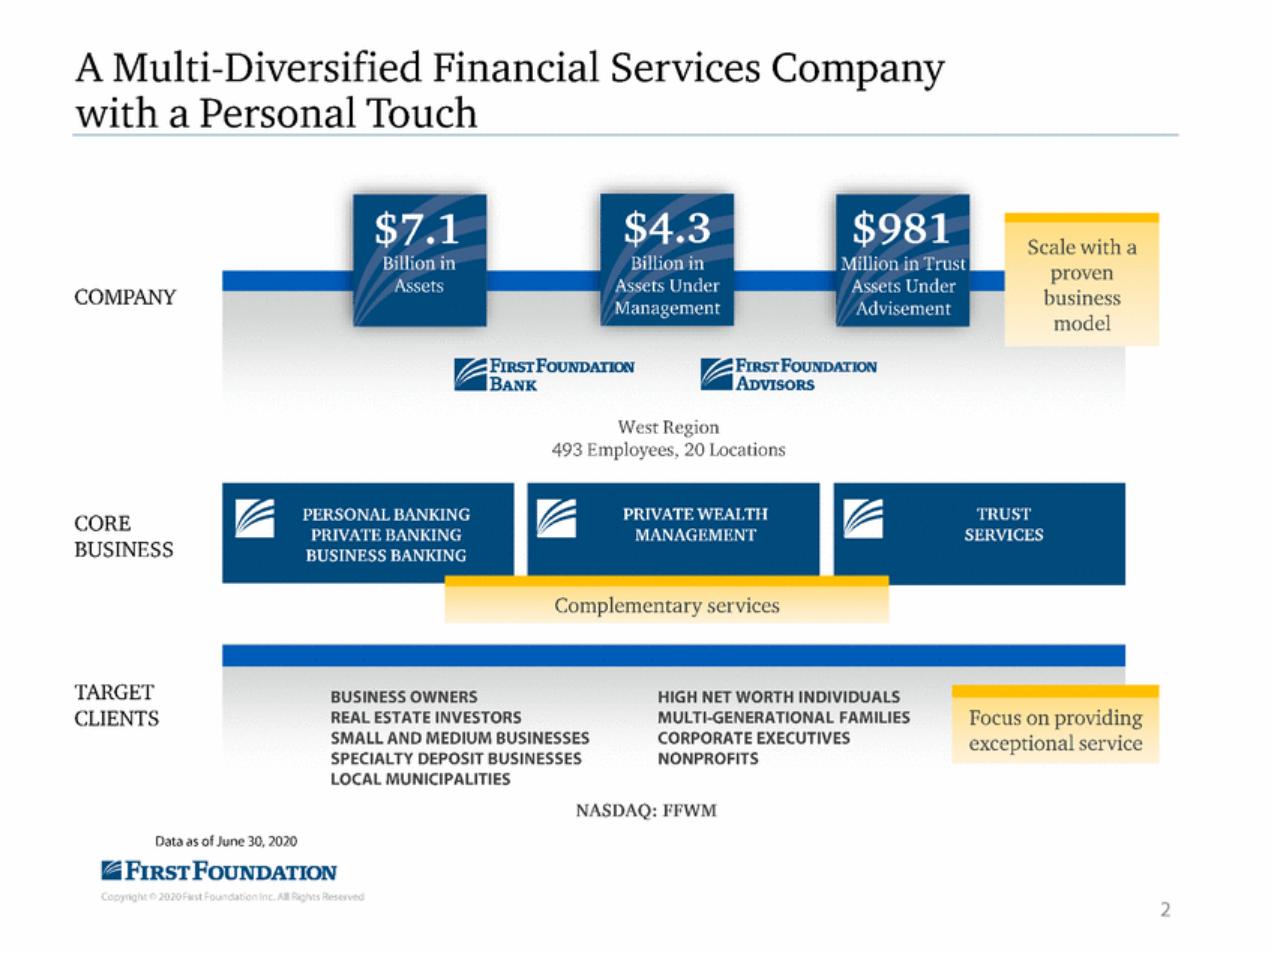
| A Multi-Diversified Financial Services Company with a Personal Touch Scale with a proven business model COMPANY FIRSTfOUNDATION -BANK FIRSTFOUNDATION •ADvisoRS West Region 493 Employees, 20 Locations CORE BUSINESS MANAGEMENT Complementary services TARGET CLIENTS BUSINESS OWNERS REAL ESTATE INVESTORS SMALL AND MEDIUM BUSINESSES SPECIALTY DEPOSIT BUSINESSES LOCAL MUNICIPALITIES HIGH NET WORTH INDIVIDUALS MULTI-GENERATIONAL FAMILIES CORPORATE EXECUTIVES NONPROFITS Focus on providing exceptional service NASDAQ: FFWM Data as of June 30,2020 IiiFIRsTFouNDATION Copyright© 2020First Foundation Inc. All Rights Reserved 2 - PRIVATE WEALTH |
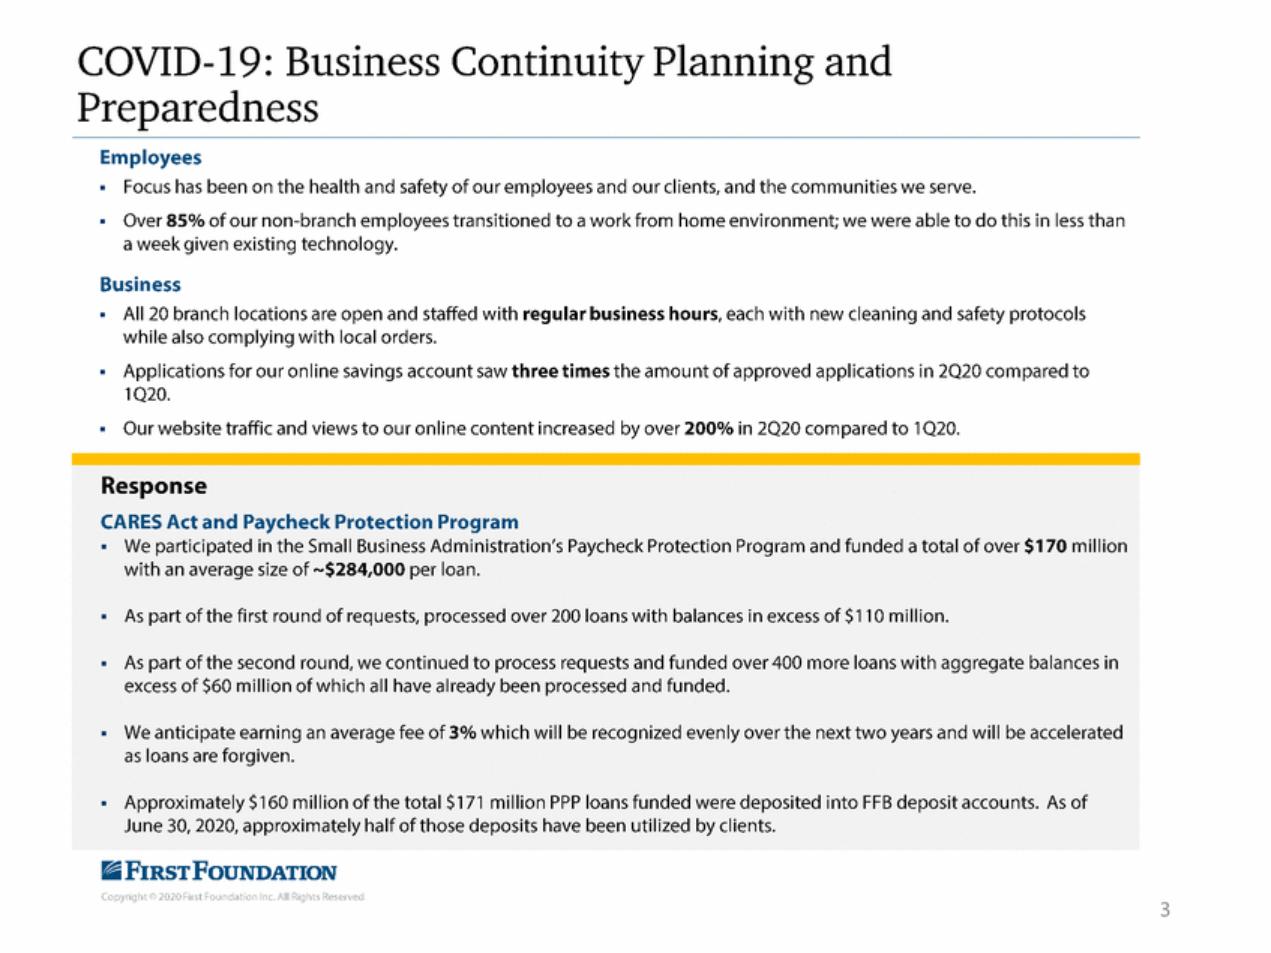
| COVID-19: Business Continuity Planning and Preparedness Employees • Focus has been on the health and safety of our employees and our clients, and the communities we serve. • Over 85% of our non-branch employees transitioned to a work from home environment;we were able to do this in less than a week given existing technology. Business • All 20 branch locations are open and staffed with regular business hours, each with new cleaning and safety protocols while also complying with local orders. Applications for our online savings account saw three times the amount of approved applications in 2020 compared to 1020. Our website traffic and views to our online content increased by over 200% in 2020 compared to 1Q20. • • Response CARES Act and Paycheck Protection Program • We participated in the Small Business Administration's Paycheck Protection Program and funded a total of over $170 million with an average size of $284,000 per loan. • As part of the first round of requests,processed over 200 loans with balances in excess of $110 million. • As part of the second round,we continued to process requests and funded over400 more loans with aggregate balances in excess of $60 million of which all have already been processed and funded. • We anticipate earning an average fee of 3% which will be recognized evenly over the next two years and will be accelerated as loans are forgiven. Approximately S 160 million of the total $171 million PPP loans funded were deposited into FFB deposit accounts. As of June 30,2020, approximately half of those deposits have been utilized by clients. • IiiFIRsTFouNDATION Copyright© 2020First Foundation Inc. All Rights Reserved 3 |
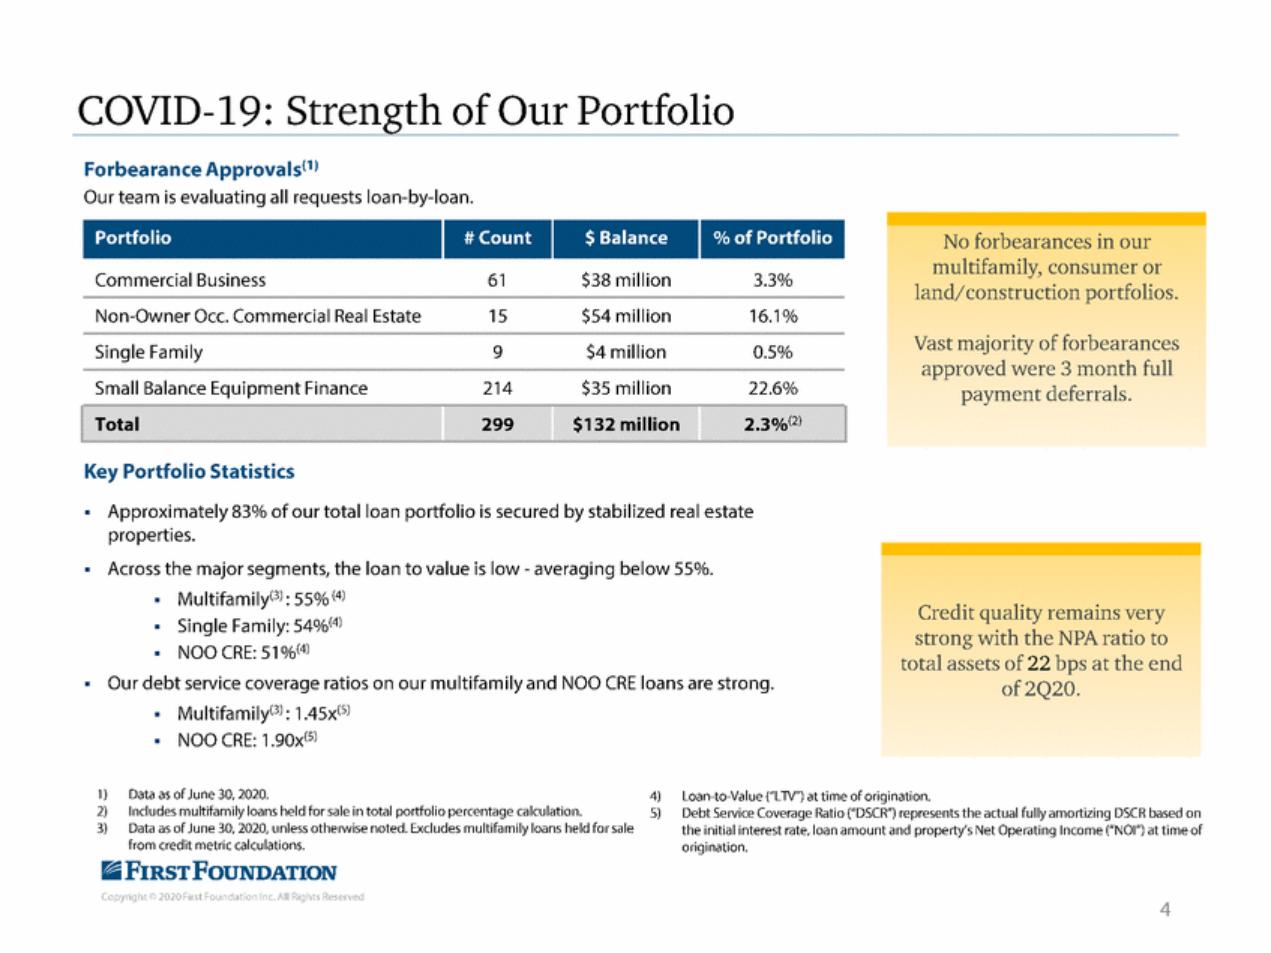
| COVID-19: Strength of Our Portfolio Forbearance Approvals!1l Our team is evaluating all requests loan-by-loan. Commercial Business 61 $38 million 3.3% $54 million Non-Owner Occ. Commercial Real Estate 15 16.1% Vast majority of forbearances approved were 3 month full payment deferrals. Single Family 9 $4 million 0.5% Small Balance Equipment Finance 214 $35 million 22.6% 2.3%(2) Total 299 $132 million Key Portfolio Statistics • Approximately 83% of our total loan portfolio is secured by stabilized real estate properties. Across the major segments,the loan to value is low-averaging below 55%. • Multifamily(3J : 55%(4J • Single Family: 540fo(4l • NOO CRE:51Ofo(4J Our debt service coverage ratios on our multifamily and NOO CRE loans are strong. • Multifamily(3l:1.4Sx(5l • NOO CRE:1.9ox<sJ • strong with the NPA ratio to total assets of 22 bps at the end of2Q20. • 1) 2) 3) Data as of June 30,2020. Includes multifamily loans held for sale in total portfolio percentage calculation. Data as of June 30,2020,unless otherwise noted.Excludes multifamily loans held for sale from credit metric calculations. 4) S) Loan-to-Value ("LlV") at time of origination. Debt Service Coverage Ratio ("DSCR") represents the actual fully amortizing DSCR based on the initial interest rate,loan amount and property's Net Operating Income ("NOI") at time of origination. IiiFIRsTFouNDATION Copyright© 2020First Foundation Inc. All Rights Reserved 4 Credit quality remains very $Balance % of Portfolio Portfolio No forbearances in our multifamily, consumer or land/construction portfolios. |
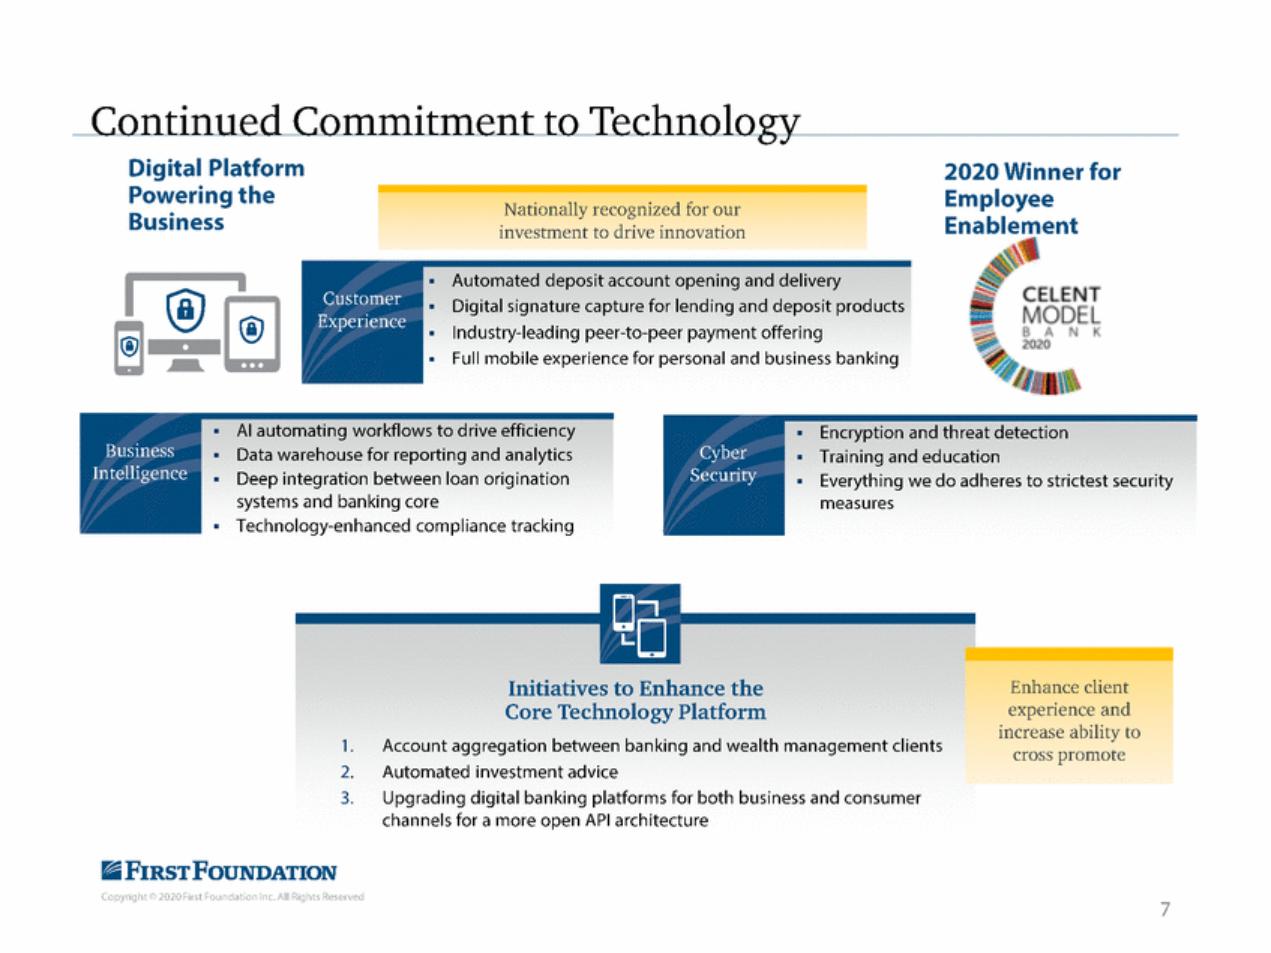
| |
| |
| |
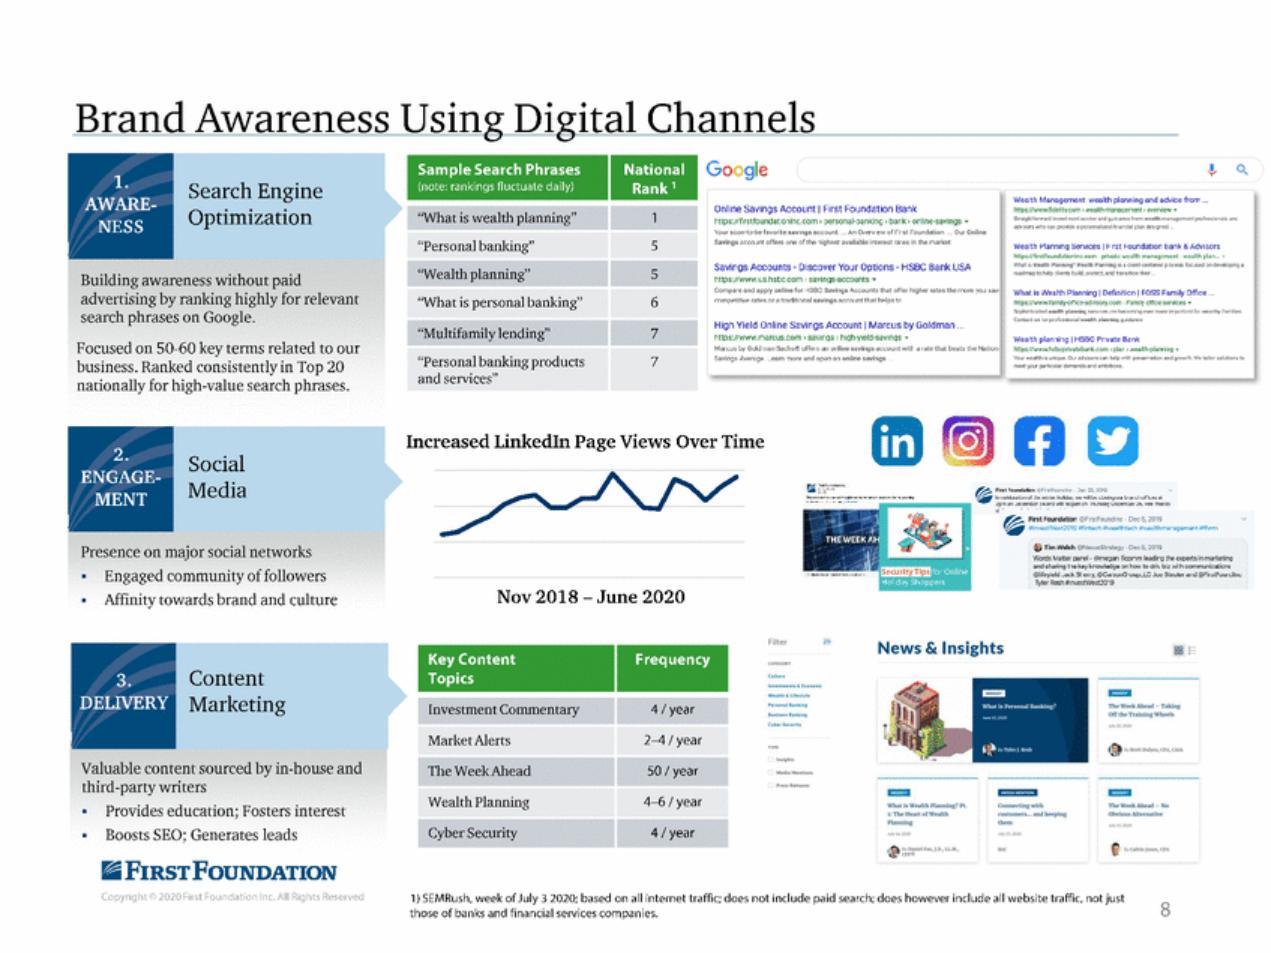
| Brand Awareness Using Digital Channels IBGoogle Online savings Accoum 1 First Foundation Bank: Search Engine Optimization Weah Menogement wealthplmning md advCe from .. httpsi/W'I'Iw.Mel tvcom •makh-m;rocen«t > o noie"" • ar..gMfor,.,rlliftwel'n<nl,...,.iooo _ g"it'""""'fromwo•...rnon>g<montpoof-oo;.,tc ii:JVS<n '""'""'PfO"<Jf a !l(tHI'li!IRil tW.arctll lalllll$gncl . 'What is wealth planning" "Personal banking" "Wealth planning" 'What is personal banking" Mtps:/ltirstfoundat o'llnc.com,personal-: anl<.lnQ,bank'orllrlE-savnl gs .. 'ror so:;on-t::H:tehvoet:luflt:lllco:;ounl---An 0......-ve..ofri·:st roun-intion _ o,.,. Onlln• 5 5 SPirQt Oir.tlO.M'I of f!l OMof thl!o ,igt\ :!::1 illlitabll!irtf!I'I!U rl!I"I!S in1lv MlW'Ia!ol wealth l'lamln!l Sernces 11-rst t-ounclanon ban8 Adv :>ors htl!>l:>:lliret foud)ti0f'llno.o><>lr1 pn...:..t..¢)llh ""•"'•O Cftl ....c;:Jjt:l:.;.• - l'lnttti w..mrnt119'weetiJII"IIol:n-.g111dlftt-eentB"oM p"OCes!'XJSeO :>n<Jf'l'o!loptr.JI ro..,..,ptQhotp;l..,,g tUIId,P<oleet,arcltarodlooth..,. Savirgs AccountsD· iscover Your Opnons •HSBC Bank USA https:J/wYI'w.us.hstc.com , savmgs-acc:>unls ... Building awareness without paid advertising by ranking highly for relevant search phrases on Google. Focused on 50-60 key terms related to our business. Ranked consistently in Top 20 nationally for high-value search phrases. What'Nt;oalth Planning IDlri"tnitit:n IFOSS F!lmio/ OfftC@ 6 https1f"ii'vvw.tamly'Onc•ctiOi f)'.oom : FJrnty cm::e str.,.ccs .. "-'f+H•IiNI I..-1 oralllplannO.C ""'""' ,,..,l'lrr.....,;'IIJ-"'*"'in'i"""rbnl(t> -II'¥ '""'"' Conia<l o'Oip< >fn-..t .. MI:h• 'll-" Wei!!lth plamilg 1 HSBC Pnvate B.mk l'ltlpt:l/wv.w.hdJ f)fiVIIfbri.(Of'J'I I tiar I Nf;iikh-plarnift(,J • High Yield Online Savlngs Account 1 Marcus by Goldman .. httos:/lwYM•.nm:us.com > sa\'lras; : tuah·y eld-savtnas ... "Multifamily lending" "Personal banking products and services" 7 7 M<ll t.:.lUy G\Jlltt<lll Sii.Kitllfl'dt l l (lt tlit NIII'O'il!j¥<1Ct.:UUIIl w1U Saving5 Avotr;.got _eoam 'nOrot a-nda1eniiM s ngs <I t all' thdl.l.ot:•IlIH:l riclll1..141• .......-..e-..Oo.redo< •• conhelf>""id' ""'"""-an<lllr-ow;h.Woto•l,.•ol"';.,..,"' l1lftt )<lU' ..,.w:. ar dm.n:lm.,-d onM<>•• no C) rim IN.!ch@'hxu&stnt..gf ·DecO,201'01 Increased Linkedln Page Views Over Time Social Media = V:= ':!,r::w!7.,!:!!Tn 0 Presence on major social networks Engaged community of followers Affinity towards brand and culture Words Natter t:el"ee-@me; a"fiQJI'll'llleadiro theEXDertsinmarl-;eling and doariog t1oloktykrowl«<9<1o hOY.todrio.b:z ....O:hOO!'I"'I'YYur'li;::Unc @ re it:'loJ -""'"' st11.i&WC• tO-LC Jw :ll:ullt:r Ty1er Resh #mestVIe>U0'9 Nov 2018 -June 2020 Fli t News & Insights 88. Content Marketing Investment Commentary 4 I year TMWMAA.-.d -T..Idng Of(IMTr oi.nln&:""l:!ftb Market Alerts 2-4 I year Valuable content sourced by in-house and third-party writers Provides education; Fosters interest Boosts SEO; Generates leads IiiFIRsTFouNDATION Copyright© 2020First Foundation Inc. All Rights Reserved l11e Week Ahead 50 I year 4-6 I year Wealth Planning .,..,._l w...,lrh PI.HOni'"I?PI. l:'l'bellfoK1 VfWNith P&annioc eon.-rlnawtrh C'UtUH' n..-ilndk nt '"'" Cyber Security 4 I year 1) SEMRush, week of July 3 2020;based on all internet traffic;does not include paid search;does however include all website traffic, not just those of banks and financial services companies. 8 Frequency Key Content Topics Sample Search Phrases (note. rank;ngs fluctuate da;ly) |
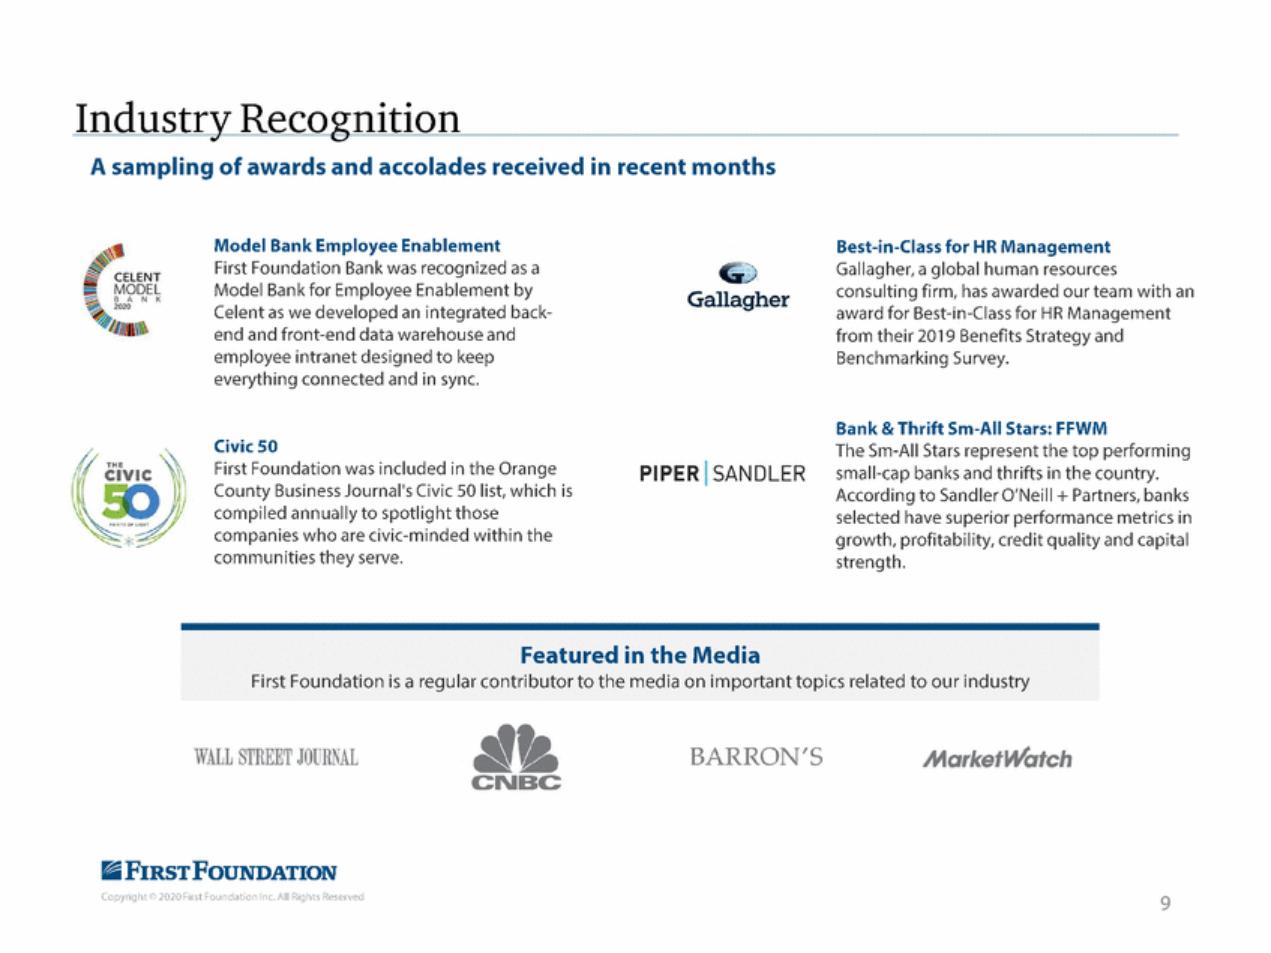
| Industry Recognition A sampling of awards and accolades received in recent months i·f:/! CELENT Model Bank Employee Enablement First Foundation Bank was recognized as a Model Bank for Employee Enablement by Celent as we developed an integrated back end and front-end data warehouse and employee intranet designed to keep everything connected and in sync. Best-in-Class for HR Management Gallagher, a global human resources consulting firm,has awarded our team with an award for Best-in-Class for HR Management from their 2019 Benefits Strategy and Benchmarking Survey. - MODEL Gallagher BANK 2020 IIlii\ Bank & Thrift Sm-All Stars:FFWM The Sm-All Stars represent the top performing small-cap banks and thrifts in the country. According to SandlerO'Neill +Partners,banks selected have superior performance metrics in growth,profitability, credit quality and capital strength. Civic 50 First Foundation was included in the Orange County Business Journal's Civic 50 list,which is compiled annually to spotlight those companies who are civic-minded within the communities they serve. PIPER ISANDLER Featured in the Media First Foundation is a regular contributor to the media on important topics related to our industry '-BARRON'S WALL STREET JOURNAL MarketWatch CNBC IiiFIRsTFouNDATION Copyright© 2020First Foundation Inc. All Rights Reserved 9 |
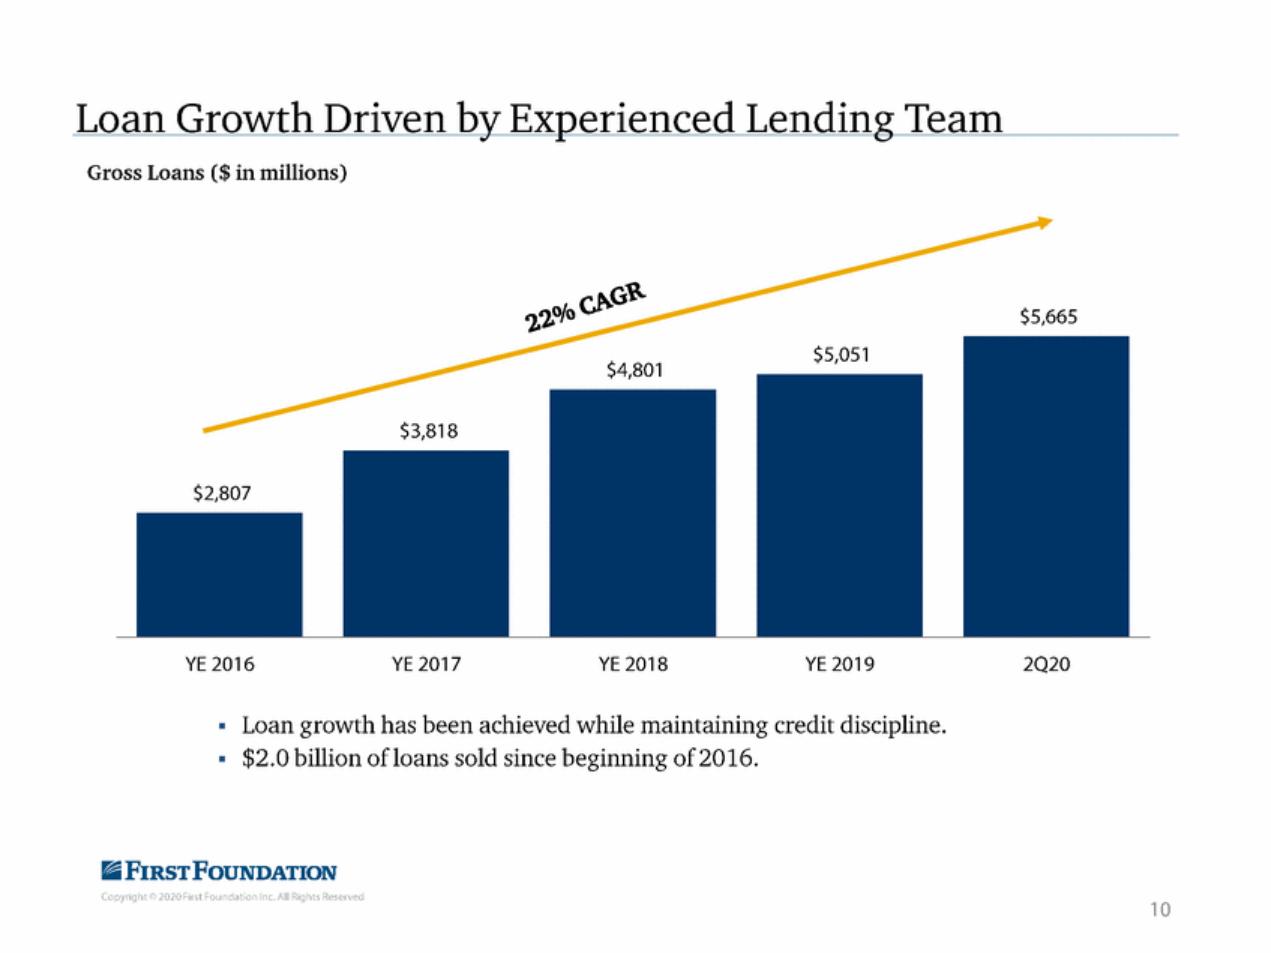
| by Experienced Lending Team Loan Growth Driven Gross Loans($ in millions) YE 2016 YE 2017 YE 2018 YE 2019 2Q20 • Loan growth has been achieved while maintaining credit discipline. • $2.0 billion ofloans sold since beginning of2016. IiiFIRsTFouNDATION Copyright© 2020First Foundation Inc. All Rights Reserved 10 |
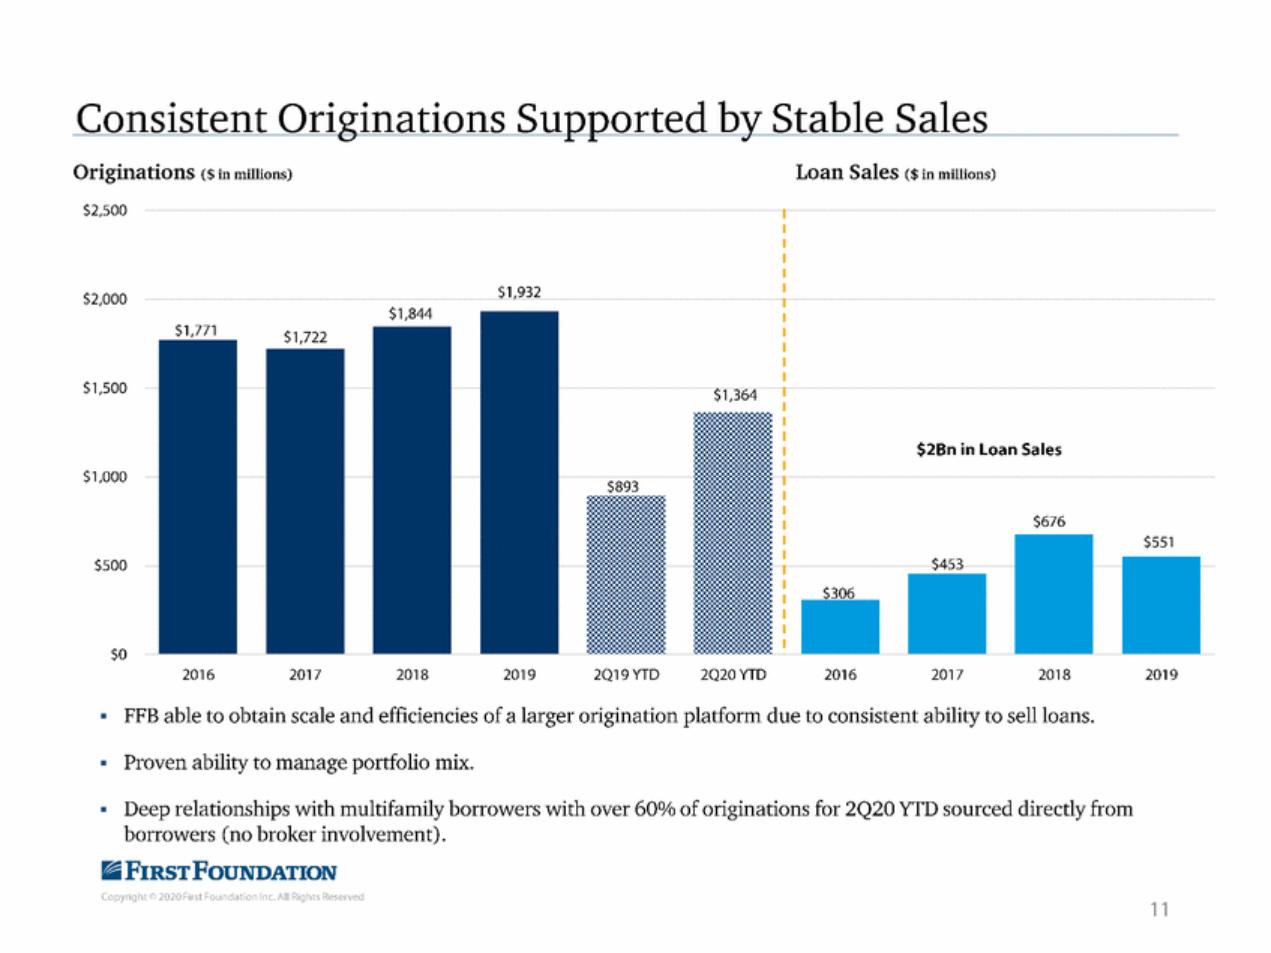
| Consistent Originations Supported by Stable Sales Originations ($in millions) $2,500 Loan Sales ($in millions) $1,932 $2,000 $1,844 s1,771 $1,722 $1,500 $1,364 $2Bn in Loan Sales $1,000 $676 $551 $500 $453 so 2016 2017 2018 2019 2Q19 YTD 2Q20 YTD 2016 2017 2018 2019 • FFB able to obtain scale and efficiencies of a larger origination platform due to consistent ability to sell loans. • Proven ability to manage portfolio mix. • Deep relationships with multifamily borrowers with over 60% of originations for 2Q20 YTD sourced directly from borrowers (no broker involvement). IiiFIRsTFouNDATION Copyright© 2020First Foundation Inc. All Rights Reserved 11 |
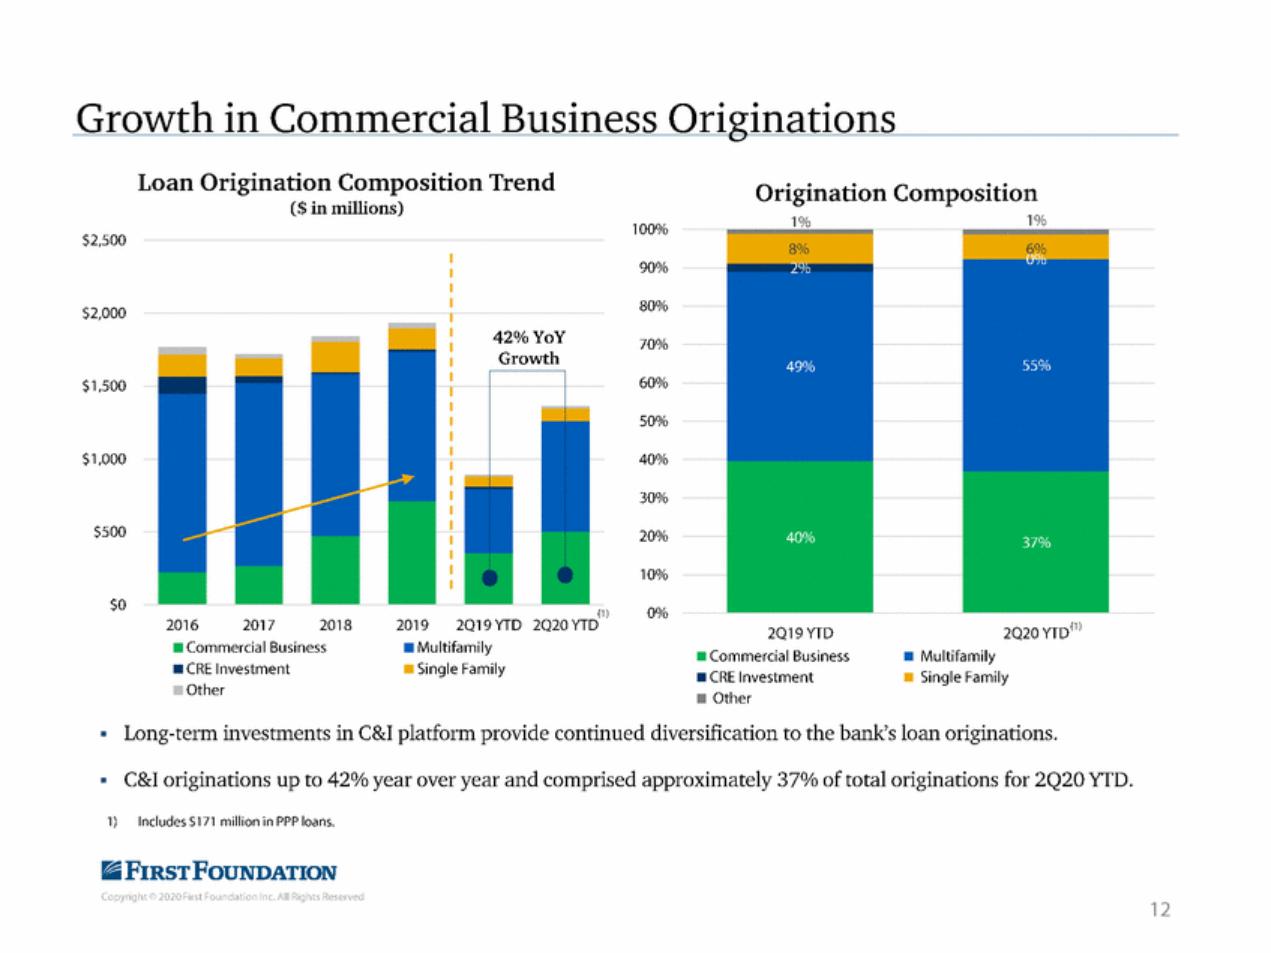
| Growth in Commercial Business Originations Loan Origination Composition Trend ($in millions) Origination Composition 100% $2,500 90% 80% $2,000 70% 60% $1,500 50% $1,000 40% 30% $500 20% 10% so 0% (1) 2020 YTD 2016 2017 2018 2019 2019 YTD 2020YTD11l 2019 YTD •Commercial Business •CRE Investment • Other •Commercial Business •CRE Investment Other •Multifamily •Single Family • Multifamily • Single Family • Long-term investments in C&I platform provide continued diversification to the bank's loan originations. • C&I originations up to 42% year over year and comprised approximately 37% of total originations for 2Q20 YfD. 1)Includes $171 million in PPP loans. IiiFIRsTFouNDATION Copyright© 2020First Foundation Inc. All Rights Reserved 12 |
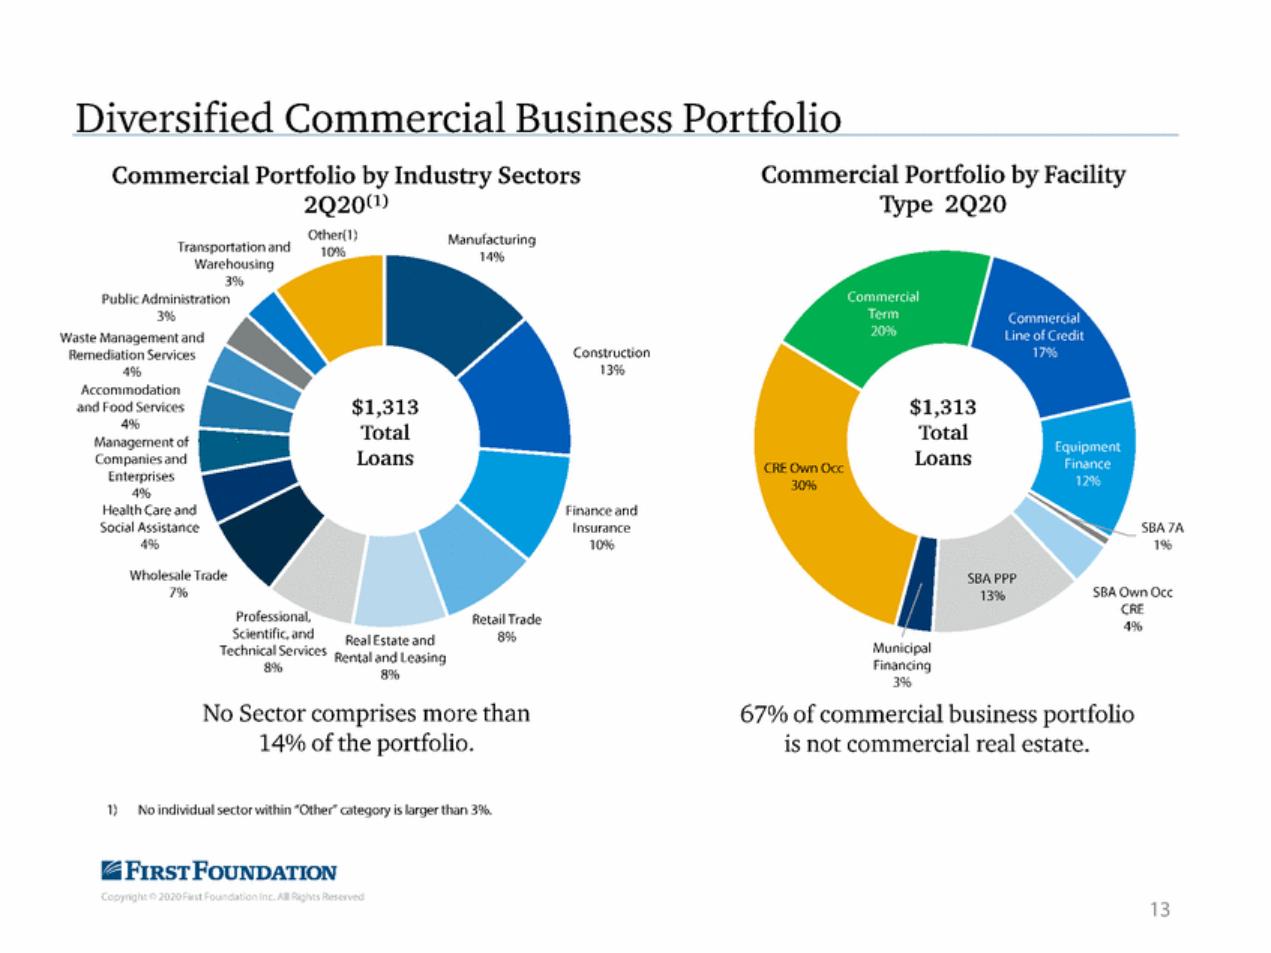
| Diversified Commercial Business Portfolio Commercial Portfolio by Industry Sectors 2Q2Q0) Commercial Portfolio by Facility Type 2Q20 Other(l) Manufacturing 14% Transportation and Warehousing 3% Public Administration 3% Waste Management and Remediation Services 4% Accommodation and Food Services 4% Management of Companies and Enterprises 4% Health Care and Social Assistance 4% Construction 13% $1,313 Total Loans $1,313 Total Loans Finance and Insurance 10% SBA 7A 1% Wholesale Trade 7% SBA PPP 13% SBAOwn Occ CRE 4% Professional, Scientific,and RealEstate and 8% Municipal Financing 3% Technical Services Rental and Leasing 8% 8% No Sector comprises more than 14% of the portfolio. 67% of commercial business portfolio is not commercial real estate. 1)No individual sector within "Other" category is larger than 3%. IiiFIRsTFouNDATION Copyright© 2020First Foundation Inc. All Rights Reserved 13 |
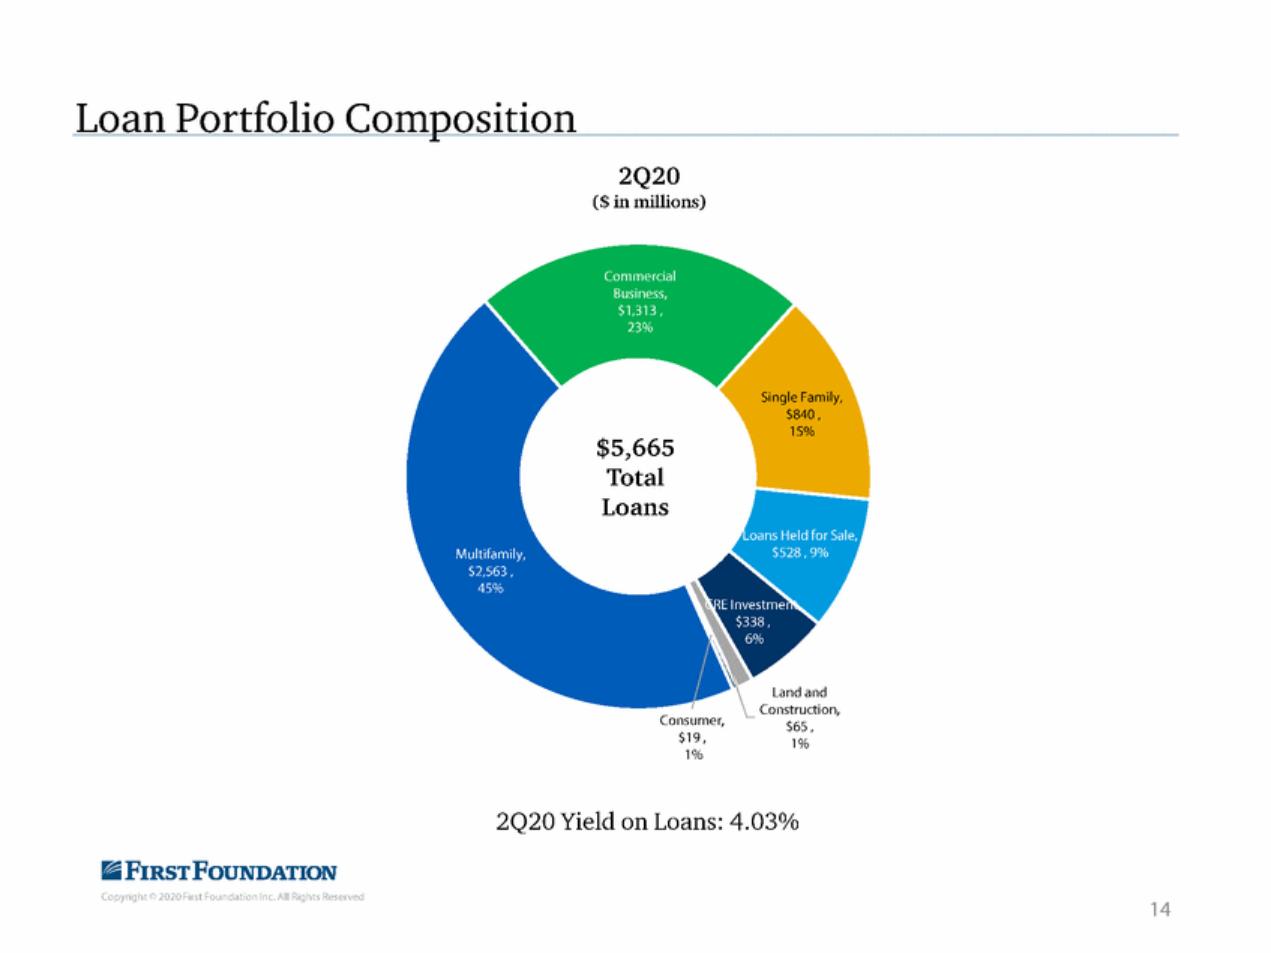
| Loan Portfolio Composition 2Q20 ($in millions) $5,665 Total Loans Land and Construction, $65, 1% 1% 2Q20 Yield on Loans: 4.03% IiiFIRsTFouNDATION Copyright© 2020First Foundation Inc. All Rights Reserved 14 |
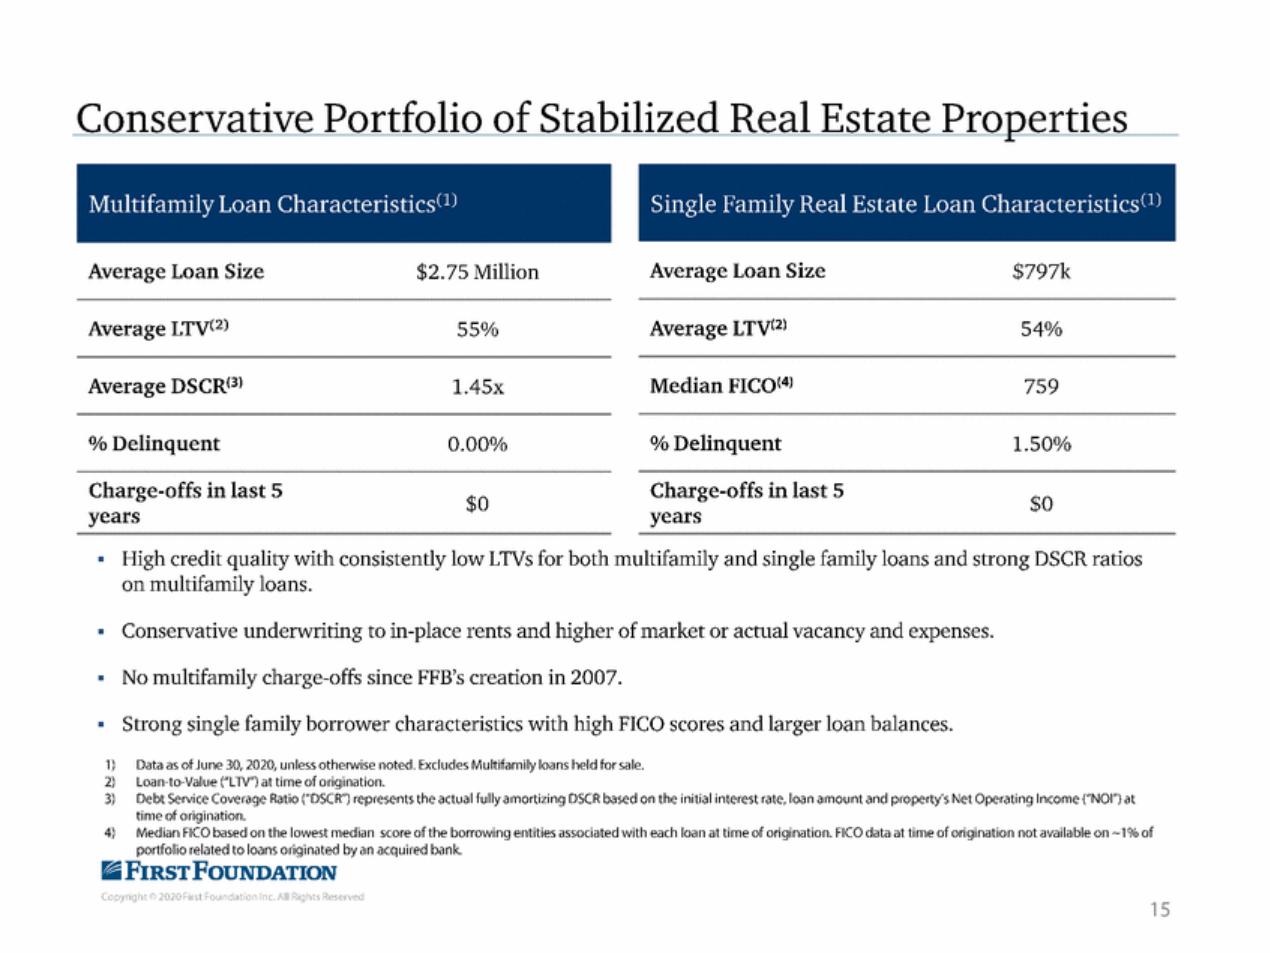
| Conservative Portfolio of Stabilized Real Estate Properties Average Loan Size Average Loan Size $2.75 Million $797k Average LTV(2) Average LTV<2l 54% 55% Average DSCR<3l Median FIC0<4l 759 1.45x %Delinquent % Delinquent 0.00% 1.50% Charge-offs in last 5 years Charge-offs in last 5 years $0 $0 • High credit quality with consistently low LTVs for both multifamily and single family loans and strong DSCR ratios on multifamily loans. • Conservative underwriting to in-place rents and higher of market or actual vacancy and expenses. • No multifamily charge-offs since FFB's creation in 2007. • Strong single family borrower characteristics with high FICO scores and larger loan balances. 1) 2) 3) Data as of June 30, 2020,unless otherwise noted. Excludes Multifamily loans held for sale. Loan-to-Value ("L1V") at time of origination. Debt Service Coverage Ratio ("DSCR") represents the actual fully amortizing DSCR based on the initial interest rate,loan amount and property's Net Operating Income ("NOI") at time of origination. Median FICO based on the lowest median score of the borrowing entities associated with each loan at time of origination. FICO data at time of origination not available on -1o/o of portfolio related to loans originated by an acquired bank. 4) IiiFIRsTFouNDATION Copyright© 2020First Foundation Inc. All Rights Reserved 15 Single Family Real Estate Loan CharacteristicsCl Multifamily Loan CharacteristicsCl) |
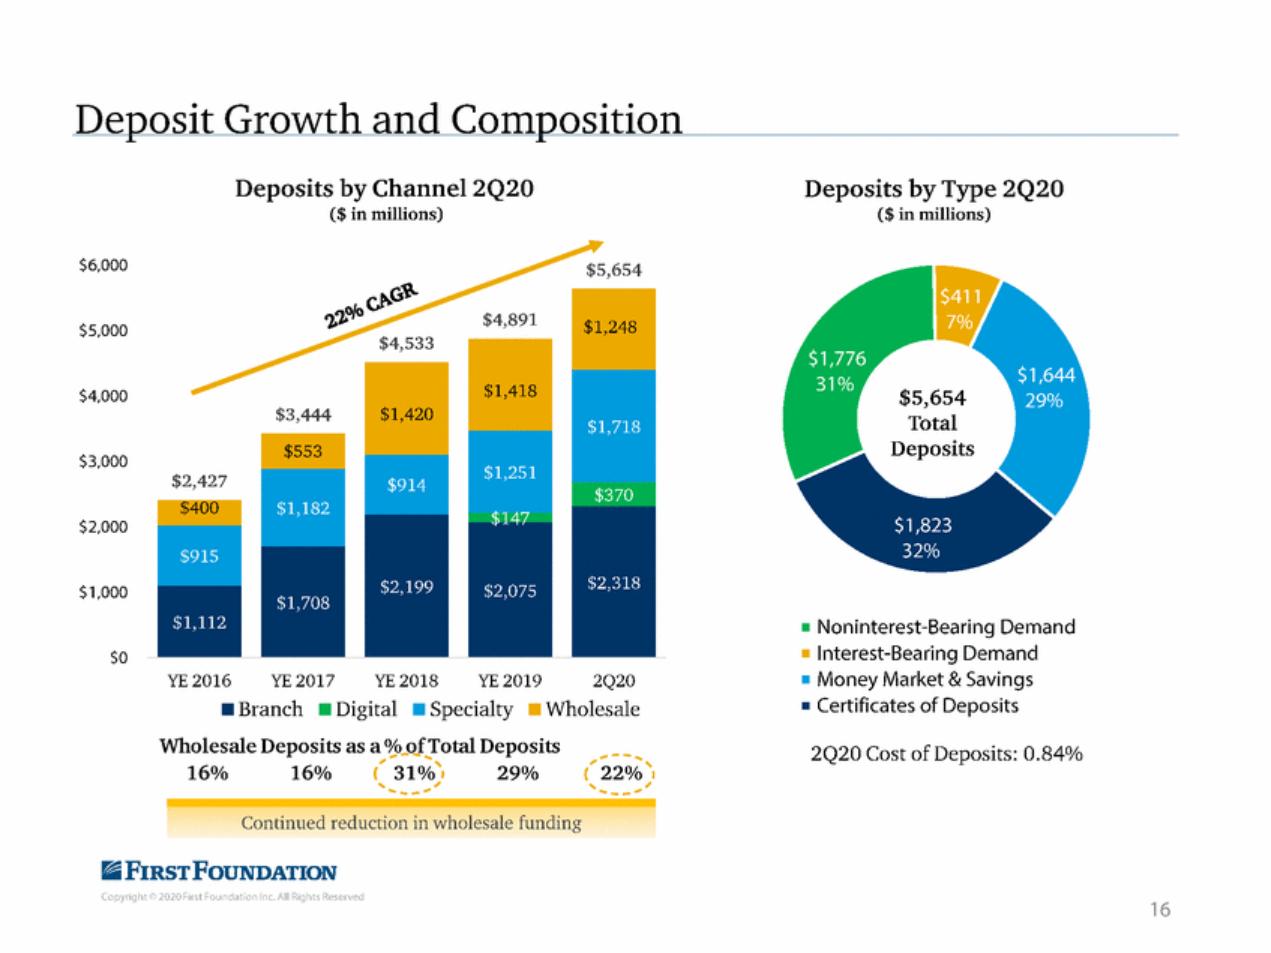
| Deposit Growth and Composition Deposits by Channel 2Q20 ($ in millions) Deposits by Type 2Q20 ($in millions) $6,000 G ofo $4,891 $5,000 $4,533 $5,654 Total $4,000 $3,444 $3,000 $2,427 $2,000 $1,000 • Noninterest-Bearing Demand • Interest-Bearing Demand • Money Market & Savings • Certificates of Deposits $0 YE 2016 YE 2017 YE 2018 YE 2019 2Q20 •Branch •Digital •Specialty •Wholesale Wholesale Deposits as a 0o_oJ.T. otal Deposits 2Q20 Cost of Deposits: 0.84% ..,.--, 31%' , (, { 22% ' 16% 16% 29% ....... ,..., I ........ _ ..... .,I ' Continued reduction in wholesale funding IiiFIRsTFouNDATION Copyright© 2020First Foundation Inc. All Rights Reserved 16 $1,420 $1,418 $1,248 |
| |
| • • • • • • • • |
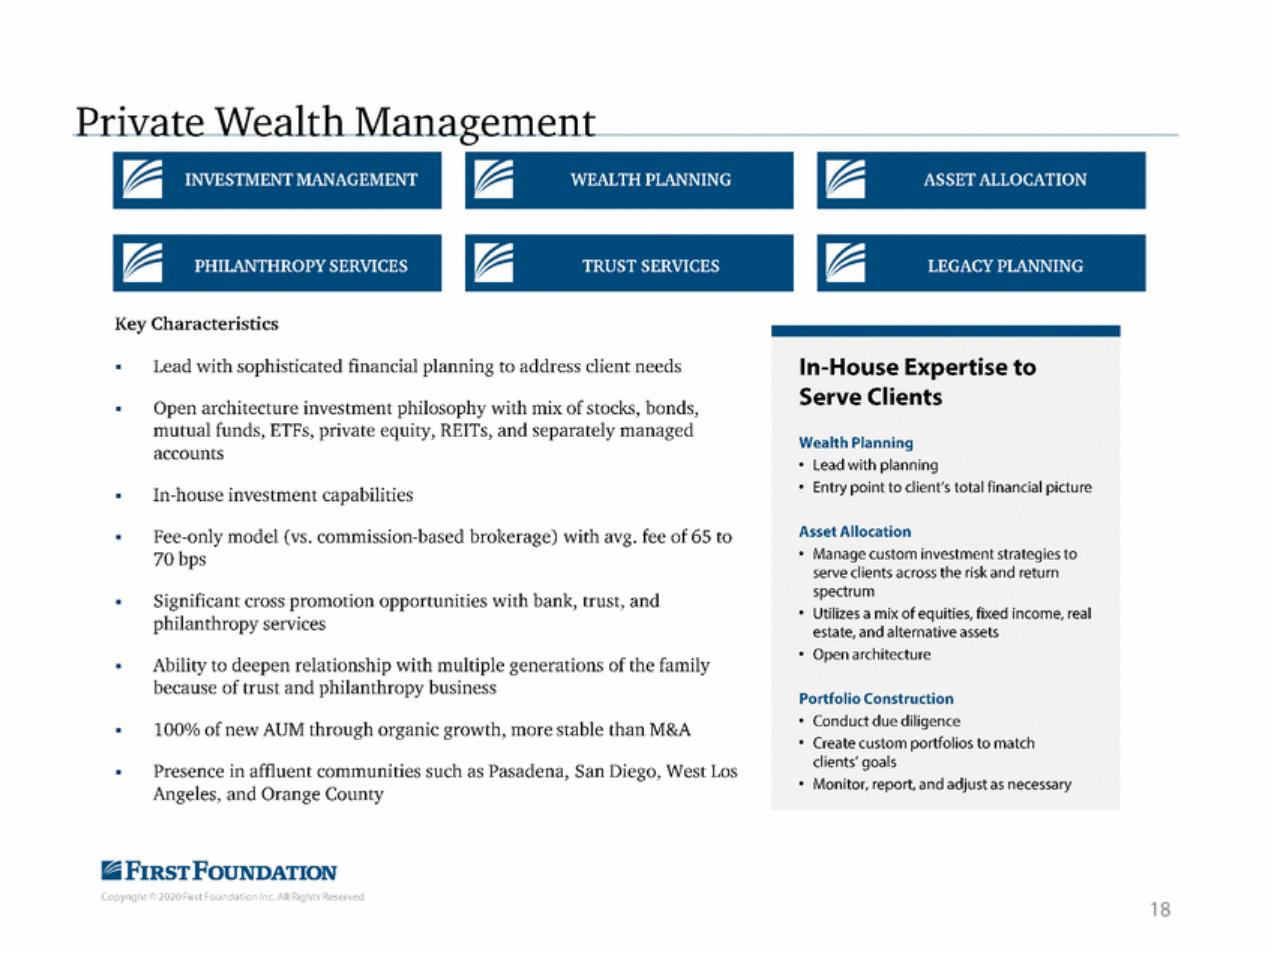
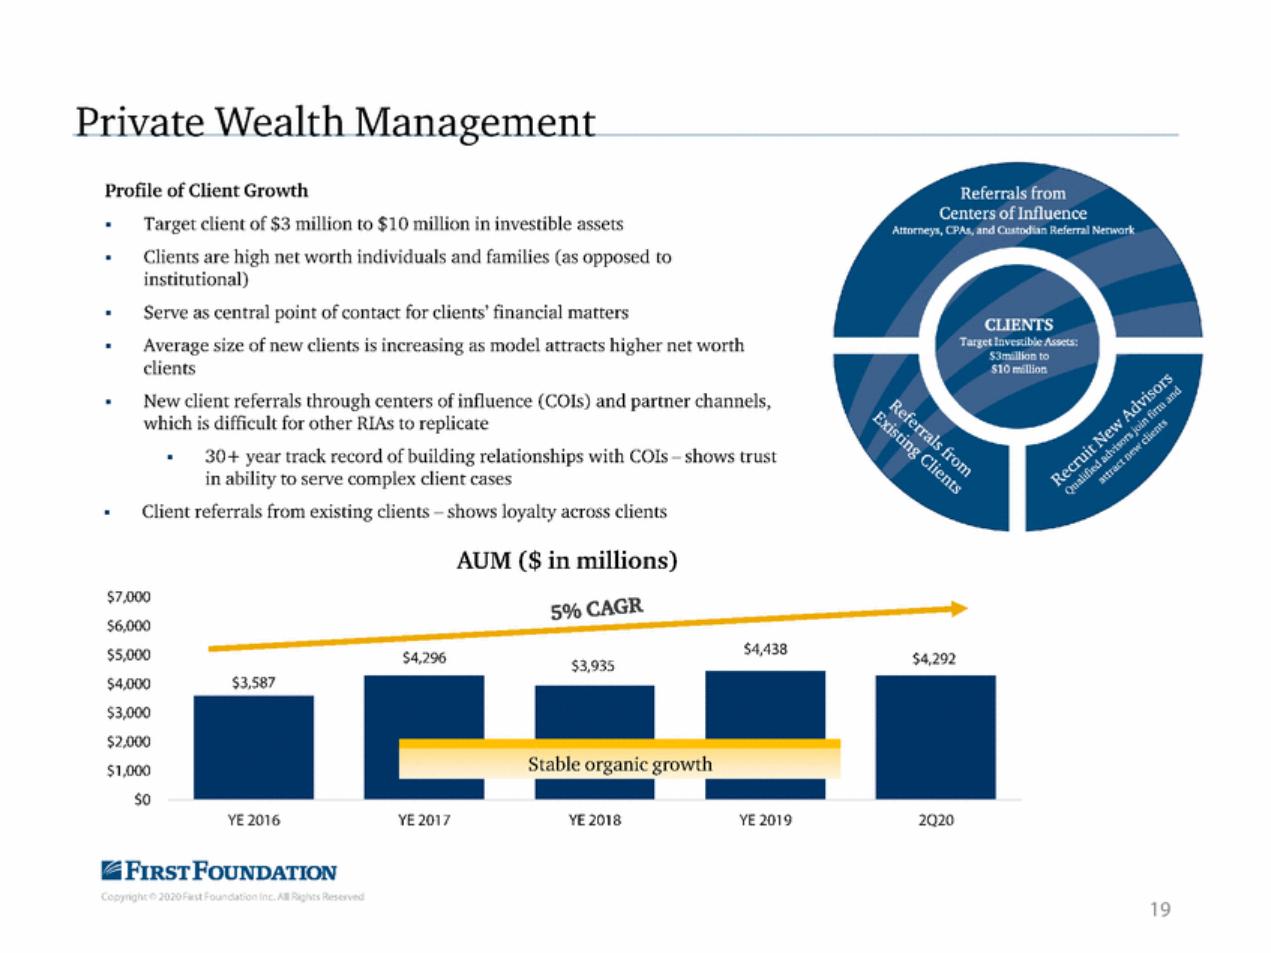
| Private Wealth Management Profile of Client Growth Target client of $3 million to $10 million in investible assets Clients are high net worth individuals and families (as opposed to institutional) Serve as central point of contact for clients' financial matters Average size of new clients is increasing as model attracts higher net worth clients New client referrals through centers of influence (COis) and partner channels, which is difficult for other RIAs to replicate 30+ year track record of building relationships with COis-shows trust in ability to serve complex client cases Client referrals from existing clients -shows loyalty across clients AUM ($in millions) $7,000 s%CAGR $6,000 $4,438 $5,000 $4,296 $4,292 $3,587 $4,000 $3,000 $2,000 Stable organic growth $1,000 $0 YE 2016 YE 2017 YE 2018 YE 2019 2Q20 IiiFIRsTFouNDATION Copyright© 2020First Foundation Inc. All Rights Reserved 19 |
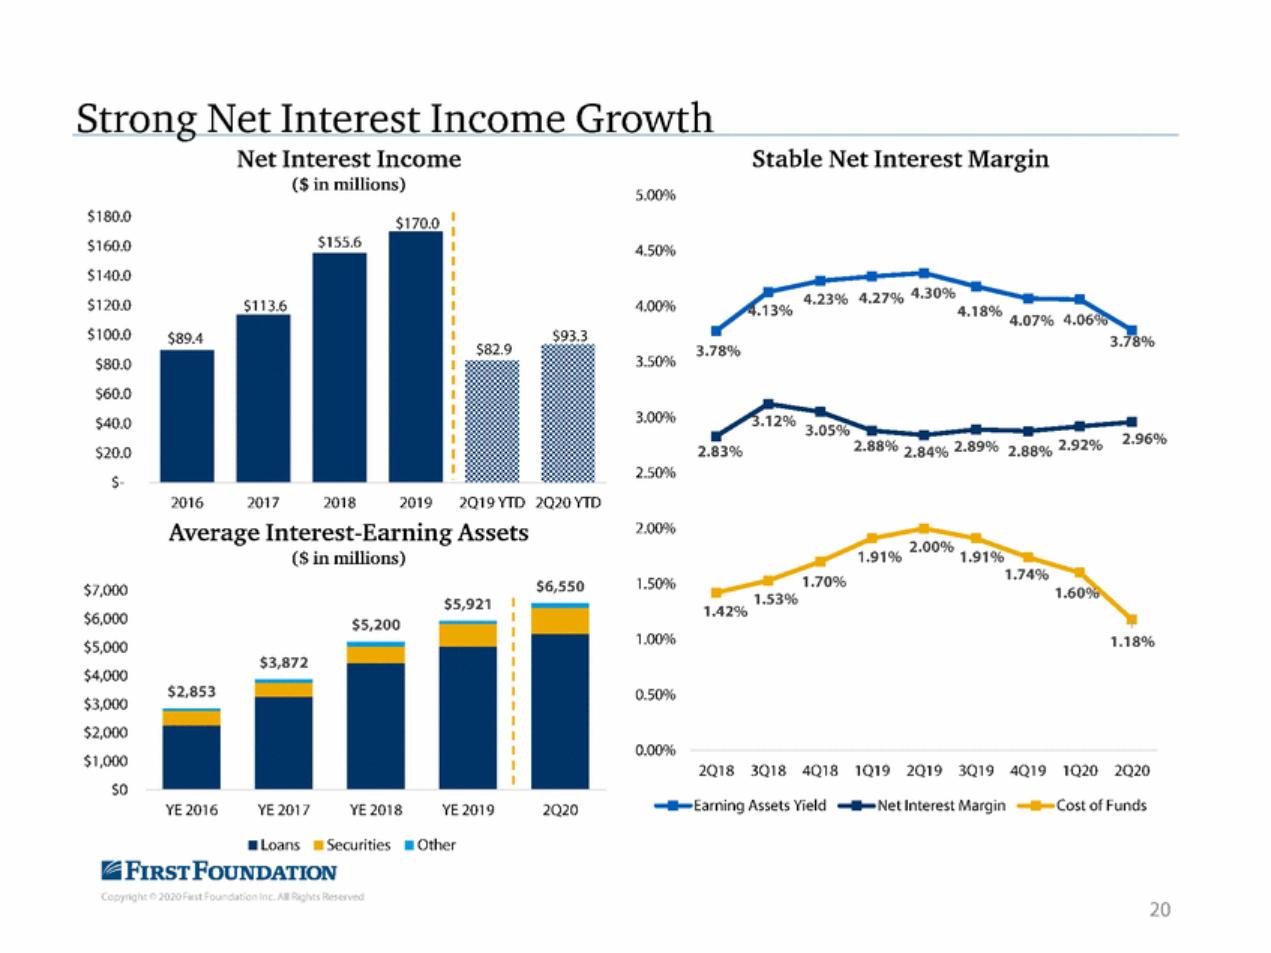
| Strong Net Interest Income Growth Net Interest Income ($ in millions) Stable Net Interest Margin 5.00% $180.0 $160.0 $155.6 4.50% $140.0 $120.0 4.23% 4.27% 4.30% 4.00% 4• 18 % 4.07% 4.06° $100.0 $93.3 $89.4 3.78% 3.78% 3.50% $80.0 ... $60.0 $40.0 3.00% %3 2.83% •••• 2.88% 2.84% 2.89% 2.88% 2.92% 2.96% $20.0 $-2.50% 2016 2017 2018 2019 2Q19 YTD 2Q20 YTD Average Interest-Earning Assets ($in millions) 2.00% 1.50% $6,550 $7,000 $5,921 $6,000 $5,000 $4,000 $3,000 $2,000 $5,200 1.00% 1.18% $3,872 $2,853 0.50% 0.00% $1,000 $0 2Q18 3Q18 4Q18 1Q19 2Q19 3Q19 4Q19 1Q20 2Q20 - Earning Assets Yield Net Interest Margin Cost of Funds YE2016 YE 2017 YE2018 YE 2019 2Q20 •Securities •Loans •Other IiiFIRsTFouNDATION Copyright© 2020First Foundation Inc. All Rights Reserved 20 |
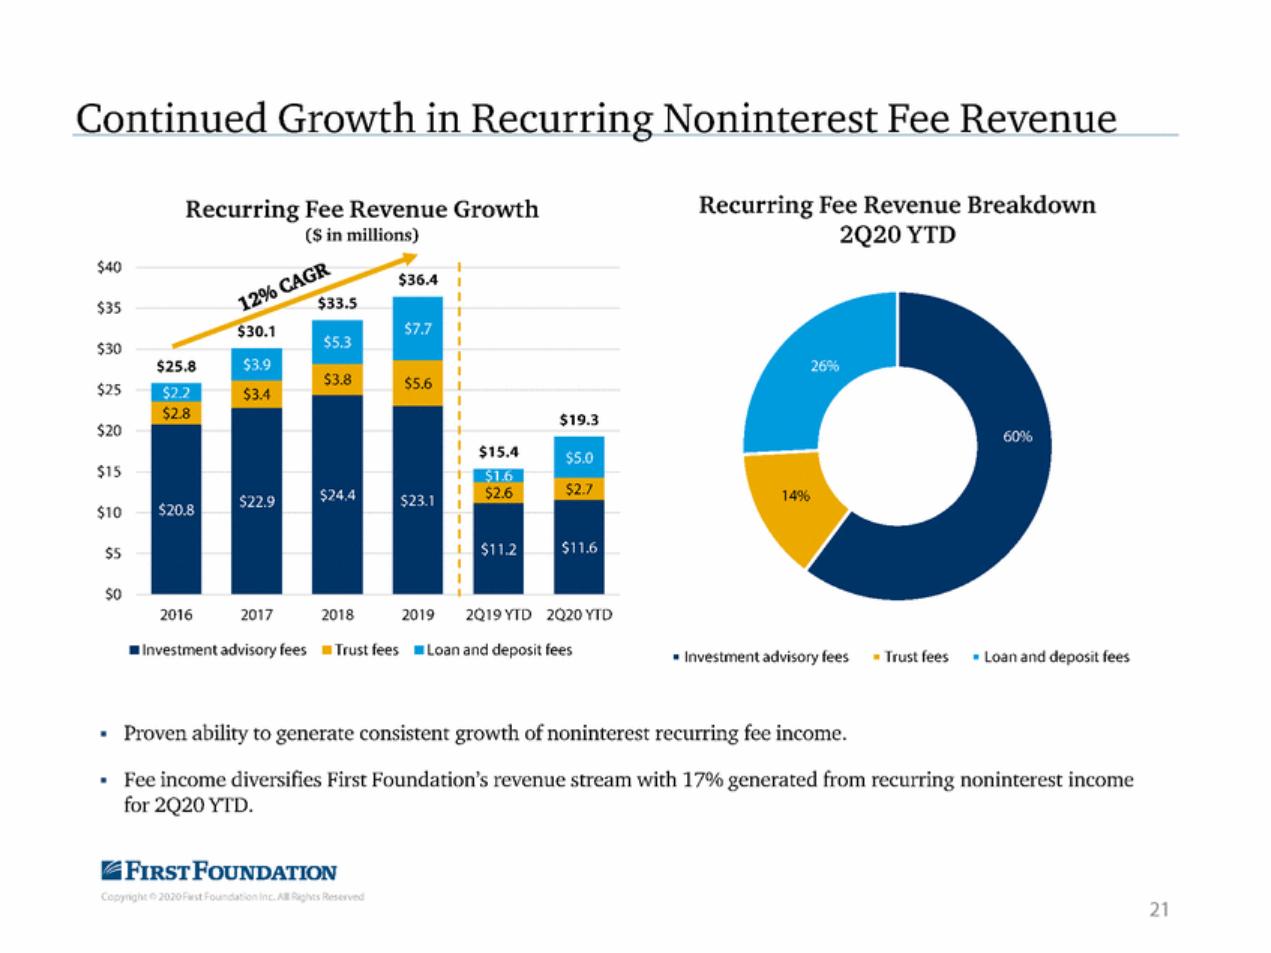
| Continued Growth in Recurring Noninterest Fee Revenue Recurring Fee Revenue Breakdown 2Q20YTD Recurring Fee Revenue Growth ($in millions) $40 $35 $30 $25 $19.3 $20 $15.4 $15 $10 $5 $0 2016 2017 2018 2019 2Q19YTD 2Q20YTD •Investment advisory fees •Trust fees •Loan and deposit fees • Investment advisory fees • Trust fees • Loan and deposit fees • Proven ability to generate consistent growth of noninterest recurring fee income. • Fee income diversifies First Foundation's revenue stream with 17% generated from recurring noninterest income for 2Q20 YfD. IiiFIRsTFouNDATION Copyright© 2020First Foundation Inc. All Rights Reserved 21 |
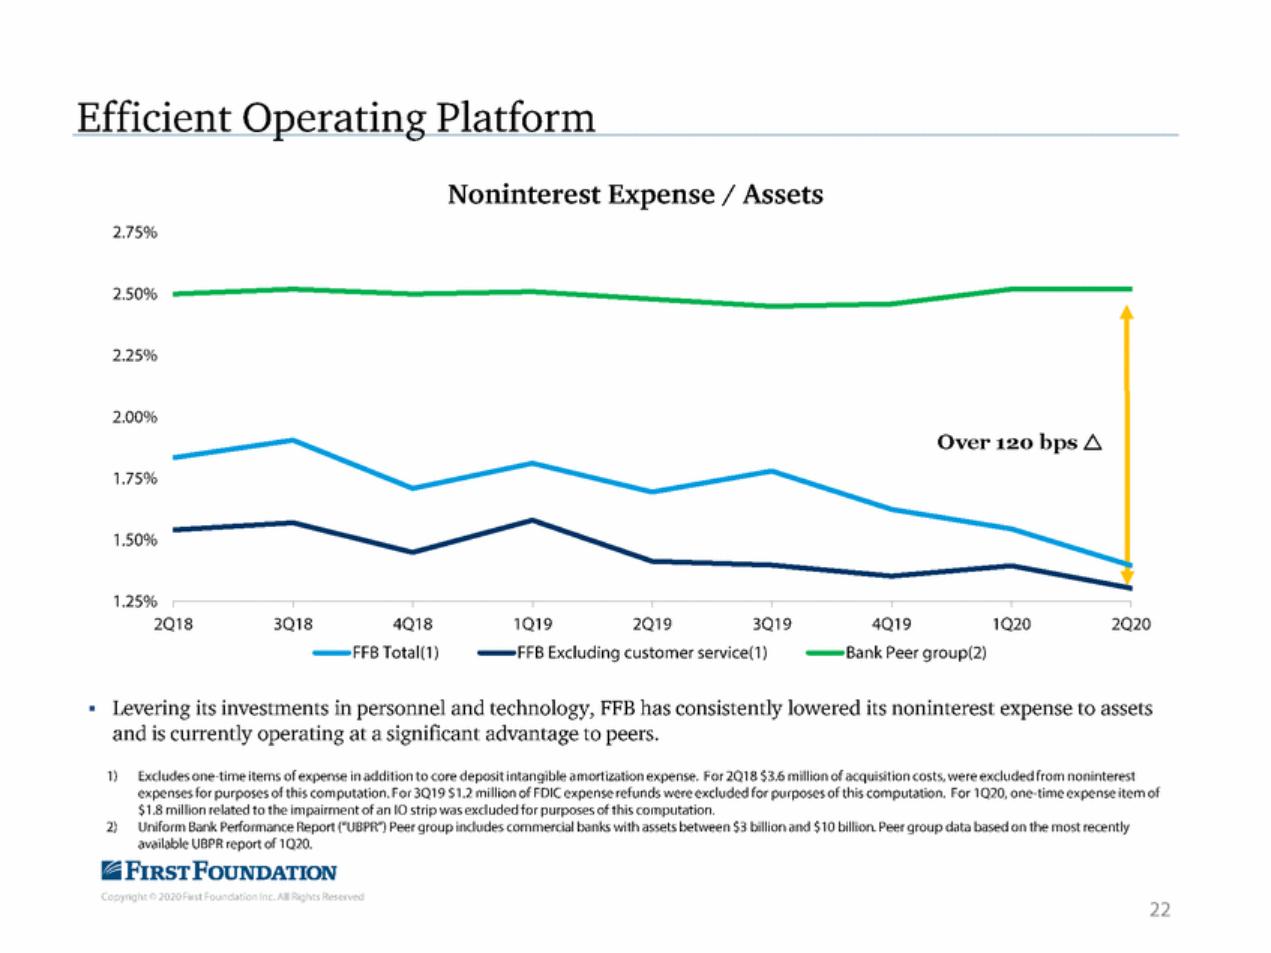
| Over 120 bps |
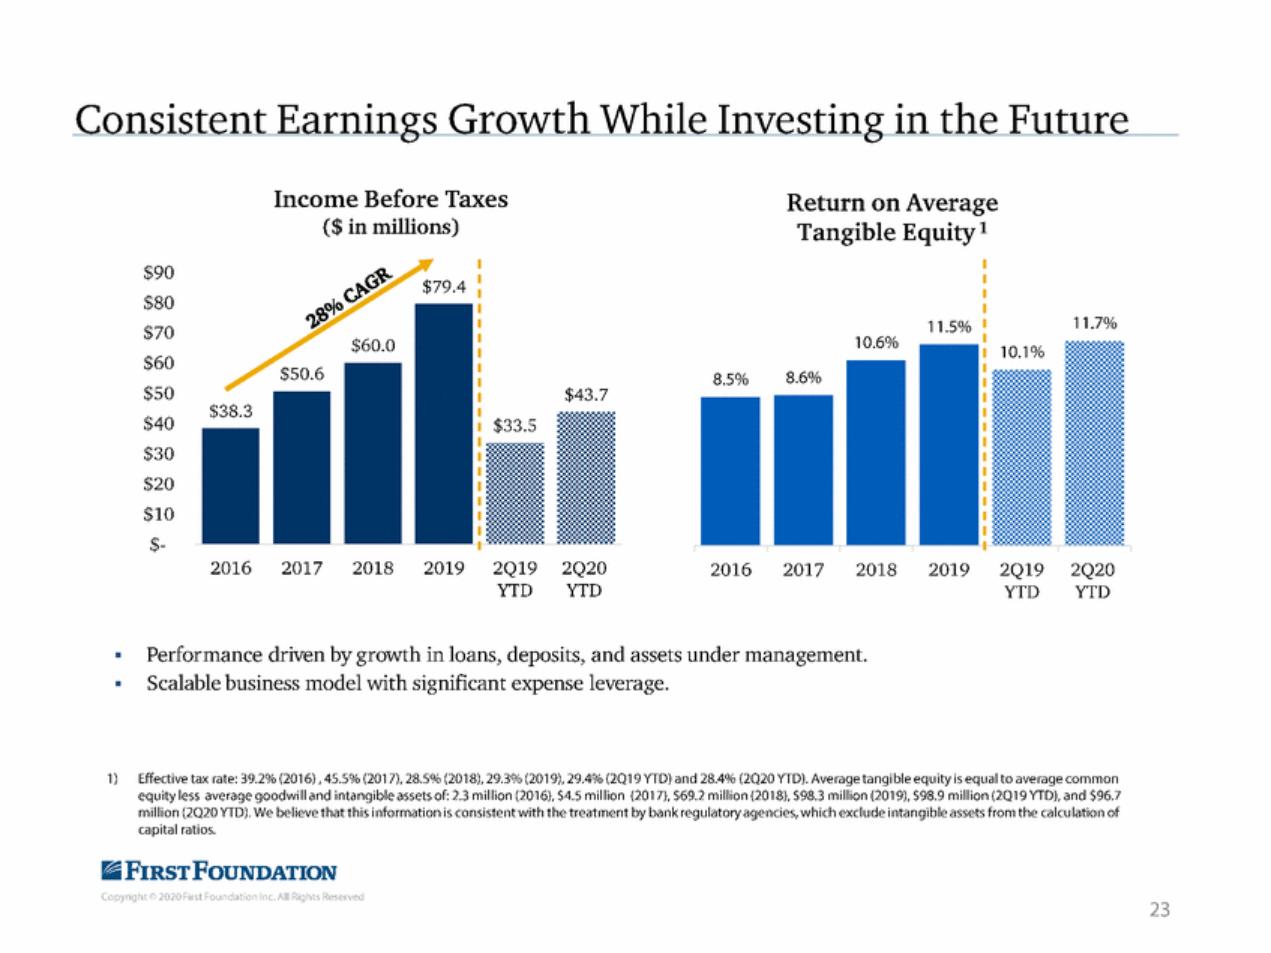
| Consistent Earnings Growth While Investing in the Future Income Before Taxes ($ in millions) Return on Average Tangible Equity t $90 $80 $70 $60 $50 $40 $30 $20 $10 $-11.7% 11.5% 2016 2017 2018 2019 2Q19 YTD 2Q20 YTD 2016 2017 2018 2019 2Q19 YTD 2Q20 YTD • • Performance driven by growth in loans, deposits, and assets under management. Scalable business model with significant expense leverage. 1) Effective tax rate: 39.2% (2016), 45.5% (2017),28.5% (2018),29.3% (2019),29.4% (2Q19 YTD) and 28.4% (2Q20 YTD). Average tangible equity is equal to average common equity less average goodwill and intangible assets of:2.3 million (2016),$4.5 million (2017),$69.2 million (2018),$98.3 million (2019), $98.9 million (2Q19 YTD), and $96.7 million (2Q20 YTD). We believe that this information is consistent with the treatment by bank regulatory agencies,which exclude intangible assets from the calculation of capital ratios. IiiFIRsTFouNDATION Copyright© 2020First Foundation Inc. All Rights Reserved 23 |
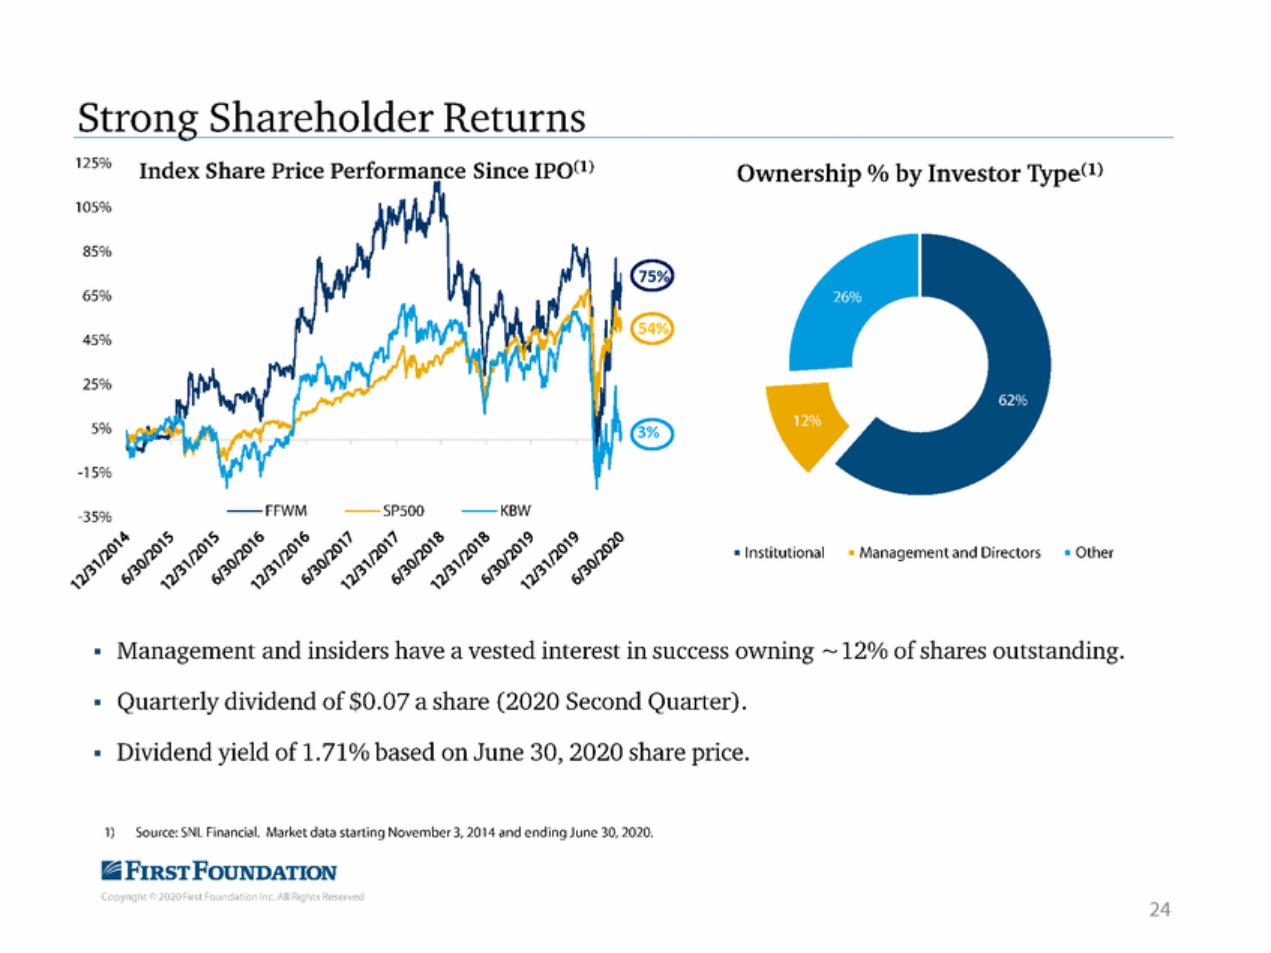
| 75% 54% 3% |
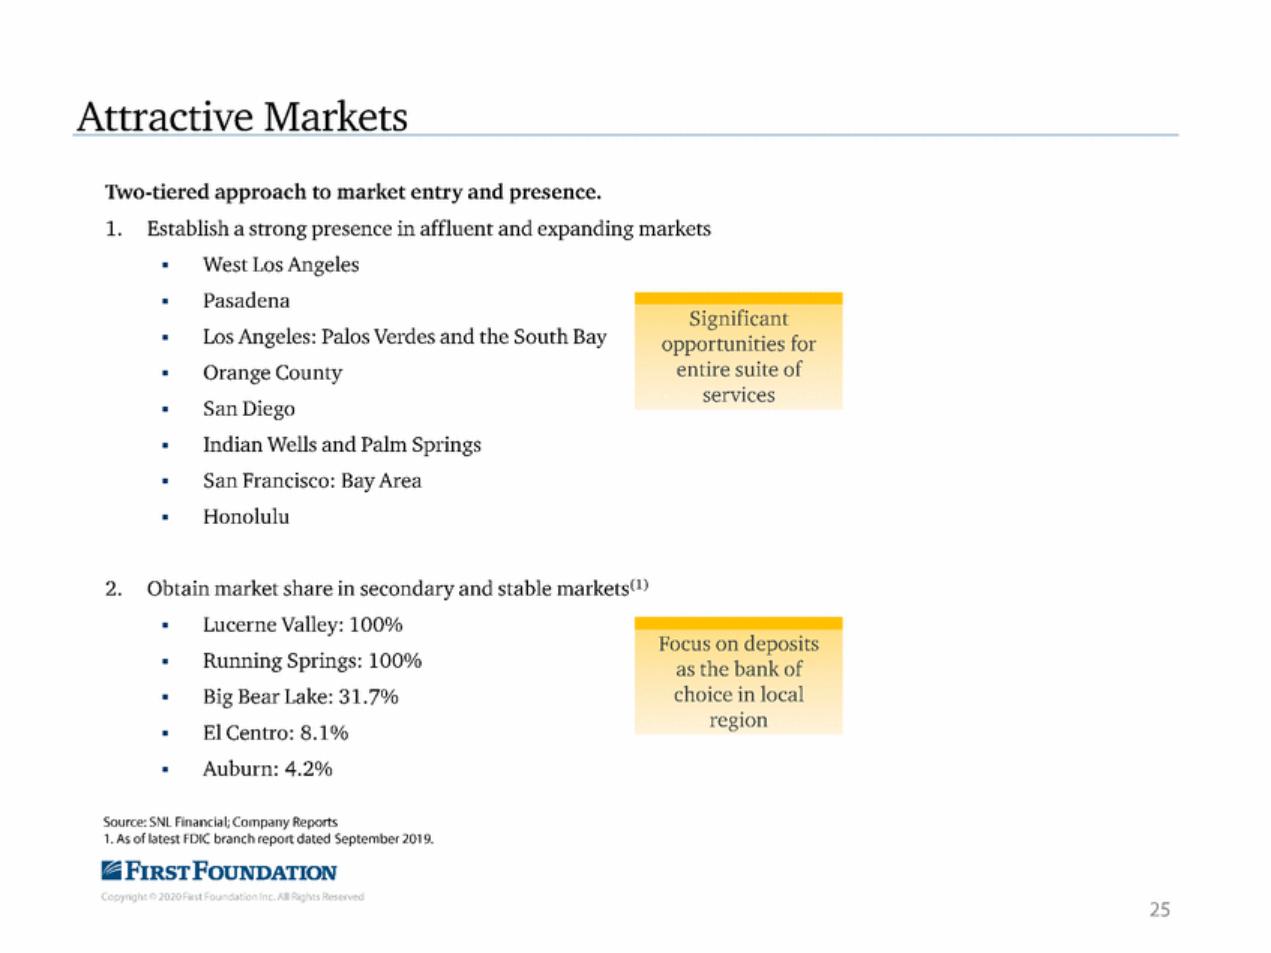
| Attractive Markets Two-tiered approach to market entry and presence. 1. Establish a strong presence in affluent and expanding markets • • • • • • • • West Los Angeles Pasadena Los Angeles: Palos Verdes and the South Bay Orange County San Diego Indian Wells and Palm Springs San Francisco: Bay Area Honolulu entire suite of services Obtain market share in secondary and stable marketsC1 2. ) • • • • • Lucerne Valley: 100% Running Springs: 100% Big Bear Lake: 31.7% El Centro: 8.1% Auburn: 4.2% choice in local regiOn Source:SNL Financial;Company Reports 1.As of latest FDIC branch report dated September 2019. IiiFIRsTFouNDATION Copyright© 2020First Foundation Inc. All Rights Reserved 25 Focus on deposits as the bank of Significant opportunities for |
| |
| |
| Appendix liFl:RSTFOUNDATION Copynght 2020 IJ\t r-0u1 datior rc.AII Rights Reserved 28 |
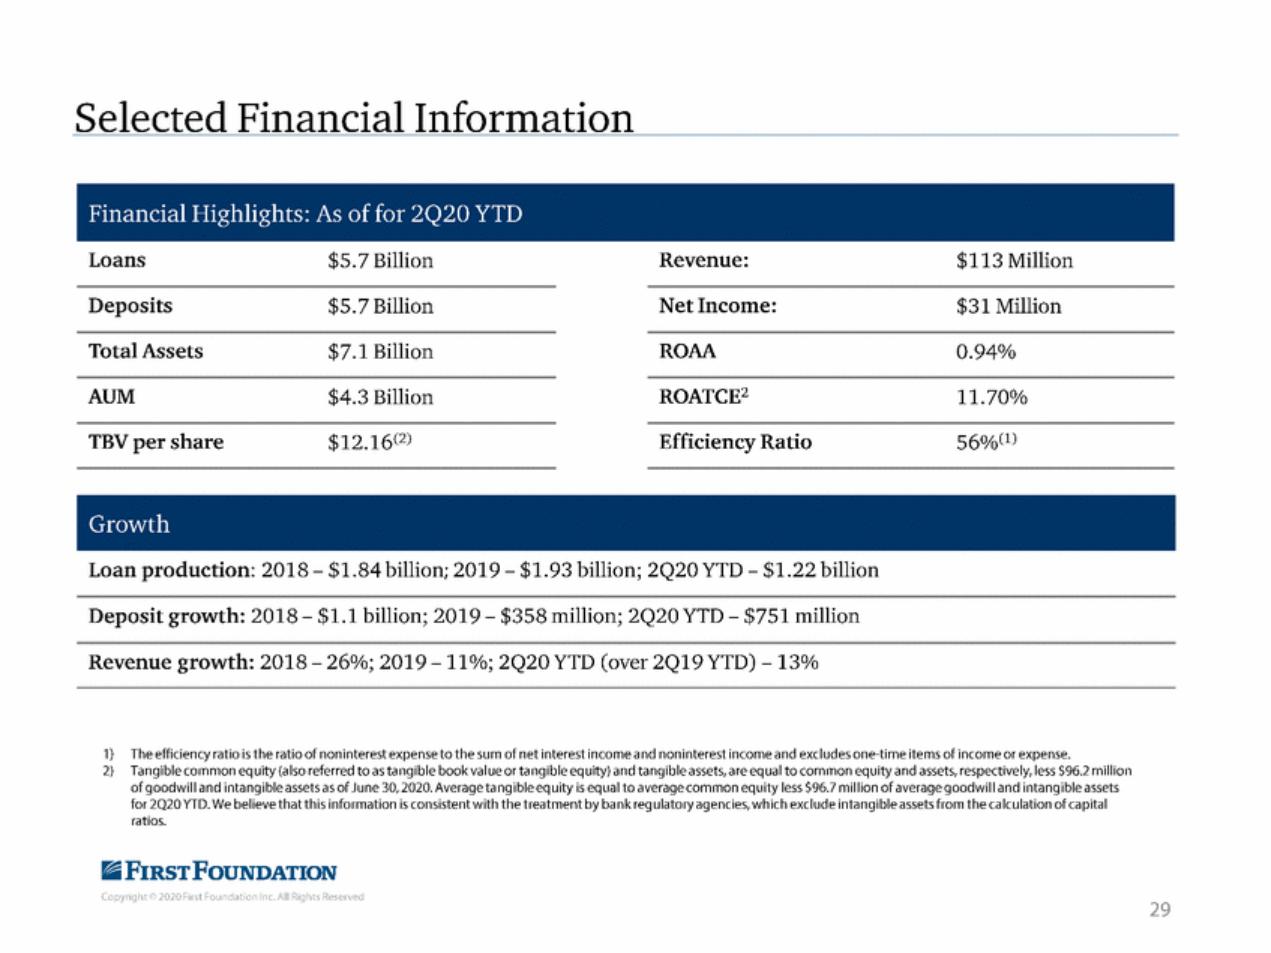
| Selected Financial Information Loans $5.7 Billion Revenue: $113 Million Deposits $5.7 Billion Net Income: $31 Million Total Assets $7.1Billion ROAA 0.94% ROATCE2 AUM $4.3 Billion 11.70% $12.16(2) 56%(1) TBV per share Efficiency Ratio Loan production: 2018-$1.84 billion; 2019-$1.93 billion; 2Q20 YTD-$1.22 billion Deposit growth: 2018-$1.1 billion; 2019-$358 million; 2Q20 YTD-$751 million Revenue growth: 2018-26%; 2019-11%; 2Q20YTD (over 2Q19YTD) -13% 1) The efficiency ratio is the ratio of noninterest expense to the sum of net interest income and noninterest income and excludes one-time items of income or expense. 2) Tangible common equity {also referred to as tangible book value or tangible equity) and tangible assets,are equal to common equity and assets,respectively,less $96.2 million of goodwill and intangibleassets as of June 30,2020.Averagetangibleequity is equal to average common equity less $96.7 million of average goodwilland intangible assets for 2020 YTD.We believe that this information is consistent with the treatment by bank regulatory agencies, which exclude intangible assets from the calculation of capital ratios. IiiFIRsTFouNDATION Copyright© 2020First Foundation Inc. All Rights Reserved 29 Growth Financial Highlights: As of for 2Q20 YTD |
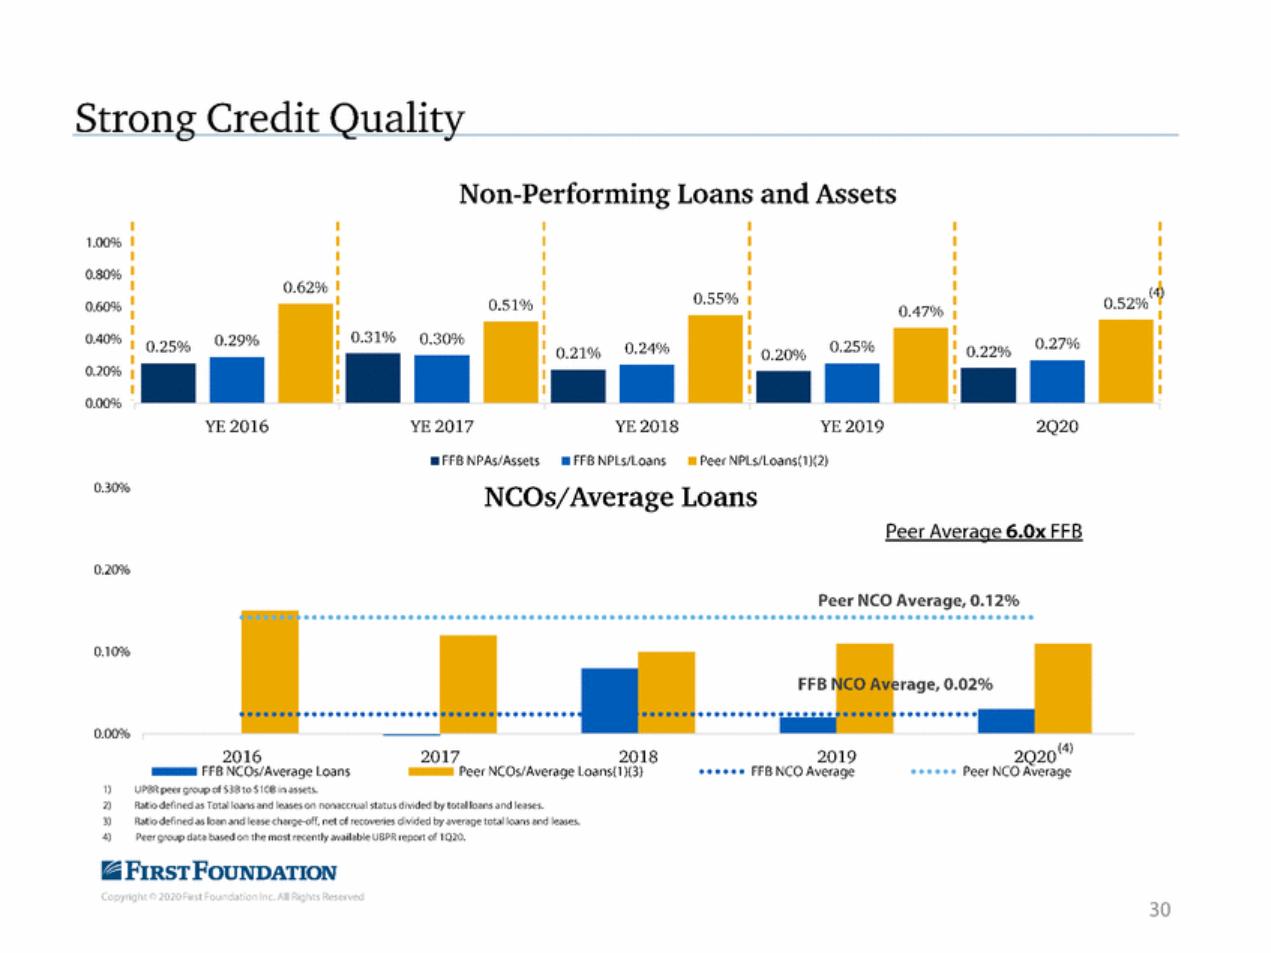
| Strong Credit Quality Non-Performing Loans and Assets 1.00% 0.80% 0.62% 0.55% 0.52%{'\) I I I I I I 0.60% 0.47% - -0.20% 0.40% 0.21% 0.24% 0.20% 0.00% YE 2016 YE2017 YE 2018 YE 2019 2Q20 •FFB NPAs/Assets•FFB NPLs/Loans•Peer NPLs/Loans{1){2) 0.30% NCOs/Average Loans Peer Average 6.0x FFB 0.20% Peer NCO Average, 0.12% ••••••••••••••••••••••••••••••••••••••••••••••••••••••••••••••••••••••••••••••••••••••••••• 0.10% FFB rage, 0.02% ................. 0.00% 2Q20{4) Peer NCO Average 2016 2017 2018 2019 FFB NCO Average - FFB NCOs/Average Loans - Peer NCOs/Average Loans{l){3) l) 2) 3) 4) UPBR peer group of $38 to S lO B in assets. Ratio defined as Total loans and leases on nonaccrual status d1v1ded by total loans and leases. Ratio defined as loan and l ease charge-off, net of recoveries divided by average total loans and leases. Peer group da t a based on the most recently available UBP R report of 1Q20. IiiFIRsTFouNDATION Copyright© 2020First Foundation Inc. All Rights Reserved 30 |
| |
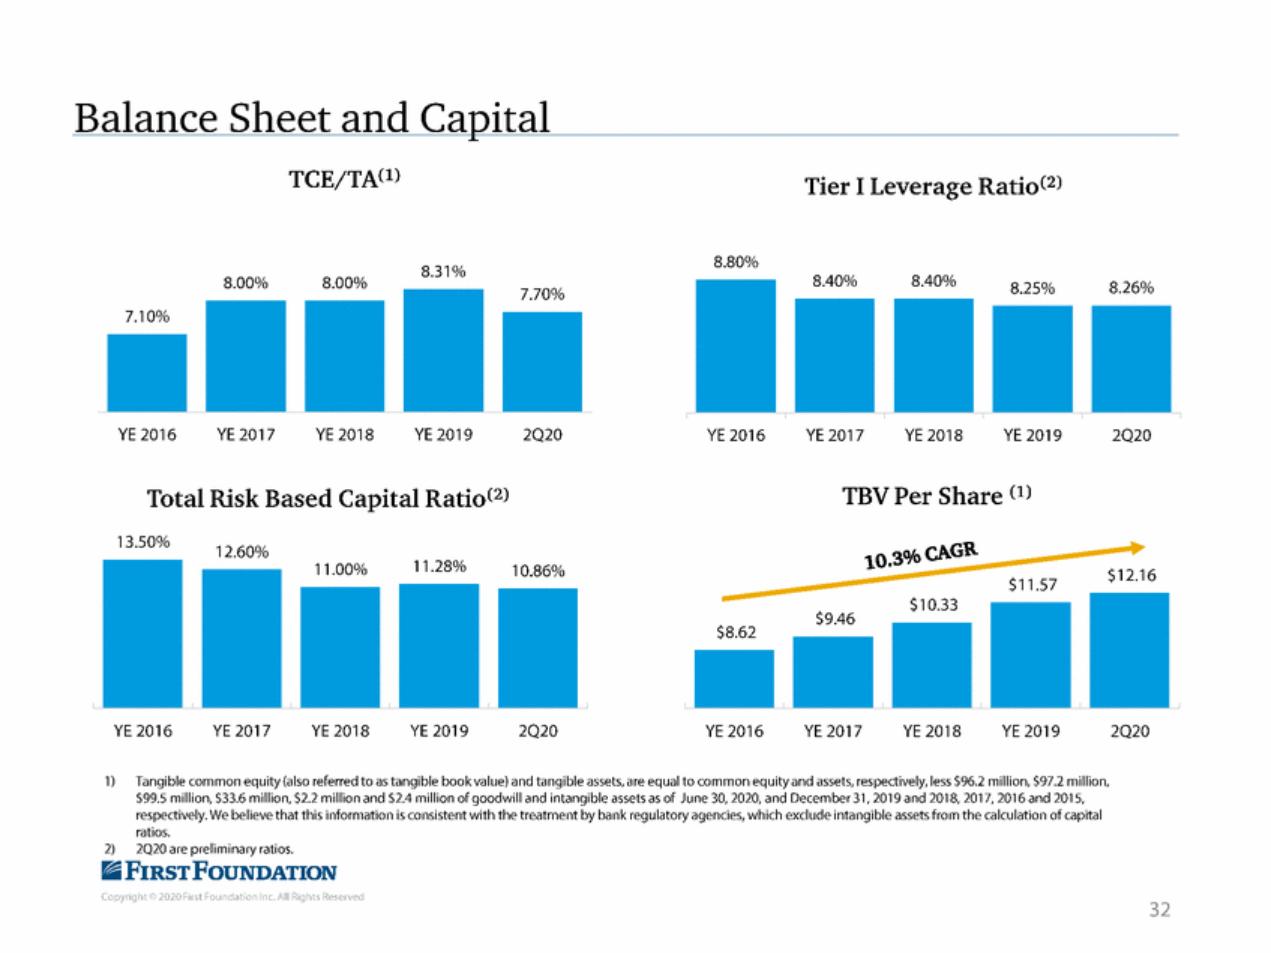
| Balance Sheet and Capital TCE/TACl) Tier I Leverage RatioC2) 8.80% 8.31o/o 8.40% 8.40% 8.00% 8.00% 8.25% 8.26% 7.70% 7.10% YE 2016 YE 2017 YE 2018 YE 2019 2Q20 YE 2016 YE 2017 YE 2018 YE 2019 2Q20 .. TBV Per Share Cl) Total Risk Based Capital RatioC2) 13.50% 12.60% 10.30/o CAGR - 11.28% 11.00% 10.86% $12.16 $11.57 $10.33 $9.46 $8.62 YE 2016 YE 2017 YE 2018 YE 2019 2Q20 YE 2016 YE 2017 YE 2018 YE 2019 2020 1) Tangible common equity (also referred to as tangible book value) and tangible assets,are equal to common equity and assets,respectively,less $96.2 million,$97.2 million, $99.5 million, $33.6 million,$2.2 million and $2.4 million of goodwill and intangible assets as of June 30,2020, and December31,2019 and 2018,2017, 2016 and 2015, respectively.We believe that this information is consistent with the treatment by bank regulatory agencies,which exclude intangible assets from the calculation of capital ratios. 2)2Q20 are preliminary ratios. IiiFIRsTFouNDATION Copyright© 2020First Foundation Inc. All Rights Reserved 32 |
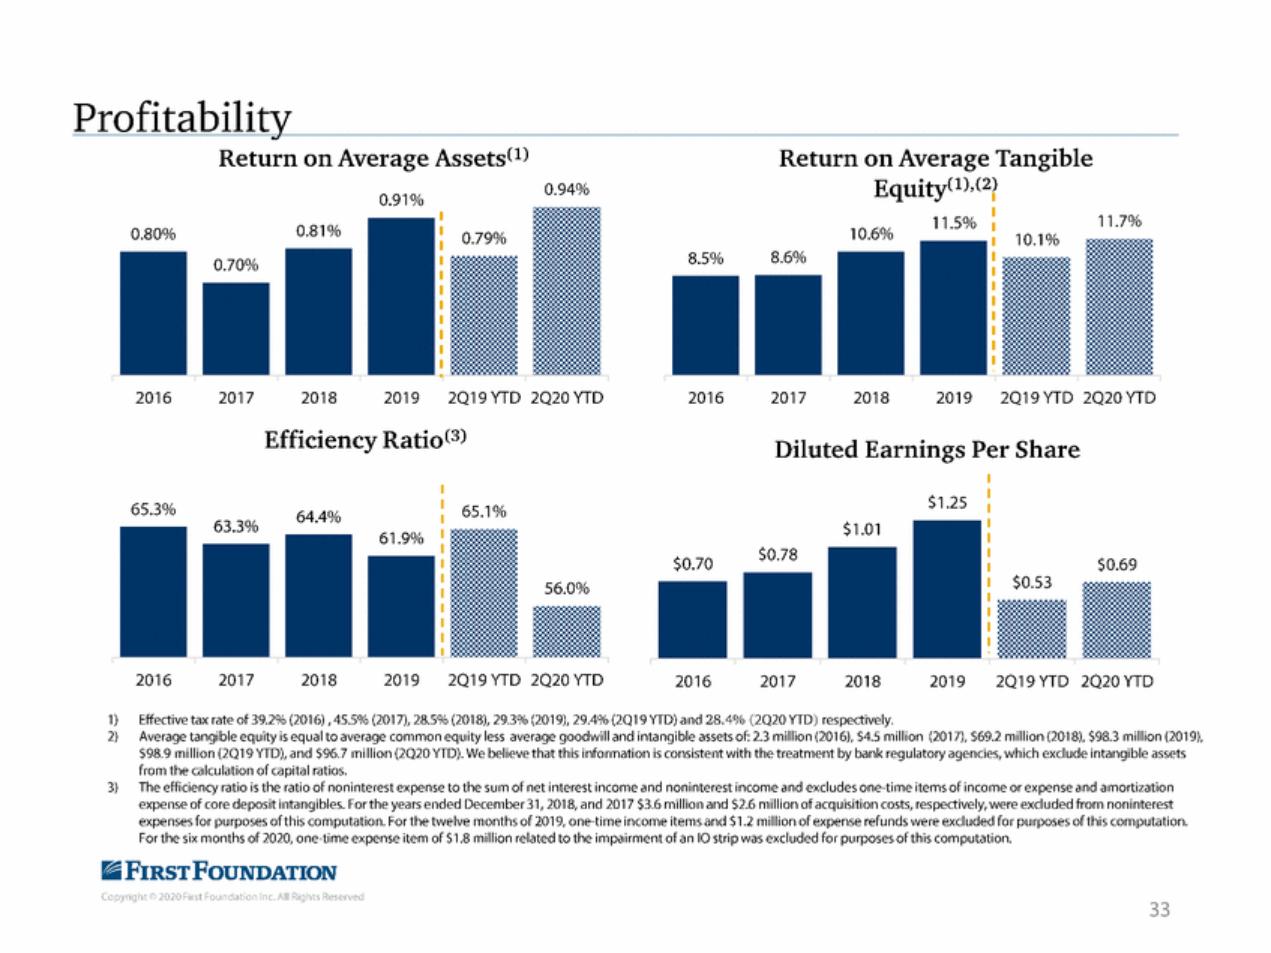
| Profitability Return on Average AssetsC1) 0.91o/o 0.81% Return on Average Tangible EquityO),C2 0.94% ' 11.7% 11.5% 0.80% 10.6% 8.6% 8.5% 0.70% 2016 2017 2018 2019 2Q19 YTD 2Q20 YTD 2016 2017 2018 2019 2Q19 YTD 2Q20 YTD Efficiency RatioC3) Diluted Earnings Per Share $1.25 65.3% 65.1% 64.4% 63.3% $1.01 $0.78 $0.70 $0.69 56.0% 2017 2Q19 YTD 2Q20 YTD 2Q19 YTD 2Q20 YTD 2016 2018 2019 2016 2017 2018 2019 1) 2) Effective tax rate of 39.2% (2016),45.5% (2017),28.5% (2018), 29.3% (2019), 29.4%(2Q19 YTD) and 28.4% (2Q20 YTD) respectively. Average tangible equity is equal to average common equity less average goodwill and intangible assets of:2.3 million {2016), $4.5 million (2017), $69.2 million (2018), $98.3 million (2019), $98.9 miIIion (2Q19 YTD),and $96.7 miIIion (2Q20 YTD).We believe that this information is consistent with the treatment by bank regulatory agencies,which exclude intangible assets from the calculation of capital ratios. The efficiency ratio is the ratio of noninterest expense to the sum of net interest income and noninterest income and excludes one time items of income or expense and amortization expense of core deposit intangibles.For the years ended December 31,2018,and 2017 $3.6 million and $2.6 million of acquisition costs,respectively,were excluded from noninterest expenses for purposes of this computation.For the twelve months of 2019, one time income items and $1.2 million of expense refunds were excluded for purposes of this computation. For the six months of 2020,one-time expense item of S1.8 million related to the impairment of an 10 strip was excluded for purposes ofthis computation. 3) IiiFIRsTFouNDATION Copyright© 2020First Foundation Inc. All Rights Reserved 33 |
| rFaIRST FoUNDATION firstfoundationinc.com IiiFIRsTFouNDATION Copyright© 2020First Foundation Inc. All Rights Reserved |