Attached files
| file | filename |
|---|---|
| 8-K - 8-K - CITRIX SYSTEMS INC | d25661d8k.htm |
Exhibit 99.1
2020 | Q2 Financials 1
|
Q2 Financials
2020
July 23, 2020
To Our Stakeholders
As the world settles into a new normal, business continuity remains top of mind for customers around the globe. Our second quarter results reflect strong on-going demand for secure, remote work environments and the high-performance delivery that Citrix solutions enable. We are continuing to accommodate customer needs and preferences as they work through this period
of global disruption and uncertainty.
Our second quarter highlights include:
ï,· Second quarter subscription ARR1 was $949 million, up 54% year-over-year, and SaaS ARR was $590 million, up 41% year-over-year
ï,· Subscription bookings as a percentage of total product bookings was 76%, up from 62% in the second quarter of 2019
ï,· Reported revenue was $799 million in the second quarter, up 7% year-over-year. For the second quarter, GAAP diluted EPS was $0.90, and non-GAAP diluted EPS2 was $1.53
ï,· Future committed revenue increased 19%, or approximately $425 million
year-over-year reflecting an increasing mix of subscription product bookings
ï,· Cash flow from operations was a record $419 million
ï,· Formalized an extensive go-to-market agreement and expanded strategic partnership
with Microsoft
Organizations around the world are discovering the value that technology combined with culture and policies which support flexible work models have
on their businesses. Even as companies start to formulate return-to-office plans and some geographies begin to re-open, more
employers view remote work as a viable alternative to returning to the office with social distancing measures.
1Annualized Recurring Revenue, or ARR, is an
operating metric that represents the contracted recurring value of all termed subscriptions normalized to a one-year period.
It is calculated at the end of a reporting period by taking each contract’s recurring total contract value and dividing by the length of the contract. ARR
includes only active contractually committed, fixed subscription fees. Our definition of ARR includes contracts expected to recur and therefore excludes contracts with durations of 12 months or less where licenses were issued to address
extraordinary business continuity events for our customers. All contracts are annualized, including 30 day offerings where we take monthly recurring revenue multiplied by 12 to annualize. ARR should be viewed independently of U.S. GAAP revenue,
deferred revenue and unbilled revenue and is not intended to be combined with or to replace those items. ARR is not a forecast of future revenue.
2A reconciliation
of GAAP to non-GAAP measures has been provided in the financial statement tables included in this letter. An explanation of these measures is also included below under the heading “Reconciliation of Non-GAAP Financial Measures to Comparable U.S. GAAP Measures.”
2020 | Q2 Financials
2
Pre-pandemic estimates of the prevalence of remote work vary. According to a March 2020 post by the Pew Research Center based on data from
the 2019 National Compensation Survey (NCS) published by the U.S. Bureau of Labor and Statistics,3 7% of U.S. private industry workers and 4% of state and local government workers had a flexible workplace prior to the
COVID-19 pandemic. The NCS illustrated that those benefitting from the ability to work remotely were predominantly “knowledge workers,” within certain occupational and industry groups, and
concentrated in larger companies. The highest concentration of those private industry workers with flexible workplace benefits were those in management, business and financial occupations (24%) and professional and related workers – like
lawyers, engineers, and scientists (14%).
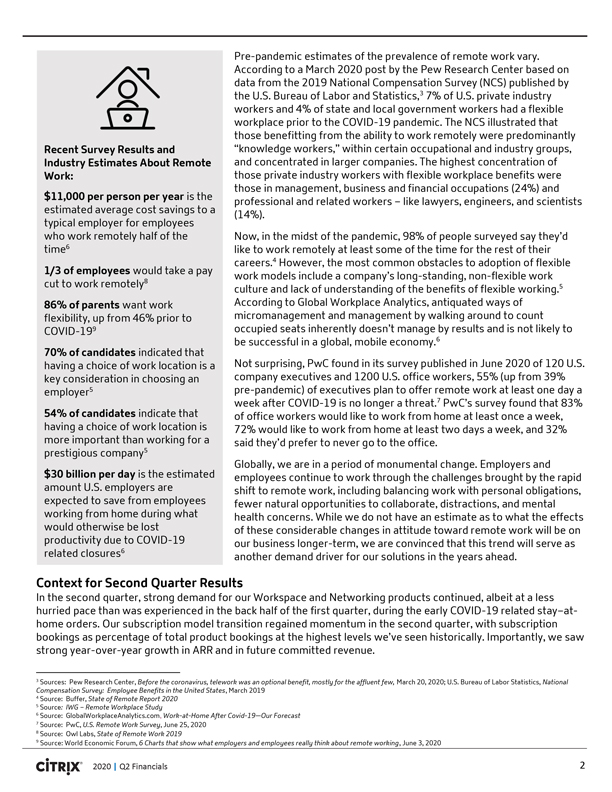
Recent Survey Results and Industry Estimates About Remote Work:
$11,000 per person per year is the estimated average cost savings to a typical employer for employees who work remotely half of the time6
1/3 of employees would take a pay cut to work remotely8
86% of parents want work flexibility,
up from 46% prior to COVID-199
70% of candidates indicated that having a choice of work location is a key consideration in
choosing an employer5
54% of candidates indicate that having a choice of work location is more important than working for a prestigious company5
$30 billion per day is the estimated amount U.S. employers are expected to save from employees working from home during what would otherwise be lost productivity due to COVID-19 related closures6
3 Sources: Pew Research Center, Before the coronavirus, telework was an optional benefit, mostly for
the affluent few, March 20, 2020; U.S. Bureau of Labor Statistics, National Compensation Survey: Employee Benefits in the United States, March 2019
4 Source:
Buffer, State of Remote Report 2020
5 Source: IWG – Remote Workplace Study
6 Source: GlobalWorkplaceAnalytics.com, Work-at-Home After Covid-19—Our Forecast
7 Source: PwC, U.S. Remote Work Survey, June 25, 2020
8 Source: Owl Labs, State of Remote Work 2019
9 Source: World Economic Forum, 6 Charts that
show what employers and employees really think about remote working, June 3, 2020
Now, in the midst of the pandemic, 98% of people surveyed say they’d
like to work remotely at least some of the time for the rest of their careers.4 However, the most common obstacles to adoption of flexible work models include a company’s long-standing, non-flexible work
culture and lack of understanding of the benefits of flexible working.5 According to Global Workplace Analytics, antiquated ways of micromanagement and management by walking around to count occupied seats inherently doesn’t manage by results
and is not likely to be successful in a global, mobile economy.6
Not surprising, PwC found in its survey published in June 2020 of 120 U.S. company executives and
1200 U.S. office workers, 55% (up from 39% pre-pandemic) of executives plan to offer remote work at least one day a week after COVID-19 is no longer a threat.7
PwC’s survey found that 83% of office workers would like to work from home at least once a week, 72% would like to work from home at least two days a week, and 32% said they’d prefer to never go to the office.
Globally, we are in a period of monumental change. Employers and employees continue to work through the challenges brought by the rapid shift to remote work, including balancing
work with personal obligations, fewer natural opportunities to collaborate, distractions, and mental health concerns. While we do not have an estimate as to what the effects of these considerable changes in attitude toward remote work will be on our
business longer-term, we are convinced that this trend will serve as another demand driver for our solutions in the years ahead.
Context for Second Quarter Results
In the second quarter, strong demand for our Workspace and Networking products continued, albeit at a less hurried pace than was experienced in the back half of
the first quarter, during the early COVID-19 related stay–at-home orders. Our subscription model transition regained momentum in the second quarter, with
subscription bookings as percentage of total product bookings at the highest levels we’ve seen historically. Importantly, we saw strong year-over-year growth in ARR and in future committed revenue.
2020 | Q2 Financials
3
The impact of the reaccelerated shift towards subscription in our model can be seen in declines in the Product and License as well as the Support and Services reported revenue
lines, more than offset by strength in Subscription revenue.
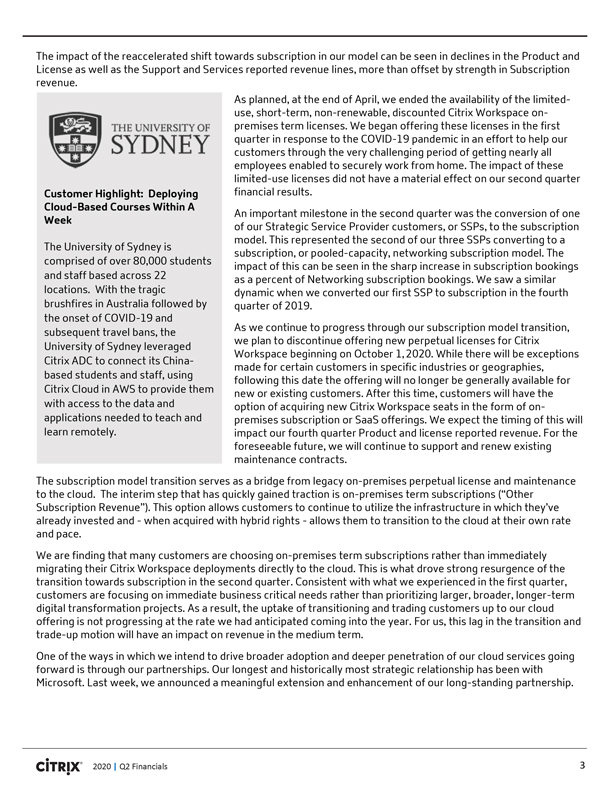
Customer Highlight: Deploying Cloud-Based Courses Within A Week
The University of Sydney is comprised of over 80,000 students and staff based across 22 locations. With the tragic brushfires in Australia followed by the onset of COVID-19 and subsequent travel bans, the University of Sydney leveraged Citrix ADC to connect its China-based students and staff, using Citrix Cloud in AWS to provide them with access to the data and applications
needed to teach and learn remotely.
As planned, at the end of April, we ended the availability of the limited-use,
short-term, non-renewable, discounted Citrix Workspace on-premises term licenses. We began offering these licenses in the first quarter in response to the COVID-19 pandemic in an effort to help our customers through the very challenging period of getting nearly all employees enabled to securely work from home. The impact of these
limited-use licenses did not have a material effect on our second quarter financial results.
An important milestone in the
second quarter was the conversion of one of our Strategic Service Provider customers, or SSPs, to the subscription model. This represented the second of our three SSPs converting to a subscription, or pooled-capacity, networking subscription model.
The impact of this can be seen in the sharp increase in subscription bookings as a percent of Networking subscription bookings. We saw a similar dynamic when we converted our first SSP to subscription in the fourth quarter of 2019.
As we continue to progress through our subscription model transition, we plan to discontinue offering new perpetual licenses for Citrix Workspace beginning on October 1, 2020.
While there will be exceptions made for certain customers in specific industries or geographies, following this date the offering will no longer be generally available for new or existing customers. After this time, customers will have the option of
acquiring new Citrix Workspace seats in the form of on-premises subscription or SaaS offerings. We expect the timing of this will impact our fourth quarter Product and license reported revenue. For the
foreseeable future, we will continue to support and renew existing maintenance contracts.
The subscription model transition serves as a bridge from legacy on-premises perpetual license and maintenance to the cloud. The interim step that has quickly gained traction is on-premises term subscriptions (“Other Subscription
Revenue”). This option allows customers to continue to utilize the infrastructure in which they’ve already invested and—when acquired with hybrid rights—allows them to transition to the cloud at their own rate and pace.
We are finding that many customers are choosing on-premises term subscriptions rather than immediately migrating their
Citrix Workspace deployments directly to the cloud. This is what drove strong resurgence of the transition towards subscription in the second quarter. Consistent with what we experienced in the first quarter, customers are focusing on immediate
business critical needs rather than prioritizing larger, broader, longer-term digital transformation projects. As a result, the uptake of transitioning and trading customers up to our cloud offering is not progressing at the rate we had anticipated
coming into the year. For us, this lag in the transition and trade-up motion will have an impact on revenue in the medium term.
One of the ways in which we intend to drive broader adoption and deeper penetration of our cloud services going forward is through our partnerships. Our longest and historically
most strategic relationship has been with Microsoft. Last week, we announced a meaningful extension and enhancement of our long-standing partnership.
2020 | Q2 Financials
4
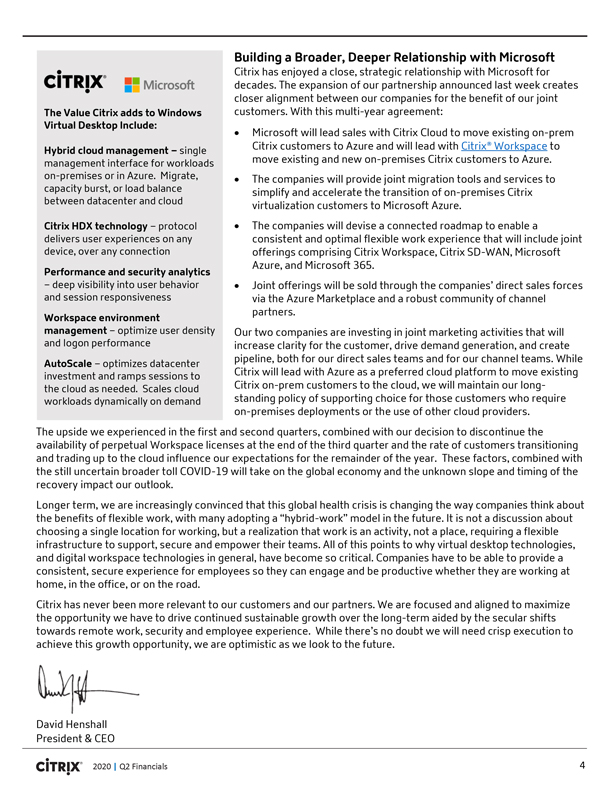
Building a Broader, Deeper Relationship with Microsoft
The Value Citrix adds to Windows
Virtual Desktop Include: Hybrid cloud management – single management interface for workloads on-premises or in Azure. Migrate, capacity burst, or load balance between datacenter and cloud
Citrix HDX technology – protocol delivers user experiences on any device, over any connection
Performance and security analytics – deep visibility into user behavior and session responsiveness
Workspace environment management – optimize user density and logon performance
AutoScale
– optimizes datacenter investment and ramps sessions to the cloud as needed. Scales cloud workloads dynamically on demand
Citrix has enjoyed a close,
strategic relationship with Microsoft for decades. The expansion of our partnership announced last week creates closer alignment between our companies for the benefit of our joint customers. With this multi-year agreement:
ï,· Microsoft will lead sales with Citrix Cloud to move existing on-prem Citrix customers to Azure and will lead with Citrix® Workspace to move existing and new on-premises Citrix customers to Azure.
ï,· The companies will provide joint migration tools and services to simplify
and accelerate the transition of on-premises Citrix virtualization customers to Microsoft Azure.
ï,· The
companies will devise a connected roadmap to enable a consistent and optimal flexible work experience that will include joint offerings comprising Citrix Workspace, Citrix SD-WAN, Microsoft Azure, and
Microsoft 365.
ï,· Joint offerings will be sold through the companies’ direct sales forces via the Azure Marketplace and a robust community of
channel partners.
Our two companies are investing in joint marketing activities that will increase clarity for the customer, drive demand generation, and create
pipeline, both for our direct sales teams and for our channel teams. While Citrix will lead with Azure as a preferred cloud platform to move existing Citrix on-prem customers to the cloud, we will maintain our long-standing policy of supporting
choice for those customers who require on-premises deployments or the use of other cloud providers.
The upside we
experienced in the first and second quarters, combined with our decision to discontinue the availability of perpetual Workspace licenses at the end of the third quarter and the rate of customers transitioning and trading up to the cloud influence
our expectations for the remainder of the year. These factors, combined with the still uncertain broader toll COVID-19 will take on the global economy and the unknown slope and timing of the recovery impact
our outlook. Longer term, we are increasingly convinced that this global health crisis is changing the way companies think about the benefits of flexible work, with many adopting a “hybrid-work” model in the future. It is not a discussion
about choosing a single location for working, but a realization that work is an activity, not a place, requiring a flexible infrastructure to support, secure and empower their teams. All of this points to why virtual desktop technologies, and
digital workspace technologies in general, have become so critical. Companies have to be able to provide a consistent, secure experience for employees so they can engage and be productive whether they are working at home, in the office, or on the
road.
Citrix has never been more relevant to our customers and our partners. We are focused and aligned to maximize the opportunity we have to drive continued
sustainable growth over the long-term aided by the secular shifts towards remote work, security and employee experience. While there’s no doubt we will need crisp execution to achieve this growth opportunity, we are optimistic as we look to the
future.
David Henshall
President & CEO
2020 | Q2 Financials
5
Financial Overview
Bookings
62%
59%
69%
55%
76%
2Q’19
3Q’19
4Q’19
1Q’20
2Q’20
Subscription as % of Total Product Bookings
ï,·
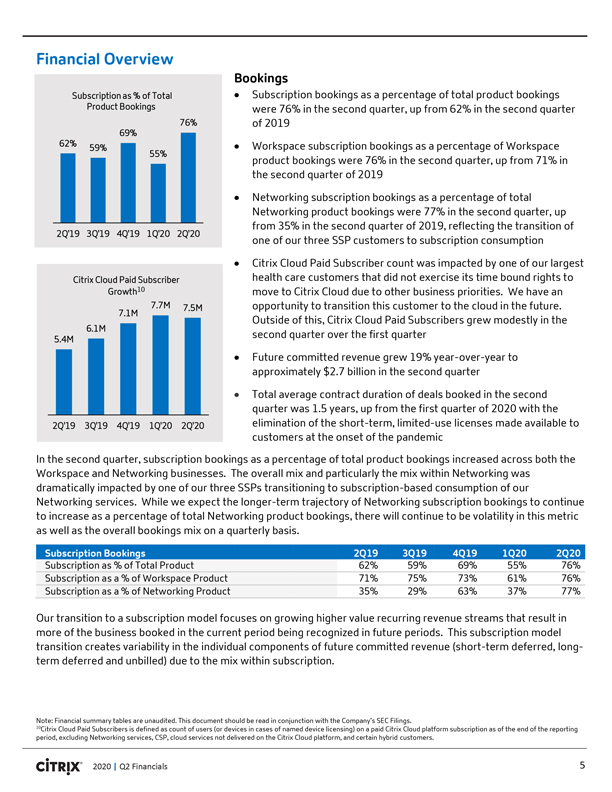
Subscription bookings as a percentage of total product bookings were 76% in the second quarter, up from 62% in the second quarter of 2019
ï,· Workspace
subscription bookings as a percentage of Workspace product bookings were 76% in the second quarter, up from 71% in the second quarter of 2019
ï,·
Networking subscription bookings as a percentage of total Networking product bookings were 77% in the second quarter, up from 35% in the second quarter of 2019, reflecting the transition of one of our three SSP customers to subscription consumption
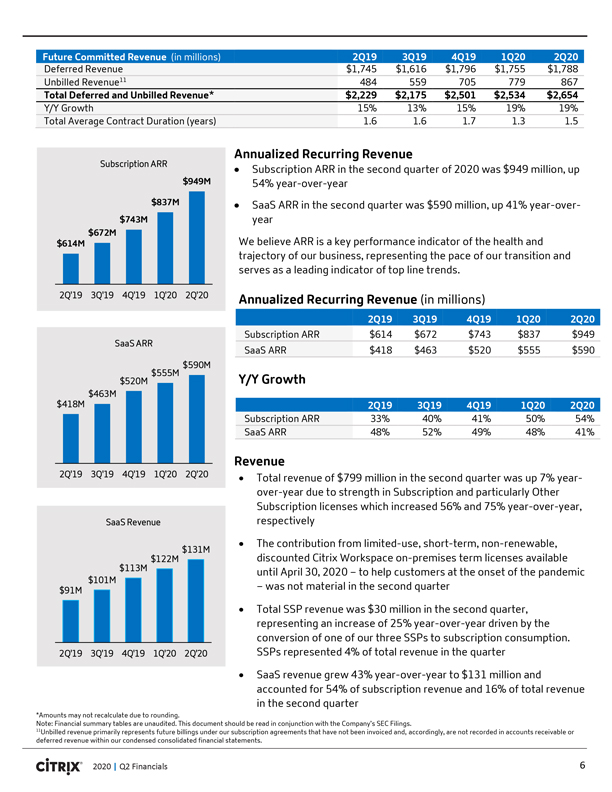
ï,· Citrix Cloud Paid Subscriber count was impacted by one of our largest health care customers that did not exercise its time bound rights to move to
Citrix Cloud due to other business priorities. We have an opportunity to transition this customer to the cloud in the future. Outside of this, Citrix Cloud Paid Subscribers grew modestly in the second quarter over the first quarter
5.4M
6.1M
7.1M
7.7M
7.5M
2Q’19
3Q’19
4Q’19
1Q’20
2Q’20
Citrix Cloud Paid Subscriber Growth10
ï,· Future committed revenue grew 19%
year-over-year to approximately $2.7 billion in the second quarter
ï,· Total average contract duration of deals booked in the second quarter was
1.5 years, up from the first quarter of 2020 with the elimination of the short-term, limited-use licenses made available to customers at the onset of the pandemic
In the second quarter, subscription bookings as a percentage of total product bookings increased across both the Workspace and Networking businesses. The overall mix and
particularly the mix within Networking was dramatically impacted by one of our three SSPs transitioning to subscription-based consumption of our Networking services. While we expect the longer-term trajectory of Networking subscription bookings to
continue to increase as a percentage of total Networking product bookings, there will continue to be volatility in this metric as well as the overall bookings mix on a quarterly basis.
Subscription as % of Total Product 62% 59% 69% 55% 76%
Subscription as
a % of Workspace Product 71% 75% 73% 61% 76%
Subscription as a % of Networking Product 35% 29% 63% 37% 77%
Note: Financial summary tables are unaudited. This document should be read in conjunction with the Company’s SEC Filings.
10Citrix Cloud Paid Subscribers is defined as count of users (or devices in cases of named device licensing) on a paid Citrix Cloud platform subscription as of the end of the
reporting period, excluding Networking services, CSP, cloud services not delivered on the Citrix Cloud platform, and certain hybrid customers.
Future Committed Revenue (in millions) 2Q19 3Q19 4Q19 1Q20 2Q20
Deferred Revenue $1,745 $1,616 $1,796 $1,755 $1,788 Unbilled Revenue11 484 559 705 779 867
Total Deferred and Unbilled Revenue* $2,229 $2,175 $2,501 $2,534 $2,654
Y/Y
Growth 15% 13% 15% 19% 19% Total Average Contract Duration (years) 1.6 1.6 1.7 1.3 1.5
Annualized Recurring Revenue
Subscription ARR
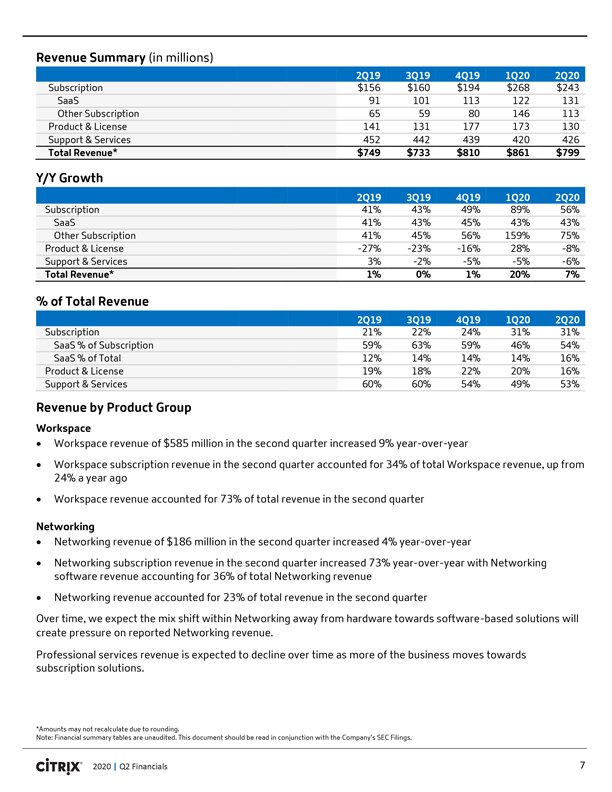
Subscription ARR in the second quarter of 2020 was $949 million, up
$949M
54% year-over-year $837M SaaS ARR in the second quarter was
$590 million, up 41% year-over-
$743M year $672M
$614M We believe ARR is a
key performance indicator of the health and trajectory of our business, representing the pace of our transition and serves as a leading indicator of top line trends.
2Q’19 3Q’19 4Q’19 1Q’20 2Q’20 Annualized Recurring Revenue (in millions)
2Q19 3Q19 4Q19 1Q20 2Q20
Subscription ARR $614 $672 $743 $837 $949 SaaS ARR SaaS ARR $418 $463
$520 $555 $590 $590M $555M
$520M Y/Y Growth
$463M $418M 2Q19 3Q19 4Q19 1Q20
2Q20
Subscription ARR 33% 40% 41% 50% 54% SaaS ARR 48% 52% 49% 48% 41%
Revenue
2Q’19 3Q’19 4Q’19 1Q’20 2Q’20 Total
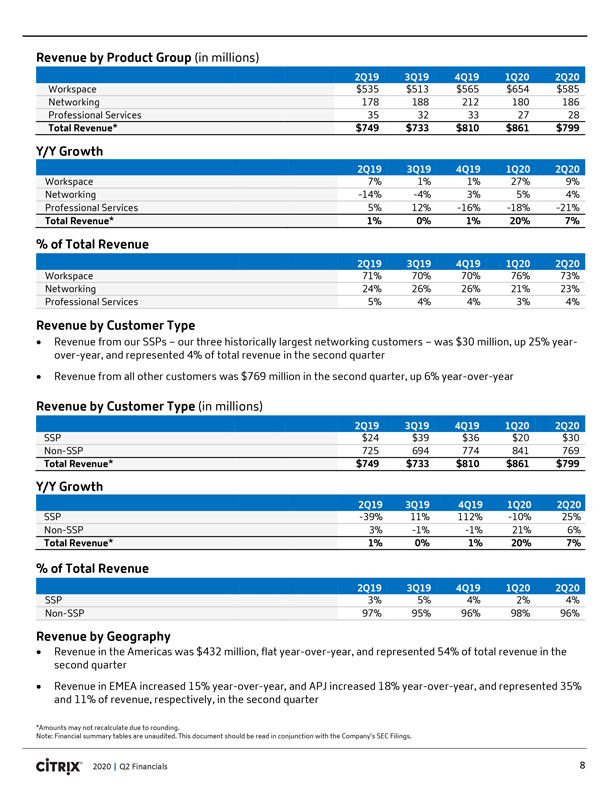
revenue of $799 million in the second quarter was up 7% year-over-year due to strength in Subscription and particularly Other Subscription licenses which increased 56% and 75% year-over-year, SaaS Revenue respectively The contribution from
limited-use, short-term, non-renewable, $131M discounted Citrix Workspace on-premises term licenses available
$122M
$113M until April 30, 2020 – to help customers at the onset of the pandemic
$101M
– was not material in the second quarter
$91M
Total SSP revenue was $30 million in the second quarter, representing an increase of 25% year-over-year driven by the conversion of one of our three SSPs to subscription
consumption.
2Q’19 3Q’19 4Q’19 1Q’20 2Q’20 SSPs represented 4% of total revenue in the quarter SaaS revenue grew 43%
year-over-year to $131 million and accounted for 54% of subscription revenue and 16% of total revenue in the second quarter
*Amounts may not recalculate due to
rounding.
Note: Financial summary tables are unaudited. This document should be read in conjunction with the Company’s SEC Filings.
11Unbilled revenue primarily represents future billings under our subscription agreements that have not been invoiced and, accordingly, are not recorded in accounts receivable or
deferred revenue within our condensed consolidated financial statements.
2020 | Q2 Financials 6
Revenue Summary (in millions)
2Q19 3Q19 4Q19 1Q20
2Q20
Subscription $156 $160 $194 $268 $243 SaaS 91 101 113 122 131 Other Subscription
65 59 80 146 113 Product & License 141 131 177 173 130 Support & Services 452 442 439 420 426
Total Revenue* $749 $733 $810 $861 $799
Y/Y Growth
2Q19 3Q19 4Q19 1Q20 2Q20
Subscription 41% 43% 49% 89% 56%
SaaS 41% 43% 45% 43% 43% Other Subscription 41% 45% 56% 159% 75% Product & License -27%
-23% -16% 28% -8% Support & Services 3% -2% -5% -5% -6%
Total
Revenue* 1% 0% 1% 20% 7%
% of Total Revenue
2Q19 3Q19
4Q19 1Q20 2Q20
Subscription 21% 22% 24% 31% 31% SaaS % of Subscription 59% 63% 59% 46% 54% SaaS % of
Total 12% 14% 14% 14% 16% Product & License 19% 18% 22% 20% 16% Support & Services
60% 60% 54% 49%
53%
Revenue by Product Group
Workspace
ï,· Workspace revenue of $585 million in the second quarter increased 9% year-over-year
ï,· Workspace subscription revenue in the second quarter accounted for 34% of total Workspace revenue, up from 24% a year ago
ï,· Workspace revenue accounted for 73% of total revenue in the second quarter
Networking
ï,· Networking revenue of $186 million in the
second quarter increased 4% year-over-year
ï,· Networking subscription revenue in the second quarter increased 73% year-over-year with Networking
software revenue accounting for 36% of total Networking revenue
ï,· Networking revenue accounted for 23% of total revenue in the second quarter Over
time, we expect the mix shift within Networking away from hardware towards software-based solutions will create pressure on reported Networking revenue.
Professional services revenue is expected to decline over time as more of the business moves towards subscription solutions.
*Amounts may not recalculate due to rounding.
Note: Financial summary tables are unaudited.
This document should be read in conjunction with the Company’s SEC Filings.
2020 | Q2 Financials 7
Revenue by Product Group (in millions)
2Q19 3Q19 4Q19 1Q20 2Q20
Workspace $535 $513 $565 $654 $585
Networking 178 188 212 180 186 Professional Services 35 32 33 27 28
Total Revenue* $749 $733
$810 $861 $799
Y/Y Growth
2Q19 3Q19 4Q19 1Q20 2Q20
Workspace 7% 1% 1% 27% 9% Networking -14% -4% 3% 5%
4% Professional Services 5% 12% -16% -18% -21%
Total Revenue* 1% 0% 1% 20% 7%
% of Total Revenue
2Q19 3Q19 4Q19 1Q20 2Q20
Workspace 71% 70% 70% 76% 73%
Networking 24% 26% 26% 21% 23% Professional Services 5% 4% 4% 3% 4%
Revenue by Customer Type
ï,· Revenue from our SSPs – our three historically largest networking customers – was $30 million, up 25% year-over-year, and represented 4% of total
revenue in the second
quarter
ï,·
Revenue from all other customers was $769 million in the second quarter, up 6% year-over-year
Revenue by Customer Type (in millions)
2Q19 3Q19 4Q19 1Q20 2Q20
SSP $24 $39 $36 $20 $30 Non-SSP 725 694 774 841 769
Total Revenue* $749 $733 $810 $861 $799
Y/Y Growth
2Q19 3Q19 4Q19 1Q20 2Q20
SSP -39% 11% 112% -10% 25% Non-SSP 3% -1% -1% 21% 6%
Total Revenue* 1% 0% 1% 20% 7%
% of Total Revenue
2Q19 3Q19 4Q19 1Q20 2Q20
SSP 3% 5% 4% 2% 4% Non-SSP 97% 95% 96% 98% 96%
Revenue by Geography
ï,· Revenue in the Americas was $432 million, flat year-over-year, and represented 54% of total revenue in the second quarter
ï,· Revenue in EMEA increased 15% year-over-year, and APJ increased 18% year-over-year, and represented 35% and 11% of revenue, respectively, in the second quarter
*Amounts may not recalculate due to rounding.
Note: Financial summary tables
are unaudited. This document should be read in conjunction with the Company’s SEC Filings.
2020 | Q2 Financials 8
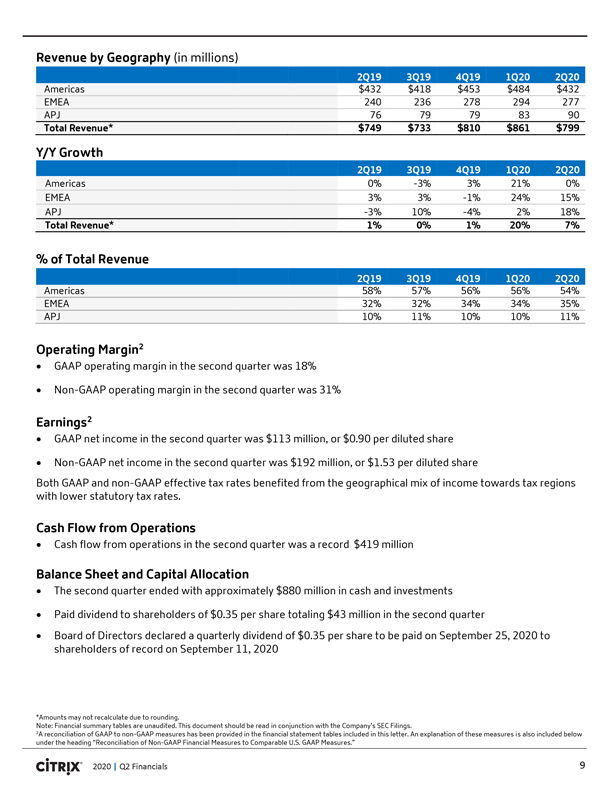
Revenue by Geography (in millions)
2Q19 3Q19 4Q19
1Q20 2Q20
Americas $432 $418 $453 $484 $432 EMEA 240 236 278 294 277 APJ 76 79 79 83 90
Total Revenue* $749 $733 $810 $861 $799
Y/Y Growth
2Q19 3Q19 4Q19 1Q20 2Q20
Americas 0% -3% 3% 21% 0% EMEA 3% 3% -1% 24% 15% APJ -3% 10%
-4% 2% 18%
Total Revenue* 1% 0% 1% 20% 7%
% of Total Revenue
2Q19 3Q19 4Q19 1Q20 2Q20
Americas 58% 57% 56% 56% 54% EMEA 32% 32% 34% 34% 35% APJ 10% 11% 10% 10% 11%
Operating Margin2
ï,· GAAP operating margin in the second quarter was 18%
ï,· Non-GAAP operating margin in the second quarter was 31%
Earnings2
ï,· GAAP net income in the second quarter was $113 million, or $0.90 per diluted share ï,· Non-GAAP net income
in the second quarter was $192 million, or $1.53 per diluted share
Both GAAP and non-GAAP effective tax rates
benefited from the geographical mix of income towards tax regions with lower statutory tax rates.
Cash Flow from Operations
ï,· Cash flow from operations in the second quarter was a record $419 million
Balance Sheet and Capital Allocation
ï,· The second quarter ended
with approximately $880 million in cash and investments ï,· Paid dividend to shareholders of $0.35 per share totaling $43 million in the second quarter
ï,· Board of Directors declared a quarterly dividend of $0.35 per share to be paid on September 25, 2020 to shareholders of record on September 11, 2020
*Amounts may not recalculate due to rounding.
Note: Financial summary tables
are unaudited. This document should be read in conjunction with the Company’s SEC Filings.
2A reconciliation of GAAP to
non-GAAP measures has been provided in the financial statement tables included in this letter. An explanation of these measures is also included below under the heading “Reconciliation of Non-GAAP Financial Measures to Comparable U.S. GAAP Measures.”
2020 | Q2 Financials 9
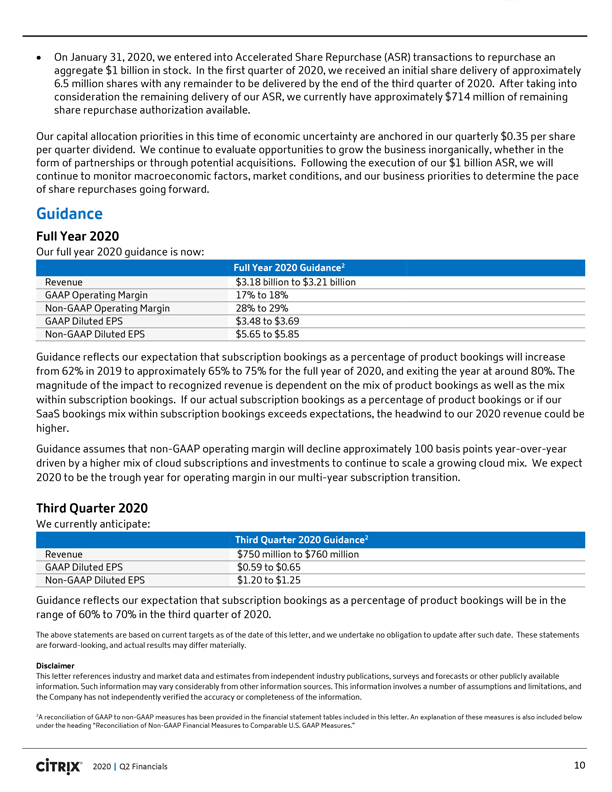
On January 31, 2020, we entered into Accelerated Share Repurchase (ASR) transactions to repurchase an aggregate $1 billion in stock. In
the first quarter of 2020, we received an initial share delivery of approximately 6.5 million shares with any remainder to be delivered by the end of the third quarter of 2020. After taking into consideration the remaining delivery of our ASR, we
currently have approximately $714 million of remaining share repurchase authorization available. Our capital allocation priorities in this time of economic uncertainty are anchored in our quarterly $0.35 per share per quarter dividend. We continue
to evaluate opportunities to grow the business inorganically, whether in the form of partnerships or through potential acquisitions. Following the execution of our $1 billion ASR, we will continue to monitor macroeconomic factors, market conditions,
and our business priorities to determine the pace of share repurchases going forward. Guidance Full Year 2020 Our full year 2020 guidance is now: Full Year 2020 Guidance2 Revenue $3.18 billion to $3.21 billion GAAP Operating Margin 17% to 18%
Non-GAAP Operating Margin 28% to 29% GAAP Diluted EPS $3.48 to $3.69 Non-GAAP Diluted EPS $5.65 to $5.85 Guidance reflects our expectation that subscription bookings as a percentage of product bookings will increase from 62% in 2019 to approximately
65% to 75% for the full year of 2020, and exiting the year at around 80%. The magnitude of the impact to recognized revenue is dependent on the mix of product bookings as well as the mix within subscription bookings. If our actual subscription
bookings as a percentage of product bookings or if our SaaS bookings mix within subscription bookings exceeds expectations, the headwind to our 2020 revenue could be higher. Guidance assumes that non-GAAP operating margin will decline approximately
100 basis points year-over-year driven by a higher mix of cloud subscriptions and investments to continue to scale a growing cloud mix. We expect 2020 to be the trough year for operating margin in our multi-year subscription transition. Third
Quarter 2020 We currently anticipate: Third Quarter 2020 Guidance2 Revenue $750 million to $760 million GAAP Diluted EPS $0.59 to $0.65 Non-GAAP Diluted EPS $1.20 to $1.25 Guidance reflects our expectation that subscription bookings as a percentage
of product bookings will be in the range of 60% to 70% in the third quarter of 2020. The above statements are based on current targets as of the date of this letter, and we undertake no obligation to update after such date. These statements are
forward-looking, and actual results may differ materially. Disclaimer This letter references industry and market data and estimates from independent industry publications, surveys and forecasts or other publicly available information. Such
information may vary considerably from other information sources. This information involves a number of assumptions and limitations, and the Company has not independently verified the accuracy or completeness of the information. 2A reconciliation of
GAAP to non-GAAP measures has been provided in the financial statement tables included in this letter. An explanation of these measures is also included below under the heading “Reconciliation of Non-GAAP Financial Measures to Comparable U.S.
GAAP Measures.”
2020 | Q2 Financials 10
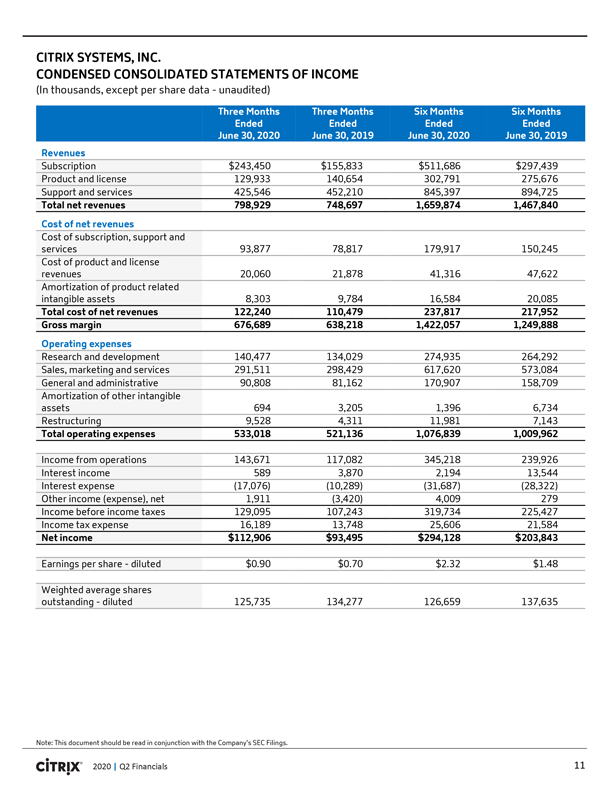
CITRIX SYSTEMS, INC.
CONDENSED CONSOLIDATED
STATEMENTS OF INCOME
(In thousands, except per share data—unaudited)
Three Months Three Months Six
Months Six
Months Ended
Ended
Ended
Ended
June 30, 2020 June 30, 2019 June 30, 2020 June 30, 2019
Revenues
Subscription $243,450 $155,833 $511,686 $297,439 Product and license 129,933 140,654 302,791 275,676 Support and services 425,546 452,210 845,397 894,725
Total net revenues 798,929 748,697 1,659,874 1,467,840
Cost of net revenues
Cost of subscription, support and services 93,877 78,817 179,917 150,245 Cost of product and license revenues 20,060 21,878 41,316 47,622 Amortization of product
related intangible assets 8,303 9,784 16,584 20,085
Total cost of net revenues 122,240 110,479 237,817 217,952 Gross margin 676,689 638,218 1,422,057 1,249,888
Operating expenses
Research and development 140,477 134,029 274,935 264,292
Sales, marketing and services 291,511 298,429 617,620 573,084 General and administrative 90,808 81,162 170,907 158,709 Amortization of other intangible assets 694 3,205 1,396 6,734 Restructuring 9,528 4,311 11,981 7,143
Total operating expenses 533,018 521,136 1,076,839 1,009,962
Income from operations 143,671
117,082 345,218 239,926 Interest income 589 3,870 2,194 13,544 Interest expense (17,076) (10,289) (31,687) (28,322) Other income (expense), net 1,911 (3,420) 4,009 279 Income before income taxes 129,095 107,243 319,734 225,427 Income tax expense
16,189 13,748 25,606 21,584
Net income $112,906 $93,495 $294,128 $203,843
Earnings per share—diluted $0.90 $0.70 $2.32 $1.48
Weighted average
shares outstanding—diluted 125,735 134,277 126,659 137,635
Note: This document should be read in conjunction with the Company’s SEC Filings.
2020 | Q2 Financials 11
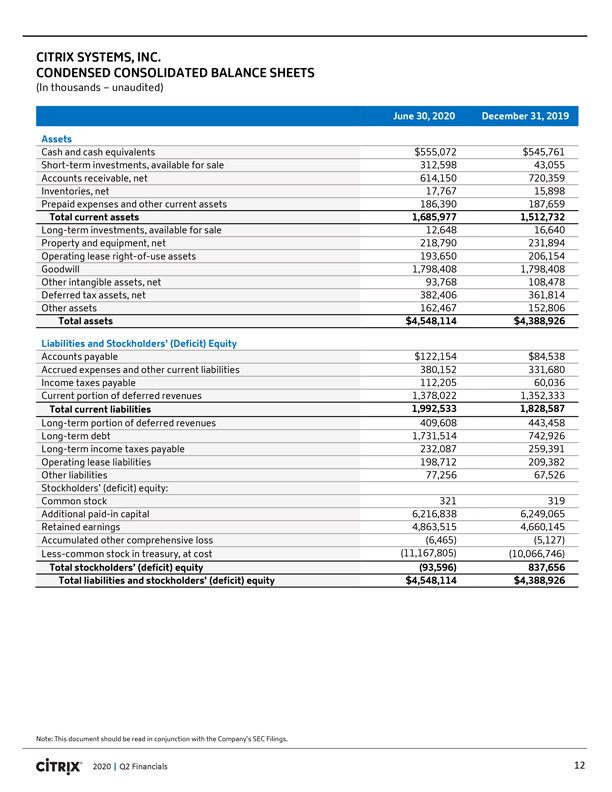
CITRIX SYSTEMS, INC.
CONDENSED CONSOLIDATED
BALANCE SHEETS
(In thousands – unaudited)
June 30, 2020
December 31, 2019
Assets
Cash and cash equivalents $555,072 $545,761
Short-term investments, available for sale 312,598 43,055 Accounts receivable, net 614,150 720,359 Inventories, net 17,767 15,898 Prepaid expenses and other current assets 186,390 187,659
Total current assets 1,685,977 1,512,732
Long-term investments, available for sale 12,648
16,640 Property and equipment, net 218,790 231,894 Operating lease right-of-use assets 193,650 206,154 Goodwill 1,798,408 1,798,408 Other intangible assets, net 93,768
108,478 Deferred tax assets, net 382,406 361,814 Other assets 162,467 152,806
Total assets $4,548,114 $4,388,926
Liabilities and Stockholders’ (Deficit) Equity
Accounts payable $122,154 $84,538 Accrued
expenses and other current liabilities 380,152 331,680 Income taxes payable 112,205 60,036 Current portion of deferred revenues 1,378,022 1,352,333
Total current
liabilities 1,992,533 1,828,587
Long-term portion of deferred revenues 409,608 443,458 Long-term debt 1,731,514 742,926 Long-term income taxes payable 232,087
259,391 Operating lease liabilities 198,712 209,382 Other liabilities 77,256 67,526 Stockholders’ (deficit) equity: Common stock 321 319 Additional paid-in capital 6,216,838
6,249,065 Retained earnings 4,863,515 4,660,145 Accumulated other comprehensive loss (6,465) (5,127) Less-common stock in treasury, at cost (11,167,805) (10,066,746)
Total stockholders’ (deficit) equity (93,596) 837,656 Total liabilities and stockholders’ (deficit) equity $4,548,114 $4,388,926
12
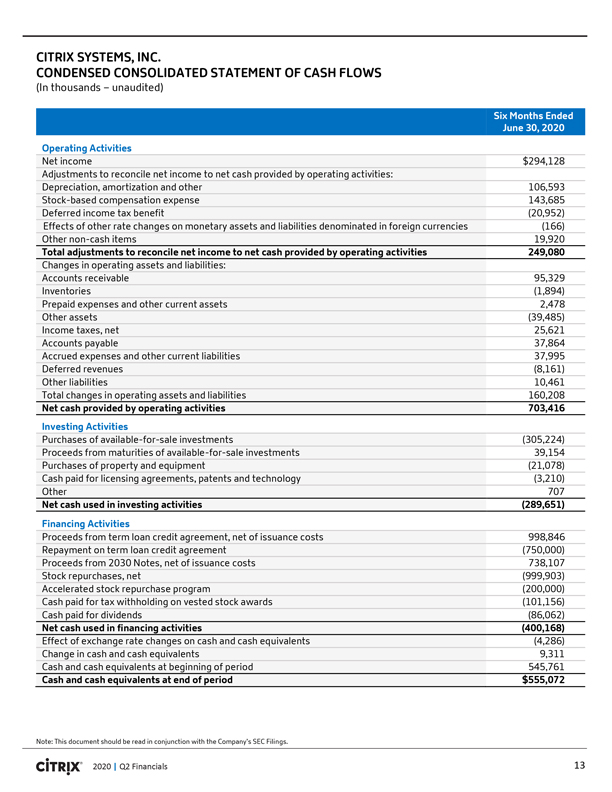
CITRIX SYSTEMS, INC.
CONDENSED CONSOLIDATED
STATEMENT OF CASH FLOWS
(In thousands – unaudited)
Six Months Ended
June 30, 2020
Operating Activities
Net income $294,128 Adjustments to
reconcile net income to net cash provided by operating activities: Depreciation, amortization and other 106,593 Stock-based compensation expense 143,685 Deferred income tax benefit (20,952) Effects of other rate changes on monetary assets and
liabilities denominated in foreign currencies (166) Other non-cash items 19,920
Total adjustments to reconcile net
income to net cash provided by operating activities 249,080
Changes in operating assets and liabilities: Accounts receivable 95,329 Inventories (1,894) Prepaid
expenses and other current assets 2,478 Other assets (39,485) Income taxes, net 25,621 Accounts payable 37,864 Accrued expenses and other current liabilities 37,995 Deferred revenues (8,161) Other liabilities 10,461 Total changes in operating assets
and liabilities 160,208
Net cash provided by operating activities 703,416
Investing Activities
Purchases of available-for-sale investments (305,224) Proceeds from maturities of available-for-sale investments 39,154 Purchases of property
and equipment (21,078) Cash paid for licensing agreements, patents and technology (3,210) Other 707
Net cash used in investing activities (289,651)
Financing Activities
Proceeds from term loan credit agreement, net of issuance costs 998,846
Repayment on term loan credit agreement (750,000) Proceeds from 2030 Notes, net of issuance costs 738,107 Stock repurchases, net (999,903) Accelerated stock repurchase program (200,000) Cash paid for tax withholding on vested stock awards (101,156)
Cash paid for dividends (86,062)
Net cash used in financing activities (400,168)
Effect of exchange rate changes on cash and cash equivalents (4,286) Change in cash and cash equivalents 9,311 Cash and cash equivalents at beginning of period 545,761
Cash and cash equivalents at end of period $555,072
Note: This document should be read in
conjunction with the Company’s SEC Filings.
2020 | Q2 Financials 13
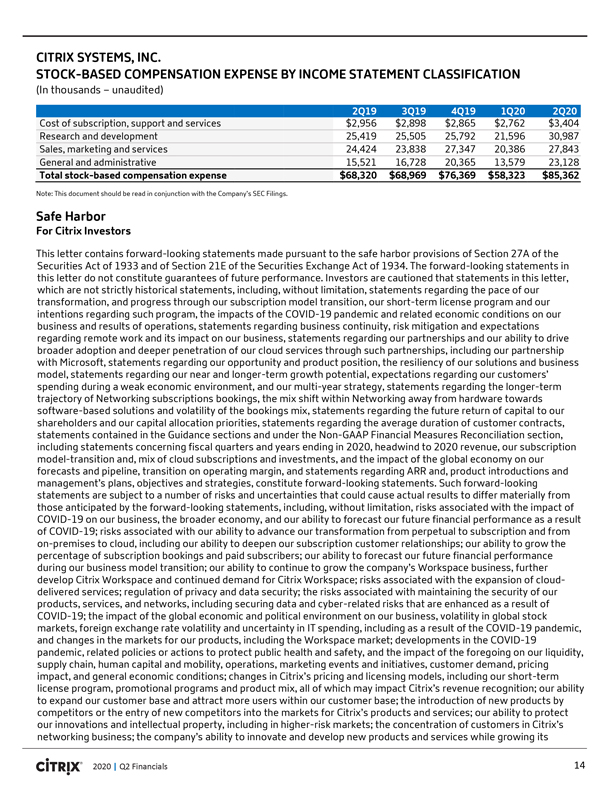
CITRIX SYSTEMS, INC.
STOCK-BASED COMPENSATION
EXPENSE BY INCOME STATEMENT CLASSIFICATION
(In thousands – unaudited)
2Q19 3Q19 4Q19 1Q20 2Q20
Cost of subscription, support and services $2,956 $2,898 $2,865 $2,762 $3,404 Research and development 25,419 25,505 25,792 21,596
30,987 Sales, marketing and services 24,424 23,838 27,347 20,386 27,843 General and administrative 15,521 16,728 20,365 13,579 23,128
Total stock-based compensation expense $68,320 $68,969 $76,369 $58,323 $85,362
Note: This document should be read in conjunction with the Company’s SEC Filings.
Safe
Harbor
For Citrix Investors
This letter contains forward-looking statements
made pursuant to the safe harbor provisions of Section 27A of the Securities Act of 1933 and of Section 21E of the Securities Exchange Act of 1934. The forward-looking statements in this letter do not constitute guarantees of future
performance. Investors are cautioned that statements in this letter, which are not strictly historical statements, including, without limitation, statements regarding the pace of our transformation, and progress through our subscription model
transition, our short-term license program and our intentions regarding such program, the impacts of the COVID-19 pandemic and related economic conditions on our business and results of operations, statements
regarding business continuity, risk mitigation and expectations regarding remote work and its impact on our business, statements regarding our partnerships and our ability to drive broader adoption and deeper penetration of our cloud services
through such partnerships, including our partnership with Microsoft, statements regarding our opportunity and product position, the resiliency of our solutions and business model, statements regarding our near and longer-term growth potential,
expectations regarding our customers’ spending during a weak economic environment, and our multi-year strategy, statements regarding the longer-term trajectory of Networking subscriptions bookings, the mix shift within Networking away from
hardware towards software-based solutions and volatility of the bookings mix, statements regarding the future return of capital to our shareholders and our capital allocation priorities, statements regarding the average duration of customer
contracts, statements contained in the Guidance sections and under the Non-GAAP Financial Measures Reconciliation section, including statements concerning fiscal quarters and years ending in 2020, headwind to
2020 revenue, our subscription model-transition and, mix of cloud subscriptions and investments, and the impact of the global economy on our forecasts and pipeline, transition on operating margin, and statements regarding ARR and, product
introductions and management’s plans, objectives and strategies, constitute forward-looking statements. Such forward-looking statements are subject to a number of risks and uncertainties that could cause actual results to differ materially from
those anticipated by the forward-looking statements, including, without limitation, risks associated with the impact of COVID-19 on our business, the broader economy, and our ability to forecast our future
financial performance as a result of COVID-19; risks associated with our ability to advance our transformation from perpetual to subscription and from on-premises to
cloud, including our ability to deepen our subscription customer relationships; our ability to grow the percentage of subscription bookings and paid subscribers; our ability to forecast our future financial performance during our business model
transition; our ability to continue to grow the company’s Workspace business, further develop Citrix Workspace and continued demand for Citrix Workspace; risks associated with the expansion of cloud-delivered services; regulation of privacy and
data security; the risks associated with maintaining the security of our products, services, and networks, including securing data and cyber-related risks that are enhanced as a result of COVID-19; the impact
of the global economic and political environment on our business, volatility in global stock markets, foreign exchange rate volatility and uncertainty in IT spending, including as a result of the COVID-19
pandemic, and changes in the markets for our products, including the Workspace market; developments in the COVID-19 pandemic, related policies or actions to protect public health and safety, and the impact of
the foregoing on our liquidity, supply chain, human capital and mobility, operations, marketing events and initiatives, customer demand, pricing impact, and general
economic conditions; changes in Citrix’s pricing and licensing models, including our short-term license program, promotional programs and product mix, all of
which may impact Citrix’s revenue recognition; our ability to expand our customer base and attract more users within our customer base; the introduction of new products by competitors or the entry of new competitors into the markets for
Citrix’s products and services; our ability to protect our innovations and intellectual property, including in higher-risk markets; the concentration of customers in Citrix’s networking business; the company’s ability to innovate and
develop new products and services while growing its
2020 | Q2 Financials 14
established virtualization and networking products and services; changes in our revenue mix towards products and services with lower
gross margins; seasonal fluctuations in the company’s business; failure to execute Citrix’s sales and marketing plans; failure to successfully partner with key distributors, resellers, system integrators, service providers and strategic
partners, such as Microsoft; transitions in key personnel and succession risk; the company’s ability to maintain and expand its business in large enterprise accounts and reliance on large service provider customers; the size, timing and
recognition of revenue from significant orders; the success of investments in its product groups, foreign operations and vertical and geographic markets; the ability of Citrix to make suitable acquisitions on favorable terms in the future; risks
associated with Citrix’s acquisitions and divestitures, including failure to further develop and successfully market the technology and products of acquired companies, failure to achieve or maintain anticipated revenues and operating
performance contributions from acquisitions, which could dilute earnings; the recruitment and retention of qualified employees; bankruptcies, insolvencies or other economic conditions that limit our customers’ ability to pay for our services or
limit the ability for us to collect payments, including unbilled revenue, which may be enhanced as a result of the COVID-19 pandemic; risks in effectively controlling operating expenses, and our ability to
improve our operating margin; ability to effectively manage our capital structure and the impact of related changes on our operating results and financial condition; the effect of new accounting pronouncements on revenue and expense recognition;
failure to comply with federal, state and international regulations; litigation and disputes, including challenges to our intellectual property rights or allegations of infringement of the intellectual property rights of others; the ability to
maintain and protect our collection of brands; charges in the event of a write-off or impairment of acquired assets, underperforming businesses, investments or licenses; international market readiness,
execution and other risks associated with the markets for Citrix’s products and services; risks related to servicing our debt; risks of political uncertainty, and social turmoil and pandemics, including
COVID-19; and other risks detailed in Citrix’s filings with the Securities and Exchange
Commission. Citrix assumes no
obligation to update any forward-looking information contained in this letter or with respect to the announcements described herein.
Reconciliation of Non-GAAP Financial Measures to Comparable U.S. GAAP Measures (Unaudited)
Pursuant to the requirements of Regulation G, the
Company has provided a reconciliation of each non-GAAP financial measure used in this letter and related conference call or webcast to the most directly comparable GAAP financial measure. These measures differ
from GAAP in that they exclude amortization primarily related to acquired intangible assets, stock-based compensation expenses and charges associated with the Company’s restructuring programs, and the related tax effect of those items. The
income tax effect on non-GAAP items is calculated based upon the tax laws and statutory income tax rates applicable in the tax jurisdiction(s) of the underlying non-GAAP
adjustment. The
Company’s basis for these adjustments is described below.
Management uses these non-GAAP measures for internal reporting and forecasting purposes, when publicly providing its
business outlook, to evaluate the Company’s performance and to evaluate and compensate the Company’s executives. The Company has provided these non-GAAP financial measures in addition to GAAP
financial results because it believes that these non-GAAP financial measures provide useful information to certain investors and financial analysts for comparison across accounting periods not influenced by
certain non-cash items or cash charges that are the result of discrete activities that are not used by management when evaluating the Company’s historical and prospective financial performance. In
addition, the Company has historically provided this or similar information and understands that some investors and financial analysts find this information helpful in analyzing the Company’s operating margins, operating expenses and net income
and comparing the Company’s financial performance to that of its peer companies and competitors. Management typically excludes the amounts described above when evaluating the Company’s operating performance and believes that the resulting non-GAAP measures are useful to investors and financial analysts in assessing the Company’s operating performance due to the following factors:
ï,· The Company does not acquire businesses on a predictable cycle. The Company, therefore, believes that the presentation of
non-GAAP measures that adjust for the impact of amortization of intangible assets and stock-
based compensation expenses
and the related tax effects that are primarily related to acquisitions, provide investors and financial analysts with a consistent basis for comparison across accounting periods and, therefore, are useful to investors and financial analysts in
helping them to better understand the Company’s operating results and underlying operational trends. 2020 | Q2 Financials
15
ï,· Amortization of intangible assets and the related tax effects are fixed at the time of an acquisition, are then
amortized over a period of several years after the acquisition and generally cannot be changed or influenced by management after the acquisition.
ï,·
Although stock-based compensation is an important aspect of the compensation of the Company’s employees and executives, stock-based compensation expense is generally fixed at the time of grant, then amortized over a period of several years
after the grant of the stock-based instrument, and generally cannot be changed or influenced by management after the grant.
ï,· The Company has engaged
in various restructuring activities over the past several years that have resulted in costs associated with reductions in headcount, consolidation of leased facilities and related costs. Each restructuring activity has been a discrete event based on
a unique set of business objectives or circumstances, and each has differed from the others in terms of its operational implementation, business impact and scope. While the
Company’s operations previously benefited from the employees and facilities covered by the various restructuring charges, these employees and facilities have benefited
different parts of the Company’s business in different ways, and the amount of these charges has varied significantly from period to period. The Company, therefore, believes that the exclusion of these charges will better help investors and
financial analysts understand the Company’s operating results and underlying operational trends.
These non-GAAP
financial measures are not prepared in accordance with accounting principles generally accepted in the United States (“GAAP”) and may differ from the non-GAAP information used by other companies.
There are significant limitations associated with the use of non-GAAP financial measures. The additional non-GAAP financial information presented here should be
considered in conjunction with, and not as a substitute for or superior to, the financial information presented in accordance with GAAP (such as net income and earnings per share) and should not be considered measures of the Company’s
liquidity.
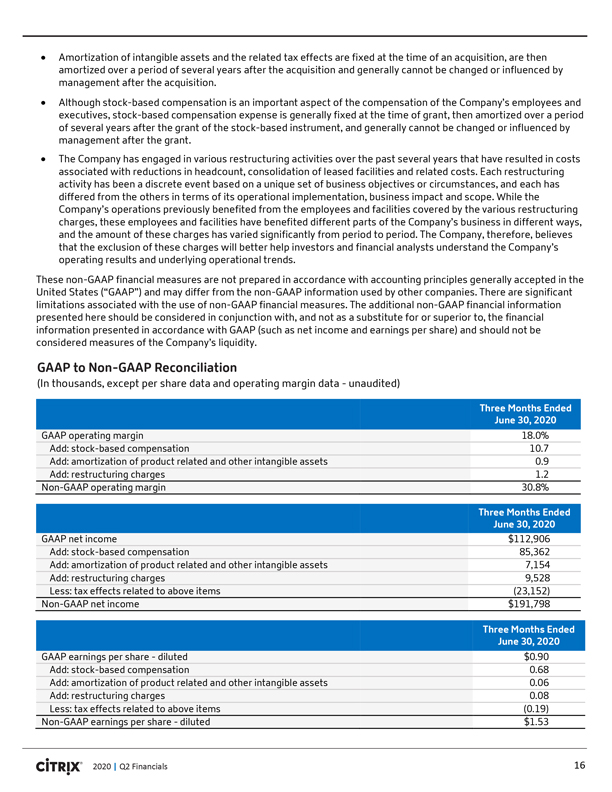
GAAP to Non-GAAP Reconciliation
(In thousands, except per share data and operating margin data—unaudited)
Three Months
Ended June 30, 2020
GAAP operating
margin 18.0
% Add: stock-based compensation 10.7 Add: amortization of product related and other intangible assets 0.9 Add: restructuring
charges 1.2 Non-GAAP operating margin 30.8%
Three Months Ended June 30,
2020
GAAP net
income $
112,906 Add: stock-based compensation 85,362 Add: amortization of product related and other intangible assets 7,154 Add: restructuring charges 9,528 Less: tax effects related to
above items (23,152) Non-GAAP net income $191,798
Three Months Ended June 30, 2020
GAAP earnings per share - diluted $0.90 Add: stock-based compensation 0.68 Add: amortization of product related and other intangible assets 0.06 Add: restructuring charges 0.08
Less: tax effects related to above items (0.19) Non-GAAP earnings per share - diluted $1.53
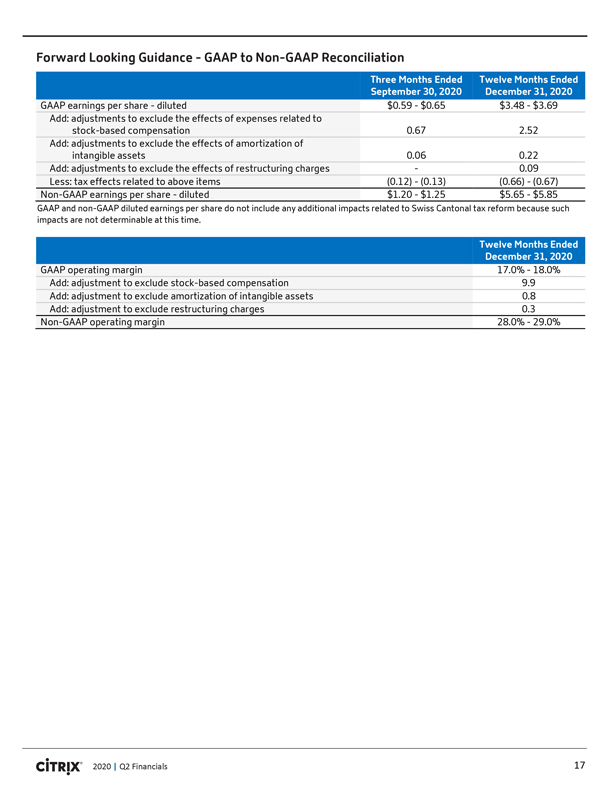
Forward Looking Guidance—GAAP to Non-GAAP Reconciliation
Three Months Ended Twelve Months Ended September 30, 2020 December 31, 2020
GAAP earnings per share—diluted $0.59—$0.65 $3.48—$3.69 Add: adjustments to exclude the effects of expenses related to stock-based compensation 0.67 2.52 Add:
adjustments to exclude the effects of amortization of intangible assets 0.06 0.22 Add: adjustments to exclude the effects of restructuring charges— 0.09 Less: tax effects related to above items (0.12)—(0.13) (0.66)—(0.67) Non-GAAP earnings per share—diluted $1.20—$1.25 $5.65—$5.85
GAAP and
non-GAAP diluted earnings per share do not include any additional impacts related to Swiss Cantonal tax reform because such impacts are not determinable at this time.
Twelve Months Ended December 31, 2020
GAAP operating margin 17.0%—18.0% Add: adjustment
to exclude stock-based compensation 9.9 Add: adjustment to exclude amortization of intangible assets
0.8 Add
: adjustment to exclude restructuring charges 0.3 Non-GAAP operating margin 28.0%—29.0% 17