Attached files
| file | filename |
|---|---|
| 8-K - FORM 8-K - BROOKLINE BANCORP INC | f8k_072320.htm |
Exhibit 99.1

Q2 2020 FINANCIAL RESULTS July 23, 2020 1
FORWARD LOOKING STATEMENTS 2 Certain statements in this presentation that are not historical facts may constitute forward - looking statements within the meaning of Section 27A of the Securities Act of 1933, as amended, and Section 21E of the Securities Exchange Act of 1934, as amended, and are intended to be covered by the safe harbor provisions of the Private Securities Litigation Reform Act of 1995. Statements contained in this presentation that do not describe historical or current facts are forward - looking statements, including statements regard the potential effects of COVID - 19 on the Company’s business, credit quality, financial condition, liquidity and results of operations. Forward - looking statements made with regard to the potential effects of COVID - 19 on the Company’s business, credit quality, financial condition, liquidity and results of operation may differ, possibly materially, from what is included in this presentation due to factors and future developments that are uncertain and beyond the scope of the Company’s control. These included, but are not limited to the length and extent of the economic contraction as a result of the COVID - 19 pandemic; continued deterioration in employment levels, general business and economic conditions on a national basis and in the local markets in which the Company operates; changes in consumer behavior due to changing political, business and economic conditions or legislative or regulatory initiatives; the possibility that future credit losses may be higher than currently expected; reputational risk relating to the Company’s participation in the Paycheck Protection Program and other pandemic - related legislative and regulatory initiatives and programs; and turbulence in capital and debt markets. Forward - looking statements involve risks and uncertainties which are difficult to predict. Forward - looking statements involve risks and uncertainties. These statements include, among others, statements regarding our strategy, evaluations of future interest rate trends and liquidity, expectations as to growth in assets, deposits and results of operations, success of acquisitions, future operations, market position, financial position, and prospects, plans and objectives of management. You should not place undue reliance on the Company’s forward - looking statements. You should exercise caution in interpreting and relying on forward - looking statements because they are subject to significant risks, uncertainties and other factors which are, in some cases, beyond the Company’s control. Forward - looking statements are based on the current assumptions and beliefs of management and are only expectations of future results. The Company’s actual results could differ materially from those projected in the forward - looking statements as a result of, among other factors, changes in interest rates; competitive pressures from other financial institutions; the effects of continued weakness in general economic conditions and the impact of the COVID - 19 pandemic on a national basis or in the local markets in which the Company operates, including changes that adversely affect borrowers’ ability to service and repay our loans; changes in the value of securities in the Company’s investment portfolio, changes in loan default and charge - off rates, the adequacy of loan loss reserves, decreases in deposit levels necessitating increased borrowing to fund loans and investments; changes in government regulation, as well as the other risks and uncertainties detailed in the Company’s Annual Report on Form 10 - K, as updated by the Company’s Quarterly Reports on Form 10 - Q and other filings submitted to the Securities and Exchange Commission. Forward looking statements speak only as of the date on which they are made. The Company does not undertake any obligation to update any forward - looking statement to reflect circumstances or events that occur after the date the forward - looking statements are made.
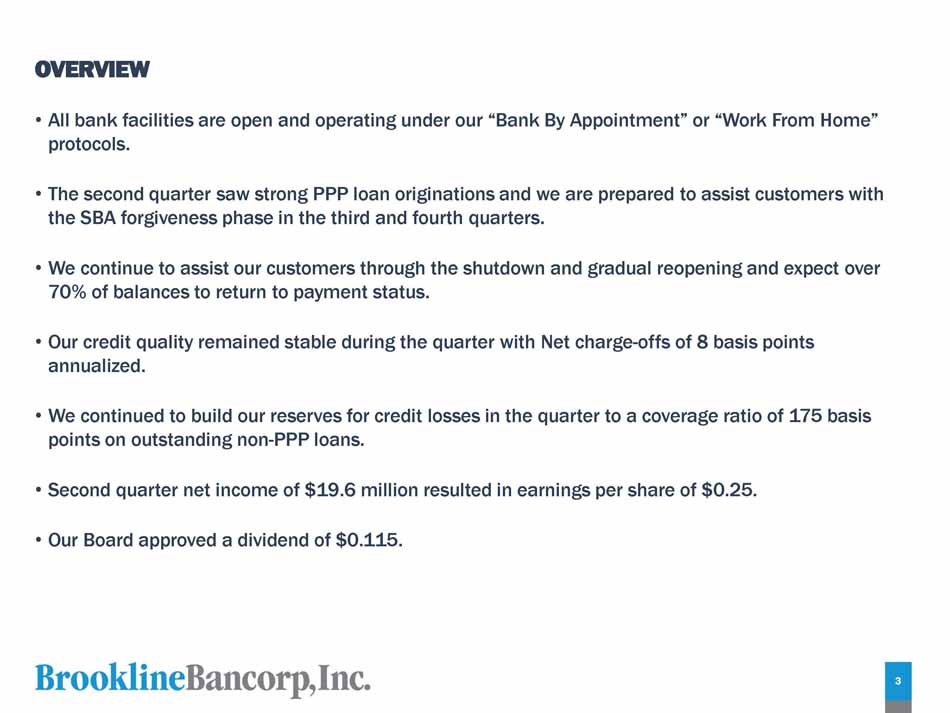
OVERVIEW 3 • All bank facilities are open and operating under our “Bank By Appointment” or “Work From Home” protocols. • The second quarter saw strong PPP loan originations and we are prepared to assist customers with the SBA forgiveness phase in the third and fourth quarters. • We continue to assist our customers through the shutdown and gradual reopening and expect over 70% of balances to return to payment status. • Our credit quality remained stable during the quarter with Net charge - offs of 8 basis points annualized. • We continued to build our reserves for credit losses in the quarter to a coverage ratio of 175 basis points on outstanding non - PPP loans. • Second quarter net income of $19.6 million resulted in earnings per share of $0.25. • Our Board approved a dividend of $0.115.
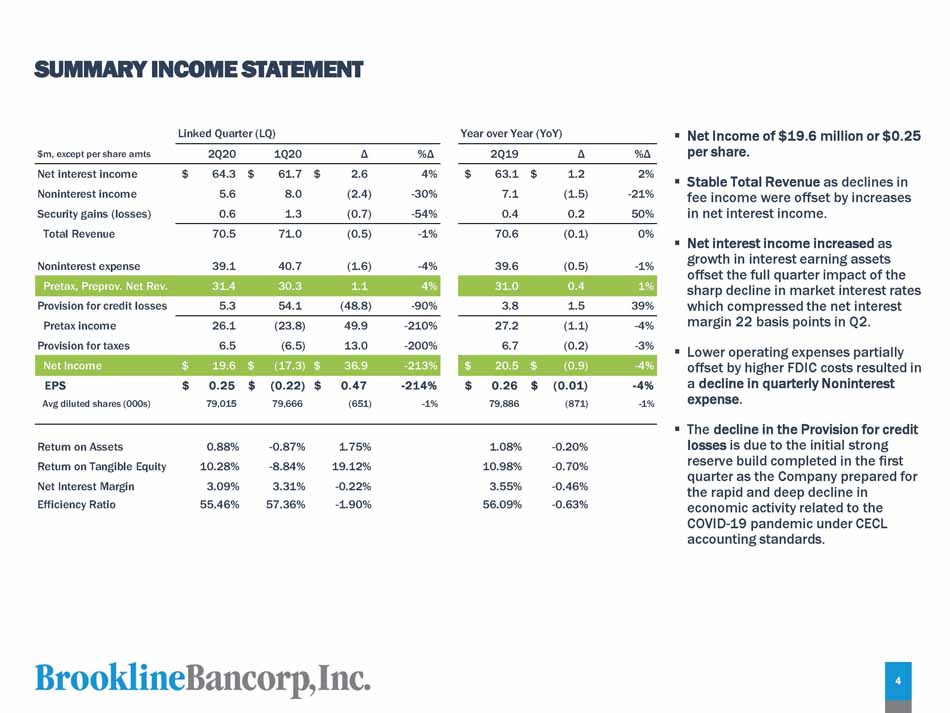
SUMMARY INCOME STATEMENT ▪ Net Income of $19.6 million or $0.25 per share. ▪ Stable Total Revenue as declines in fee income were offset by increases in net interest income . Net interest income increased as growth in interest earning assets offset the full quarter impact of the sharp decline in market interest rates which compressed the net interest margin 22 basis points in Q2. ▪ Lower operating expenses partially Net Income $ 19 . 6 $ ( 17 . 3) $ 36.9 - 213% $ 20 . 5 $ ( 0 . 9) - 4% offset by higher FDIC costs resulted in EPS $ 0 . 2 5 $ ( 0 . 22 ) $ 0.47 - 214% $ 0 . 2 6 $ ( 0 . 01 ) - 4 % a decline in quarterly Noninterest Avg diluted shares (000s) 79 , 015 79 , 666 (651) - 1% 79 , 88 6 ( 871) - 1% expense. ▪ The decline in the Provision for credit losses is due to the initial strong reserve build completed in the first quarter as the Company prepared for the rapid and deep decline in economic activity related to the COVID - 19 pandemic under CECL accounting standards. Return on Assets 0.88% - 0.87% 1 . 75% 1 . 08% - 0.20% Return on Tangible Equity 10.28% - 8.84% 19 . 12% 10 . 98% - 0.70% Net Interest Margin 3.09% 3.31% - 0 . 22% 3 . 55% - 0.46% Efficiency Ratio 55.46% 57.36% - 1 . 90% 56 . 09% - 0.63% Pretax income 26 . 1 ( 23 . 8) 49.9 - 210% 27 . 2 (1.1) - 4% Provision for taxes 6 . 5 ( 6 . 5) 13.0 - 200% 6 . 7 (0.2) - 3% $m, except per share amts 2 Q 20 1 Q 20 Δ %Δ 2 Q 19 Δ %Δ Net interest income $ 64 . 3 $ 61 . 7 $ 2 . 6 4% $ 63 . 1 $ 1 . 2 2% Noninterest income 5 . 6 8 . 0 ( 2 . 4) - 30% 7 . 1 ( 1 . 5) - 21% Security gains (losses) 0 . 6 1 . 3 ( 0 . 7) - 54% 0 . 4 0 . 2 50% Total Revenue Noninterest expense 70.5 39.1 71.0 40.7 (0.5) (1.6) - 1% - 4% 70.6 39.6 (0.1) (0.5) 0% - 1% ▪ Pretax, Preprov. Net Rev. 31 . 4 30.3 1 . 1 4% 31 . 0 0.4 1% Provision for credit losses 5 . 3 54.1 ( 48 . 8) - 90% 3 . 8 1.5 39% Linked Quarter (LQ) Year over Year (YoY) 4
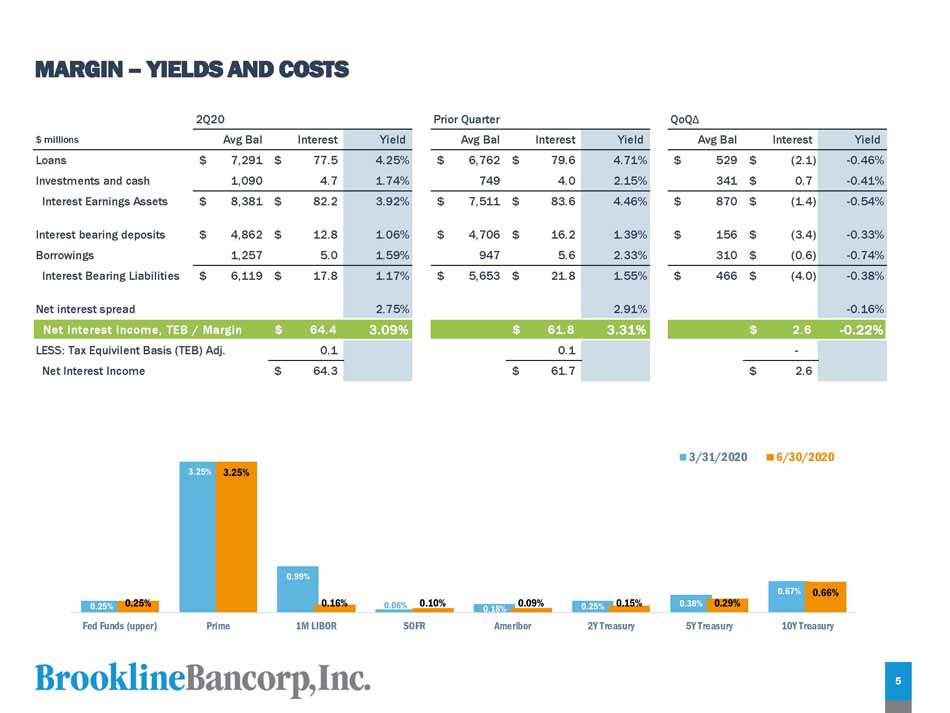
MARGIN – YIELDS AND COSTS 2Q20 Prior Quarter QoQ Δ $ millions Avg Bal I n t e r e s t Y i e l d Avg Bal I n t e r e s t Y i e l d Avg Bal I n t e r e s t Y i e l d Loans $ 7,291 $ 77 . 5 4 . 25% $ 6,762 $ 79 . 6 4 . 71% $ 529 $ ( 2 . 1) - 0 . 46% Investments and cash 1 , 090 4 . 7 1 . 74% 749 4 . 0 2 . 15% 341 $ 0.7 - 0 . 41% Interest Earnings Assets $ 8,381 $ 82 . 2 3 . 92% $ 7,511 $ 83 . 6 4 . 46% $ 870 $ ( 1 . 4) - 0 . 54% Interest bearing deposits $ 4,862 $ 12 . 8 1 . 06% $ 4,706 $ 16 . 2 1 . 39% $ 156 $ ( 3 . 4) - 0 . 33% Borrowings 1 , 257 5 . 0 1 . 59% 947 5 . 6 2 . 33% 310 $ ( 0 . 6) - 0 . 74% Interest Bearing Liabilities $ 6,119 $ 17 . 8 1 . 17% $ 5,653 $ 21 . 8 1 . 55% $ 466 $ ( 4 . 0) - 0 . 38% Net interest spread 2 . 75% 2 . 91% - 0 . 16% Net interest income, TEB / Margin $ 64.4 3.09% $ 61.8 3.31% $ 2.6 - 0.22% LESS: Tax Equivilent Basis (TEB) Adj. 0 . 1 0 . 1 - Net Interest Income $ 64.3 $ 61.7 $ 2.6 0.25% 3 . 25% 0.99% 0 . 06% 0 . 18% 0.25% 0.38% 0.67% 0.25% 3.25% 0.16 % 0.10 % 0.09 % 0.15 % 0.29% 0.66% Fed Funds (upper) P r i me 1M LIBOR S O F R Am e r i b o r 2Y Treasury 5Y Treasury 10Y Treasury 3/31/2020 6/30/2020 5
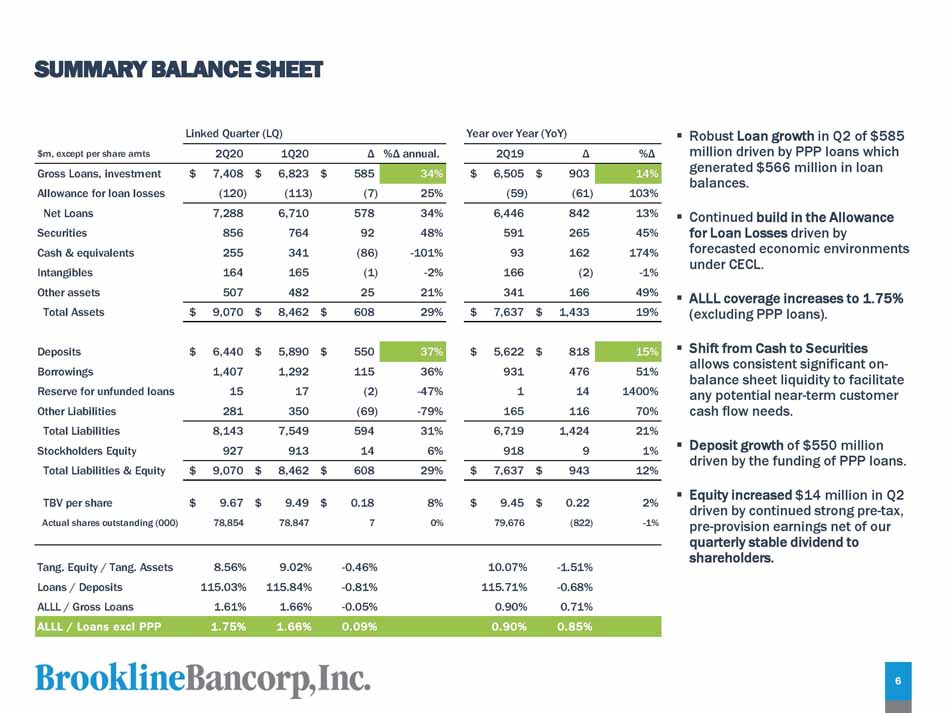
SUMMARY BALANCE SHEET ▪ Robust Loan growth in Q2 of $585 million driven by PPP loans which generated $566 million in loan balances. Securities 856 764 92 48% 591 265 45% for Loan Losses driven by Cash & equivalents 255 341 (86) - 101% 93 162 174% forecasted economic environments Deposits $ 6 , 440 $ 5 , 890 $ 550 37% $ 5 , 622 $ 818 15% ▪ Borrowings 1 , 407 1 , 292 115 36% 931 476 51% Reserve for unfunded loans 15 17 ( 2) - 47% 1 14 1400% Other Liabilities 281 350 ( 69) - 79% 165 116 70% ▪ Continued build in the Allowance under CECL. ▪ ALLL coverage increases to 1.75% (excluding PPP loans). Shift from Cash to Securities allows consistent significant on - balance sheet liquidity to facilitate any potential near - term customer cash flow needs. ▪ Deposit growth of $550 million driven by the funding of PPP loans. ▪ Equity increased $14 million in Q2 driven by continued strong pre - tax, pre - provision earnings net of our quarterly stable dividend to shareholders. Tang. Equity / Tang. Assets 8 . 56% 9 . 02% - 0.46% 10.07% - 1.51% Loans / Deposits 115 . 03% 115 . 84% - 0.81% 115.71% - 0.68% ALLL / Gross Loans 1 . 61% 1 . 66% - 0.05% 0.90% 0.71% ALLL / Loans excl PPP 1 . 7 5% 1 . 6 6% 0.09% 0.90% 0.85% $m, except per share amts 2 Q 20 1 Q 20 Δ %Δ annual. 2Q19 Δ %Δ Gross Loans, investment $ 7 , 408 $ 6 , 823 $ 585 34% $ 6,505 $ 903 14% Allowance for loan losses ( 120) ( 113) ( 7) 25% ( 59) ( 61) 103% Net Loans 7 , 288 6 , 710 578 34% 6,446 842 13% Intangibles 164 165 (1) - 2% 166 ( 2) - 1% Other assets 507 482 25 21% 341 166 49% Total Assets $ 9 , 070 $ 8 , 462 $ 608 29% $ 7 , 637 $ 1 , 433 19% Total Liabilities 8 , 143 7 , 549 594 31% 6 , 719 1 , 424 21% Stockholders Equity 927 913 14 6% 918 9 1% Total Liabilities & Equity $ 9 , 070 $ 8 , 462 $ 608 29% $ 7 , 637 $ 943 12% TBV per share $ 9 . 67 $ 9 . 49 $ 0 . 18 8% $ 9 . 45 $ 0 . 22 2% Actual shares outstanding (000) 78 , 854 78 , 847 7 0% 79 , 676 ( 822) - 1% Linked Quarter (LQ) Year over Year (YoY) 6
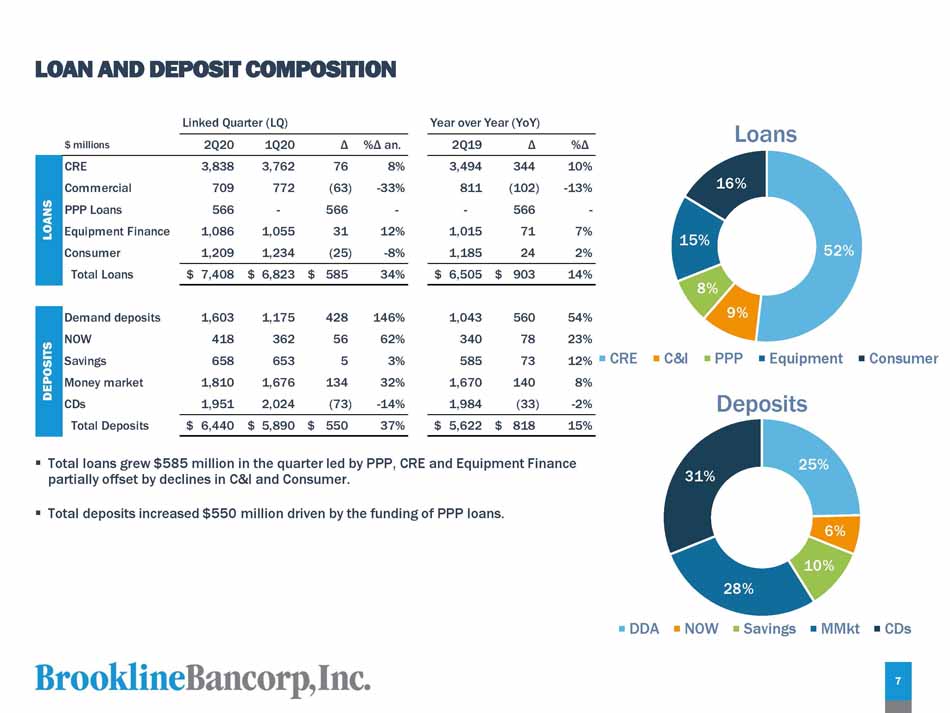
LOAN AND DEPOSIT COMPOSITION 52% 9% 8% 15% 16% L oans 25% 31% C R E C & I PPP E q u i p m e n t Co ns u m e r Deposits 6% 10% 28% D D A N O W Sa v i n g s MMk t C Ds 1 , 603 418 658 1 , 810 1 , 951 1 , 175 362 653 1 , 676 2 , 024 42 8 146% 5 6 62% 5 3% 13 4 32% ( 73 ) - 14% 1 , 043 340 585 1 , 670 1 , 984 560 78 73 140 ( 33) 54% 23% 12% 8% - 2% Demand deposits NOW Savings Money market CDs Total Deposits $ 6 , 44 0 $ 5 , 89 0 $ 55 0 37 % $ 5 , 62 2 $ 81 8 15% Linked Quarter (LQ) Year over Year (YoY) DEPOSITS $ millions 2 Q 20 1 Q 20 Δ %Δ an. 2 Q 19 Δ %Δ CRE 3 , 838 3 , 762 76 8% 3 , 494 344 10% S Commercial 709 772 ( 63) - 33% 811 (102) - 13% A N PPP Loans 566 - 566 - - 566 - L O Equipment Finance 1 , 086 1 , 055 31 12% 1 , 015 71 7% Consumer 1 , 209 1 , 234 ( 25) - 8% 1 , 185 24 2% Total Loans $ 7,408 $ 6,823 $ 585 34% $ 6,505 $ 903 14% ▪ Total loans grew $585 million in the quarter led by PPP, CRE and Equipment Finance partially offset by declines in C&I and Consumer. 7 ▪ Total deposits increased $550 million driven by the funding of PPP loans.
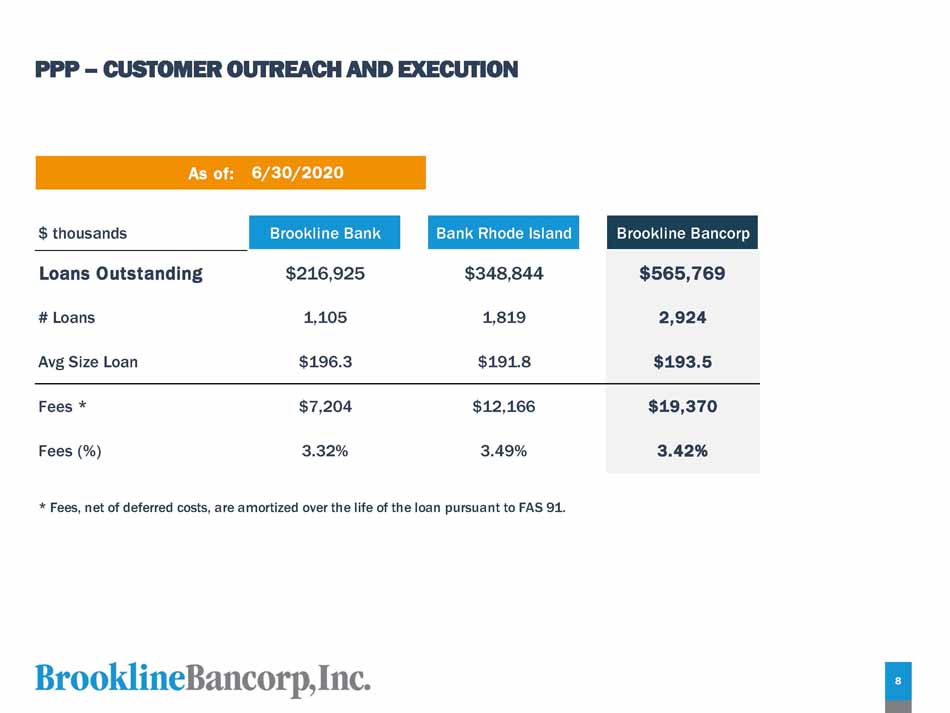
PPP – CUSTOMER OUTREACH AND EXECUTION * Fees, net of deferred costs, are amortized over the life of the loan pursuant to FAS 91. As of: 6/30/2020 $ thousands Brookline Bank Bank Rhode Island Brookline Bancorp Loans Outstanding $216,925 $348,844 $565,769 # Loans 1,105 1,819 2,924 Avg Size Loan $196.3 $191.8 $193.5 Fees * $7,204 $12,166 $19,370 Fees (%) 3.32% 3.49% 3.42% 8
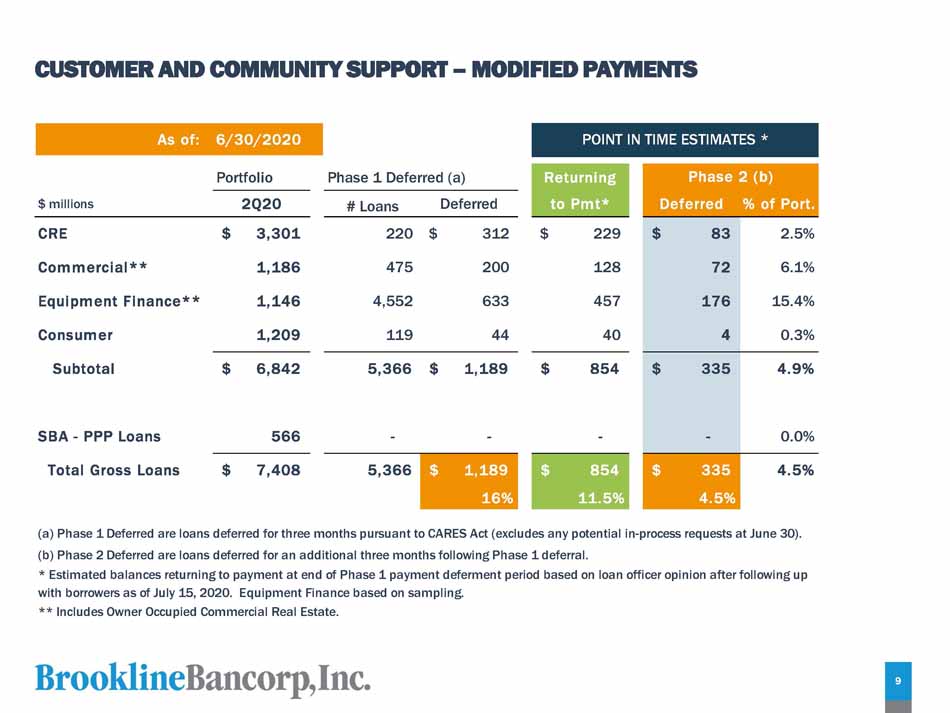
CUSTOMER AND COMMUNITY SUPPORT – MODIFIED PAYMENTS As of: 6/30/2020 (a) Phase 1 Deferred are loans deferred for three months pursuant to CARES Act (excludes any potential in - process requests at June 30). (b) Phase 2 Deferred are loans deferred for an additional three months following Phase 1 deferral. * Estimated balances returning to payment at end of Phase 1 payment deferment period based on loan officer opinion after following up with borrowers as of July 15, 2020. Equipment Finance based on sampling. ** Includes Owner Occupied Commercial Real Estate. POINT IN TIME ESTIMATES * Portfolio Phase 1 Deferred (a) R e t u rn i n g $ millions 2Q20 # Loans Deferred to Pmt* CRE $ 3 , 301 220 $ 312 $ 229 Commercial** 1 , 186 475 200 128 Equipment Finance** 1 , 146 4 , 552 633 457 Consumer 1 , 209 119 44 40 Subtotal $ 6,842 5 , 366 $ 1,189 $ 85 4 SBA - PPP Loans 566 - - - Total Gross Loans $ 7,408 5 , 366 $ 1 , 189 16 % $ 85 4 11 . 5% 9 Phase 2 (b) Deferred % of Port. $ 8 3 2 . 5% 7 2 6 . 1% 17 6 15 . 4% 4 0 . 3% $ 33 5 4 . 9 % - 0 . 0% $ 33 5 4 . 5 % 4 . 5 %
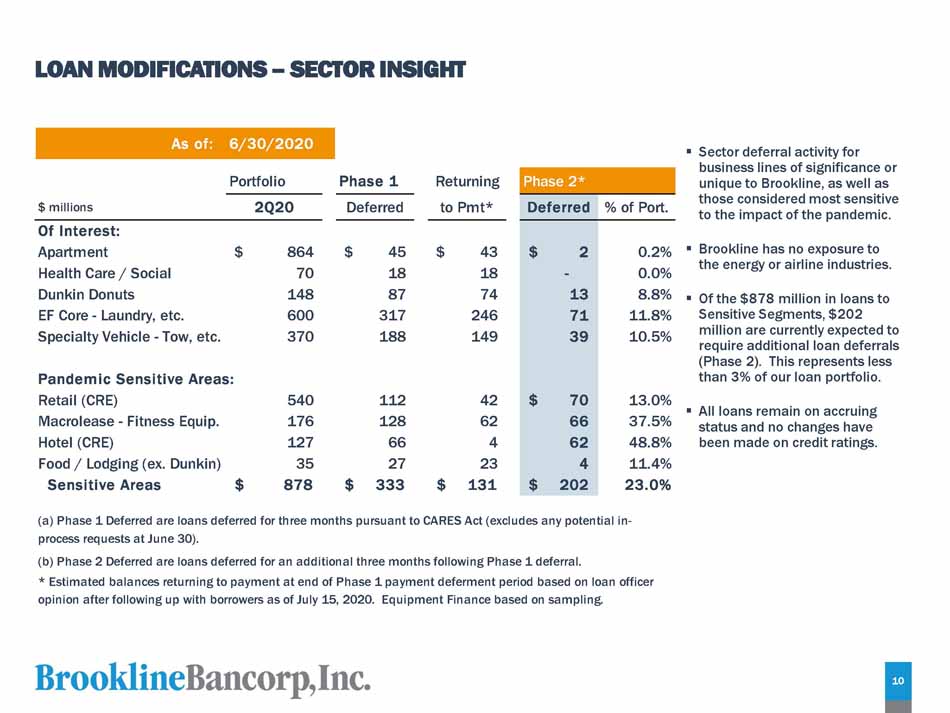
LOAN MODIFICATIONS – SECTOR INSIGHT ▪ Sector deferral activity for business lines of significance or unique to Brookline, as well as those considered most sensitive to the impact of the pandemic. ▪ Brookline has no exposure to the energy or airline industries. ▪ Of the $878 million in loans to Sensitive Segments, $202 million are currently expected to require additional loan deferrals (Phase 2). This represents less than 3% of our loan portfolio. ▪ All loans remain on accruing status and no changes have been made on credit ratings . P o r t fo li o Phase 1 $ millions 2 Q 2 0 D e f e rr ed R e t urn i n g to Pmt* As of: 6/30/2020 (a) Phase 1 Deferred are loans deferred for three months pursuant to CARES Act (excludes any potential in - process requests at June 30). (b) Phase 2 Deferred are loans deferred for an additional three months following Phase 1 deferral. * Estimated balances returning to payment at end of Phase 1 payment deferment period based on loan officer opinion after following up with borrowers as of July 15, 2020. Equipment Finance based on sampling. Of Interest: Apartment $ 864 $ 45 $ 43 Health Care / Social 70 18 18 Dunkin Donuts 148 87 74 EF Core - Laundry, etc. 600 317 246 Specialty Vehicle - Tow, etc. 370 188 149 Pandemic Sensitive Areas: Retail (CRE) 540 112 42 Macrolease - Fitness Equip. 176 128 62 Hotel (CRE) 127 66 4 Food / Lodging (ex. Dunkin) 35 27 23 Sensitive Areas $ 87 8 $ 33 3 $ 13 1 Phase 2* D efe rr ed % of Port. $ 2 0 . 2% - 0 . 0% 1 3 8 . 8% 7 1 11 . 8% 3 9 10 . 5% $ 7 0 13 . 0% 6 6 37 . 5% 6 2 48 . 8% 4 11 . 4% $ 20 2 23 . 0% 10
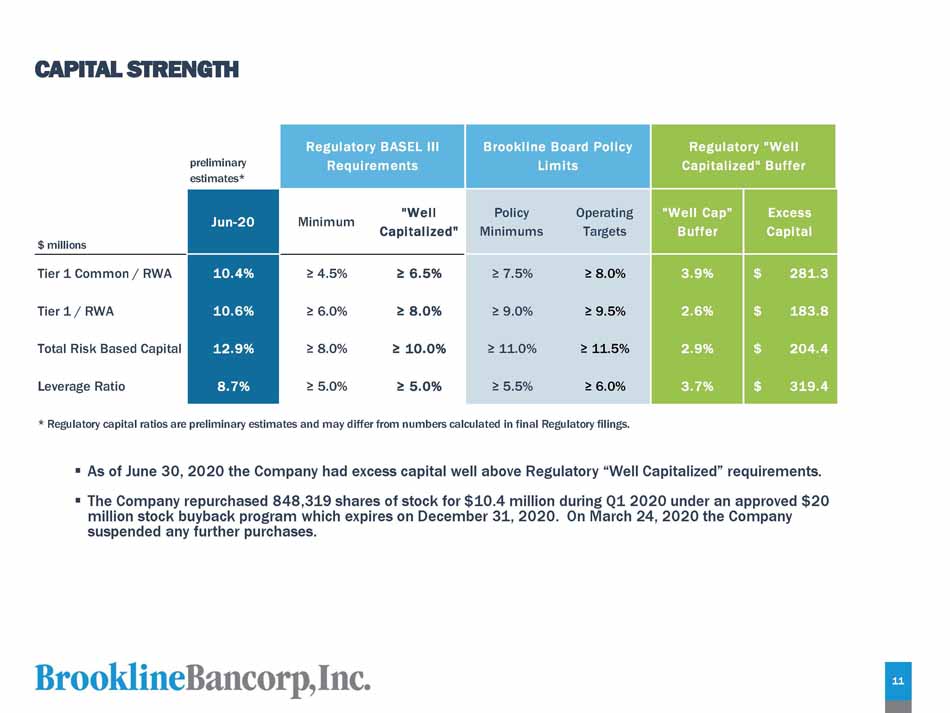
CAPITAL STRENGTH 11 p r e limi na r y e s t im a t e s * Regulatory BASEL III Requirements Brookline Board Policy Limits Regulatory "Well Capitalized" Buffer $ millions Jun - 20 Minimum "Well C ap i t a li ze d " Policy M i n i m u m s Op e r a t i n g Targets "Well Cap" Buffer E x c e ss C ap i t al Tier 1 Common / RWA 10.4% ≥ 4.5% ≥ 6.5% ≥ 7.5% ≥ 8.0% 3.9% $ 281 . 3 Tier 1 / RWA 10.6% ≥ 6.0% ≥ 8.0% ≥ 9.0% ≥ 9.5% 2.6% $ 183 . 8 Total Risk Based Capital 12.9% ≥ 8.0% ≥ 10.0% ≥ 11.0% ≥ 11.5% 2.9% $ 204 . 4 Leverage Ratio 8.7% ≥ 5.0% ≥ 5.0% ≥ 5.5% ≥ 6.0% 3.7% $ 319 . 4 * Regulatory capital ratios are preliminary estimates and may differ from numbers calculated in final Regulatory filings. ▪ As of June 30, 2020 the Company had excess capital well above Regulatory “Well Capitalized” requirements. ▪ The Company repurchased 848,319 shares of stock for $10.4 million during Q1 2020 under an approved $20 million stock buyback program which expires on December 31, 2020. On March 24, 2020 the Company suspended any further purchases.
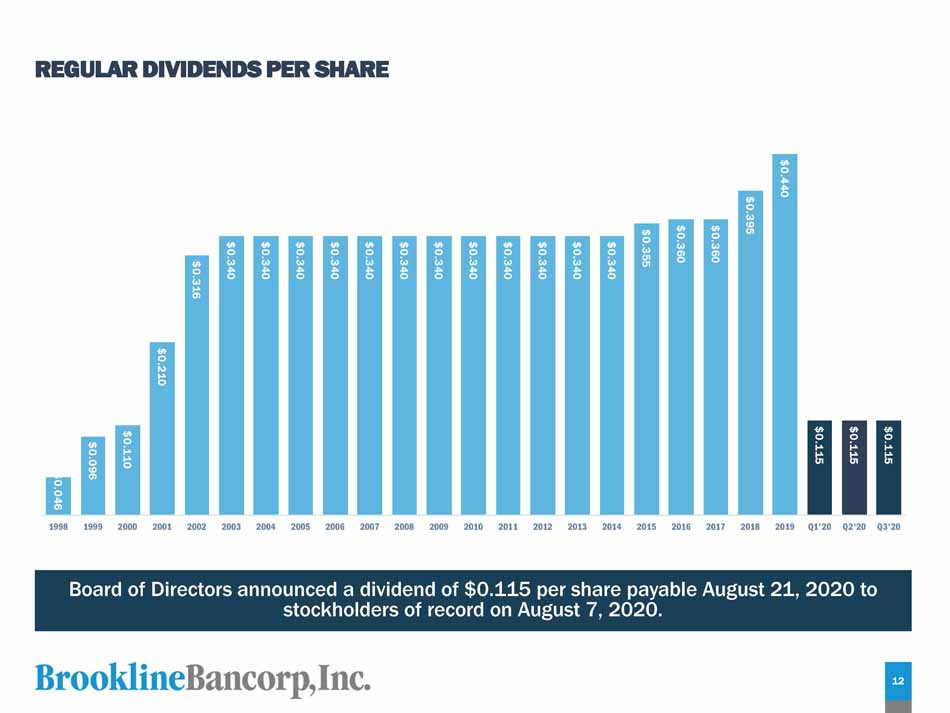
REGULAR DIVIDENDS PER SHARE Board of Directors announced a dividend of $0.115 per share payable August 21, 2020 to stockholders of record on August 7, 2020. $0 . 0 4 6 12 $0 . 0 9 6 $0 . 1 1 0 $0 . 2 1 0 $0 . 3 1 6 $0 . 3 4 0 $0 . 3 4 0 $0 . 3 4 0 $0 . 3 4 0 $0 . 3 4 0 $0 . 3 4 0 $0 . 3 4 0 $0 . 3 4 0 $0 . 3 4 0 $0 . 3 4 0 $0 . 3 4 0 $0 . 3 4 0 $0 . 3 5 5 $0 . 3 6 0 $0 . 3 6 0 $0 . 3 9 5 $0 . 4 4 0 $0 . 1 1 5 $0 . 1 1 5 $0 . 1 1 5 1998 1999 2000 2001 2002 2003 2004 2005 2006 2007 2008 2009 2010 2011 2012 2013 2014 2015 2016 2017 2018 2019 Q1'20 Q2'20 Q3'20
QUESTIONS Paul A. Perrault, President and Chief Executive Officer Carl M. Carlson, Chief Financial Officer M. Robert Rose, Chief Credit Officer 13 13

APPENDIX 13 14
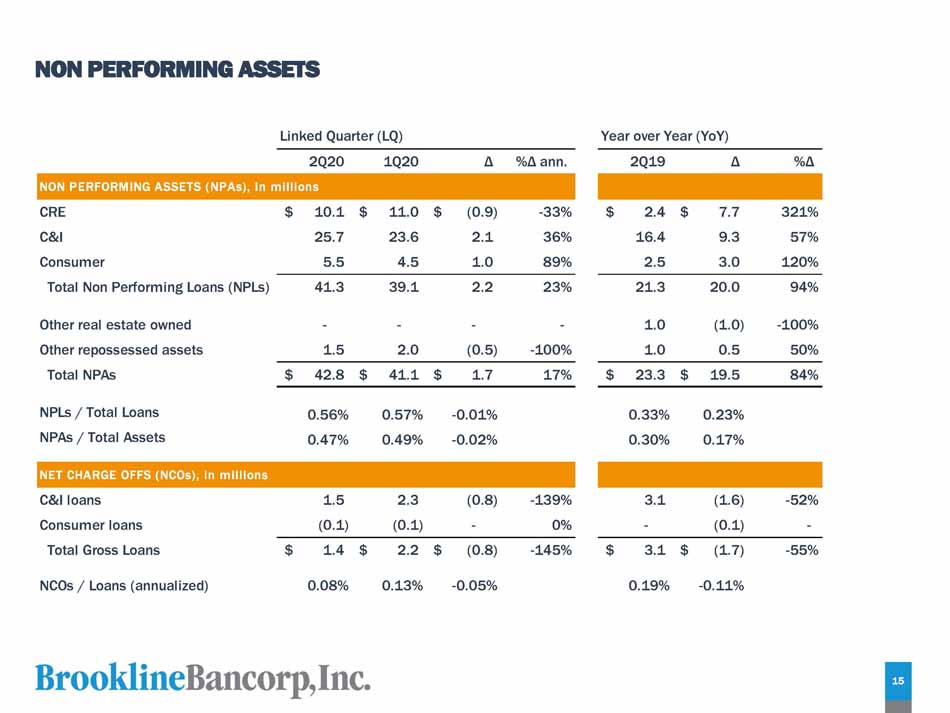
NON PERFORMING ASSETS Δ %Δ ann. 2 Q 19 Δ %Δ Linked Quarter (LQ) 2 Q 2 0 1 Q 20 Year over Year (YoY) NON PERFORMING ASSETS (NPAs), in millions CRE $ 10 . 1 $ 11 . 0 $ (0.9) - 33% $ 2 . 4 $ 7 . 7 321% C&I 25 . 7 23 . 6 2.1 36% 16 . 4 9 . 3 57% Consumer 5 . 5 4 . 5 1.0 89% 2 . 5 3 . 0 120% 15 Total Non Performing Loans (NPLs) 41.3 39 . 1 2 . 2 23% 21.3 20 . 0 94% Other real estate owned - - - - 1 . 0 ( 1 . 0) - 100% Other repossessed assets 1 . 5 2 . 0 ( 0 . 5) - 100% 1 . 0 0 . 5 50% Total NPAs $ 42.8 $ 41.1 $ 1.7 17% $ 23 . 3 $ 19 . 5 84% NPLs / Total Loans 0 . 56% 0 . 57% - 0 . 01% 0 . 33% 0 . 23% NPAs / Total Assets 0 . 47% 0 . 49% - 0 . 02% 0 . 30% 0 . 17% NET CHARGE OFFS (NCOs), in millions C&I loans 1 . 5 2 . 3 ( 0 . 8) - 139% 3 . 1 ( 1 . 6) - 52% Consumer loans ( 0 . 1) ( 0 . 1) - 0% - ( 0 . 1) - Total Gross Loans $ 1.4 $ 2.2 $ (0.8) - 145% $ 3 . 1 $ ( 1 . 7) - 55% NCOs / Loans (annualized) 0 . 08% 0 . 13% - 0 . 05% 0 . 19% - 0 . 11%
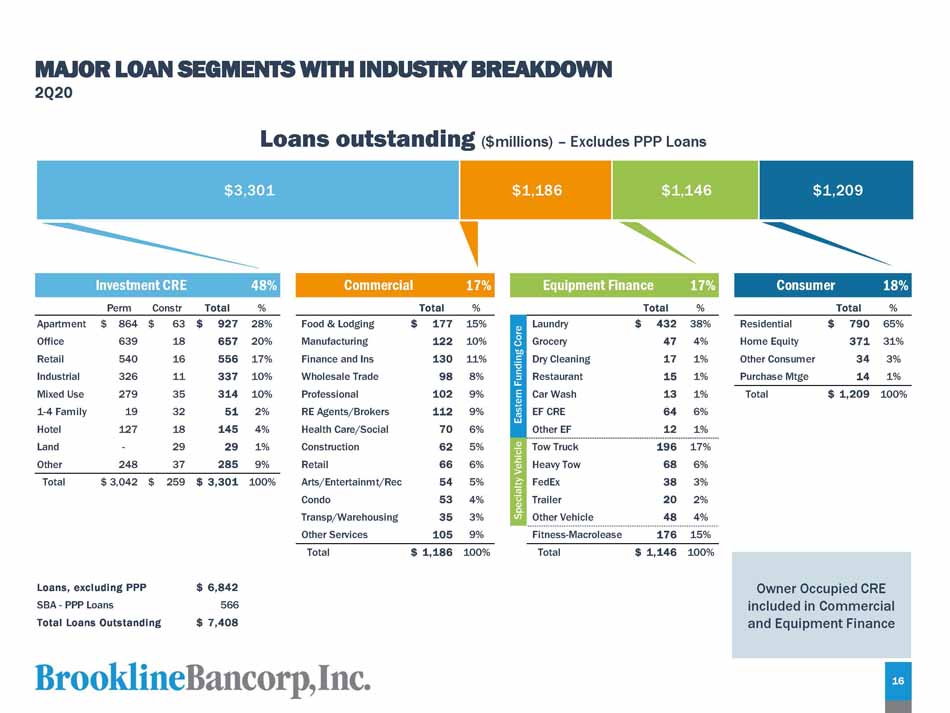
$1,209 Loans outstanding ($millions) – Excludes PPP Loans $3,301 $1,186 $1,146 MAJOR LOAN SEGMENTS WITH INDUSTRY BREAKDOWN 2Q20 P e r m Co n s t r T o t a l % T o t a l % T o t a l % T o t a l % Residential Home Equity Other Consumer Purchase Mtge $ 79 0 65% 37 1 31% 3 4 3% 1 4 1% T o t a l $ 1,209 100% - Apar t m e n t Office Retail Industrial Mixed Use 1 - 4 Family Hotel Land Ot h er 248 $ 86 4 $ 6 3 $ 92 7 28% 63 9 1 8 65 7 20% 54 0 1 6 55 6 17% 32 6 1 1 33 7 10% 27 9 3 5 31 4 10% 1 9 3 2 5 1 2% 12 7 1 8 14 5 4% 2 9 2 9 1% 3 7 28 5 9% T o t a l $ 3,042 $ 259 $ 3,301 100% Food & Lodging Manufacturing Finance and Ins Wholesale Trade Professional RE Agents/Brokers Health Care/Social Construction Retail Ar t s / E n t e r t a i n m t /R ec Condo Transp/Warehousing Other Services $ 17 7 15% 12 2 10% 13 0 11% 9 8 8% 10 2 9% 11 2 9% 7 0 6% 6 2 5% 6 6 6% 5 4 5% 5 3 4% 3 5 3% 10 5 9% Fitness - Macrolease 17 6 15% T o t a l $ 1,186 100% T o t a l $ 1,146 100% Loans, excluding PPP SBA - PPP Loans Total Loans Outstanding $ 6,842 566 $ 7,408 Consumer 18% Investment CRE 48% Commercial 17% Equipment Finance 17% Eastern Funding Core Laundry $ 43 2 38% Grocery 4 7 4% Dry Cleaning 1 7 1% Restaurant 1 5 1% Car Wash 1 3 1% EF CRE 6 4 6% Other EF 1 2 1% Specialty Vehicle Tow Truck 19 6 17% Heavy Tow 6 8 6% FedEx 3 8 3% Trailer 2 0 2% Other Vehicle 4 8 4% Owner Occupied CRE included in Commercial and Equipment Finance 16
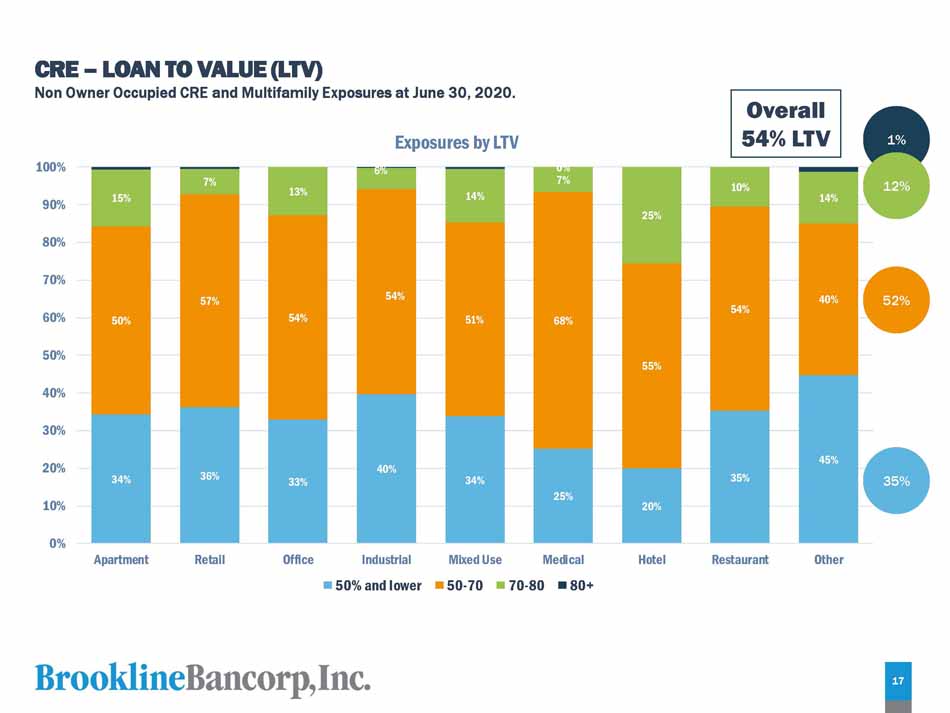
34% 36% 33% 40% 34% 25% 20% 35% 45% 50% 57% 54% 54% 5 1 % 68% 55% 54% 40% 15% 7% 13% 6% 14% 7% 25% 10% 14% 0% 0% 1 0 % 2 0 % 4 0 % 3 0 % 5 0 % 6 0 % 8 0 % 7 0 % 9 0 % 1 0 0% A p a rt m e nt R e t a i l O f f i c e M e d i c a l H o t e l R e s t au r a n t O t h e r Exposures by LTV Industrial 50% and lower Mixed Use 50 - 70 70 - 8 0 80+ CRE – LOAN TO VALUE (LTV) Non Owner Occupied CRE and Multifamily Exposures at June 30, 2020. 35% 52% 1% 12% 17 Overall 54% LTV

39% 60% 40% 30% 36% 3 1 % 61% 52% 13% 8% 9% 13% 1 1 % 0% 13% 3 1 % 4% 3% 12% 16% 1 1 % 5% 6% 1% 6% 10% 12% 7% 16% 14% 19% 20% 7% 2% 15% 8% 16% 6% 1 7 % 28% 25% 16% 26% 1 1 % 13% 8% 3% 8% 10% 4% 50% 4% 2% 13% 0% 1 0 % 2 0 % 3 0 % 4 0 % 5 0 % 6 0 % 7 0 % 8 0 % 9 0 % 1 0 0% Apartment R e t a i l O f f i c e Industrial M e d i c a l Restaurant O t h e r Exposures by Year of Origination 201 5 an d B e f o r e 2016 M i x e d U s e H o t e l 2017 2018 2019 2020 8 % 17 % 13 % 10 % 11 % 41 % 18 CRE - VINTAGE Non Owner Occupied CRE and Multifamily Exposures at June 30, 2020.
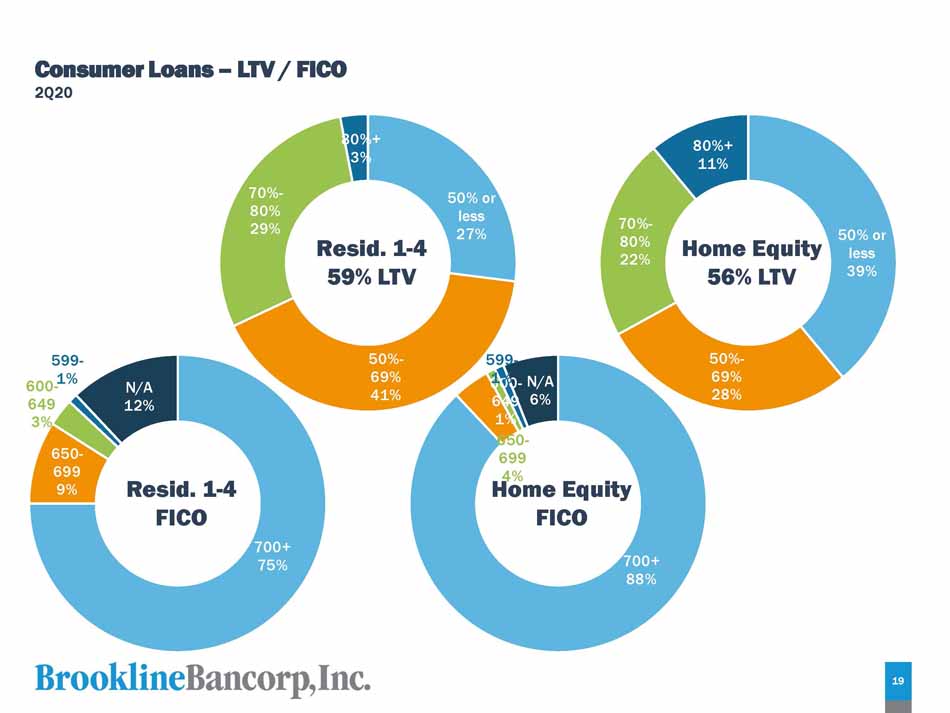
700+ 75% 599 - 600 - 1% 649 3% 650 - 699 9% N/A 12% 50% or less 27% 50 % - 69% 41% 19 70 % - 80% 29% 80 % + 3% 599 - 6 1 0 % 0 - N/A 649 6% 1% 650 - 699 4% 50% or less 39% 50 % - 69% 28% 70 % - 80% 22% 80 % + 11% Resid. 1 - 4 59% LTV Resid. 1 - 4 FICO Home Equity FICO 700+ 88% Home Equity 56% LTV Consumer Loans – LTV / FICO 2Q20
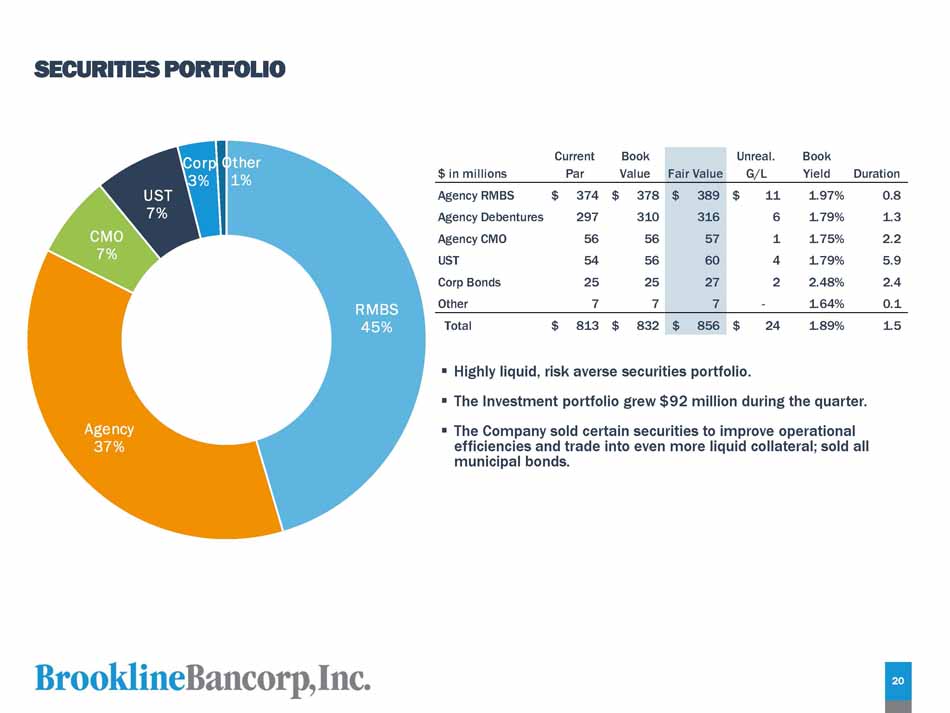
SECURITIES PORTFOLIO ▪ Highly liquid, risk averse securities portfolio. ▪ The Investment portfolio grew $92 million during the quarter. ▪ The Company sold certain securities to improve operational efficiencies and trade into even more liquid collateral; sold all municipal bonds. A g e n c y 37% 20 Corp Other 3% 1% UST 7% C MO 7% R M B S 45% $ in millions Current Par Book Value Fair Value Unreal. G/L Book Yield D u r a t i o n Agency RMBS $ 374 $ 378 $ 389 $ 11 1 . 97% 0 . 8 Agency Debentures 297 310 316 6 1 . 79% 1 . 3 Agency CMO 56 56 57 1 1 . 75% 2 . 2 UST 54 56 60 4 1 . 79% 5 . 9 Corp Bonds 25 25 27 2 2 . 48% 2 . 4 Other 7 7 7 - 1 . 64% 0 . 1 Total $ 813 $ 832 $ 856 $ 24 1 . 89% 1 . 5
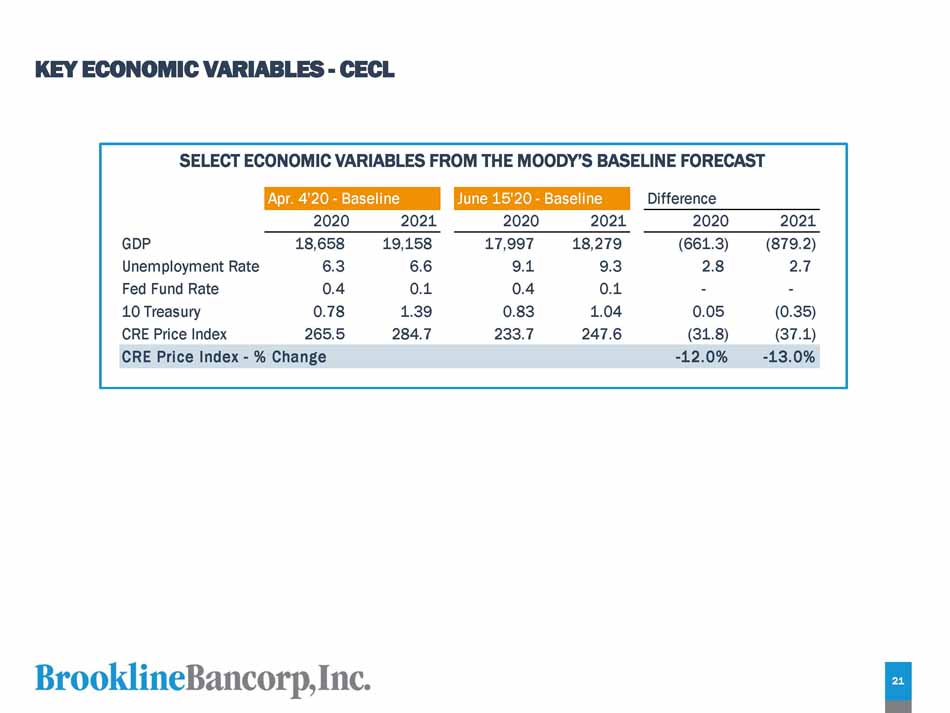
KEY ECONOMIC VARIABLES - CECL SELECT ECONOMIC VARIABLES FROM THE MOODY’S BASELINE FORECAST Apr. 4'20 - Baseline June 15'20 - Baseline 2021 ( 879 . 2) 2 . 7 - GDP Unemployment Rate Fed Fund Rate 10 Treasury CRE Price Index 2020 18 , 658 6 . 3 0 . 4 0 . 78 265 . 5 2021 19 , 158 6 . 6 0 . 1 1 . 39 284 . 7 2020 17 , 997 9 . 1 0 . 4 0 . 83 233 . 7 Difference 202 1 2020 18 , 27 9 ( 661 . 3) 9 . 3 2 . 8 0.1 - 1.04 0.05 247.6 (31.8) ( 0 . 35) ( 37 . 1) CRE Price Index - % Change - 12.0% - 13.0% 21