Attached files
| file | filename |
|---|---|
| EX-99.1 - EXHIBIT 99.1 - UNITED COMMUNITY BANKS INC | tm2025292d1_ex99-1.htm |
| 8-K - FORM 8-K - UNITED COMMUNITY BANKS INC | tm2025292d1_8k.htm |
Exhibit 99.2
2 Q INVESTOR PRESENTATION July 21, 2020
Disclosures CAUTIONARY STATEMENT This Investor Presentation contains forward - looking statements about United Community Banks, Inc . (“United”), as defined in federal securities laws . Statements that are not historical or current facts, including statements about beliefs and expectations, are forward - looking statements and are based on information available to, and assumptions and estimates made by, management as of the date hereof . Because forward - looking statements involve inherent risks and uncertainties, our actual results may differ materially from those expressed or implied in any such statements . The COVID - 19 pandemic is adversely impacting United, its employees, customers , vendors, counterparties, and the communities that it serves . The ultimate extent of the impact of COVID — 19 on United’s financial position, results of operations, liquidity, and prospects is highly uncertain . United’s results could be adversely affected by, among other things, volatility in financial markets, continued deterioration of economic and business conditions, further increases in unemployment rates, deterioration in the credit quality of United’s loan portfolio, deterioration in the value of United’s investment securities, and changes in statutes, regulations, and regulatory policies or practices . For a discussion of these and other risks that may cause such forward - looking statements to differ materially from actual results, please refer to United’s filings with the Securities and Exchange Commission, including its 2019 Annual Report on Form 10 - K and Form 10 - Q for the quarter ended March 31 , 2020 under the sections entitled “Cautionary Note Regarding Forward - Looking Statements” and “Risk Factors . ” Forward - looking statements speak only as of the date they are made, and we undertake no obligation to update or revise forward - looking statements . NON - GAAP MEASURES This Investor Presentation includes financial information determined by methods other than in accordance with generally accepted accounting principles (“GAAP”) . This financial information includes certain operating performance measures, which exclude merger - related and other charges that are not considered part of recurring operations . Such measures include : “Earnings per share – operating,” “Diluted earnings per share – operating,” “Tangible book value per share,” “Return on common equity – operating,” “Return on tangible common equity – operating,” “Return on assets – operating ,” “Return on assets – pre - tax pre - provision, excluding merger - related and other charges,” “ Efficiency ratio – operating,” “Expenses – operating,” and “Tangible common equity to tangible assets . ” Management has included these non - GAAP measures because it believes these measures may provide useful supplemental information for evaluating United’s underlying performance trends . Further, management uses these measures in managing and evaluating United’s business and intends to refer to them in discussions about our operations and performance . Operating performance measures should be viewed in addition to, and not as an alternative to or substitute for, measures determined in accordance with GAAP, and are not necessarily comparable to non - GAAP measures that may be presented by other companies . To the extent applicable, reconciliations of these non - GAAP measures to the most directly comparable GAAP measures can be found in the ‘Non - GAAP Reconciliation Tables’ included in the exhibits to this Presentation . 2
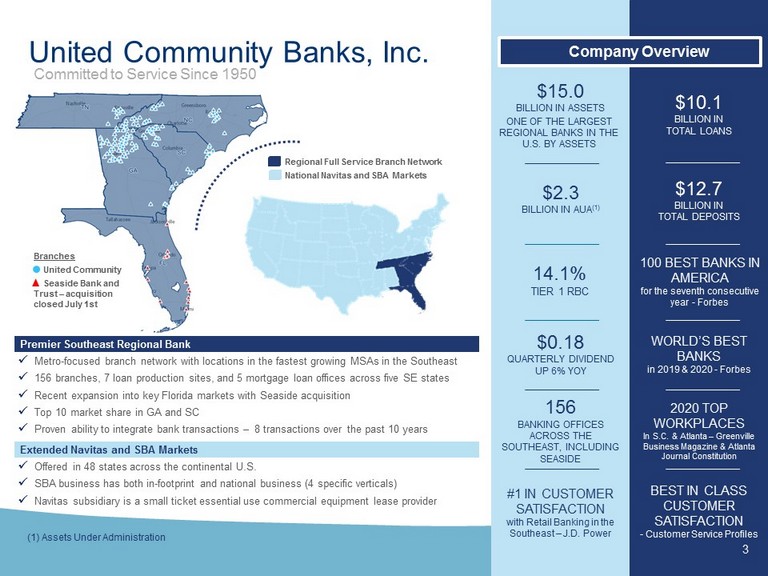
156 BANKING OFFICES ACROSS THE SOUTHEAST, INCLUDING SEASIDE #1 IN CUSTOMER SATISFACTION with Retail Banking in the Southeast – J.D. Power United Community Banks, Inc. $ 15.0 BILLION IN ASSETS $2.3 BILLION IN AUA (1) $ 12.7 BILLION IN TOTAL DEPOSITS WORLD’S BEST BANKS in 2019 & 2020 - Forbes 2020 TOP WORKPLACES In S.C. & Atlanta – Greenville Business Magazine & Atlanta Journal Constitution BEST IN CLASS CUSTOMER SATISFACTION - Customer Service Profiles $0.18 QUARTERLY DIVIDEND UP 6% YOY 3 Branches United Community Seaside Bank and Trust – acquisition closed July 1st Regional Full Service Branch Network National Navitas and SBA Markets Premier Southeast Regional Bank x Metro - focused branch network with locations in the fastest growing MSAs in the Southeast x 156 branches, 7 loan production sites, and 5 mortgage loan offices across five SE states x Recent expansion into key Florida markets with Seaside acquisition x Top 10 market share in GA and SC x Proven ability to integrate bank transactions – 8 transactions over the past 10 years ONE OF THE LARGEST REGIONAL BANKS IN THE U.S. BY ASSETS Committed to Service Since 1950 Extended Navitas and SBA Markets $10.1 BILLION IN TOTAL LOANS Company Overview 14.1% TIER 1 RBC 100 BEST BANKS IN AMERICA f or the seventh consecutive year - Forbes x Offered in 48 states across the continental U.S. x SBA business has both in - footprint and national business (4 specific verticals) x Navitas subsidiary is a small ticket essential use commercial equipment lease provider (1) Assets Under Administration
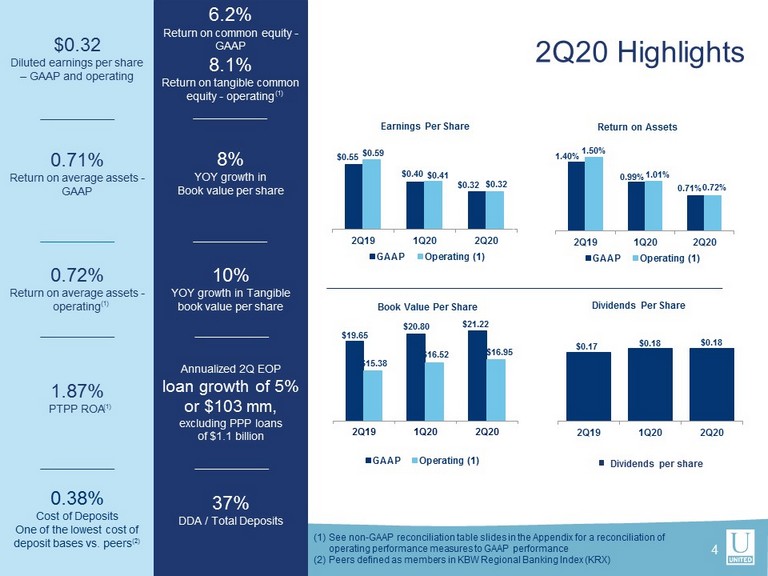
$19.65 $20.80 $21.22 $15.38 $16.52 $16.95 2Q19 1Q20 2Q20 Book Value Per Share GAAP Operating (1) $ 0.32 Diluted earnings per share – GAAP and operating 0.71% Return on average assets - GAAP 0.72% Return on average assets - operating 1.87% PTPP ROA 0.38% Cost of Deposits One of the lowest cost of deposit bases vs. peers (2) 6.2% Return on common equity - GAAP 8.1% Return on tangible common equity - operating 8% YOY growth in Book value per share 10% YOY growth in Tangible book value per share Annualized 2Q EOP loan growth of 5 % or $ 103 mm, e xcluding PPP loans o f $1.1 billion 37% DDA / Total Deposits 2 Q20 Highlights (1) See non - GAAP reconciliation table slides in the Appendix for a reconciliation of operating performance measures to GAAP performance (2) Peers defined as members in KBW Regional Banking Index (KRX ) $0.55 $0.40 $0.32 $0.59 $0.41 $0.32 2Q19 1Q20 2Q20 Earnings Per Share GAAP Operating (1) 1.40% 0.99% 0 .71% 1.50% 1.01% 0.72% 2Q19 1Q20 2Q20 Return on Assets GAAP Operating (1) $0.17 $0.18 $0.18 2Q19 1Q20 2Q20 Dividends Per Share Dividends per share (1) (1) (1) 4
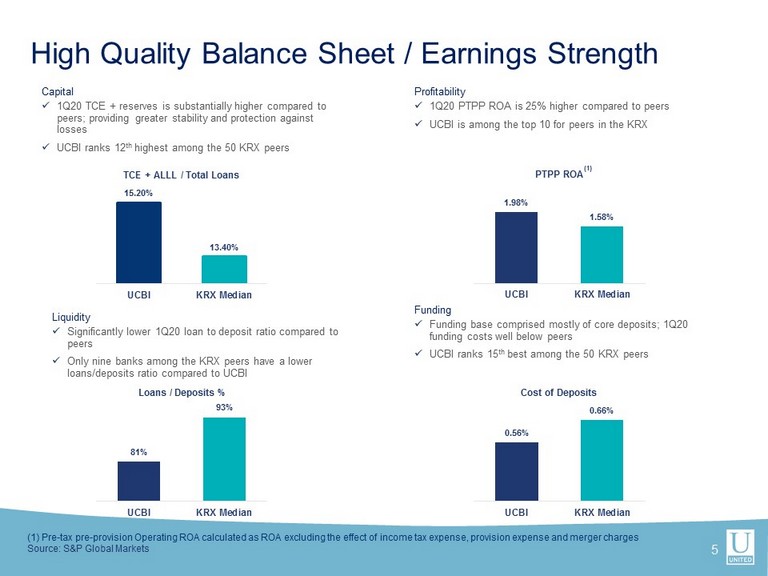
High Quality Balance Sheet / Earnings Strength 5 Capital x 1Q20 TCE + reserves is substantially higher compared to peers; providing greater stability and protection against losses x UCBI ranks 12 th highest among the 50 KRX peers (1) Pre - tax pre - provision Operating ROA calculated as ROA excluding the effect of income tax expense, provision expense and merg er charges Source: S&P Global Markets Profitability x 1Q20 PTPP ROA is 25% higher compared to peers x UCBI is among the top 10 for peers in the KRX Liquidity x Significantly lower 1Q20 loan to deposit ratio compared to peers x Only nine banks among the KRX peers have a lower loans/deposits ratio compared to UCBI Funding x Funding base comprised mostly of core deposits; 1Q20 funding costs well below peers x UCBI ranks 15 th best among the 50 KRX peers 1.98% 1.58% UCBI KRX Median PTPP ROA (1) 0.56% 0.66% UCBI KRX Median Cost of Deposits 81% 93% UCBI KRX Median Loans / Deposits % 15.20% 13.40% UCBI KRX Median TCE + ALLL / Total Loans
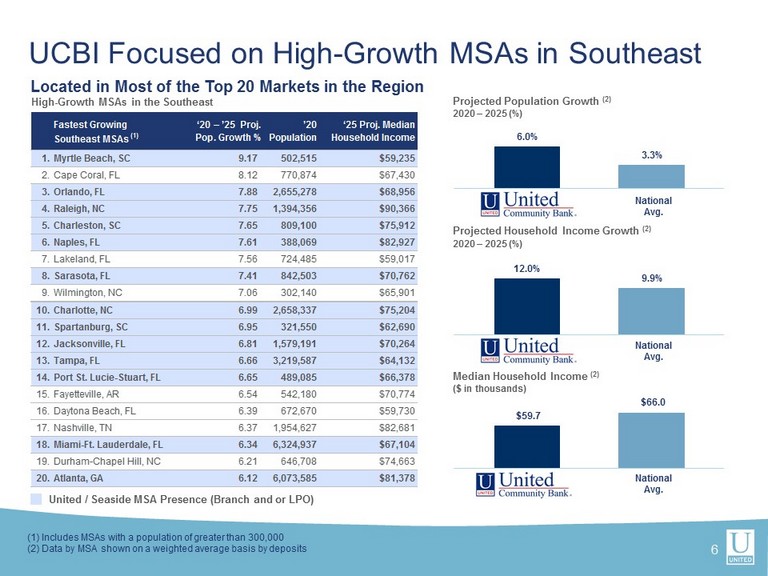
$59.7 $66.0 12.0% 9.9% 6.0% 3.3% (1) Includes MSAs with a population of greater than 300,000 (2) Data by MSA shown on a weighted average basis by deposits Located in Most of the Top 20 Markets in the Region United / Seaside MSA Presence (Branch and or LPO) Projected Population Growth (2 ) 2020 – 2025 (%) Projected Household Income Growth (2) 2020 – 2025 (%) Median Household Income (2) ($ in thousands) High - Growth MSAs in the Southeast UCBI Focused on High - Growth MSAs in Southeast National Avg. National Avg. National Avg. Fastest Growing ‘20 – ’25 Proj. ’20 ‘25 Proj. Median Southeast MSAs (1) Pop. Growth % Population Household Income 1.Myrtle Beach, SC 9.17 502,515 $59,235 2.Cape Coral, FL 8.12 770,874 $67,430 3.Orlando, FL 7.88 2,655,278 $68,956 4.Raleigh, NC 7.75 1,394,356 $90,366 5.Charleston, SC 7.65 809,100 $75,912 6.Naples, FL 7.61 388,069 $82,927 7.Lakeland, FL 7.56 724,485 $59,017 8.Sarasota, FL 7.41 842,503 $70,762 9.Wilmington, NC 7.06 302,140 $65,901 10.Charlotte, NC 6.99 2,658,337 $75,204 11.Spartanburg, SC 6.95 321,550 $62,690 12.Jacksonville, FL 6.81 1,579,191 $70,264 13.Tampa, FL 6.66 3,219,587 $64,132 14.Port St. Lucie-Stuart, FL 6.65 489,085 $66,378 15.Fayetteville, AR 6.54 542,180 $70,774 16.Daytona Beach, FL 6.39 672,670 $59,730 17.Nashville, TN 6.37 1,954,627 $82,681 18.Miami-Ft. Lauderdale, FL 6.34 6,324,937 $67,104 19.Durham-Chapel Hill, NC 6.21 646,708 $74,663 20.Atlanta, GA 6.12 6,073,585 $81,378 6
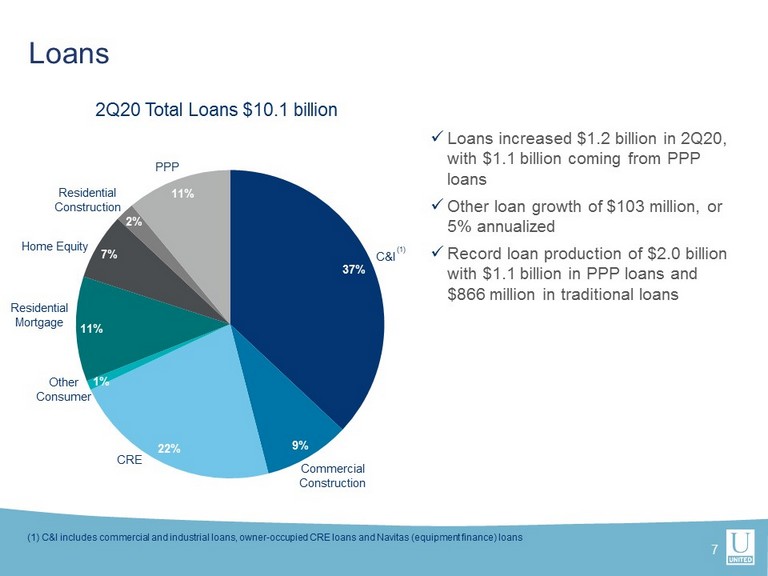
37% 9% 22% 1% 11% 7% 2% 11% Residential Mortgage Loans 2Q20 Total Loans $10.1 billion (1) C&I includes commercial and industrial loans, owner - occupied CRE loans and Navitas (equipment finance) loans x Loans increased $1.2 billion in 2Q20, with $1.1 billion coming from PPP loans x Other loan growth of $103 million, or 5% annualized x Record loan production of $2.0 billion with $1.1 billion in PPP loans and $866 million in traditional loans 7 C&I Commercial Construction CRE Other Consumer PPP Home Equity Residential Construction (1)
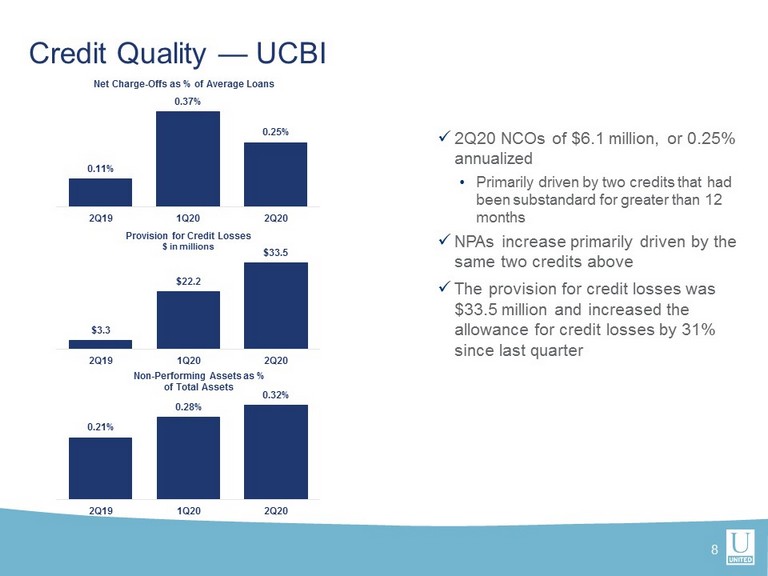
Credit Quality — UCBI 8 x 2Q20 NCOs of $6.1 million, or 0.25% annualized • Primarily driven by two credits that had been substandard for greater than 12 months x NPAs increase primarily driven by the same two credits above x The provision for credit losses was $33.5 million and increased the allowance for credit losses by 31 % since last quarter 0.11% 0.37% 0.25% 2Q19 1Q20 2Q20 $3.3 $22.2 $33.5 2Q19 1Q20 2Q20 0.21% 0.28% 0.32% 2Q19 1Q20 2Q20 Net Charge - Offs as % of Average Loans Provision for Credit Losses $ in millions Non - Performing Assets as % of Total Assets
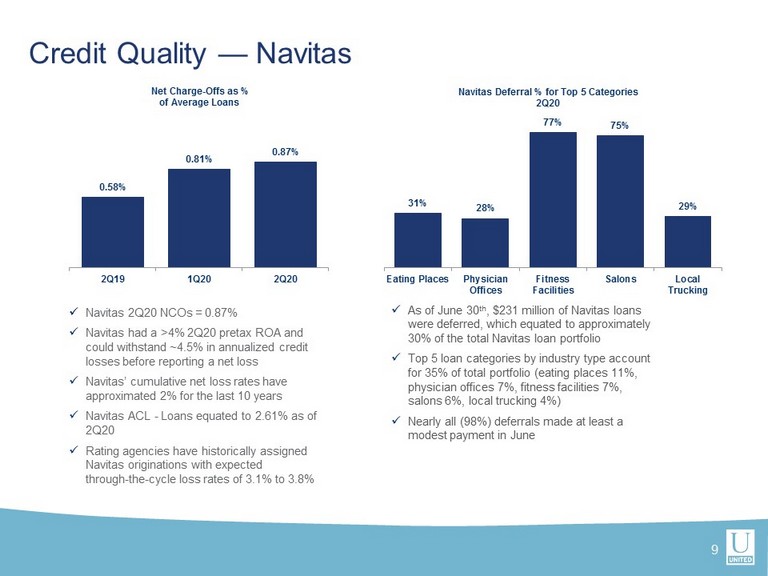
x Navitas 2Q20 NCOs = 0.87% x Navitas had a >4% 2Q20 pretax ROA and could withstand ~4.5% in annualized credit losses before reporting a net loss x Navitas ’ cumulative net loss rates have approximated 2 % for the last 10 years x Navitas ACL - Loans equated to 2.61% as of 2Q20 x Rating agencies have historically assigned Navitas originations with expected through - the - cycle loss rates of 3.1% to 3.8 % Credit Quality — Navitas 9 0.58% 0.81% 0.87% 2Q19 1Q20 2Q20 Net Charge - Offs as % of Average Loans x As of June 30 th , $231 million of Navitas loans were deferred, which equated to approximately 30% of the total Navitas loan portfolio x Top 5 loan categories by industry type account for 35% of total portfolio (eating places 11%, physician offices 7%, fitness facilities 7%, salons 6%, local trucking 4%) x Nearly all (98%) deferrals made at least a modest payment in June 31% 28% 77% 75% 29% Eating Places Physician Offices Fitness Facilities Salons Local Trucking Navitas Deferral % for Top 5 Categories 2Q20
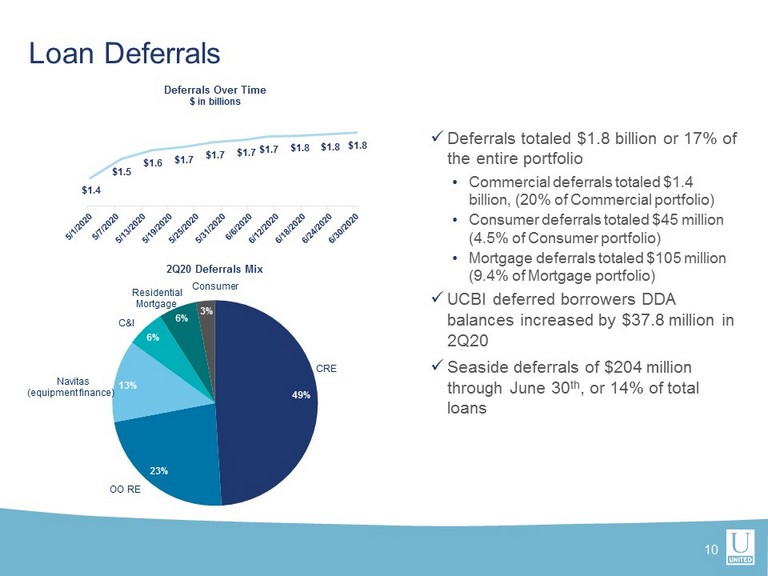
Loan Deferrals 10 x Deferrals totaled $1.8 billion or 17% of the entire portfolio • Commercial deferrals totaled $1.4 billion, (20% of Commercial portfolio) • Consumer deferrals totaled $45 million (4.5% of Consumer portfolio) • Mortgage deferrals totaled $105 million (9.4% of Mortgage portfolio) x UCBI deferred borrowers DDA balances increased by $37.8 million in 2Q20 x Seaside deferrals of $204 million through June 30 th , or 14% of total loans $1.4 $1.5 $1.6 $1.7 $1.7 $1.7 $1.7 $1.8 $1.8 $1.8 Deferrals Over Time $ in billions 49% 23% 13% 6% 6% 3% 2Q20 Deferrals Mix OO RE Navitas (equipment finance) C&I Consumer Residential Mortgage CRE
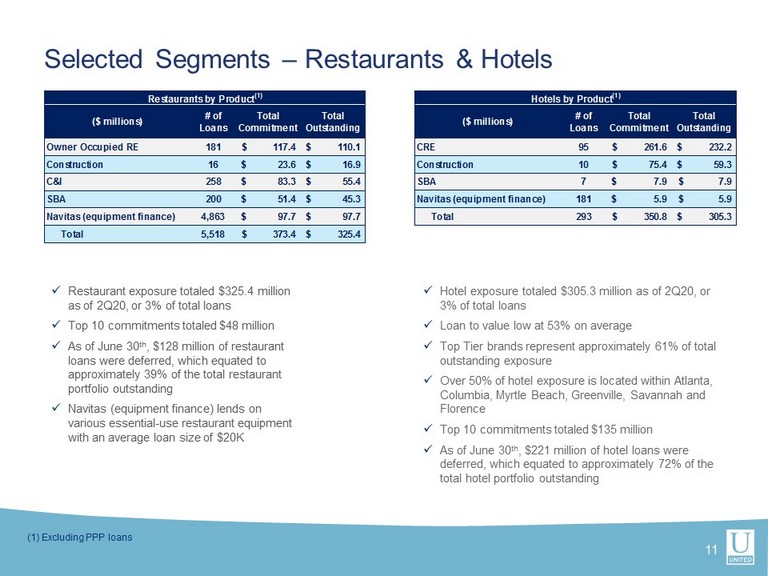
Selected Segments – Restaurants & Hotels 11 x Restaurant exposure totaled $325.4 million as of 2Q20, or 3% of total loans x Top 10 commitments totaled $48 million x As of June 30 th , $128 million of restaurant loans were deferred, which equated to approximately 39% of the total restaurant portfolio outstanding x Navitas (equipment finance) lends on various essential - use restaurant equipment with an average loan size of $20K x Hotel exposure totaled $305.3 million as of 2Q20, or 3% of total loans x Loan to value low at 53% on average x Top Tier brands represent approximately 6 1% of total outstanding exposure x Over 50% of hotel exposure is located within Atlanta, Columbia, Myrtle Beach, Greenville, Savannah and Florence x Top 10 commitments totaled $ 135 million x As of June 30 th , $221 million of hotel loans were deferred, which equated to approximately 72% of the total hotel portfolio outstanding (1) Excluding PPP loans ($ millions) # of Loans Total Commitment Total Outstanding Owner Occupied RE 181 117.4$ 110.1$ Construction 16 23.6$ 16.9$ C&I 258 83.3$ 55.4$ SBA 200 51.4$ 45.3$ Navitas (equipment finance) 4,863 97.7$ 97.7$ Total 5,518 373.4$ 325.4$ Restaurants by Product (1) ($ millions) # of Loans Total Commitment Total Outstanding CRE 95 261.6$ 232.2$ Construction 10 75.4$ 59.3$ SBA 7 7.9$ 7.9$ Navitas (equipment finance) 181 5.9$ 5.9$ Total 293 350.8$ 305.3$ Hotels by Product (1)
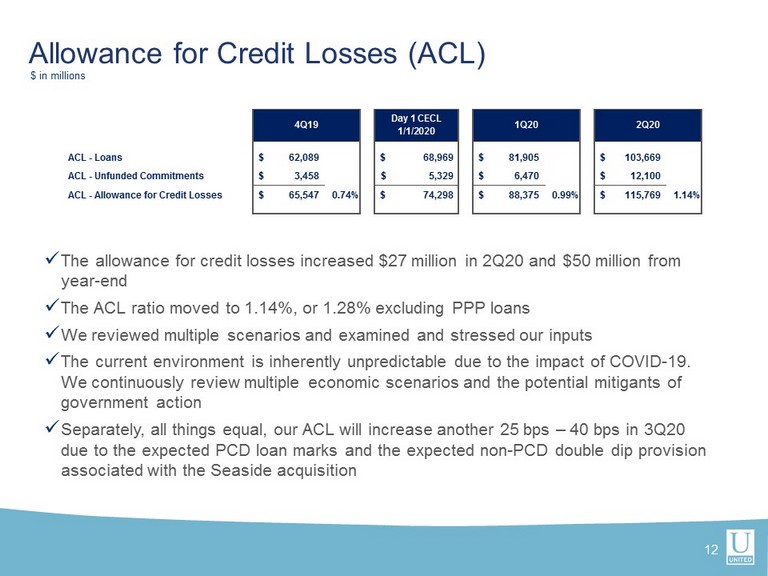
12 x The allowance for credit losses increased $27 million in 2Q20 and $50 million from year - end x The ACL ratio moved to 1.14%, or 1.28% excluding PPP loans x We reviewed multiple scenarios and examined and stressed our inputs x The current environment is inherently unpredictable due to the impact of COVID - 19. We continuously review multiple economic scenarios and the potential mitigants of government action x Separately, all things equal, our ACL will increase another 25 bps – 40 bps in 3Q20 due to the expected PCD loan marks and the expected non - PCD double dip provision associated with the Seaside acquisition Allowance for Credit Losses (ACL) $ in millions ACL - Loans 62,089$ 68,969$ 81,905$ 103,669$ ACL - Unfunded Commitments 3,458$ 5,329$ 6,470$ 12,100$ ACL - Allowance for Credit Losses 65,547$ 0.74% 74,298$ 88,375$ 0.99% 115,769$ 1.14% 4Q19 Day 1 CECL 1/1/2020 1Q20 2Q20
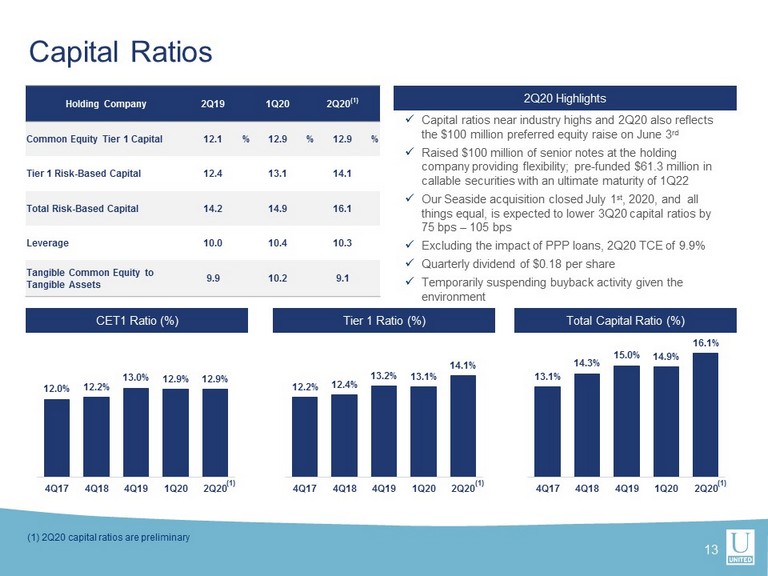
Capital Ratios 2Q20 Highlights CET1 Ratio (%) Tier 1 Ratio (%) Total Capital Ratio (%) Holding Company 2Q19 1Q20 2Q20 (1) Common Equity Tier 1 Capital 12.1 % 12.9 % 12.9 % Tier 1 Risk - Based Capital 12.4 13.1 14.1 Total Risk - Based Capital 14.2 14.9 16.1 Leverage 10.0 10.4 10.3 Tangible Common Equity to Tangible Assets 9.9 10.2 9.1 (1) 2Q20 capital ratios are preliminary 12.0% 12.2% 13.0% 12.9% 12.9% 4Q17 4Q18 4Q19 1Q20 2Q20 12.2% 12.4% 13.2% 13.1% 14.1% 4Q17 4Q18 4Q19 1Q20 2Q20 13.1% 14.3% 15.0% 14.9% 16.1% 4Q17 4Q18 4Q19 1Q20 2Q20 x Capital ratios near industry highs and 2Q20 also reflects the $100 million preferred equity raise on June 3 rd x Raised $100 million of senior notes at the holding company providing flexibility; pre - funded $61.3 million in callable securities with an ultimate maturity of 1Q22 x Our Seaside acquisition closed July 1 st , 2020, and all things equal, is expected to lower 3Q20 capital ratios by 75 bps – 105 bps x Excluding the impact of PPP loans, 2Q20 TCE of 9.9% x Quarterly dividend of $0.18 per share x Temporarily suspending buyback activity given the environment 13 (1) (1) (1)
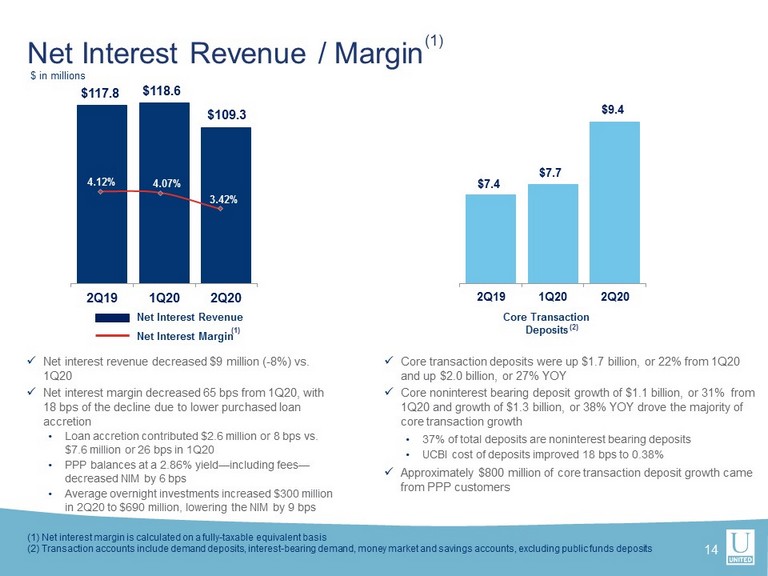
$117.8 $118.6 $109.3 2Q19 1Q20 2Q20 Net Interest Revenue / Margin (1) $ in millions x Net interest revenue decreased $9 million ( - 8%) vs. 1Q20 x Net interest margin decreased 65 bps from 1Q20, with 18 bps of the decline due to lower purchased loan accretion • Loan accretion contributed $2.6 million or 8 bps vs . $7.6 million or 26 bps in 1Q20 • PPP balances at a 2.86% yield — including fees — decreased NIM by 6 bps • Average overnight investments increased $300 million in 2Q20 to $690 million, lowering the NIM by 9 bps 4.12% 4.07% 3.42% Net Interest Revenue Net Interest Margin (1) Net interest margin is calculated on a fully - taxable equivalent basis (2) Transaction accounts include demand deposits, interest - bearing demand, money market and savings accounts, excluding public funds deposits (1) $7.4 $7.7 $9.4 2Q19 1Q20 2Q20 Core Transaction Deposits 14 x Core transaction deposits were up $1.7 billion, or 22% from 1Q20 and up $2.0 billion, or 27% YOY x Core noninterest bearing deposit growth of $1.1 billion, or 31% from 1Q20 and growth of $1.3 billion, or 38% YOY drove the majority of core transaction growth • 37% of total deposits are noninterest bearing deposits • UCBI cost of deposits improved 18 bps to 0.38 % x Approximately $800 million of core transaction deposit growth came from PPP customers (2)
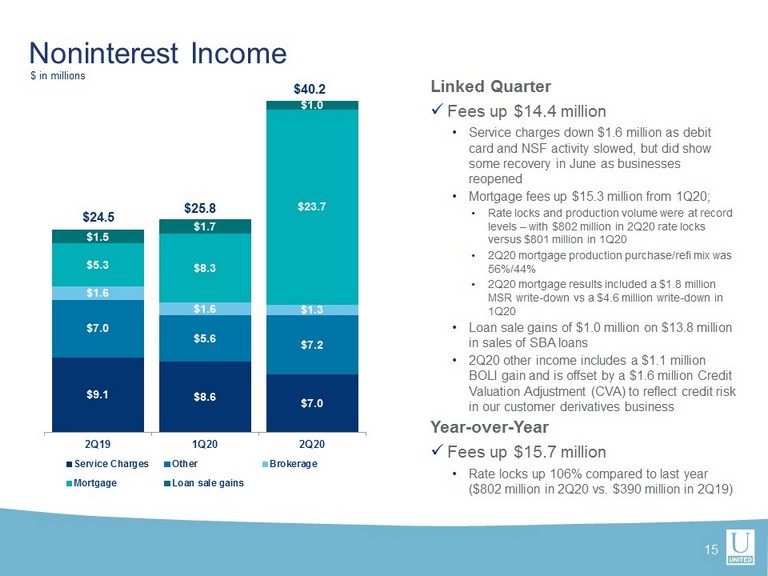
Noninterest Income $ in millions $9.1 $8.6 $7.0 $7.0 $5.6 $7.2 $1.6 $1.6 $1.3 $5.3 $8.3 $23.7 $1.5 $1.7 $1.0 2Q19 1Q20 2Q20 Service Charges Other Brokerage Mortgage Loan sale gains $ 24.5 $25.8 $40.2 Linked Quarter x Fees up $14.4 million • Service charges down $1.6 million as debit card and NSF activity slowed, but did show some recovery in June as businesses reopened • Mortgage fees up $ 15.3 million from 1Q20; • Rate locks and production volume were at record levels – with $802 million in 2Q20 rate locks versus $801 million in 1Q20 • 2Q20 mortgage production purchase/refi mix was 56%/44% • 2Q20 mortgage results included a $1.8 million MSR write - down vs a $4.6 million write - down in 1Q20 • Loan sale gains of $1.0 million on $13.8 million in sales of SBA loans • 2Q20 other income includes a $1.1 million BOLI gain and is offset by a $1.6 million Credit Valuation Adjustment (CVA) to reflect credit risk in our customer derivatives business Year - over - Year x Fees up $15.7 million • Rate locks up 106% compared to last year ($802 million in 2Q20 vs. $390 million in 2Q19) 15
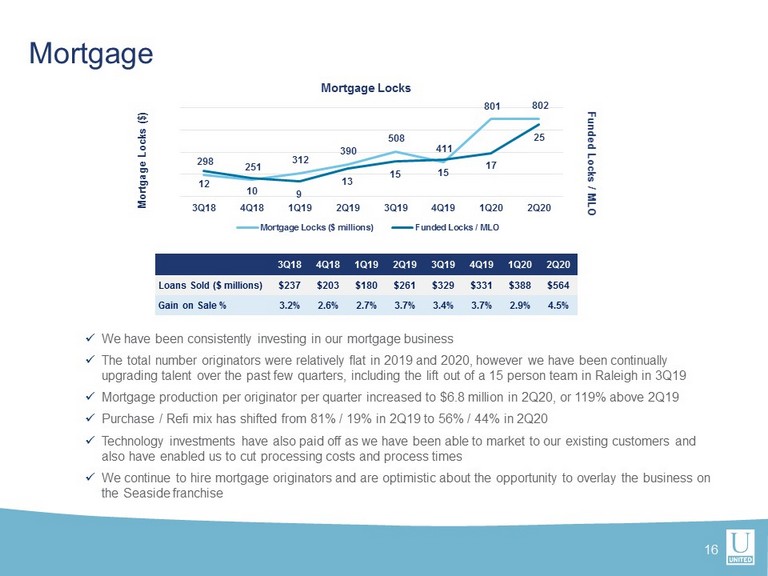
Mortgage x We have been consistently investing in our mortgage business x The total number originators were relatively flat in 2019 and 2020, however we have been continually upgrading talent over the past few quarters, including the lift out of a 15 person team in Raleigh in 3Q19 x Mortgage production per originator per quarter increased to $6.8 million in 2Q20, or 119% above 2Q19 x Purchase / Refi mix has shifted from 81% / 19% in 2Q19 to 56% / 44% in 2Q20 x Technology investments have also paid off as we have been able to market to our existing customers and also have enabled us to cut processing costs and process times x We continue to hire mortgage originators and are optimistic about the opportunity to overlay the business on the Seaside franchise 298 251 312 390 508 411 801 802 12 10 9 13 15 15 17 25 5 10 15 20 25 30 100 300 500 700 900 3Q18 4Q18 1Q19 2Q19 3Q19 4Q19 1Q20 2Q20 Funded Locks / MLO Mortgage Locks ($) Mortgage Locks Mortgage Locks ($ millions) Funded Locks / MLO 3Q18 4Q18 1Q19 2Q19 3Q19 4Q19 1Q20 2Q20 Loans Sold ($ millions) $237 $203 $180 $261 $329 $331 $388 $564 Gain on Sale % 3.2% 2.6% 2.7% 3.7% 3.4% 3.7% 2.9% 4.5% 16
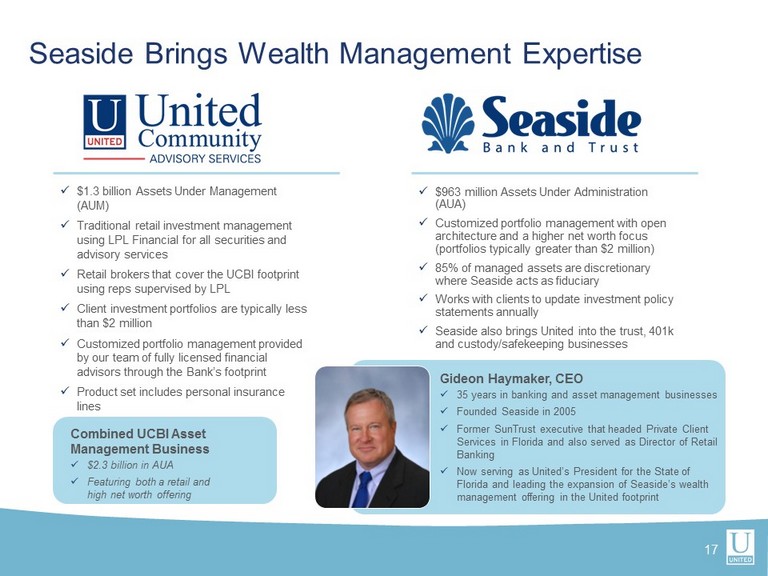
Seaside Brings Wealth Management Expertise 17 x $ 1.3 billion Assets Under Management (AUM) x Traditional retail investment management using LPL Financial for all securities and advisory services x Retail brokers that cover the UCBI footprint using reps supervised by LPL x Client investment portfolios are typically less than $2 million x Customized portfolio management provided by our team of fully licensed financial advisors through the Bank’s footprint x Product set includes personal insurance lines x $963 million Assets Under Administration (AUA) x Customized portfolio management with open architecture and a higher net worth focus (portfolios typically greater than $2 million) x 85% of managed assets are discretionary where Seaside acts as fiduciary x Works with clients to update investment policy statements annually x Seaside also brings United into the trust, 401k and custody/safekeeping businesses Combined UCBI Asset Management Business x $ 2.3 billion in AUA x Featuring both a retail and high net worth offering 17 Gideon Haymaker, CEO x 35 years in banking and asset management businesses x Founded Seaside in 2005 x Former SunTrust executive that headed Private Client Services in Florida and also served as Director of Retail Banking x Now serving as United’s President for the State of Florida and leading the expansion of Seaside’s wealth management offering in the United footprint
UCBI Funds Foundation with $1 Million United Community Bank Foundation Mission : We exist to make good things happen for good people in our communities. United established the United Community Bank Foundation in February 2020 and initially funded the foundation with $1 million. The foundation looks forward to putting it to work with deserving charities and causes throughout the footprint. 18
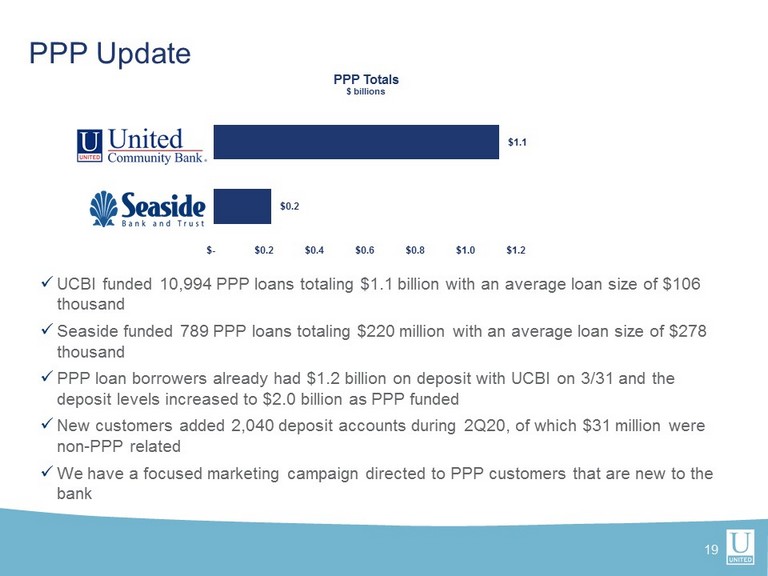
19 x UCBI funded 10,994 PPP loans totaling $1.1 billion with an average loan size of $106 thousand x Seaside funded 789 PPP loans totaling $220 million with an average loan size of $278 thousand x PPP loan borrowers already had $1.2 billion on deposit with UCBI on 3/31 and the deposit levels increased to $ 2.0 billion as PPP funded x New customers added 2,040 deposit accounts during 2Q20, of which $31 million were non - PPP related x We have a focused marketing campaign directed to PPP customers that are new to the bank PPP Update $0.2 $1.1 $- $0.2 $0.4 $0.6 $0.8 $1.0 $1.2 PPP Totals $ billions
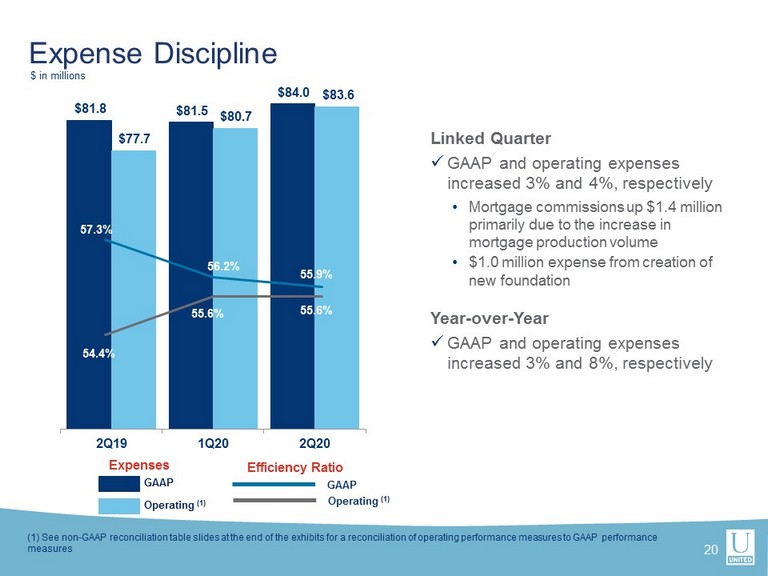
$81.8 $81.5 $84.0 $77.7 $80.7 $83.6 2Q19 1Q20 2Q20 57.3% 56.2% 55.9% 54.4% 55.6% 55.6% GAAP Operating (1) Efficiency Ratio Expenses Expense Discipline $ in millions Linked Quarter x GAAP and operating expenses increased 3% and 4%, respectively • Mortgage commissions up $1.4 million primarily due to the increase in mortgage production volume • $1.0 million expense from creation of n ew foundation Year - over - Year x GAAP and operating expenses increased 3% and 8%, respectively Operating (1) GAAP (1) See non - GAAP reconciliation table slides at the end of the exhibits for a reconciliation of operating performance measures to GAAP p erformance measures 20
Looking Forward 21 Continue investing in digital solutions to drive revenue and greater efficiencies while improving the customer experience x Expand digital sales with online account opening for business deposit products ( Bottomline Technologies) x Deliver one - to - one messaging at scale and persona - based dynamic content through a marketing automation platform (Cheetah Digital) x Enhance the m obile b anking app to increase adoption and usability (Q2) x Online appointment scheduling system allows customers to interact with branches more efficiently and avoid wait times (Kronos) x Engage customers with improved financial resource tools and content to generate higher conversion rates, increased brand loyalty and share of wallet ( Leadfusion )
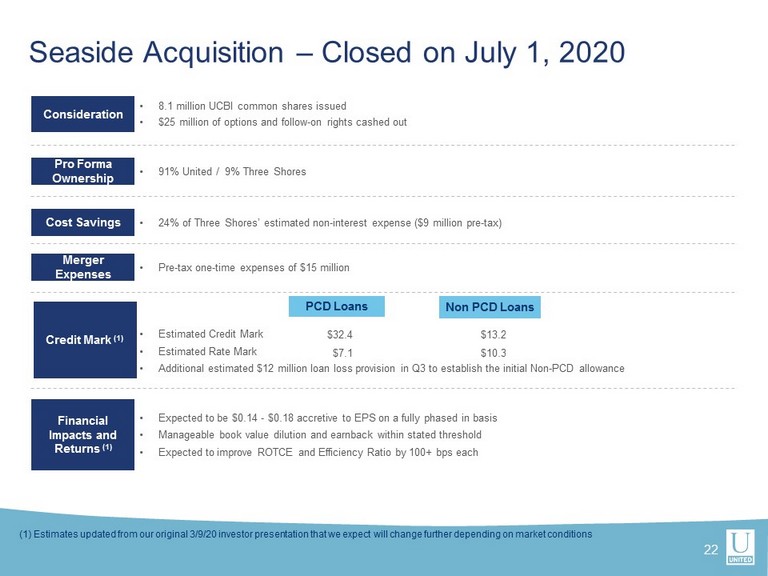
Seaside Acquisition – Closed on July 1, 2020 (1) Estimates updated from our original 3/9/20 investor presentation that we expect will change further depending on market c ond itions • 8.1 million UCBI common shares issued • $25 million of options and follow - on rights cashed out • 91% United / 9% Three Shores • 24% of Three Shores’ estimated non - interest expense ($9 million pre - tax) • Estimated Credit Mark • Estimated Rate Mark • Additional estimated $12 million loan loss provision in Q3 to establish the initial Non - PCD allowance Consideration Pro Forma Ownership Cost Savings Credit Mark (1) Financial Impacts and Returns (1) • Expected to be $ 0.14 - $ 0.18 accretive to EPS on a fully phased in basis • Manageable book value dilution and earnback within stated threshold • Expected to improve ROTCE and Efficiency Ratio by 100+ bps each • Pre - tax one - time expenses of $15 million Merger Expenses 22 PCD Loans Non PCD Loans $32.4 $13.2 $7.1 $10.3
Member FDIC. © 2020 United Community Bank 2 Q INVESTOR PRESENTATION Exhibits
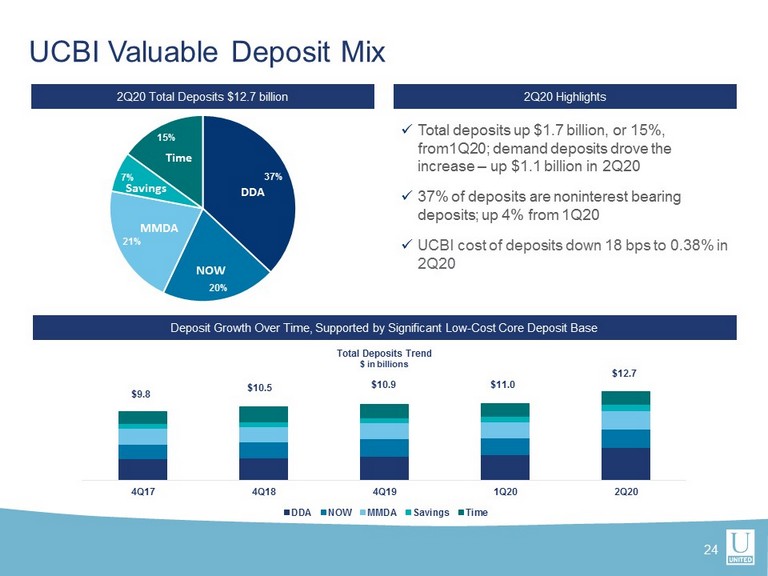
37% 20% 21% 7% 15% DDA MMDA Savings Time NOW x Total deposits up $ 1.7 billion, or 15%, from1Q20; demand deposits drove the increase – up $ 1.1 billion in 2Q20 x 37 % of deposits are noninterest bearing deposits; up 4% from 1Q20 x UCBI cost of deposits down 18 bps to 0.38% in 2Q20 UCBI Valuable Deposit Mix 2 Q20 Total Deposits $ 12.7 billion 2 Q20 Highlights Deposit Growth Over Time, Supported by Significant Low - Cost Core Deposit Base 24 4Q17 4Q18 4Q19 1Q20 2Q20 Total Deposits Trend $ in billions DDA NOW MMDA Savings Time $9.8 $10.5 $10.9 $11.0 $12.7
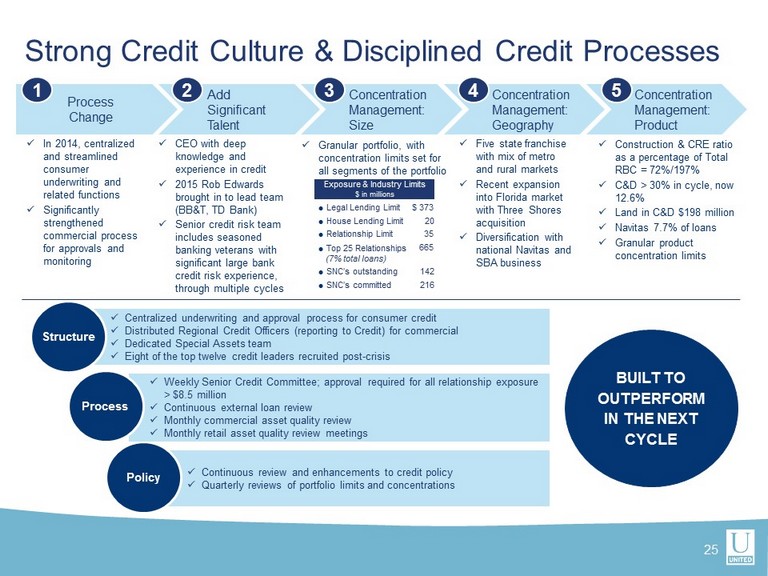
x Continuous review and enhancements to credit policy x Quarterly reviews of portfolio limits and concentrations x Centralized underwriting and approval process for consumer credit x Distributed Regional Credit Officers (reporting to Credit) for commercial x Dedicated Special Assets team x Eight of the top twelve credit leaders recruited post - crisis Strong Credit Culture & Disciplined Credit Processes x In 2014, centralized and streamlined consumer underwriting and related functions x Significantly strengthened commercial process for approvals and monitoring x CEO with deep knowledge and experience in credit x 2015 Rob Edwards brought in to lead team (BB&T, TD Bank) x Senior credit risk team includes seasoned banking veterans with significant large bank credit risk experience, through multiple cycles x Granular portfolio, with concentration limits set for all segments of the portfolio x Five state franchise with mix of metro and rural markets x Recent expansion into Florida market with Three Shores acquisition x Diversification with national Navitas and SBA business x Construction & CRE ratio as a percentage of Total RBC = 72%/197% x C&D > 30% in cycle, now 12.6% x Land in C&D $198 million x Navitas 7.7% of loans x Granular product concentration limits Process Change Add Significant Talent Concentration Management: Size Concentration Management: Product Concentration Management: Geography 1 2 3 4 5 Structure Policy Exposure & Industry Limits $ in millions House Lending Limit Relationship Limit Legal Lending Limit Top 25 Relationships (7% total loans) $ 373 20 35 665 SNC’s outstanding 142 SNC’s committed 216 x Weekly Senior Credit Committee; approval required for all relationship exposure > $ 8.5 million x Continuous external loan review x Monthly commercial asset quality review x Monthly retail asset quality review meetings Process BUILT TO OUTPERFORM IN THE NEXT CYCLE 25
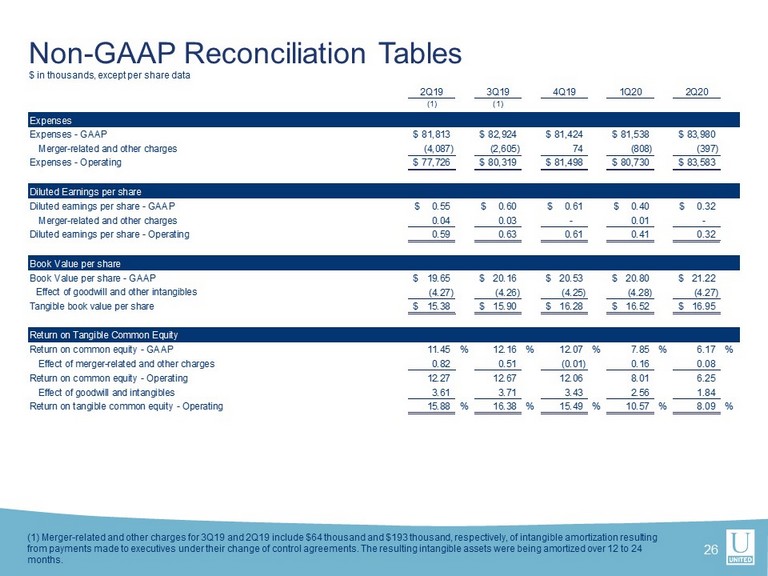
Non - GAAP Reconciliation Tables $ in thousands, except per share data 26 ( 1) Merger - related and other charges for 3Q19 and 2Q19 include $ 64 thousand and $193 thousand, respectively, of intangible amortization resulting from payments made to executives under their change of control agreements. The resulting intangible assets were being amortized over 12 to 24 months. 2Q19 3Q19 4Q19 1Q20 2Q20 (1) (1) Expenses Expenses - GAAP 81,813$ 82,924$ 81,424$ 81,538$ 83,980$ Merger-related and other charges (4,087) (2,605) 74 (808) (397) Expenses - Operating 77,726$ 80,319$ 81,498$ 80,730$ 83,583$ Diluted Earnings per share Diluted earnings per share - GAAP 0.55$ 0.60$ 0.61$ 0.40$ 0.32$ Merger-related and other charges 0.04 0.03 - 0.01 - Diluted earnings per share - Operating 0.59 0.63 0.61 0.41 0.32 Book Value per share Book Value per share - GAAP 19.65$ 20.16$ 20.53$ 20.80$ 21.22$ Effect of goodwill and other intangibles (4.27) (4.26) (4.25) (4.28) (4.27) Tangible book value per share 15.38$ 15.90$ 16.28$ 16.52$ 16.95$ Return on Tangible Common Equity Return on common equity - GAAP 11.45 % 12.16 % 12.07 % 7.85 % 6.17 % Effect of merger-related and other charges 0.82 0.51 (0.01) 0.16 0.08 Return on common equity - Operating 12.27 12.67 12.06 8.01 6.25 Effect of goodwill and intangibles 3.61 3.71 3.43 2.56 1.84 Return on tangible common equity - Operating 15.88 % 16.38 % 15.49 % 10.57 % 8.09 %
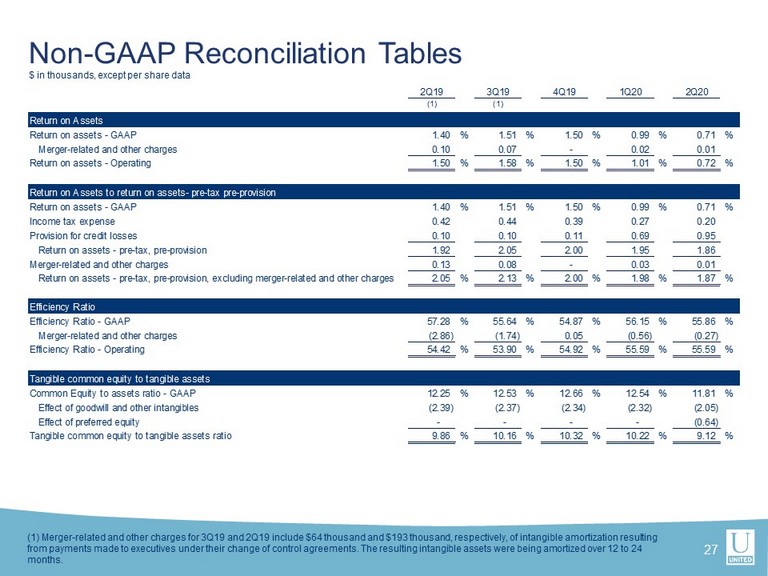
Non - GAAP Reconciliation Tables $ in thousands, except per share data (1) Merger - related and other charges for 3Q19 and 2Q19 include $ 64 thousand and $193 thousand, respectively, of intangible amortization resulting from payments made to executives under their change of control agreements. The resulting intangible assets were being amortized over 12 to 24 months. 27 2Q19 3Q19 4Q19 1Q20 2Q20 (1) (1) Return on Assets Return on assets - GAAP 1.40 % 1.51 % 1.50 % 0.99 % 0.71 % Merger-related and other charges 0.10 0.07 - 0.02 0.01 Return on assets - Operating 1.50 % 1.58 % 1.50 % 1.01 % 0.72 % Return on Assets to return on assets- pre-tax pre-provision Return on assets - GAAP 1.40 % 1.51 % 1.50 % 0.99 % 0.71 % Income tax expense 0.42 0.44 0.39 0.27 0.20 Provision for credit losses 0.10 0.10 0.11 0.69 0.95 Return on assets - pre-tax, pre-provision 1.92 2.05 2.00 1.95 1.86 Merger-related and other charges 0.13 0.08 - 0.03 0.01 Return on assets - pre-tax, pre-provision, excluding merger-related and other charges 2.05 % 2.13 % 2.00 % 1.98 % 1.87 % Efficiency Ratio Efficiency Ratio - GAAP 57.28 % 55.64 % 54.87 % 56.15 % 55.86 % Merger-related and other charges (2.86) (1.74) 0.05 (0.56) (0.27) Efficiency Ratio - Operating 54.42 % 53.90 % 54.92 % 55.59 % 55.59 % Tangible common equity to tangible assets Common Equity to assets ratio - GAAP 12.25 % 12.53 % 12.66 % 12.54 % 11.81 % Effect of goodwill and other intangibles (2.39) (2.37) (2.34) (2.32) (2.05) Effect of preferred equity - - - - (0.64) Tangible common equity to tangible assets ratio 9.86 % 10.16 % 10.32 % 10.22 % 9.12 %