Attached files
| file | filename |
|---|---|
| 8-K - 8-K - BRYN MAWR BANK CORP | bmtc-20200720.htm |
Second Quarter 2020 Earnings Review Frank Leto Mike Harrington Liam Brickley President and Chief Financial Officer Chief Credit Officer Chief Executive Officer
Forward Looking Statement This presentation contains statements which, to the extent that they are not recitations of historical fact may constitute forward-looking statements for purposes of the Securities Act of 1933, as amended, and the Securities Exchange Act of 1934, as amended. Such forward-looking statements may include financial and other projections as well as statements regarding the Corporation’s future plans, objectives, performance, revenues, growth, profits, operating expenses or the Bryn Mawr Bank Corporation’s (the “Corporation”) underlying assumptions. The words “may,” “would,” “should,” “could,” “will,” “likely,” “possibly,” “expect,” “anticipate,” “intend,” “indicate,” “estimate,” “target,” “potentially,” “promising,” “probably,” “outlook,” “predict,” “contemplate,” “continue,” “plan,” “forecast,” “project,” “annualized,” “are optimistic,” “are looking,” “are looking forward” and “believe” or other similar words and phrases may identify forward-looking statements. Persons reading this press release are cautioned that such statements are only predictions, and that the Corporation’s actual future results or performance may be materially different. Such forward-looking statements involve known and unknown risks and uncertainties. A number of factors, many of which are beyond the Corporation’s control, could cause our actual results, events or developments, or industry results, to be materially different from any future results, events or developments expressed, implied or anticipated by such forward-looking statements, and so our business and financial condition and results of operations could be materially and adversely affected. The COVID-19 pandemic is adversely affecting us, our customers, counterparties, employees, and third-party service providers, and the ultimate extent of the impacts on our business, financial position, results of operations, liquidity, and prospects is uncertain. Continued deterioration in general business and economic conditions, including further increases in unemployment rates, or turbulence in domestic or global financial markets could adversely affect our revenues and the values of our assets and liabilities, reduce the availability of funding, lead to a tightening of credit, and further increase stock price volatility. In addition, changes to statutes, regulations, or regulatory policies or practices as a result of, or in response to COVID-19, could affect us in substantial and unpredictable ways. Other factors include, among others, our need for capital, our ability to control operating costs and expenses, and to manage loan and lease delinquency rates; the credit risks of lending activities and overall quality of the composition of our loan, lease and securities portfolio; the impact of economic conditions, consumer and business spending habits, and real estate market conditions on our business and in our market area; changes in the levels of general interest rates, deposit interest rates, or net interest margin and funding sources; changes in banking regulations and policies and the possibility that any banking agency approvals we might require for certain activities will not be obtained in a timely manner or at all or will be conditioned in a manner that would impair our ability to implement our business plans; changes in accounting policies and practices or accounting standards, including ASU 2016-13 (Topic 326), “Measurement of Credit Losses on Financial Instruments,” commonly referenced as the Current Expected Credit Loss model, which has changed how we estimate credit losses and may result in further increases in the required level of our allowance for credit losses ; unanticipated regulatory or legal proceedings, outcomes of litigation or other contingencies; cybersecurity events; the inability of key third-party providers to perform their obligations to us; our ability to attract and retain key personnel; competition in our marketplace; war or terrorist activities; material differences in the actual financial results, cost savings and revenue enhancements associated with our acquisitions; uncertainty regarding the future of LIBOR; the impact of public health issues and pandemics, and their effects on the economic and business environments in which we operate, the effect of the COVID-19 pandemic, including on our credit quality and business operations, as well as its impact on general economic and financial market conditions; and other factors as described in our securities filings with the SEC. All forward-looking statements and information set forth herein are based on Corporation management’s current beliefs and assumptions as of the date hereof and speak only as of the date they are made. The Corporation does not undertake to update forward-looking statements. For a complete discussion of the assumptions, risks and uncertainties related to our business, you are encouraged to review our filings with the U.S. Securities and Exchange Commission (the “SEC”), including our most recent Annual Report on Form 10-K, as updated by our quarterly or other reports subsequently filed with the SEC. Member FDIC. Equal Housing Lender. Securities, insurance, foreign exchange, and derivatives products are not a deposit, not FDIC insured, not bank guaranteed, not insured by any federal government agency, and may lose value. Statement on Non-GAAP Measures: The Corporation believes the presentation of the following non-GAAP financial measures provides useful supplemental information that is essential to an investor’s proper understanding of the results of operations and financial condition of the Corporation. Management uses non-GAAP financial measures in its analysis of the Corporation’s performance. These non-GAAP measures should not be viewed as substitutes for the financial measures determined in accordance with GAAP, nor are they necessarily comparable to non-GAAP performance measures that may be presented by other companies. 2 2nd Quarter 2020 Earnings Review
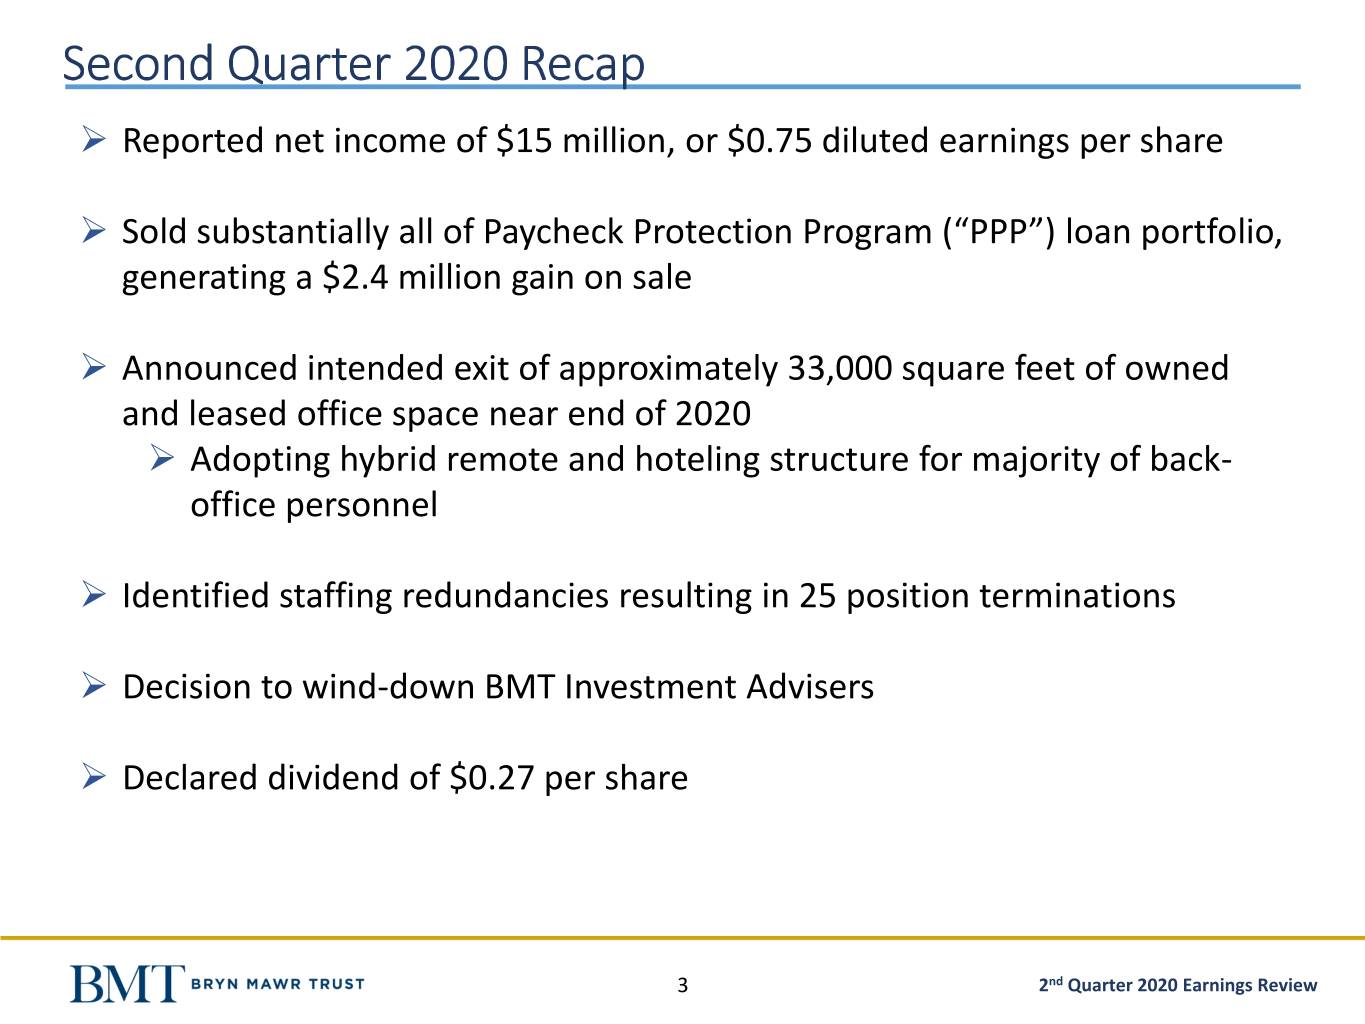
Second Quarter 2020 Recap ➢ Reported net income of $15 million, or $0.75 diluted earnings per share ➢ Sold substantially all of Paycheck Protection Program (“PPP”) loan portfolio, generating a $2.4 million gain on sale ➢ Announced intended exit of approximately 33,000 square feet of owned and leased office space near end of 2020 ➢ Adopting hybrid remote and hoteling structure for majority of back- office personnel ➢ Identified staffing redundancies resulting in 25 position terminations ➢ Decision to wind-down BMT Investment Advisers ➢ Declared dividend of $0.27 per share 3 2nd Quarter 2020 Earnings Review
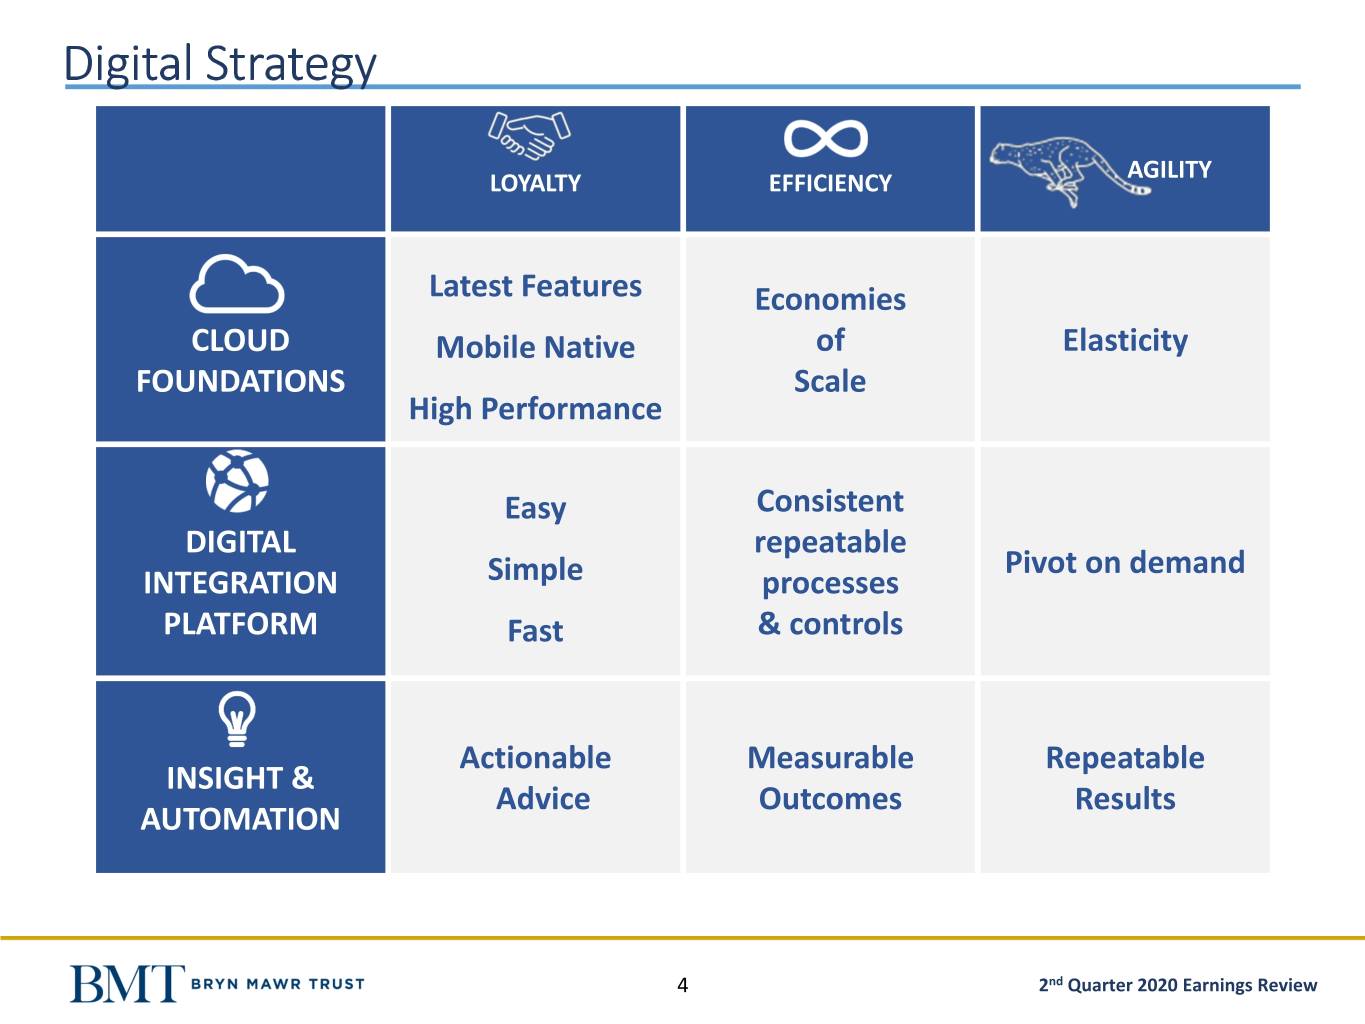
Digital Strategy AGILITY LOYALTY EFFICIENCY Latest Features Economies CLOUD Mobile Native of Elasticity FOUNDATIONS Scale High Performance Easy Consistent DIGITAL repeatable Pivot on demand INTEGRATION Simple processes PLATFORM Fast & controls Actionable Measurable Repeatable INSIGHT & Advice Outcomes Results AUTOMATION 4 2nd Quarter 2020 Earnings Review
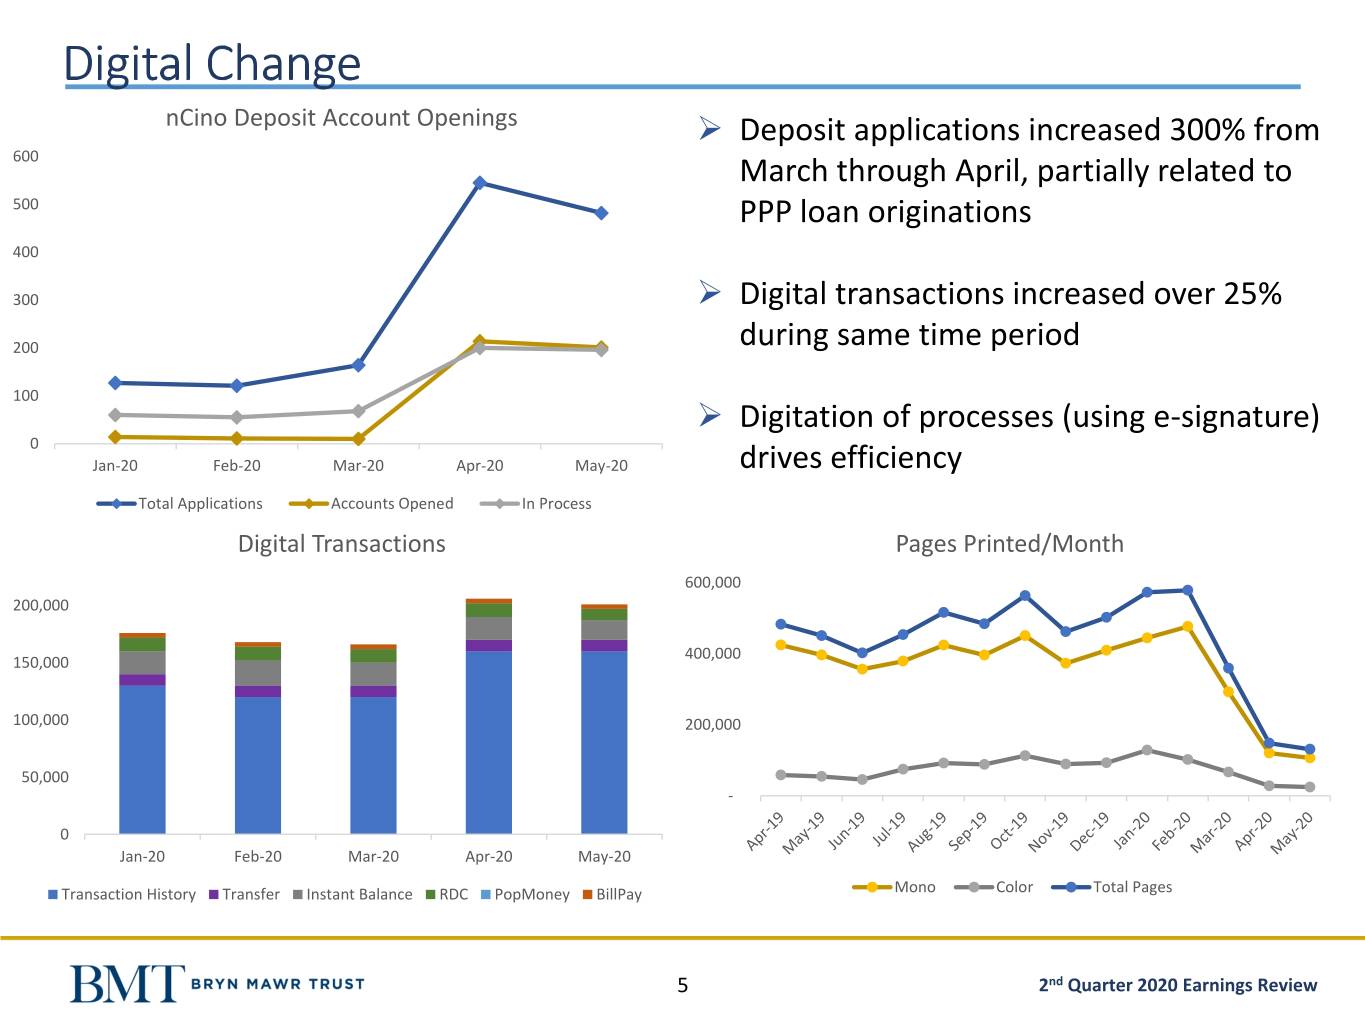
Digital Change nCino Deposit Account Openings ➢ Deposit applications increased 300% from 600 March through April, partially related to 500 PPP loan originations 400 300 ➢ Digital transactions increased over 25% 200 during same time period 100 ➢ Digitation of processes (using e-signature) 0 Jan-20 Feb-20 Mar-20 Apr-20 May-20 drives efficiency Total Applications Accounts Opened In Process Digital Transactions Pages Printed/Month 600,000 200,000 400,000 150,000 100,000 200,000 50,000 - 0 Jan-20 Feb-20 Mar-20 Apr-20 May-20 Transaction History Transfer Instant Balance RDC PopMoney BillPay Mono Color Total Pages 5 2nd Quarter 2020 Earnings Review
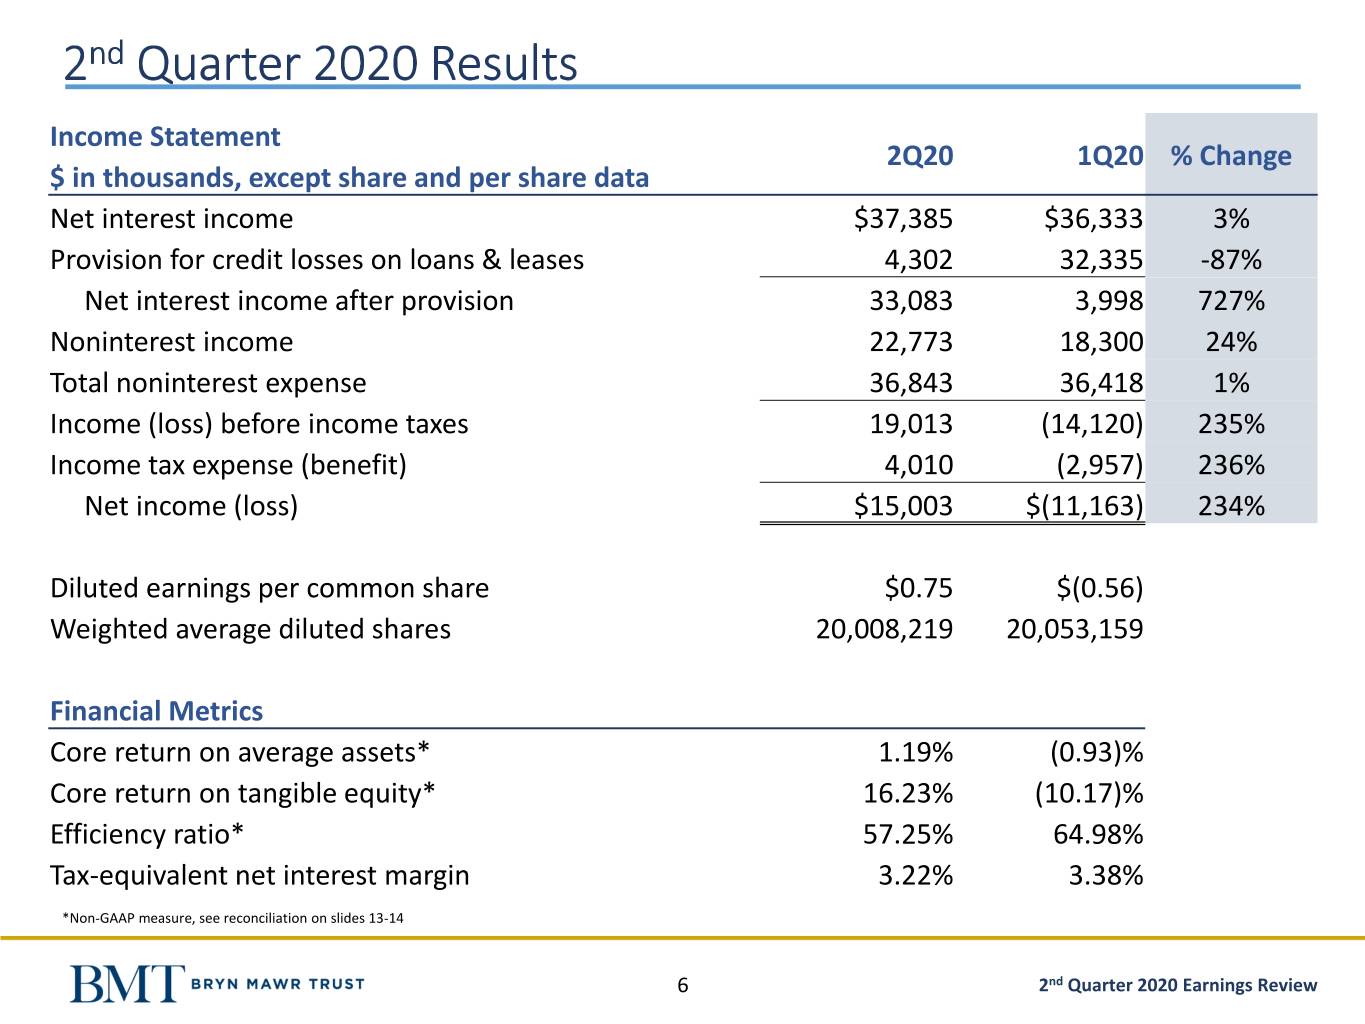
2nd Quarter 2020 Results Income Statement 2Q20 1Q20 % Change $ in thousands, except share and per share data Net interest income $37,385 $36,333 3% Provision for credit losses on loans & leases 4,302 32,335 -87% Net interest income after provision 33,083 3,998 727% Noninterest income 22,773 18,300 24% Total noninterest expense 36,843 36,418 1% Income (loss) before income taxes 19,013 (14,120) 235% Income tax expense (benefit) 4,010 (2,957) 236% Net income (loss) $15,003 $(11,163) 234% Diluted earnings per common share $0.75 $(0.56) Weighted average diluted shares 20,008,219 20,053,159 Financial Metrics Core return on average assets* 1.19% (0.93)% Core return on tangible equity* 16.23% (10.17)% Efficiency ratio* 57.25% 64.98% Tax-equivalent net interest margin 3.22% 3.38% *Non-GAAP measure, see reconciliation on slides 13-14 6 2nd Quarter 2020 Earnings Review

Balance Sheet - Liquidity - Capital Balance Sheet ($ millions) 2Q 2020 Assets 2Q20 1Q20 ▪ Loan portfolio decreased 1.2% Q over Q Assets ▪ Increase to the allowance driven by the current and Total Assets $5,271 $4,923 forward-looking adverse economic impacts of the Total Portfolio Loans & Leases 3,722 3,767 COVID-19 pandemic ACL on Loans and Leases (55.0) (54.1) 2Q 2020 Liquidity Liquidity ▪ Deposits grew 12% while the interest costs decreased 47 basis points Noninterest bearing deposits $1,217 $928 ▪ Avenues for liquidity include: Interest-bearing deposits 3,026 2,851 ▪ Significant capacity at FHLB ▪ Federal Reserve discount window Short-term borrowings 29 162 ▪ Various wholesale & brokered deposit options Loan-to-Deposit Ratio 87.7% 99.7% ▪ High quality investment portfolio acts as a source of liquidity Capital 2Q 2020 Capital Total shareholders' equity $604 $593 ▪ Bank and Corporation capital remain above well- Corp. Tier 1 leverage ratio 8.44% 8.88% capitalized ▪ Corp. CET1 ratio 10.71% 10.25% Paused stock buyback program in March ▪ 207,201 shares repurchased previously in 1Q Tangible book value ▪ Increased shareholder dividend by 3.8% in Q2, to per common share $20.23 $19.66 $0.27 per share 7 2nd Quarter 2020 Earnings Review
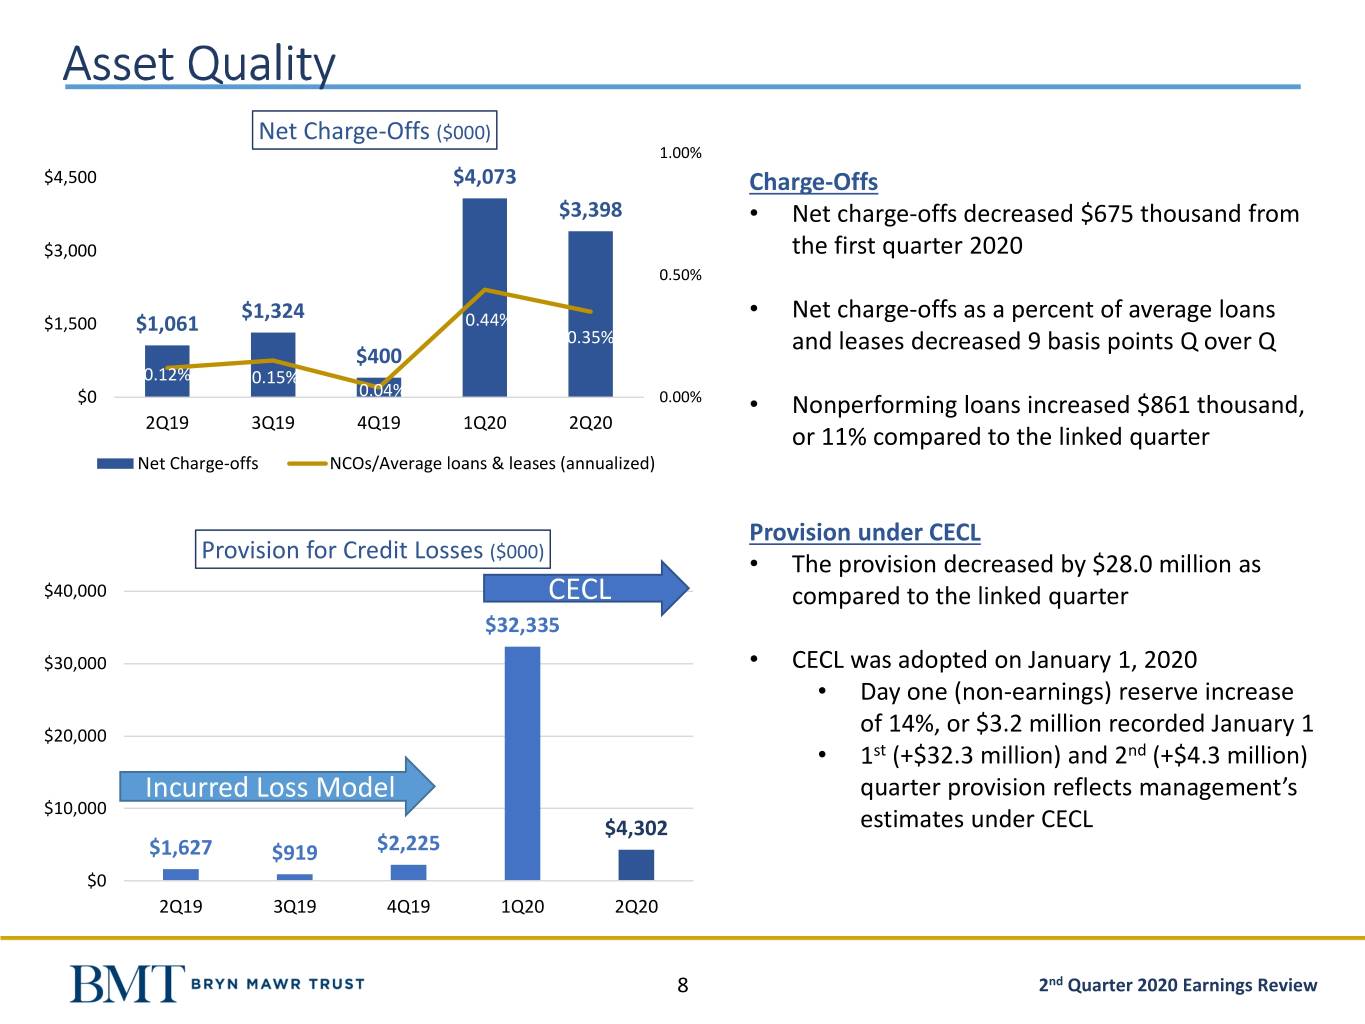
Asset Quality Net Charge-Offs ($000) 1.00% $4,500 $4,073 Charge-Offs $3,398 • Net charge-offs decreased $675 thousand from $3,000 the first quarter 2020 0.50% $1,324 • Net charge-offs as a percent of average loans $1,500 $1,061 0.44% 0.35% and leases decreased 9 basis points Q over Q $400 0.12% 0.15% 0.04% $0 0.00% • Nonperforming loans increased $861 thousand, 2Q19 3Q19 4Q19 1Q20 2Q20 or 11% compared to the linked quarter Net Charge-offs NCOs/Average loans & leases (annualized) Provision under CECL Provision for Credit Losses ($000) • The provision decreased by $28.0 million as $40,000 CECL compared to the linked quarter $32,335 $30,000 • CECL was adopted on January 1, 2020 • Day one (non-earnings) reserve increase $20,000 of 14%, or $3.2 million recorded January 1 • 1st (+$32.3 million) and 2nd (+$4.3 million) Incurred Loss Model quarter provision reflects management’s $10,000 $4,302 estimates under CECL $1,627 $919 $2,225 $0 2Q19 3Q19 4Q19 1Q20 2Q20 8 2nd Quarter 2020 Earnings Review
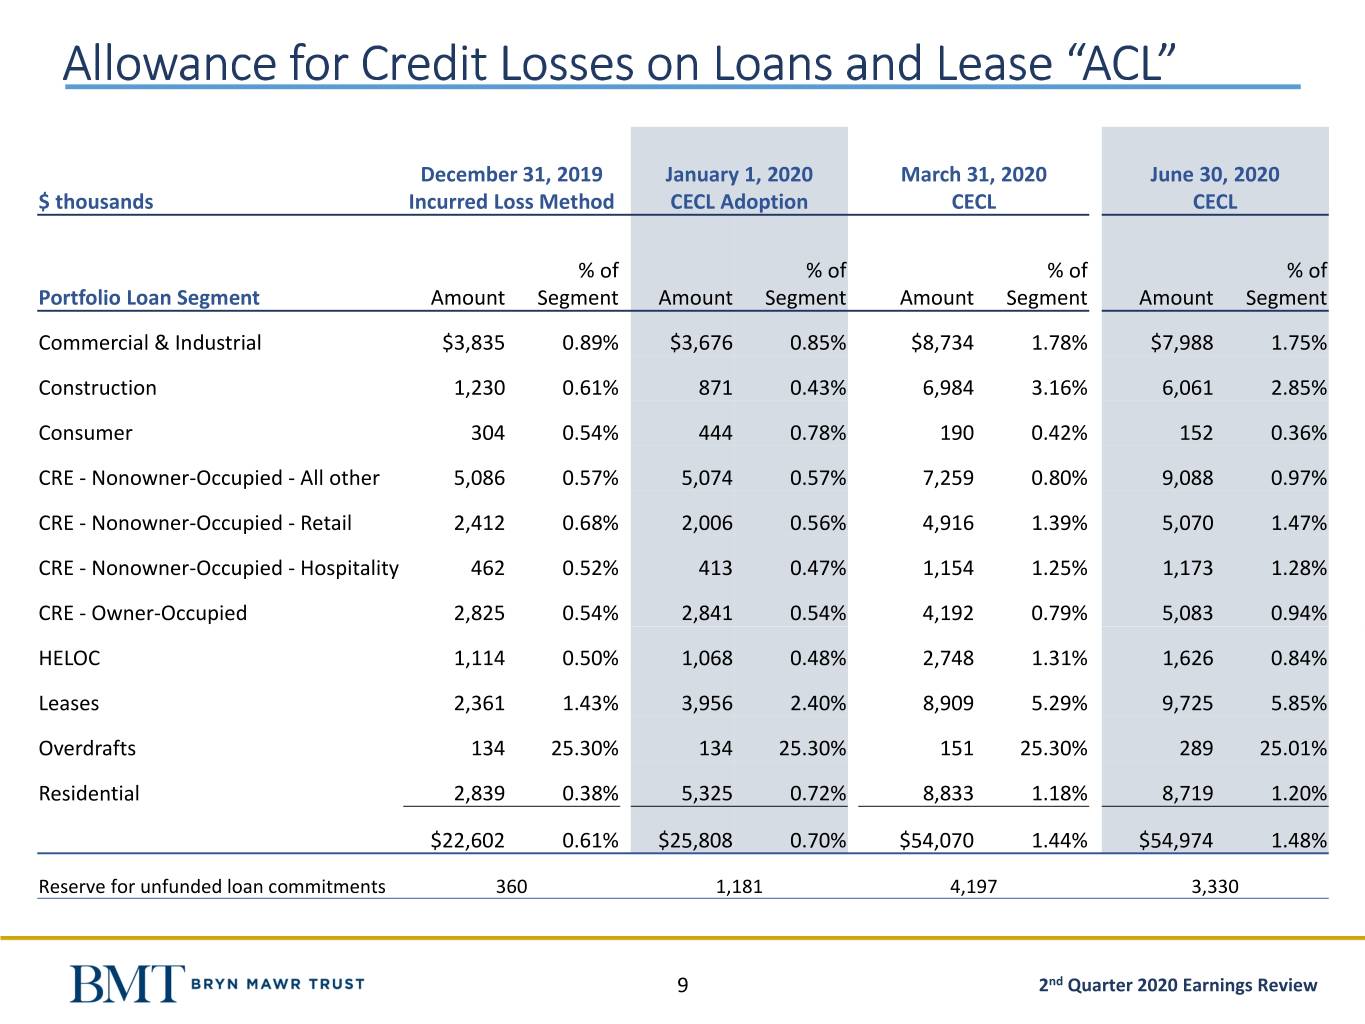
Allowance for Credit Losses on Loans and Lease “ACL” December 31, 2019 January 1, 2020 March 31, 2020 June 30, 2020 $ thousands Incurred Loss Method CECL Adoption CECL CECL % of % of % of % of Portfolio Loan Segment Amount Segment Amount Segment Amount Segment Amount Segment Commercial & Industrial $3,835 0.89% $3,676 0.85% $8,734 1.78% $7,988 1.75% Construction 1,230 0.61% 871 0.43% 6,984 3.16% 6,061 2.85% Consumer 304 0.54% 444 0.78% 190 0.42% 152 0.36% CRE - Nonowner-Occupied - All other 5,086 0.57% 5,074 0.57% 7,259 0.80% 9,088 0.97% CRE - Nonowner-Occupied - Retail 2,412 0.68% 2,006 0.56% 4,916 1.39% 5,070 1.47% CRE - Nonowner-Occupied - Hospitality 462 0.52% 413 0.47% 1,154 1.25% 1,173 1.28% CRE - Owner-Occupied 2,825 0.54% 2,841 0.54% 4,192 0.79% 5,083 0.94% HELOC 1,114 0.50% 1,068 0.48% 2,748 1.31% 1,626 0.84% Leases 2,361 1.43% 3,956 2.40% 8,909 5.29% 9,725 5.85% Overdrafts 134 25.30% 134 25.30% 151 25.30% 289 25.01% Residential 2,839 0.38% 5,325 0.72% 8,833 1.18% 8,719 1.20% $22,602 0.61% $25,808 0.70% $54,070 1.44% $54,974 1.48% Reserve for unfunded loan commitments 360 1,181 4,197 3,330 9 2nd Quarter 2020 Earnings Review
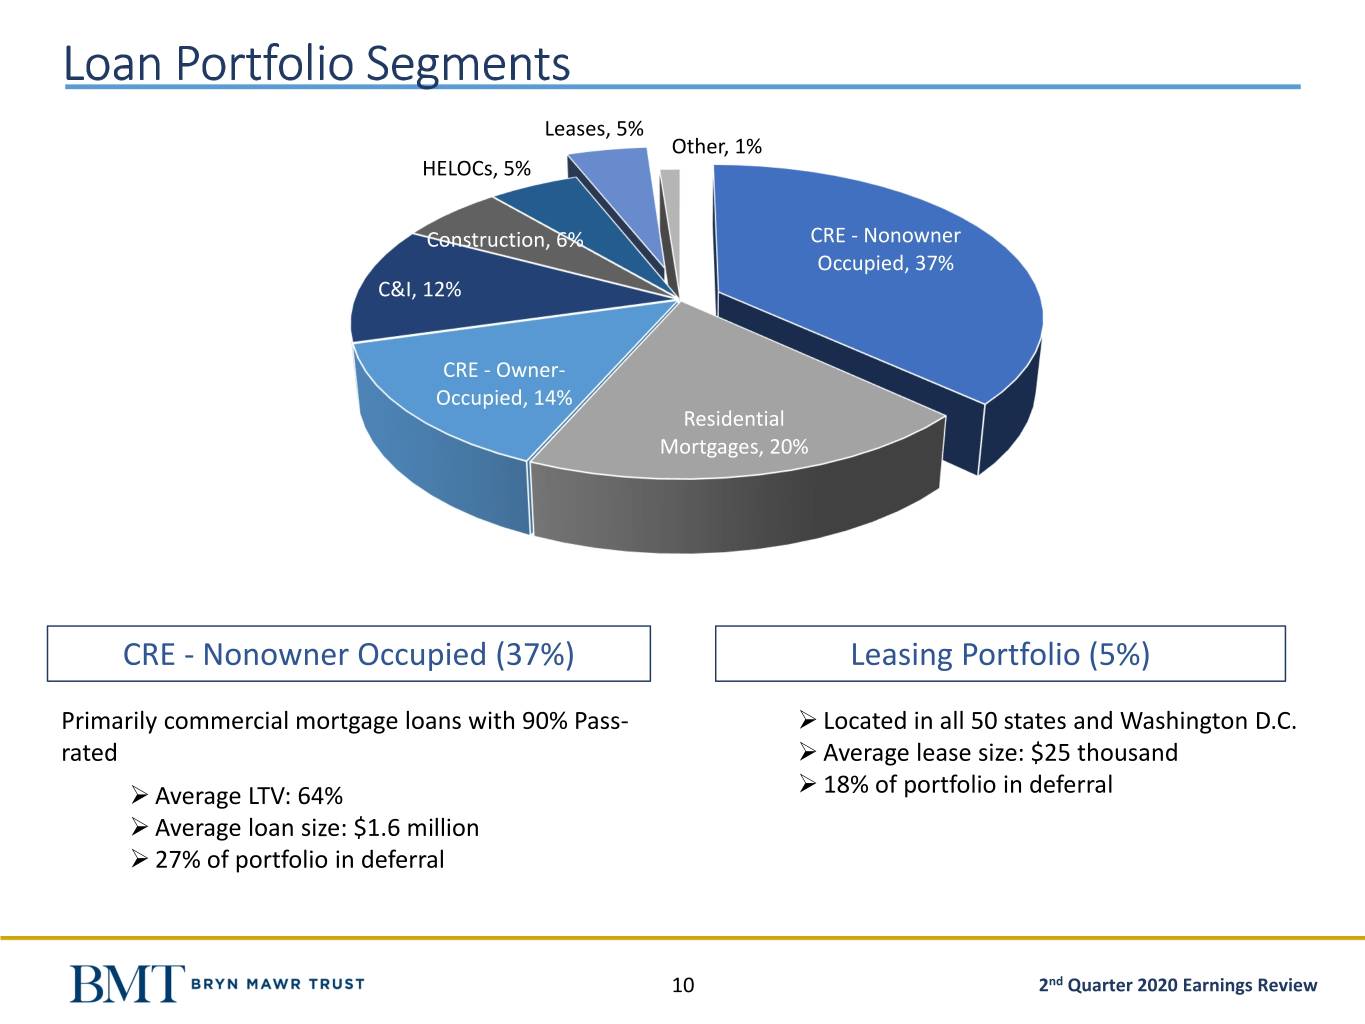
Loan Portfolio Segments Leases, 5% Other, 1% HELOCs, 5% Construction, 6% CRE - Nonowner Occupied, 37% C&I, 12% CRE - Owner- Occupied, 14% Residential Mortgages, 20% CRE - Nonowner Occupied (37%) Leasing Portfolio (5%) Primarily commercial mortgage loans with 90% Pass- ➢ Located in all 50 states and Washington D.C. rated ➢ Average lease size: $25 thousand ➢ Average LTV: 64% ➢ 18% of portfolio in deferral ➢ Average loan size: $1.6 million ➢ 27% of portfolio in deferral 10 2nd Quarter 2020 Earnings Review
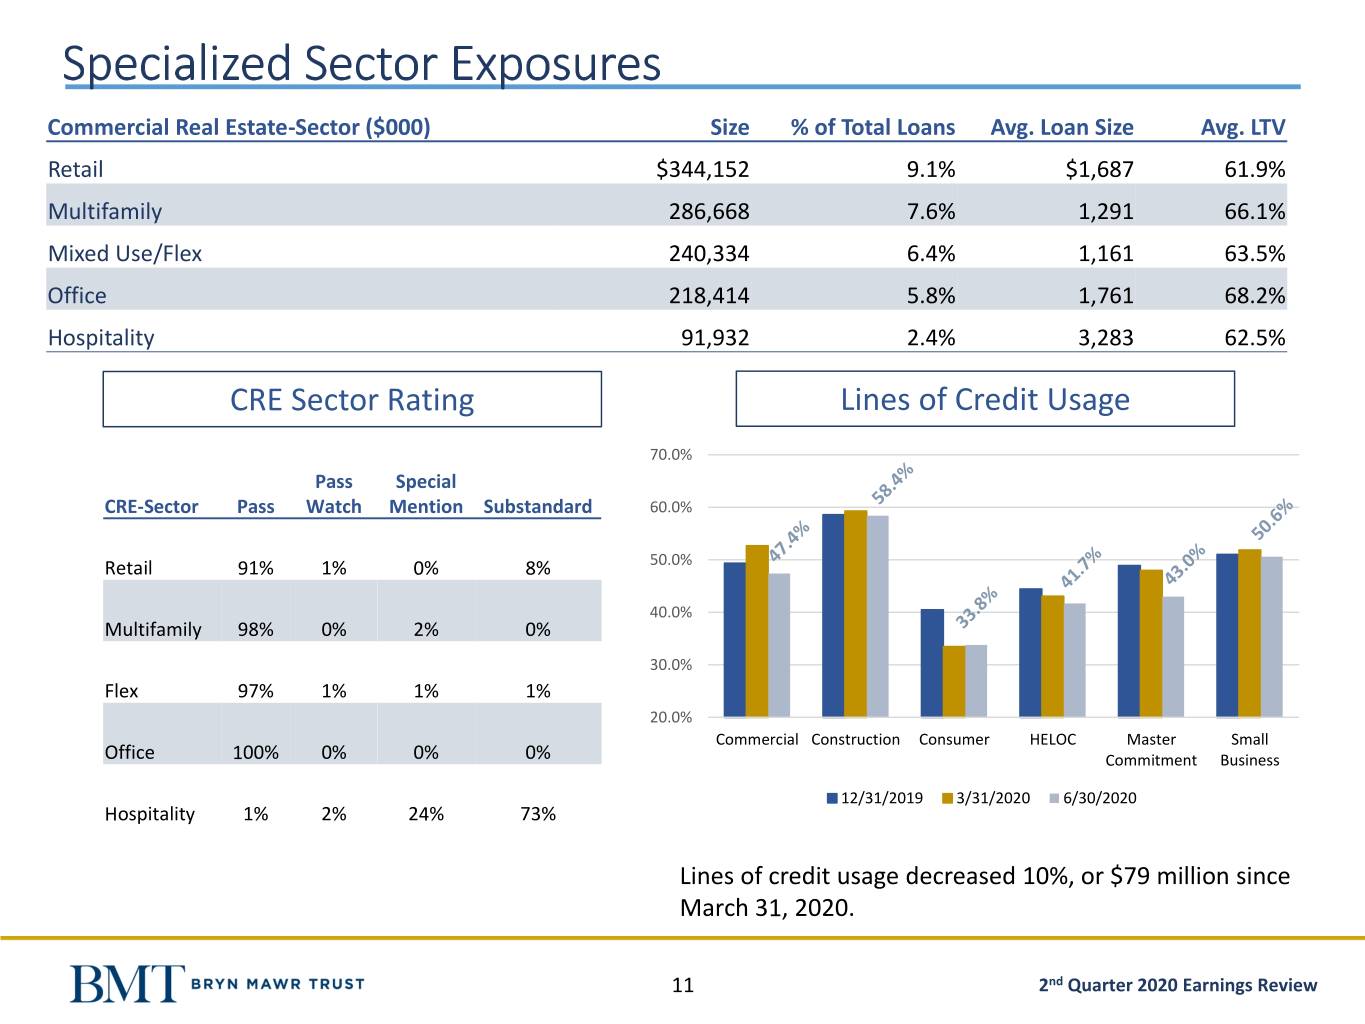
Specialized Sector Exposures Commercial Real Estate-Sector ($000) Size % of Total Loans Avg. Loan Size Avg. LTV Retail $344,152 9.1% $1,687 61.9% Multifamily 286,668 7.6% 1,291 66.1% Mixed Use/Flex 240,334 6.4% 1,161 63.5% Office 218,414 5.8% 1,761 68.2% Hospitality 91,932 2.4% 3,283 62.5% CRE Sector Rating Lines of Credit Usage 70.0% Pass Special CRE-Sector Pass Watch Mention Substandard 60.0% Retail 91% 1% 0% 8% 50.0% 40.0% Multifamily 98% 0% 2% 0% 30.0% Flex 97% 1% 1% 1% 20.0% Commercial Construction Consumer HELOC Master Small Office 100% 0% 0% 0% Commitment Business 12/31/2019 3/31/2020 6/30/2020 Hospitality 1% 2% 24% 73% Lines of credit usage decreased 10%, or $79 million since March 31, 2020. 11 2nd Quarter 2020 Earnings Review
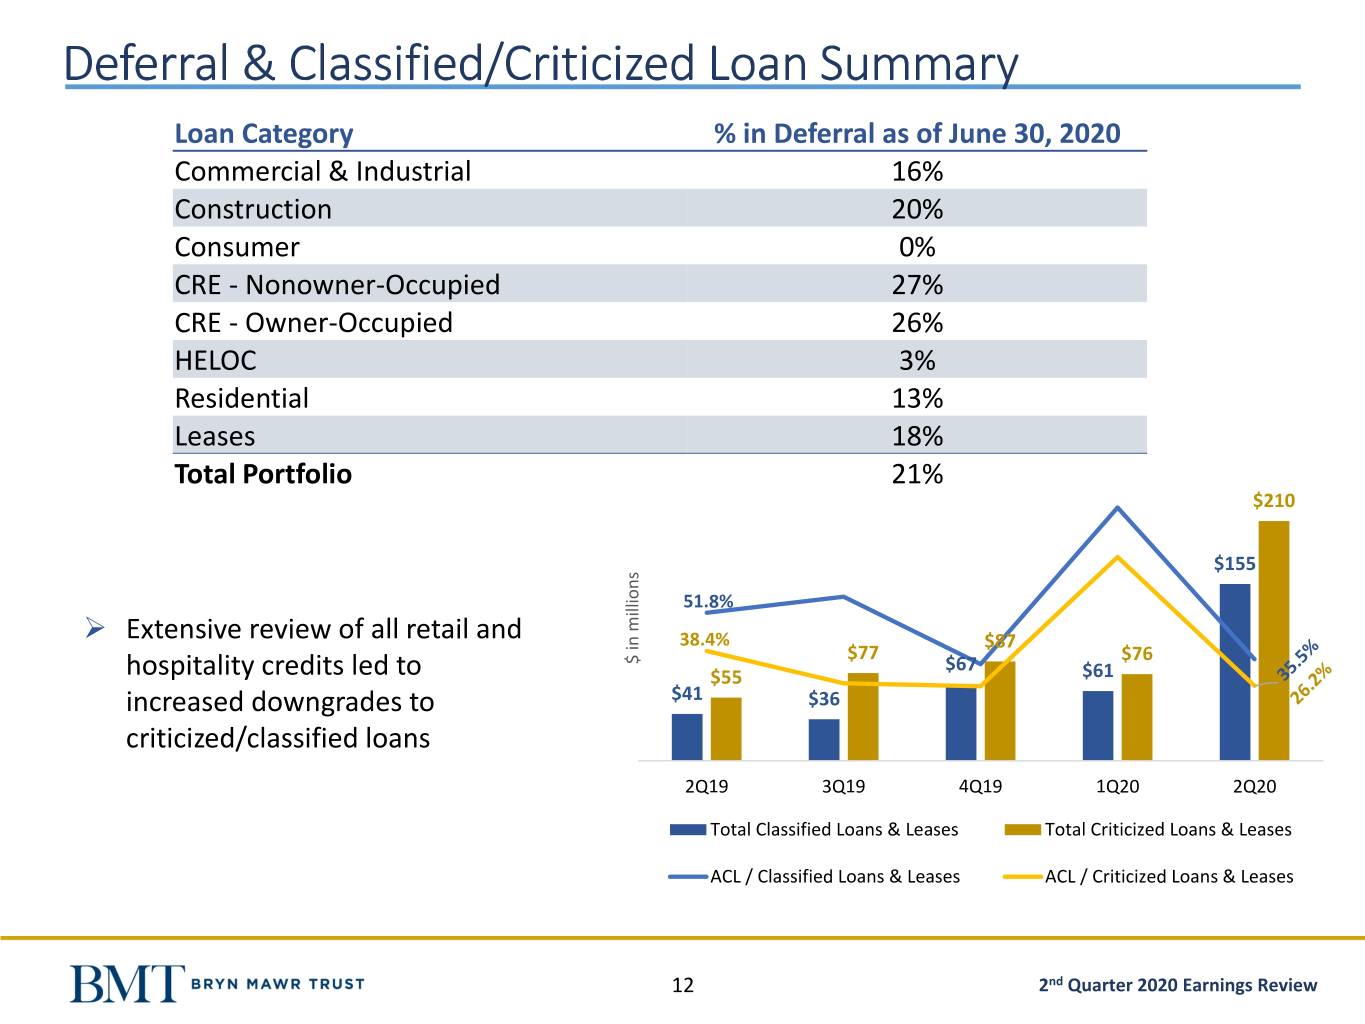
Deferral & Classified/Criticized Loan Summary Loan Category % in Deferral as of June 30, 2020 Commercial & Industrial 16% Construction 20% Consumer 0% CRE - Nonowner-Occupied 27% CRE - Owner-Occupied 26% HELOC 3% Residential 13% Leases 18% Total Portfolio 21% $210 $155 51.8% ➢ Extensive review of all retail and 38.4% $87 $ in millions in $ $77 $67 $76 hospitality credits led to $55 $61 increased downgrades to $41 $36 criticized/classified loans 2Q19 3Q19 4Q19 1Q20 2Q20 Total Classified Loans & Leases Total Criticized Loans & Leases ACL / Classified Loans & Leases ACL / Criticized Loans & Leases 12 2nd Quarter 2020 Earnings Review
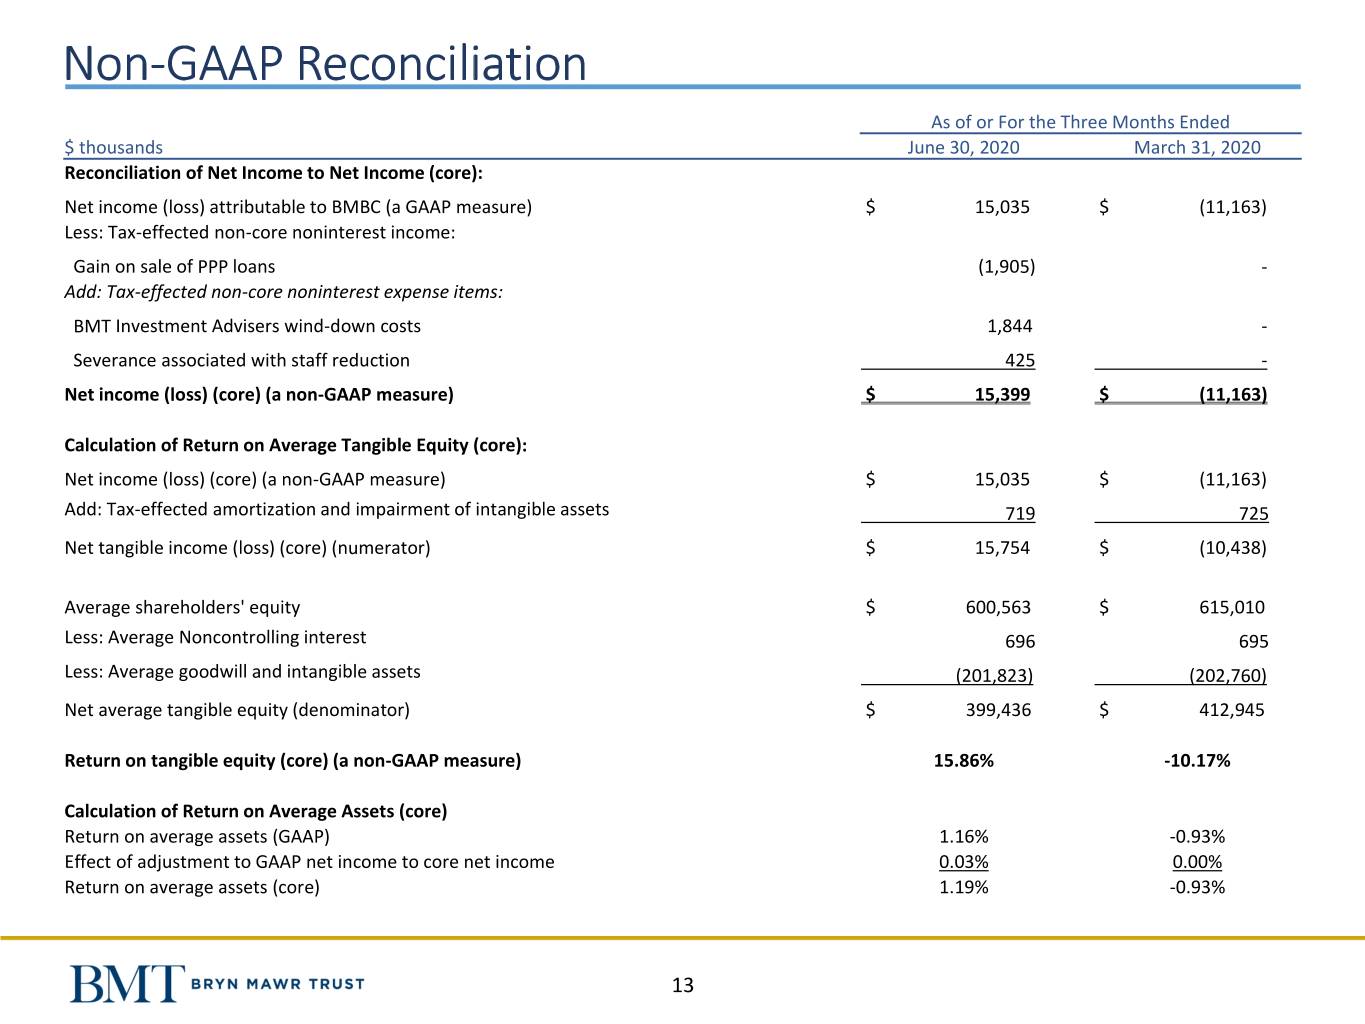
Non-GAAP Reconciliation As of or For the Three Months Ended $ thousands June 30, 2020 March 31, 2020 Reconciliation of Net Income to Net Income (core): Net income (loss) attributable to BMBC (a GAAP measure) $ 15,035 $ (11,163) Less: Tax-effected non-core noninterest income: Gain on sale of PPP loans (1,905) - Add: Tax-effected non-core noninterest expense items: BMT Investment Advisers wind-down costs 1,844 - Severance associated with staff reduction 425 - Net income (loss) (core) (a non-GAAP measure) $ 15,399 $ (11,163) Calculation of Return on Average Tangible Equity (core): Net income (loss) (core) (a non-GAAP measure) $ 15,035 $ (11,163) Add: Tax-effected amortization and impairment of intangible assets 719 725 Net tangible income (loss) (core) (numerator) $ 15,754 $ (10,438) Average shareholders' equity $ 600,563 $ 615,010 Less: Average Noncontrolling interest 696 695 Less: Average goodwill and intangible assets (201,823) (202,760) Net average tangible equity (denominator) $ 399,436 $ 412,945 Return on tangible equity (core) (a non-GAAP measure) 15.86% -10.17% Calculation of Return on Average Assets (core) Return on average assets (GAAP) 1.16% -0.93% Effect of adjustment to GAAP net income to core net income 0.03% 0.00% Return on average assets (core) 1.19% -0.93% 13
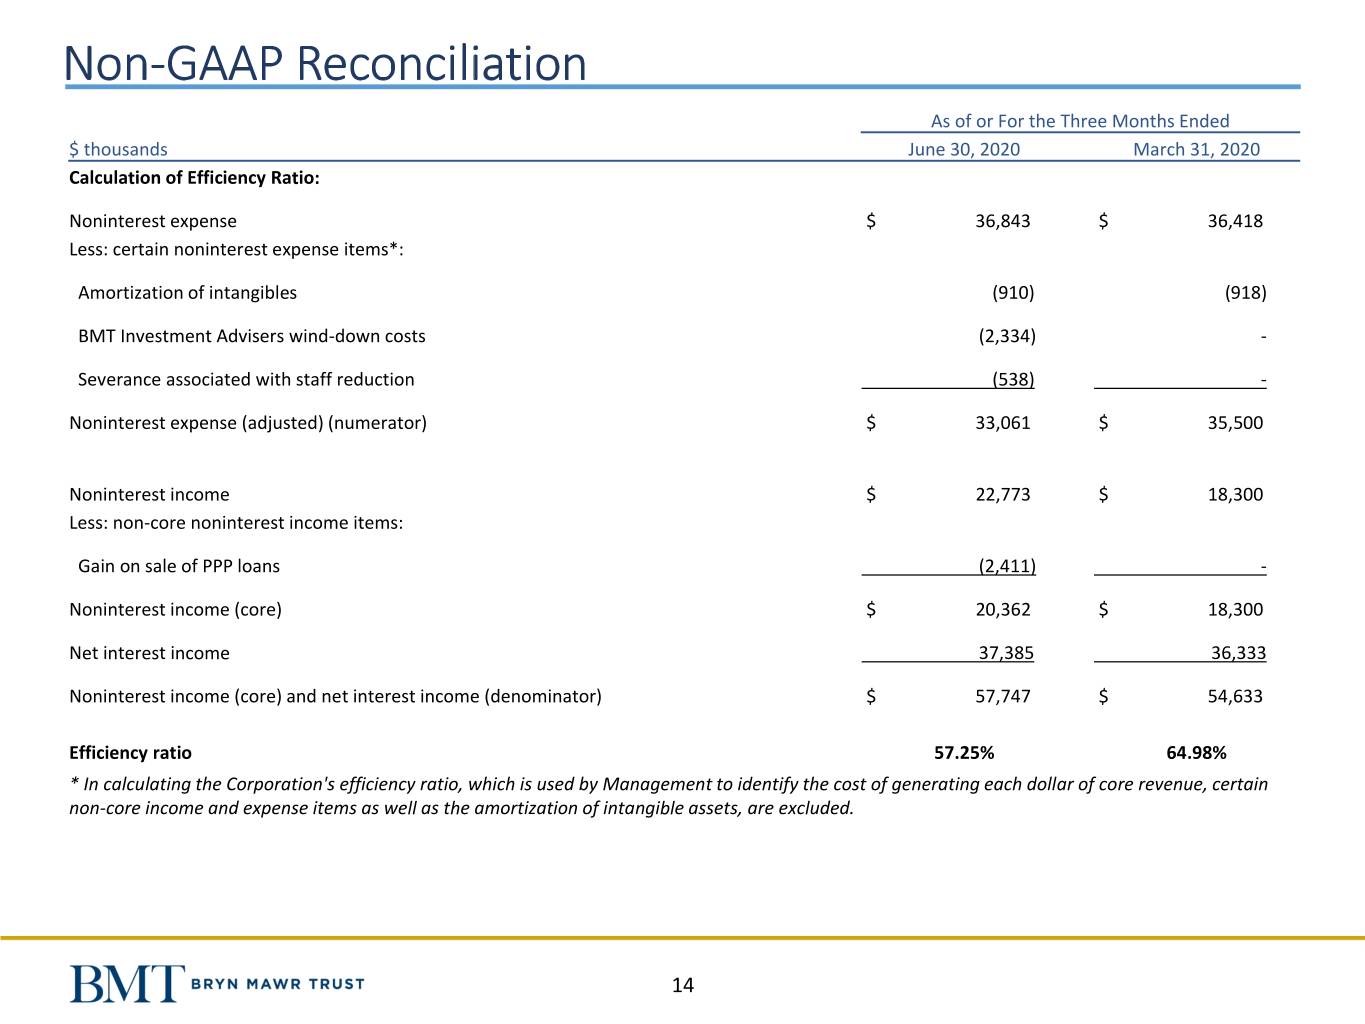
Non-GAAP Reconciliation As of or For the Three Months Ended $ thousands June 30, 2020 March 31, 2020 Calculation of Efficiency Ratio: Noninterest expense $ 36,843 $ 36,418 Less: certain noninterest expense items*: Amortization of intangibles (910) (918) BMT Investment Advisers wind-down costs (2,334) - Severance associated with staff reduction (538) - Noninterest expense (adjusted) (numerator) $ 33,061 $ 35,500 Noninterest income $ 22,773 $ 18,300 Less: non-core noninterest income items: Gain on sale of PPP loans (2,411) - Noninterest income (core) $ 20,362 $ 18,300 Net interest income 37,385 36,333 Noninterest income (core) and net interest income (denominator) $ 57,747 $ 54,633 Efficiency ratio 57.25% 64.98% * In calculating the Corporation's efficiency ratio, which is used by Management to identify the cost of generating each dollar of core revenue, certain non-core income and expense items as well as the amortization of intangible assets, are excluded. 14
