Attached files
| file | filename |
|---|---|
| EX-99.3 - EX-99.3 - InPoint Commercial Real Estate Income, Inc. | ck0001690012-ex993_70.htm |
| EX-99.1 - EX-99.1 - InPoint Commercial Real Estate Income, Inc. | ck0001690012-ex991_68.htm |
| 8-K - 8-K - InPoint Commercial Real Estate Income, Inc. | ck0001690012-8k_20200717.htm |

InPoint Management and Portfolio Update July 20, 2020 Exhibit 99.2
Disclaimer and Forward Looking Statements For Institutional Use Only. Not for distribution to the public. This presentation is neither an offer to sell nor a solicitation of an offer to buy securities. Important Note Regarding Risks and Forward-Looking Statements: Certain statements in this communication and the related webinar and 8-K constitute “forward-looking statements” within the meaning of Section 27A of the Securities Act and Section 21E of the Securities Exchange Act of 1934, as amended (the “Exchange Act”). Words such as “may,” “could,” “should,” “expect,” “intend,” “plan,” “goal,” “seek,” “anticipate,” “believe,” “estimate,” “predict,” “variables,” “potential,” “continue,” “expand,” “maintain,” “create,” “strategies,” “likely,” “will,” “would” and variations of these terms and similar expressions indicate forward-looking statements. These forward-looking statements reflect the intent, belief or current expectations of our management based on their knowledge and understanding of the business and industry, the economy and other future conditions. These statements are not factual or guarantees of future performance, and we caution stockholders not to place undue reliance on them. Actual results may differ materially from those expressed or forecasted in forward-looking statements due to a variety of risks, uncertainties and other factors, including but not limited to those in the Risk Factors section in our most recent Annual Report on Form 10-K and in subsequent filings on Form 10-Q as filed with the Securities and Exchange Commission and made available on our website. Forward-looking statements reflect our management’s view only as of the date of these communications and may ultimately prove to be incorrect. We undertake no obligation to update or revise forward-looking statements to reflect changed assumptions, the occurrence of unanticipated events or changes to future operating results except as required by applicable law. We intend for these forward-looking statements to be covered by the applicable safe harbor provisions created by Section 27A of the Securities Act and Section 21E of the Exchange Act. The Inland name is a registered trademark being used under license. This material has been distributed by Inland Securities Corporation, member FINRA/SIPC, dealer manager for InPoint Commercial Real Estate Income, Inc. Publication Date: 07/20/2020

Mitchell Sabshon President & CEO Inland Real Estate Investment Corporation Andrew Winer Portfolio Manager Sound Point Capital Management, LP Don MacKinnon Portfolio Manager Sound Point Capital Management, LP On Today’s Call
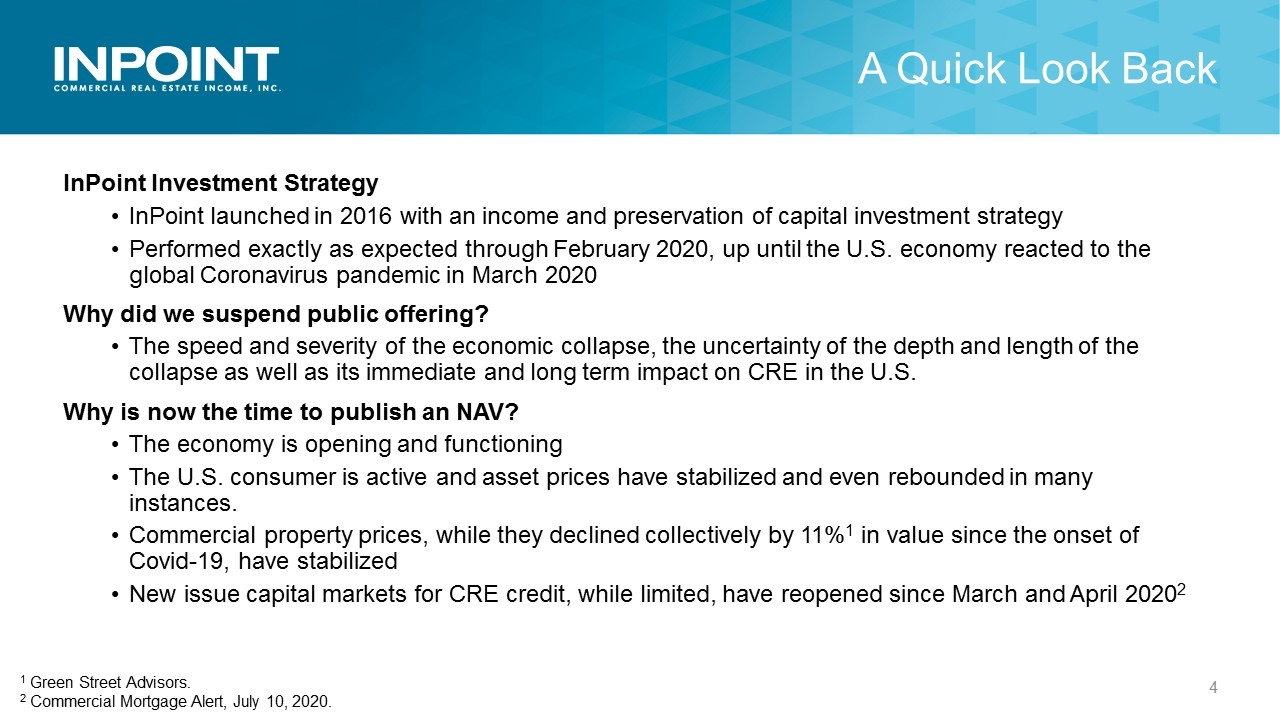
InPoint Investment Strategy InPoint launched in 2016 with an income and preservation of capital investment strategy Performed exactly as expected through February 2020, up until the U.S. economy reacted to the global Coronavirus pandemic in March 2020 Why did we suspend public offering? The speed and severity of the economic collapse, the uncertainty of the depth and length of the collapse as well as its immediate and long term impact on CRE in the U.S. Why is now the time to publish an NAV? The economy is opening and functioning The U.S. consumer is active and asset prices have stabilized and even rebounded in many instances. Commercial property prices, while they declined collectively by 11%1 in value since the onset of Covid-19, have stabilized New issue capital markets for CRE credit, while limited, have reopened since March and April 20202 A Quick Look Back 1 Green Street Advisors. 2 Commercial Mortgage Alert, July 10, 2020.
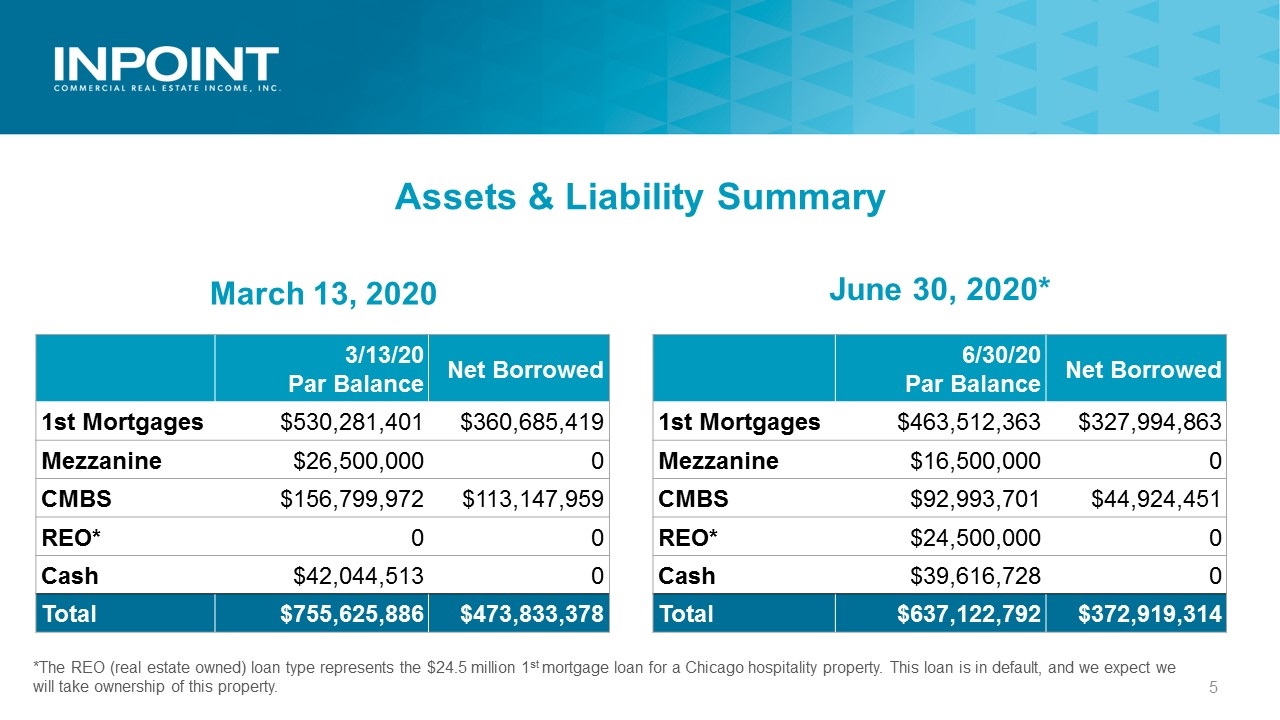
3/13/20 Par Balance Net Borrowed 1st Mortgages $530,281,401 $360,685,419 Mezzanine $26,500,000 0 CMBS $156,799,972 $113,147,959 REO* 0 0 Cash $42,044,513 0 Total $755,625,886 $473,833,378 6/30/20 Par Balance Net Borrowed 1st Mortgages $463,512,363 $327,994,863 Mezzanine $16,500,000 0 CMBS $92,993,701 $44,924,451 REO* $24,500,000 0 Cash $39,616,728 0 Total $637,122,792 $372,919,314 Assets & Liability Summary March 13, 2020 June 30, 2020* *The REO (real estate owned) loan type represents the $24.5 million 1st mortgage loan for a Chicago hospitality property. This loan is in default, and we expect we will take ownership of this property.
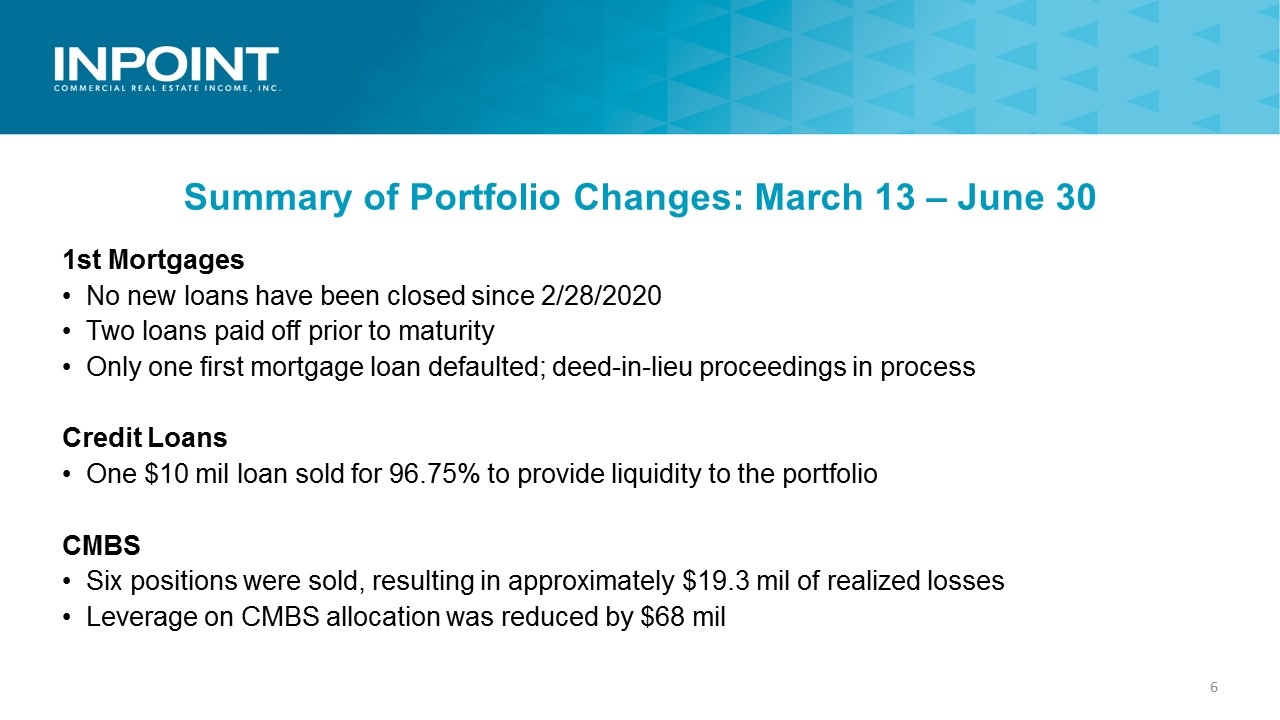
Summary of Portfolio Changes: March 13 – June 30 1st Mortgages No new loans have been closed since 2/28/2020 Two loans paid off prior to maturity Only one first mortgage loan defaulted; deed-in-lieu proceedings in process Credit Loans One $10 mil loan sold for 96.75% to provide liquidity to the portfolio CMBS Six positions were sold, resulting in approximately $19.3 mil of realized losses Leverage on CMBS allocation was reduced by $68 mil
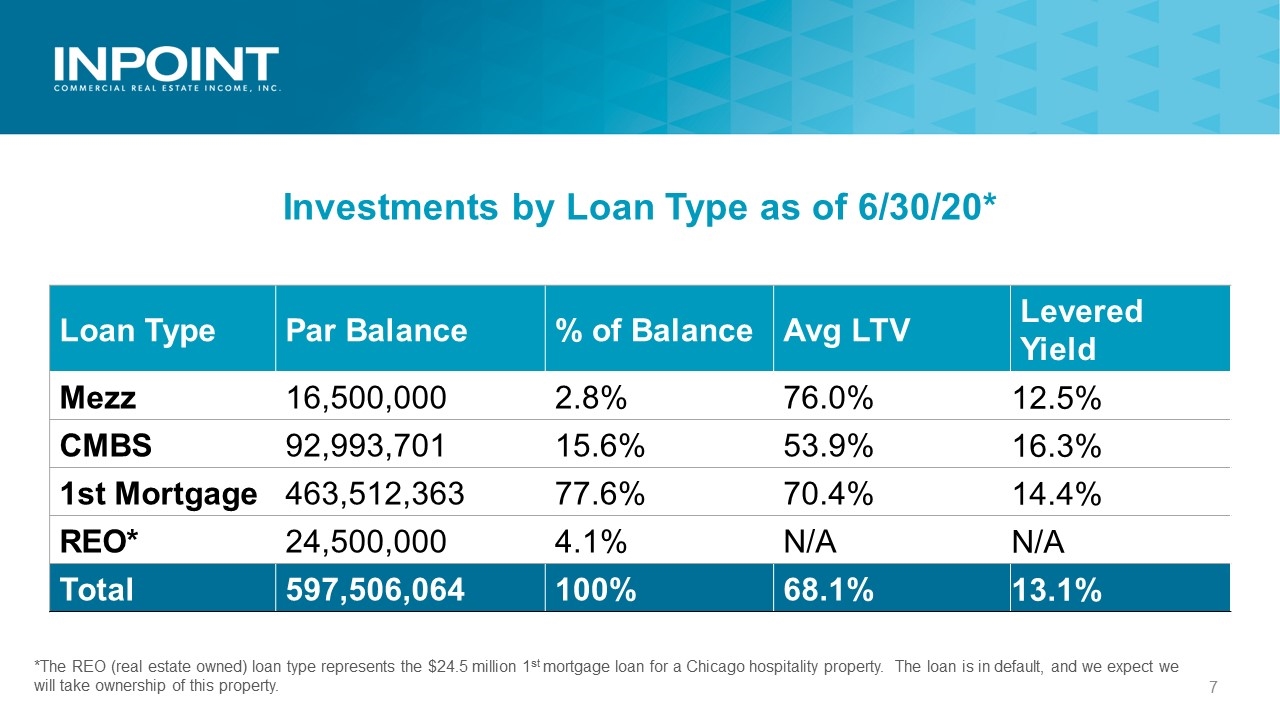
West Mid Atlantic Office Southwest West Southeast Mid Atlantic Multifamily Hospitality Investments by Loan Type as of 6/30/20* Loan Type Par Balance % of Balance Avg LTV Levered Yield Mezz 16,500,000 2.8% 76.0% 12.5% CMBS 92,993,701 15.6% 53.9% 16.3% 1st Mortgage 463,512,363 77.6% 70.4% 14.4% REO* 24,500,000 4.1% N/A N/A Total 597,506,064 100% 68.1% 13.1% *The REO (real estate owned) loan type represents the $24.5 million 1st mortgage loan for a Chicago hospitality property. The loan is in default, and we expect we will take ownership of this property.
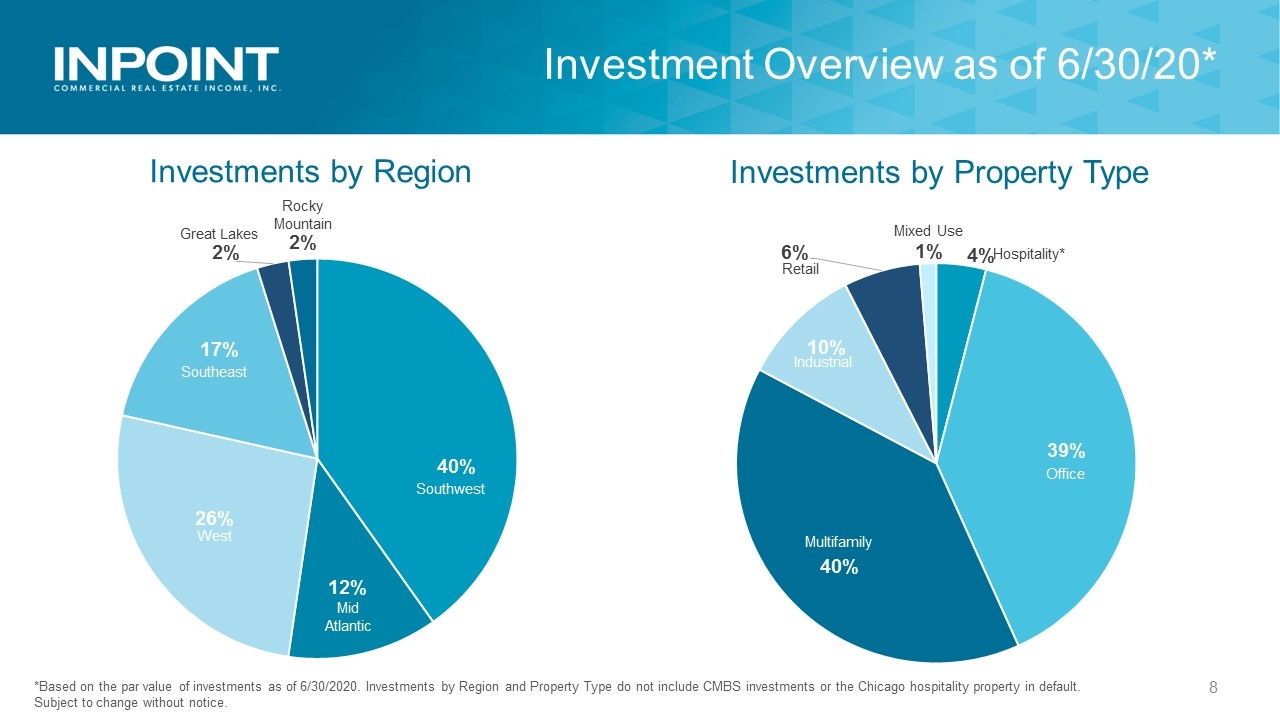
Investments by Region West Mid Atlantic Investments by Property Type Office Southwest West Southeast Mid Atlantic Rocky Mountain Multifamily Hospitality* Retail Mixed Use 1% Great Lakes Investment Overview as of 6/30/20* *Based on the par value of investments as of 6/30/2020. Investments by Region and Property Type do not include CMBS investments or the Chicago hospitality property in default. Subject to change without notice.
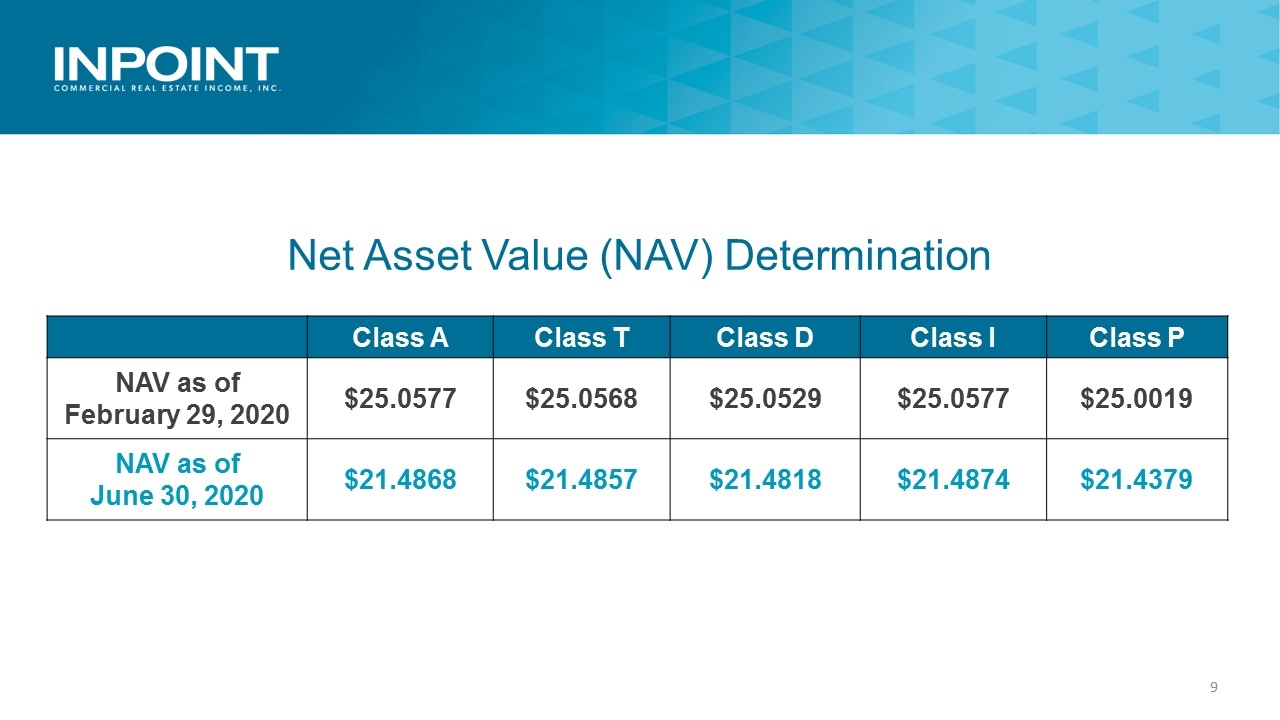
Class A Class T Class D Class I Class P NAV as of February 29, 2020 $25.0577 $25.0568 $25.0529 $25.0577 $25.0019 NAV as of June 30, 2020 $21.4868 $21.4857 $21.4818 $21.4874 $21.4379 Net Asset Value (NAV) Determination
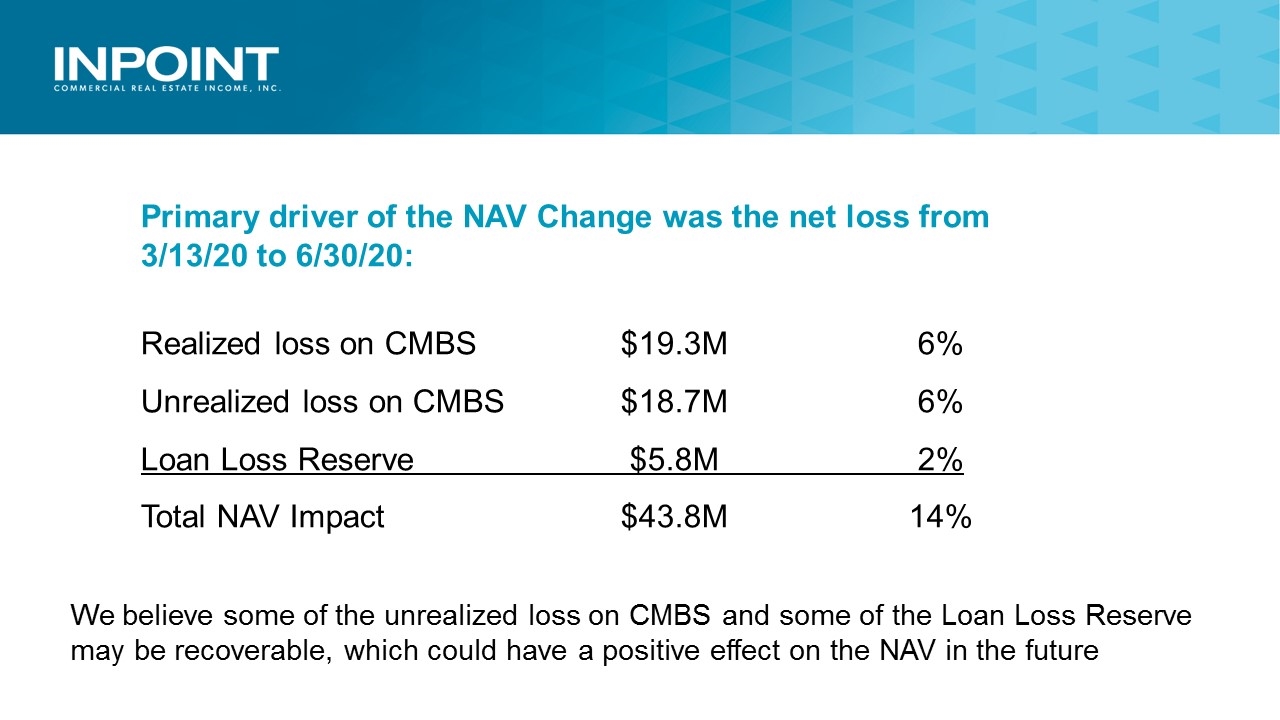
Primary driver of the NAV Change was the net loss from 3/13/20 to 6/30/20: Realized loss on CMBS $19.3M 6% Unrealized loss on CMBS $18.7M 6% Loan Loss Reserve $5.8M 2% Total NAV Impact$43.8M 14% We believe some of the unrealized loss on CMBS and some of the Loan Loss Reserve may be recoverable, which could have a positive effect on the NAV in the future
The top five CRE mortgage REITs are trading at a 45-65% discount to their pre-covid-19 values Upside potential of CMBS Portfolio Future 1st Mortgage loans will focus primarily on multifamily, industrial and office sectors Opportunity in CRE mortgage market as CRE prices have adjusted downward and capital supply will be limited Looking Ahead
Management expects to recommend to the Board of Directors the authorization of a cash distribution for stockholders as of July 31, 2020, to be payable in August 2020 Please keep in mind that we cannot guarantee that our Board will authorize a cash distribution. Declaration of distributions is within the sole authority of the Board, and the constant rapidly changing circumstances surrounding the pandemic make even short-term predictions exceedingly challenging. Our ultimate goal is to get back to pre-COVID-19 operations, including: Cash distributions Share repurchase plan Distribution reinvestment plan Reinstate InPoint’s continuous public offering of shares of common stock What to Expect in the Near Future

Thank You for Joining Us
