Attached files
| file | filename |
|---|---|
| 8-K - 8-K - FIRST HORIZON CORP | a2q20208-kdocument.htm |
1

SECOND QUARTER 2020
FINANCIAL SUPPLEMENT
If you need additional information, please contact:
Ellen Taylor, Investor Relations Aarti Bowman, Investor Relations
(901) 523-4450 (901) 523-4017
etaylor@firsthorizon.com aagoorha@firsthorizon.com
FHN TABLE OF CONTENTS
Page | |
First Horizon National Corporation Segment Structure | |
Performance Highlights | |
Consolidated Results | |
Income Statement | |
Income Statement | |
Other Income and Other Expense | |
Acquisition, Restructuring, and Rebranding Expense | |
Balance Sheet | |
Period End Balance Sheet | |
Average Balance Sheet | |
Net Interest Income | |
Average Balance Sheet: Yields and Rates | |
Capital Highlights | |
Business Segment Detail | |
Segment Highlights | |
Regional Banking | |
Fixed Income and Corporate | |
Non-Strategic | |
Asset Quality | |
Asset Quality: Consolidated | |
Asset Quality: Regional Banking and Corporate | |
Asset Quality: Non-Strategic | |
Non-GAAP to GAAP Reconciliation | |
Glossary of Terms | |
Forward-Looking Statements
This communication may contain forward-looking information, including guidance, involving significant risks and uncertainties. Forward-looking information is identified by words such as "believe," "expect," "anticipate," "intend," "estimate," "should," "is likely," "will," "going forward," and other expressions that indicate future events and trends and may be followed by or reference cautionary statements. A number of factors could cause actual results to differ materially from results stated in or suggested by forward-looking information. Those factors include: general economic and financial market conditions, including expectations of and actual timing and amount of interest rate movements including the slope of the yield curve; competition; ability to execute business plans; regional, national, and world-wide political developments; recent and future legislative and regulatory developments; inflation or deflation; market (particularly real estate market) and monetary fluctuations; pestilence; man-made or natural disasters; customer, investor and regulatory responses to any of those conditions or events; matters mentioned in this release; critical accounting estimates; FHN’s success in executing its business plans and strategies following its 2020 merger with IBERIABANK Corporation, and managing the risks involved; the potential impacts on FHN’s businesses of the coronavirus COVID-19 pandemic, including negative impacts from quarantines, market declines, and volatility, and changes in customer behavior related to COVID-19; and other factors described in FHN's annual report on Form 10-K, FHN’s other recent filings with the SEC, and FHN’s most recent earnings release and related materials. FHN disclaims any obligation to update any forward-looking statements to reflect future events or developments, or changes in expectations.
Use of Non-GAAP Measures and Regulatory Measures that are not GAAP
Certain measures are included in this financial supplement that are “non-GAAP,” meaning (under U.S. financial reporting rules) they are not presented in accordance with generally accepted accounting principles (“GAAP”) in the U.S. and also are not codified in U.S. banking regulations currently applicable to FHN. Although other entities may use calculation methods that differ from those used by FHN for non-GAAP measures, FHN’s management believes such measures are relevant to understanding the financial condition, capital position, and financial results of FHN and its business segments. Non-GAAP measures are reported to FHN’s management and Board of Directors through various internal reports.
Presentation of regulatory measures, some of which follow regulatory definitions rather than GAAP, provides a meaningful base for comparability to other financial institutions subject to the same regulations as FHN. Such measures are used by the various banking regulators in reviewing the performance, stability, and capital adequacy of financial institutions they regulate. Although not GAAP terms, these regulatory measures are not considered “non-GAAP” under U.S. financial reporting rules as long as their presentation conforms to regulatory standards. Regulatory measures used in this financial supplement include: common equity tier 1 capital, generally defined as common equity less goodwill, other intangibles, and certain other required regulatory deductions; tier 1 capital, generally defined as the sum of core capital (including common equity and instruments that cannot be redeemed at the option of the holder) adjusted for certain items under risk based capital regulations; and risk weighted assets (“RWA”), which is a measure of total on- and off-balance sheet assets adjusted for credit and market risk, used to determine regulatory capital ratios.
The non-GAAP measures presented in this financial supplement are pre-provision net revenue ("PPNR"), return on average tangible common equity (“ROTCE”), tangible common equity (“TCE”) to tangible assets (“TA”), and tangible book value ("TBV") per common share.
Refer to the tabular reconciliation of non-GAAP to GAAP measures and presentation of the most comparable GAAP items on page 23 of this financial supplement.
2
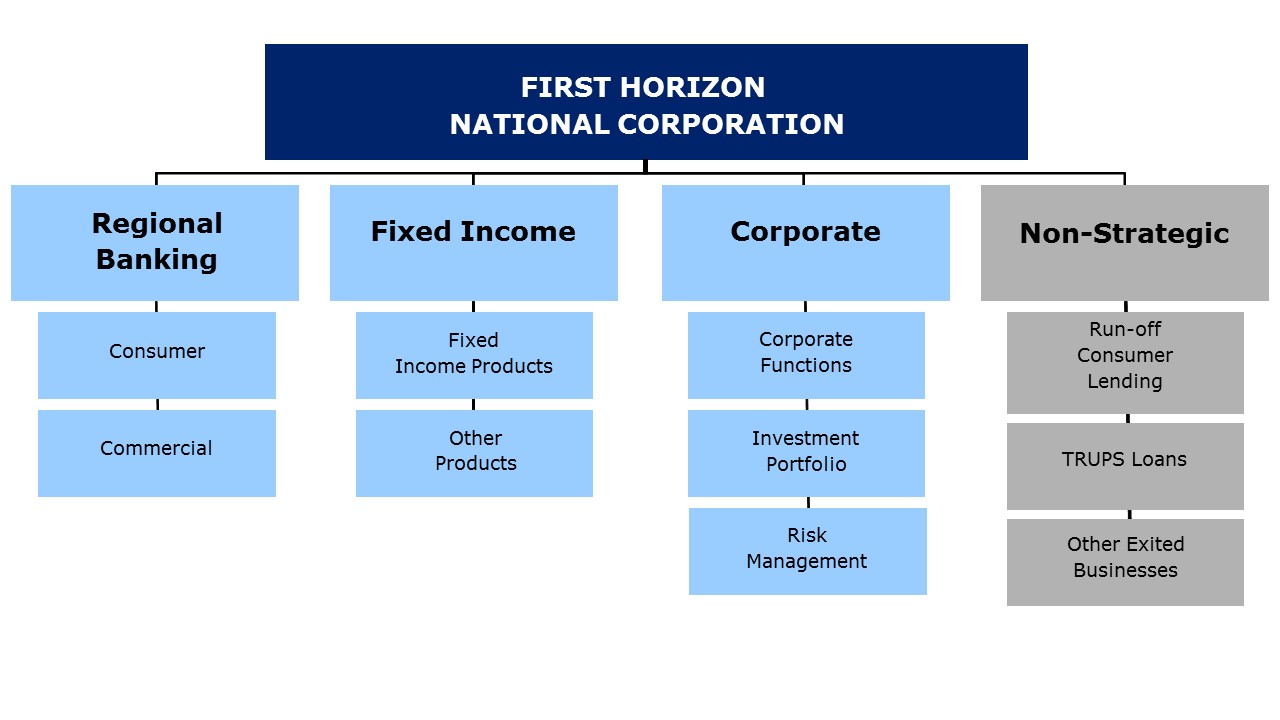
FIRST HORIZON NATIONAL CORPORATION SEGMENT STRUCTURE |  |
3
FHN PERFORMANCE HIGHLIGHTS | ||||||||
Significant events impacting FHN | ||||||||
l On July 1, 2020, FHN closed its merger of equals with IBERIABANK Corporation ("IBKC"). At June 30, 2020, IBKC remained a separate company. Accordingly, information in this Financial Supplement does not reflect the substantial impacts of that closing on FHN's financial condition, operations, and capital. At June 30, 2020 IBKC had $34.7 billion of total assets, $26.1 billion in loans, and $28.3 billion in deposits and operated over 300 offices in 12 states, primarily in the southern and southeastern U.S. | ||||||||
l Acquisition of 30 branches from Truist Financial Corporation divestiture on track to close July 17, 2020. | ||||||||
l Solid Capital with CET1 ratio of 9.3% and Total Capital of 12.5%. | ||||||||
l FHN issued $800 million of senior notes and $150 million of Series E preferred stock in 2Q20. | ||||||||
l First Horizon Bank issued $450 million of subordinated notes in 2Q20. | ||||||||
l Recent changes to the economic forecast and continuing uncertainty associated with the COVID-19 pandemic resulted in provision expense of $110.0 million in 2Q20. | ||||||||
l FHN remains committed to ensuring the health and safety of employees and customers in this challenging environment. | ||||||||
l Total Paycheck Protection Program ("PPP") originations of $2.1 billion. | ||||||||
l Continued prudent risk management with enhanced focus on credit oversight. | ||||||||
l Ongoing support to employees and community. | ||||||||
Summary of Second Quarter 2020 Notable Items | ||||||||
Segment | Item | Income Statement | Amount Favorable/ (Unfavorable) | Comments | ||||
Corporate | Acquisition expenses | Noninterest expense: various | $(14.3) million | Pre-tax acquisition-related expenses largely associated with the IBKC merger of equals and pending branch acquisition | ||||
Second Quarter 2020 vs. First Quarter 2020 | ||||||||
Consolidated | l Diluted EPS of $.17 in 2Q20, up from $.04 in 1Q20, driven by revenue growth and lower loan loss provision expense l PPNR up 8% to $179.4 million in 2Q20 from $166.2 million in 1Q20 l Total revenue up 7% l Fee income up 18% primarily driven by higher fixed income revenue and deferred compensation income l NII up from average loan growth tied to loans to mortgage companies and PPP and deposit pricing discipline, partially offset by the negative impact of interest rates on loans (LIBOR) l NIM of 2.90% in 2Q20 compared to 3.16% in 1Q20; decrease primarily due to a decline in LIBOR and excess cash positions, somewhat mitigated by deposit pricing discipline and the impact of PPP l Loan loss provision of $110 million in 2Q20, down from $145 million in 1Q20; reflects increased reserves primarily driven by recent changes to the economic forecast attributable to the COVID-19 pandemic l Expenses up 7% primarily due to higher deferred compensation expense and acquisition-related costs, somewhat offset by lower advertising and travel and entertainment expenses l Strong period-end deposit growth; period-end loans down 2% | ||||||||||||
(Thousands, except per share data) | 2Q20 | 1Q20 | Change | ||||||||||
Income Statement | |||||||||||||
Net interest income | $ | 305,344 | $ | 302,802 | 1 | % | |||||||
Noninterest income | 206,269 | 174,756 | 18 | % | |||||||||
Total revenues | 511,613 | 477,558 | 7 | % | |||||||||
Provision for loan losses | 110,000 | 145,000 | (24 | ) | % | ||||||||
Noninterest expense | 332,168 | 311,319 | 7 | % | |||||||||
Income before income taxes | 69,445 | 21,239 | NM | ||||||||||
Provision for income taxes | 12,780 | 4,767 | NM | ||||||||||
Net income/(loss) | $ | 56,665 | $ | 16,472 | NM | ||||||||
PPNR (a) | $ | 179,445 | $ | 166,239 | 8 | % | |||||||
Diluted EPS | $ | 0.17 | $ | 0.04 | NM | ||||||||
Balance Sheet (millions) | |||||||||||||
Period-end Loans | $ | 32,709 | $ | 33,378 | (2 | ) | % | ||||||
Period-end Deposits | $ | 37,759 | $ | 34,420 | 10 | % | |||||||
Average Loans | $ | 33,968 | $ | 30,524 | 11 | % | |||||||
Average Deposits | $ | 37,526 | $ | 32,882 | 14 | % | |||||||
NM - Not Meaningful | |||||||||||||
(a) This non-GAAP measure is reconciled to pre-tax income ("PTI") (GAAP) in the Non-GAAP to GAAP reconciliation on page 23 of this financial supplement. | |||||||||||||
4
FHN PERFORMANCE HIGHLIGHTS (continued) | |||
Second Quarter 2020 vs. First Quarter 2020 (continued) | |||
Regional Banking | l Strong average loan growth l Loan growth due to increases in loans to mortgage companies and PPP lending l NII up 17% from 1Q20 driven by higher average loan balances and wider loan spreads with offset in Corporate l Provision expense primarily driven by the economic forecast l Fee income negatively impacted by the COVID-19 pandemic in 2Q20, resulting in lower NSF fee income, fees from derivative sales, brokerage fees, and bankcard income, somewhat offset by a $4.6 million debit card incentive payment l Expense decrease largely driven by lower personnel and advertising and public relations expense, higher deferred loan origination costs, and lower travel and entertainment expenses, somewhat offset by an increase in the credit expense on unfunded commitments l Efficiency ratio improved to 47% in 2Q20 | ||||||||||||
(Thousands) | 2Q20 | 1Q20 | Change | ||||||||||
Net interest income | $ | 349,749 | $ | 300,187 | 17 | % | |||||||
Noninterest income | 79,312 | 81,896 | (3 | ) | % | ||||||||
Total revenues | 429,061 | 382,083 | 12 | % | |||||||||
Provision for loan losses | 108,311 | 145,441 | (26 | ) | % | ||||||||
Noninterest expense | 202,297 | 211,034 | (4 | ) | % | ||||||||
Income before income taxes | $ | 118,453 | $ | 25,608 | NM | ||||||||
PPNR (a) | 226,764 | 171,049 | 33 | % | |||||||||
Balance Sheet (millions) | |||||||||||||
Period-end Loans | $ | 31,885 | $ | 32,502 | (2 | ) | % | ||||||
Period-end Deposits | $ | 34,401 | $ | 30,731 | 12 | % | |||||||
Average loans | $ | 33,115 | $ | 29,615 | 12 | % | |||||||
Average deposits | $ | 33,792 | $ | 30,582 | 10 | % | |||||||
NM - Not meaningful | |||||||||||||
* Amount is less than one percent. | |||||||||||||
(a) This non-GAAP measure is reconciled to pre-tax income ("PTI") (GAAP) in the Non-GAAP to GAAP reconciliation on page 23 of this financial supplement. | |||||||||||||
Fixed Income | l 2Q20 ADR up 26% to $1.6 million, compared to $1.3 million in 1Q20 l Levels were favorably impacted by low rates, market volatility and increased depository liquidity l NII up $2.6 million; Other product revenue down $4.4 million primarily driven by lower fees from derivative sales and loan transaction revenues which were negatively impacted by COVID-19 l Expense increase driven by increased variable compensation | ||||||||||||
(Thousands) | 2Q20 | 1Q20 | Change | ||||||||||
Net interest income | $ | 13,545 | $ | 10,914 | 24 | % | |||||||
Noninterest income | 113,235 | 95,723 | 18 | % | |||||||||
Total revenues | 126,780 | 106,637 | 19 | % | |||||||||
Noninterest expense | 83,039 | 81,063 | 2 | % | |||||||||
Income before income taxes | $ | 43,741 | $ | 25,574 | 71 | % | |||||||
Fixed income product ADR | $ | 1,592 | $ | 1,264 | 26 | % | |||||||
Corporate | l NII negatively impacted by funds transfer pricing methodology with offset in Regional Banking l Increase in fee income driven by deferred compensation income; 1Q20 included negative deferred compensation income driven by equity market valuation declines l Deferred compensation net impact of $2.1 million; $17.7 million increase in fee income, more than offset by a $19.8 million increase in expense l Expense increase also driven by higher acquisition-related expenses relative to 1Q20 | |||||||||||
(Thousands) | 2Q20 | 1Q20 | Change | |||||||||
Net interest income | $ | (63,493 | ) | $ | (13,359 | ) | NM | |||||
Noninterest income | 12,943 | (3,718 | ) | NM | ||||||||
Total revenues | (50,550 | ) | (17,077 | ) | NM | |||||||
Noninterest expense | 43,218 | 15,449 | NM | |||||||||
Income before income taxes | $ | (93,768 | ) | $ | (32,526 | ) | NM | |||||
NM - Not meaningful | ||||||||||||
5
FHN PERFORMANCE HIGHLIGHTS (continued) | |||
Second Quarter 2020 vs. First Quarter 2020 (continued) | |||
Non-Strategic | l Non-Strategic results reflect continuing wind-down of the loan portfolio | ||||||||||||
(Thousands) | 2Q20 | 1Q20 | Change | ||||||||||
Net interest income | $ | 5,543 | $ | 5,060 | 10 | % | |||||||
Noninterest income | 779 | 855 | (9 | ) | % | ||||||||
Total revenues | 6,322 | 5,915 | 7 | % | |||||||||
Provision for loan losses | 1,689 | (441 | ) | NM | |||||||||
Noninterest expense | 3,614 | 3,773 | (4 | ) | % | ||||||||
Income before income taxes | $ | 1,019 | $ | 2,583 | (61 | ) | % | ||||||
Balance Sheet | |||||||||||||
Average loans | $ | 723 | $ | 779 | (7 | ) | % | ||||||
Asset Quality | l Increase in reserves primarily driven by recent changes to the economic forecast attributable to the COVID-19 pandemic l Commercial up $73.9 million; Consumer up $19.5 million l Increase in net charge-offs primarily driven by two commercial credits l NPLs increased $36.2 million primarily driven by two commercial credits l Decrease in 30+ delinquencies driven by several credits within the C&I and Consumer Real Estate portfolios that returned to current in 2Q20 | ||||||||||
(Thousands) | 2Q20 | 1Q20 | Change | ||||||||
Allowance for loan losses | $537,881 | $444,490 | 21 | % | |||||||
Allowance / loans % | 1.64 | % | 1.33 | % | |||||||
Net Charge-offs | $16,609 | $7,211 | NM | ||||||||
Net charge-offs % | 0.20 | % | 0.10 | % | |||||||
Nonperforming Loans (a) | $225,991 | $189,813 | 19 | % | |||||||
NPL % | 0.69 | % | 0.57 | % | |||||||
30+ delinquencies | $41,654 | $62,642 | (34 | ) | % | ||||||
30+ delinquencies % | 0.13 | % | 0.19 | % | |||||||
NM - Not meaningful | |||||||||||
(a) Excludes loans held-for-sale. | |||||||||||
Capital and Liquidity | l Declared quarterly dividend of $.15 in 2Q20 and 1Q20 l No share repurchases in 2Q20 and 1Q20 l In 2Q20 FHN issued $800 million of senior notes and $150 million of Series E preferred stock; First Horizon Bank issued $450 million of subordinated notes l 2Q20 and 1Q20 include the impact of CECL adoption; amount calculated under the interim final rule to delay the effects of CECL on regulatory capital for two years, followed by a three-year transition period | |||||||||||
(millions) | 2Q20 | 1Q20 | Change | |||||||||
Common dividends declared (a) | $ | 46.8 | $ | 46.7 | * | |||||||
Preferred dividends declared | $ | 1.6 | $ | 1.6 | * | |||||||
Share repurchases | $ | — | $ | — | NM | |||||||
Capital Ratios (b) | ||||||||||||
Common Equity Tier 1 | 9.26 | % | 8.54 | % | ||||||||
Tier 1 | 10.69 | % | 9.52 | % | ||||||||
Total Capital | 12.48 | % | 10.78 | % | ||||||||
Leverage | 8.56 | % | 9.00 | % | ||||||||
NM - Not meaningful | ||||||||||||
* Amount is less than one percent. | ||||||||||||
(a) 2Q20 common dividends paid July 1, 2020; 1Q20 common dividends paid April 1, 2020. | ||||||||||||
(b) Current quarter is an estimate. | ||||||||||||
6
FHN CONSOLIDATED INCOME STATEMENT |
Quarterly, Unaudited |
2Q20 Changes vs. | ||||||||||||||||||||||||||
(Dollars in thousands, except per share data) | 2Q20 | 1Q20 | 4Q19 | 3Q19 | 2Q19 | 1Q20 | 2Q19 | |||||||||||||||||||
Interest income | $ | 346,624 | $ | 378,368 | $ | 404,142 | $ | 407,494 | $ | 412,089 | (8 | ) | % | (16 | ) | % | ||||||||||
Less: interest expense | 41,280 | 75,566 | 92,749 | 106,818 | 108,479 | (45 | ) | % | (62 | ) | % | |||||||||||||||
Net interest income | 305,344 | 302,802 | 311,393 | 300,676 | 303,610 | 1 | % | 1 | % | |||||||||||||||||
Provision/(provision credit) for loan losses (a) | 110,000 | 145,000 | 10,000 | 15,000 | 13,000 | (24 | ) | % | NM | |||||||||||||||||
Net interest income after provision for loan losses | 195,344 | 157,802 | 301,393 | 285,676 | 290,610 | 24 | % | (33 | ) | % | ||||||||||||||||
Noninterest income: | ||||||||||||||||||||||||||
Fixed income | 112,421 | 95,635 | 80,981 | 77,645 | 66,414 | 18 | % | 69 | % | |||||||||||||||||
Deposit transactions and cash management (b) | 30,787 | 30,290 | 33,289 | 34,379 | 32,374 | 2 | % | (5 | ) | % | ||||||||||||||||
Brokerage, management fees and commissions | 13,800 | 15,405 | 14,557 | 14,157 | 14,120 | (10 | ) | % | (2 | ) | % | |||||||||||||||
Trust services and investment management | 7,733 | 7,195 | 7,434 | 7,163 | 7,888 | 7 | % | (2 | ) | % | ||||||||||||||||
Bankcard income | 6,652 | 7,253 | 7,984 | 7,017 | 6,355 | (8 | ) | % | 5 | % | ||||||||||||||||
Bank-owned life insurance | 6,380 | 4,589 | 5,255 | 4,427 | 5,126 | 39 | % | 24 | % | |||||||||||||||||
Securities gains/(losses), net | (1,493 | ) | 25 | (3 | ) | 97 | 49 | NM | NM | |||||||||||||||||
Other (c) | 29,989 | 14,364 | 33,810 | 26,850 | 25,667 | NM | 17 | % | ||||||||||||||||||
Total noninterest income | 206,269 | 174,756 | 183,307 | 171,735 | 157,993 | 18 | % | 31 | % | |||||||||||||||||
Adjusted gross income after provision for loan losses | 401,613 | 332,558 | 484,700 | 457,411 | 448,603 | 21 | % | (10 | ) | % | ||||||||||||||||
Noninterest expense: | ||||||||||||||||||||||||||
Employee compensation, incentives, and benefits (d) (e) | 200,259 | 183,470 | 178,761 | 167,022 | 171,643 | 9 | % | 17 | % | |||||||||||||||||
Legal fees (e) | 2,498 | 1,823 | 2,709 | 4,854 | 6,486 | 37 | % | (61 | ) | % | ||||||||||||||||
Professional fees (e) | 10,310 | 6,996 | 16,718 | 14,910 | 11,291 | 47 | % | (9 | ) | % | ||||||||||||||||
Occupancy (e) | 21,445 | 19,563 | 19,972 | 18,887 | 20,719 | 10 | % | 4 | % | |||||||||||||||||
Computer software | 16,522 | 16,027 | 15,390 | 15,191 | 15,001 | 3 | % | 10 | % | |||||||||||||||||
Contract employment and outsourcing | 5,236 | 4,936 | 3,160 | 3,256 | 3,078 | 6 | % | 70 | % | |||||||||||||||||
Operations services | 11,654 | 11,692 | 11,171 | 11,634 | 11,713 | * | (1 | ) | % | |||||||||||||||||
Equipment rentals, depreciation, and maintenance | 8,384 | 8,552 | 8,597 | 8,197 | 8,375 | (2 | ) | % | * | |||||||||||||||||
FDIC premium expense | 6,432 | 6,742 | 5,806 | 5,564 | 4,247 | (5 | ) | % | 51 | % | ||||||||||||||||
Advertising and public relations (e) (f) | 2,525 | 7,456 | 14,897 | 6,646 | 5,574 | (66 | ) | % | (55 | ) | % | |||||||||||||||
Communications and courier | 5,868 | 5,528 | 5,597 | 5,650 | 7,380 | 6 | % | (20 | ) | % | ||||||||||||||||
Amortization of intangible assets | 5,284 | 5,308 | 6,206 | 6,206 | 6,206 | * | (15 | ) | % | |||||||||||||||||
Other (c) | 35,751 | 33,226 | 38,463 | 39,655 | 28,681 | 8 | % | 25 | % | |||||||||||||||||
Total noninterest expense | 332,168 | 311,319 | 327,447 | 307,672 | 300,394 | 7 | % | 11 | % | |||||||||||||||||
Income before income taxes | 69,445 | 21,239 | 157,253 | 149,739 | 148,209 | NM | (53 | ) | % | |||||||||||||||||
Provision for income taxes | 12,780 | 4,767 | 35,970 | 35,796 | 34,467 | NM | (63 | ) | % | |||||||||||||||||
Net income/(loss) | 56,665 | 16,472 | 121,283 | 113,943 | 113,742 | NM | (50 | ) | % | |||||||||||||||||
Net income attributable to noncontrolling interest | 2,851 | 2,852 | 2,910 | 2,883 | 2,852 | * | * | |||||||||||||||||||
Net income/(loss) attributable to controlling interest | 53,814 | 13,620 | 118,373 | 111,060 | 110,890 | NM | (51 | ) | % | |||||||||||||||||
Preferred stock dividends | 1,550 | 1,550 | 1,550 | 1,550 | 1,550 | * | * | |||||||||||||||||||
Net income/(loss) available to common shareholders | $ | 52,264 | $ | 12,070 | $ | 116,823 | $ | 109,510 | $ | 109,340 | NM | (52 | ) | % | ||||||||||||
Common Stock Data | ||||||||||||||||||||||||||
EPS | $ | 0.17 | $ | 0.04 | $ | 0.38 | $ | 0.35 | $ | 0.35 | NM | (51 | ) | % | ||||||||||||
Basic shares (thousands) | 312,090 | 311,597 | 311,250 | 311,888 | 314,063 | * | (1 | ) | % | |||||||||||||||||
Diluted EPS | $ | 0.17 | $ | 0.04 | $ | 0.37 | $ | 0.35 | $ | 0.35 | NM | (51 | ) | % | ||||||||||||
Diluted shares (thousands) | 312,936 | 313,170 | 313,353 | 313,805 | 315,786 | * | (1 | ) | % | |||||||||||||||||
Key Ratios & Other | ||||||||||||||||||||||||||
Return on average assets (annualized) (g) | 0.48 | % | 0.15 | % | 1.12 | % | 1.08 | % | 1.11 | % | ||||||||||||||||
Return on average common equity (“ROCE”) (annualized) (g) | 4.50 | % | 1.05 | % | 9.97 | % | 9.50 | % | 9.79 | % | ||||||||||||||||
Return on average tangible common equity (“ROTCE”) (annualized) (g) (h) | 6.74 | % | 1.59 | % | 15.03 | % | 14.49 | % | 15.12 | % | ||||||||||||||||
Fee income to total revenue (g) | 40.49 | % | 36.59 | % | 37.05 | % | 36.34 | % | 34.22 | % | ||||||||||||||||
Efficiency ratio (g) | 64.74 | % | 65.19 | % | 66.19 | % | 65.14 | % | 65.08 | % | ||||||||||||||||
Average full time equivalent employees | 5,006 | 4,969 | 5,005 | 5,116 | 5,287 | |||||||||||||||||||||
Pre-Provision Net Revenue (PPNR) (i) | $ | 179,445 | $ | 166,239 | $ | 167,253 | $ | 164,739 | $ | 161,209 | 8 | % | 11 | % | ||||||||||||
NM - Not meaningful
* Amount is less than one percent.
(a) | 2Q20 and 1Q20 increases in provision expense primarily driven by the economic forecast attributable to the COVID-19 pandemic. |
(b) | 2Q20 includes a $4.6 million debit card incentive payment. |
(c) | Refer to the Other Income and Other Expense table on page 8 for additional information. |
(d) | 2Q20 and 1Q20 include $9.3 million and $(10.3) million, respectively, of deferred compensation expense. |
(e) | Refer to the Acquisition, and Restructuring expense tables on page 9 for additional information about variability in quarterly balances. |
(f) | 4Q19 includes $6.4 million of costs related to rebranding. |
(g) | See Glossary of Terms for definitions of Key Ratios. |
(h) | This non-GAAP measure is reconciled to ROCE (GAAP) in the Non-GAAP to GAAP reconciliation on page 23 of this financial supplement. |
(i) This non-GAAP measure is reconciled to pre-tax income ("PTI") (GAAP) in the Non-GAAP to GAAP reconciliation on page 23 of this financial supplement.
7
FHN OTHER INCOME AND OTHER EXPENSE |
Quarterly, Unaudited |
2Q20 Changes vs. | |||||||||||||||||||||||||||
(Thousands) | 2Q20 | 1Q20 | 4Q19 | 3Q19 | 2Q19 | 1Q20 | 2Q19 | ||||||||||||||||||||
Other Income | |||||||||||||||||||||||||||
ATM and interchange fees | $ | 4,009 | $ | 4,212 | $ | 4,529 | $ | 4,507 | $ | 4,262 | (5 | ) | % | (6 | ) | % | |||||||||||
Dividend income | 1,057 | 1,130 | 1,508 | 1,556 | 1,809 | (6 | ) | % | (42 | ) | % | ||||||||||||||||
Electronic banking fees | 1,182 | 1,030 | 1,101 | 1,288 | 1,267 | 15 | % | (7 | ) | % | |||||||||||||||||
Letter of credit fees | 1,559 | 1,462 | 1,561 | 1,400 | 1,253 | 7 | % | 24 | % | ||||||||||||||||||
Mortgage banking | 4,138 | 2,431 | 3,578 | 2,019 | 2,572 | 70 | % | 61 | % | ||||||||||||||||||
Deferred compensation (a) | 8,171 | (9,507 | ) | 3,339 | 472 | 1,938 | NM | NM | |||||||||||||||||||
Insurance commissions | 401 | 789 | 358 | 577 | 566 | (49 | ) | % | (29 | ) | % | ||||||||||||||||
Other service charges | 4,582 | 5,219 | 5,755 | 5,738 | 5,624 | (12 | ) | % | (19 | ) | % | ||||||||||||||||
Gain/(loss) on extinguishment of debt | — | — | 65 | (6 | ) | — | NM | NM | |||||||||||||||||||
Other (b) | 4,890 | 7,598 | 12,016 | 9,299 | 6,376 | (36 | ) | % | (23 | ) | % | ||||||||||||||||
Total | $ | 29,989 | $ | 14,364 | $ | 33,810 | $ | 26,850 | $ | 25,667 | NM | 17 | % | ||||||||||||||
Other Expense | |||||||||||||||||||||||||||
Litigation and regulatory matters | $ | 3 | $ | 13 | $ | (394 | ) | $ | 11,534 | $ | (8,230 | ) | (77 | ) | % | NM | |||||||||||
Tax credit investments | 426 | 346 | 460 | 407 | 267 | 23 | % | 60 | % | ||||||||||||||||||
Travel and entertainment | 474 | 2,709 | 3,652 | 2,849 | 2,906 | (83 | ) | % | (84 | ) | % | ||||||||||||||||
Employee training and dues | 654 | 1,341 | 1,430 | 1,003 | 1,251 | (51 | ) | % | (48 | ) | % | ||||||||||||||||
Customer relations (c) | 632 | 2,004 | 2,794 | 3,165 | 1,540 | (68 | ) | % | (59 | ) | % | ||||||||||||||||
Miscellaneous loan costs | 2,356 | 1,094 | 1,227 | 1,017 | 857 | NM | NM | ||||||||||||||||||||
Supplies | 1,933 | 2,411 | 2,104 | 1,668 | 1,342 | (20 | ) | % | 44 | % | |||||||||||||||||
OREO | 437 | (184 | ) | 1,478 | 342 | 25 | NM | NM | |||||||||||||||||||
Other insurance and taxes | 2,599 | 2,679 | 2,515 | 2,475 | 2,495 | (3 | ) | % | 4 | % | |||||||||||||||||
Non-service components of net periodic pension and post retirement cost | 2,961 | 2,508 | 327 | 986 | 559 | 18 | % | NM | |||||||||||||||||||
Credit expense on unfunded commitments (d) | 11,158 | 9,230 | (790 | ) | (634 | ) | (489 | ) | 21 | % | NM | ||||||||||||||||
Other (e) | 12,118 | 9,075 | 23,660 | 14,843 | 26,158 | 34 | % | (54 | ) | % | |||||||||||||||||
Total | $ | 35,751 | $ | 33,226 | $ | 38,463 | $ | 39,655 | $ | 28,681 | 8 | % | 25 | % | |||||||||||||
NM - Not meaningful
(a) | Amounts driven by market conditions and are mirrored by changes in deferred compensation expense which is included in employee compensation expense; 1Q20 decrease driven by equity market valuations. |
(b) | 4Q19 and 3Q19 include an increase in collections from CBF loans charged off prior to acquisition, under ASU 2016-13 (CECL) these collections are no longer recognized as part of fee income, but are accounted for as reductions of provision. |
(c) | 3Q19 increase driven by higher business development costs. |
(d) | 2Q20 and 1Q20 increases largely driven by the economic forecast attributable to the COVID-19 pandemic. |
(e) 4Q19 includes $11.0 million of charitable contributions; 3Q19 includes $4.0 million of valuation adjustments associated with derivatives related to prior sales of Visa Class B shares; 2Q19 includes $7.4 million of costs primarily associated with fixed asset impairments and technology-related expenses related to rebranding; Refer to the Acquisition and Restructuring expense tables on page 9 for additional information about variability in quarterly balances.
8
ACQUISITION EXPENSE
Quarterly, Unaudited
2Q20 Changes vs. | ||||||||||||||
IBKC ACQUISITION EXPENSE | 2Q20 | 1Q20 | 4Q19 | 1Q20 | ||||||||||
(Thousands) | ||||||||||||||
Legal and professional fees (a) | $ | 3,748 | $ | 662 | $ | 8,228 | NM | |||||||
Employee compensation, incentives, and benefits (b) | 4,705 | 689 | 3,079 | NM | ||||||||||
Miscellaneous expense (e) | 1,003 | 254 | 64 | NM | ||||||||||
Total IBKC acquisition expense | $ | 9,456 | $ | 1,605 | $ | 11,371 | NM | |||||||
2Q20 Changes vs. | ||||||||||||||||||||||||||
OTHER ACQUISITION EXPENSE | 2Q20 | 1Q20 | 4Q19 | 3Q19 | 2Q19 | 1Q20 | 2Q19 | |||||||||||||||||||
(Thousands) | ||||||||||||||||||||||||||
Legal and professional fees (a) | $ | 1,327 | $ | 799 | $ | 1,494 | $ | 3,507 | $ | 4,478 | 66 | % | (70 | ) | % | |||||||||||
Employee compensation, incentives, and benefits (b) | 87 | 396 | 1,035 | 1,473 | 1,472 | (78 | ) | % | (94 | ) | % | |||||||||||||||
Occupancy (c) | (82 | ) | (25 | ) | (94 | ) | (76 | ) | 1,505 | NM | NM | |||||||||||||||
Contract employment and outsourcing (d) | 420 | 306 | 35 | 223 | 17 | 37 | % | NM | ||||||||||||||||||
Miscellaneous expense (e) | 503 | 822 | 217 | 1,022 | 79 | (39 | ) | % | NM | |||||||||||||||||
All other expense (f) | 2,610 | 1,874 | 1,638 | 2,840 | 1,096 | 39 | % | NM | ||||||||||||||||||
Total other acquisition expense | $ | 4,865 | $ | 4,172 | $ | 4,325 | $ | 8,989 | $ | 8,647 | 17 | % | (44 | ) | % | |||||||||||
NM - Not meaningful
(a) | Primarily comprised of fees for legal, accounting, and merger consultants. |
(b) | Primarily comprised of severance and retention. |
(c) | Primarily relates to expenses associated with lease exit accruals. |
(d) | Primarily relates to expenses for temporary assistance for merger and integration activities. |
(e) | Consists of expenses for operations services, communications and courier, equipment rentals, deprecation and maintenance, supplies, travel and entertainment, computer software, and advertising and public relations. |
(f) | Primarily relates to contract termination charges, internal technology development costs, costs of shareholder matters and asset impairments, as well as other miscellaneous expenses. |
RESTRUCTURING EXPENSE
Quarterly, Unaudited
2Q20 Changes vs. | ||||||||||||||||||||||
2Q20 | 1Q20 | 4Q19 | 3Q19 | 2Q19 | 1Q20 | 2Q19 | ||||||||||||||||
(Thousands) | ||||||||||||||||||||||
Legal and professional fees | $ | 7 | $ | 7 | $ | 989 | $6,488 | $4,242 | * | NM | ||||||||||||
Employee compensation, incentives, and benefits | 32 | 57 | 259 | 1,182 | 2,557 | (44 | ) | % | (99 | ) | % | |||||||||||
Occupancy | — | 2 | 57 | (128) | 72 | NM | NM | |||||||||||||||
All other expense (a) | 1 | (103 | ) | (148 | ) | 300 | 11,797 | NM | NM | |||||||||||||
Total restructuring expense | $ | 40 | $ | (37 | ) | $ | 1,157 | $7,842 | $18,668 | NM | NM | |||||||||||
NM - Not meaningful
*Amount is less than one percent.
(a) | Primarily relates to costs associated with asset impairments. |
9
FHN CONSOLIDATED PERIOD-END BALANCE SHEET
Quarterly, Unaudited
2Q20 Changes vs. | ||||||||||||||||||||||||||
(Thousands) | 2Q20 | 1Q20 | 4Q19 | 3Q19 | 2Q19 | 1Q20 | 2Q19 | |||||||||||||||||||
Assets: | ||||||||||||||||||||||||||
Investment securities | $ | 5,486,156 | $ | 4,554,907 | $ | 4,455,403 | $ | 4,425,845 | $ | 4,425,609 | 20 | % | 24 | % | ||||||||||||
Loans held-for-sale (a) | 745,655 | 595,601 | 593,790 | 554,843 | 447,106 | 25 | % | 67 | % | |||||||||||||||||
Loans, net of unearned income | 32,708,937 | 33,378,303 | 31,061,111 | 31,260,833 | 29,712,810 | (2 | ) | % | 10 | % | ||||||||||||||||
Federal funds sold | 113,000 | 30,050 | 46,536 | 48,747 | 50,705 | NM | NM | |||||||||||||||||||
Securities purchased under agreements to resell | 302,267 | 562,435 | 586,629 | 697,214 | 602,919 | (46 | ) | % | (50 | ) | % | |||||||||||||||
Interest-bearing cash (b) | 3,135,844 | 670,525 | 482,405 | 364,412 | 593,180 | NM | NM | |||||||||||||||||||
Trading securities | 1,116,450 | 1,877,514 | 1,346,207 | 1,395,043 | 1,668,942 | (41 | ) | % | (33 | ) | % | |||||||||||||||
Total earning assets | 43,608,309 | 41,669,335 | 38,572,081 | 38,746,937 | 37,501,271 | 5 | % | 16 | % | |||||||||||||||||
Cash and due from banks | 604,280 | 537,564 | 633,728 | 749,719 | 596,081 | 12 | % | 1 | % | |||||||||||||||||
Fixed income receivables (c) | 145,455 | 180,569 | 40,114 | 209,732 | 147,574 | (19 | ) | % | (1 | ) | % | |||||||||||||||
Goodwill | 1,432,787 | 1,432,787 | 1,432,787 | 1,432,787 | 1,432,787 | * | * | |||||||||||||||||||
Other intangible assets, net | 119,608 | 124,892 | 130,200 | 136,406 | 142,612 | (4 | ) | % | (16 | ) | % | |||||||||||||||
Premises and equipment, net | 448,028 | 447,812 | 455,006 | 451,600 | 454,271 | * | (1 | ) | % | |||||||||||||||||
Other real estate owned ("OREO") | 15,134 | 15,837 | 17,838 | 20,181 | 19,286 | (4 | ) | % | (22 | ) | % | |||||||||||||||
Allowance for loan losses (d) | (537,881 | ) | (444,490 | ) | (200,307 | ) | (193,149 | ) | (192,749 | ) | 21 | % | NM | |||||||||||||
Derivative assets | 599,704 | 696,250 | 183,115 | 250,786 | 185,521 | (14 | ) | % | NM | |||||||||||||||||
Other assets | 2,209,235 | 2,536,822 | 2,046,338 | 1,912,685 | 1,885,116 | (13 | ) | % | 17 | % | ||||||||||||||||
Total assets | $ | 48,644,659 | $ | 47,197,378 | $ | 43,310,900 | $ | 43,717,684 | $ | 42,171,770 | 3 | % | 15 | % | ||||||||||||
Liabilities and Equity: | ||||||||||||||||||||||||||
Deposits: | ||||||||||||||||||||||||||
Consumer interest | $ | 14,323,445 | $ | 13,813,999 | $ | 13,866,920 | $ | 13,670,204 | $ | 13,705,969 | 4 | % | 5 | % | ||||||||||||
Commercial interest | 6,065,840 | 5,867,755 | 6,153,075 | 6,211,539 | 6,660,056 | 3 | % | (9 | ) | % | ||||||||||||||||
Market-indexed (e) | 5,582,248 | 5,798,088 | 3,980,589 | 3,794,105 | 3,855,545 | (4 | ) | % | 45 | % | ||||||||||||||||
Total interest-bearing deposits | 25,971,533 | 25,479,842 | 24,000,584 | 23,675,848 | 24,221,570 | 2 | % | 7 | % | |||||||||||||||||
Noninterest-bearing deposits | 11,787,818 | 8,939,808 | 8,428,951 | 8,268,812 | 8,086,748 | 32 | % | 46 | % | |||||||||||||||||
Total deposits | 37,759,351 | 34,419,650 | 32,429,535 | 31,944,660 | 32,308,318 | 10 | % | 17 | % | |||||||||||||||||
Federal funds purchased | 778,529 | 476,013 | 548,344 | 936,837 | 666,007 | 64 | % | 17 | % | |||||||||||||||||
Securities sold under agreements to repurchase | 1,482,585 | 788,595 | 716,925 | 735,226 | 764,308 | 88 | % | 94 | % | |||||||||||||||||
Trading liabilities | 232,742 | 452,611 | 505,581 | 719,777 | 558,347 | (49 | ) | % | (58 | ) | % | |||||||||||||||
Other short-term borrowings (f) | 130,583 | 4,060,673 | 2,253,045 | 2,276,139 | 865,347 | (97 | ) | % | (85 | ) | % | |||||||||||||||
Term borrowings (g) | 2,032,476 | 792,751 | 791,368 | 1,195,096 | 1,186,646 | NM | 71 | % | ||||||||||||||||||
Fixed income payables (c) | 24,735 | 91,274 | 49,535 | 66,842 | 66,369 | (73 | ) | % | (63 | ) | % | |||||||||||||||
Derivative liabilities | 94,389 | 234,984 | 67,480 | 83,530 | 88,485 | (60 | ) | % | 7 | % | ||||||||||||||||
Other liabilities | 900,884 | 825,247 | 873,079 | 763,534 | 741,862 | 9 | % | 21 | % | |||||||||||||||||
Total liabilities | 43,436,274 | 42,141,798 | 38,234,892 | 38,721,641 | 37,245,689 | 3 | % | 17 | % | |||||||||||||||||
Equity: | ||||||||||||||||||||||||||
Common stock | 195,224 | 194,914 | 194,668 | 194,487 | 195,299 | * | * | |||||||||||||||||||
Capital surplus | 2,940,610 | 2,938,670 | 2,931,451 | 2,925,309 | 2,941,696 | * | * | |||||||||||||||||||
Undivided profits (h) | 1,671,629 | 1,667,105 | 1,798,442 | 1,725,846 | 1,660,520 | * | 1 | % | ||||||||||||||||||
Accumulated other comprehensive loss, net | (134,798 | ) | (136,164 | ) | (239,608 | ) | (240,654 | ) | (262,489 | ) | (1 | ) | % | (49 | ) | % | ||||||||||
Preferred stock (i) | 240,289 | 95,624 | 95,624 | 95,624 | 95,624 | NM | NM | |||||||||||||||||||
Noncontrolling interest (j) | 295,431 | 295,431 | 295,431 | 295,431 | 295,431 | * | * | |||||||||||||||||||
Total equity | 5,208,385 | 5,055,580 | 5,076,008 | 4,996,043 | 4,926,081 | 3 | % | 6 | % | |||||||||||||||||
Total liabilities and equity | $ | 48,644,659 | $ | 47,197,378 | $ | 43,310,900 | $ | 43,717,684 | $ | 42,171,770 | 3 | % | 15 | % | ||||||||||||
NM - Not meaningful
*Amount is less than one percent.
(a) | 2Q20 includes $644.2 million of SBA and USDA loans, $96.7 million of mortgage loans, and $4.8 million of other consumer loans. |
(b) | Includes excess balances held at Fed; 2Q20 increase driven by an influx of deposits. |
(c) | Period-end balances fluctuate based on the level of pending unsettled trades. |
(d) | Effective 1/1/2020 FHN adopted ASU 2016-13, "Measurement of Credit Losses on Financial Instruments," (CECL) which resulted in an increase to the allowance for loan losses of $106.4 million in 1Q20; 2Q20 and 1Q20 increases reflect increased reserves established in association with the economic forecast attributable to the COVID-19 pandemic. |
(e) | Market-indexed deposits are tied to an index not administered by FHN and are comprised of insured network deposits, correspondent banking deposits, and trust/sweep deposits; 1Q20 increase used to support commercial loan growth, including loans to mortgage companies. |
(f) | Balance fluctuates largely based on the level of FHLB borrowings as a result of loan demand and deposit levels; 1Q20 increase used to support commercial loan growth, including loans to mortgage companies. |
(g) | In 2Q20 FHN issued $800 million of senior notes and First Horizon Bank issued $450 million of subordinated notes; In 4Q19 $400 million of First Horizon Bank senior capital notes matured. |
(h) | Effective 1/1/2020 FHN adopted ASU 2016-13 (CECL) which resulted in a net decrease to undivided profits of $96.1 million. |
(i) | In 2Q20 FHN issued $150 million of Non-Cumulative Perpetual Preferred Stock, Series E. |
(j) | Consists of preferred stock of subsidiaries. |
10
FHN CONSOLIDATED AVERAGE BALANCE SHEET
Quarterly, Unaudited
2Q20 Changes vs. | ||||||||||||||||||||||||||
(Thousands) | 2Q20 | 1Q20 | 4Q19 | 3Q19 | 2Q19 | 1Q20 | 2Q19 | |||||||||||||||||||
Assets: | ||||||||||||||||||||||||||
Earning assets: | ||||||||||||||||||||||||||
Loans, net of unearned income: | ||||||||||||||||||||||||||
Commercial, financial, and industrial (C&I) (a) | $ | 22,694,432 | $ | 19,469,572 | $ | 19,739,937 | $ | 18,965,829 | $ | 17,952,866 | 17 | % | 26 | % | ||||||||||||
Commercial real estate (a) | 4,709,676 | 4,421,913 | 4,263,597 | 4,269,425 | 3,910,466 | 7 | % | 20 | % | |||||||||||||||||
Consumer real estate | 6,087,485 | 6,134,390 | 6,194,134 | 6,283,488 | 6,310,039 | (1 | ) | % | (4 | ) | % | |||||||||||||||
Credit card and other | 476,088 | 498,290 | 508,651 | 497,646 | 498,790 | (4 | ) | % | (5 | ) | % | |||||||||||||||
Total loans, net of unearned income (b) | 33,967,681 | 30,524,165 | 30,706,319 | 30,016,388 | 28,672,161 | 11 | % | 18 | % | |||||||||||||||||
Loans held-for-sale (c) | 731,315 | 590,458 | 581,810 | 455,239 | 606,685 | 24 | % | 21 | % | |||||||||||||||||
Investment securities: | ||||||||||||||||||||||||||
U.S. treasuries | 88,007 | 100 | 100 | 100 | 99 | NM | NM | |||||||||||||||||||
U.S. government agencies | 4,295,823 | 4,330,905 | 4,327,651 | 4,289,719 | 4,461,712 | (1 | ) | % | (4 | ) | % | |||||||||||||||
States and municipalities | 84,142 | 64,668 | 54,146 | 49,025 | 41,911 | 30 | % | NM | ||||||||||||||||||
Corporate bonds | 50,541 | 50,570 | 50,493 | 50,414 | 64,720 | * | (22 | ) | % | |||||||||||||||||
Other | 22,787 | 20,409 | 15,933 | 18,837 | 14,609 | 12 | % | 56 | % | |||||||||||||||||
Total investment securities | 4,541,300 | 4,466,652 | 4,448,323 | 4,408,095 | 4,583,051 | 2 | % | (1 | ) | % | ||||||||||||||||
Trading securities | 1,419,868 | 1,831,492 | 1,263,633 | 1,391,405 | 1,564,201 | (22 | ) | % | (9 | ) | % | |||||||||||||||
Other earning assets: | ||||||||||||||||||||||||||
Federal funds sold | 28,208 | 10,192 | 9,700 | 21,225 | 47,664 | NM | (41 | ) | % | |||||||||||||||||
Securities purchased under agreements to resell | 393,539 | 816,794 | 645,979 | 550,641 | 593,412 | (52 | ) | % | (34 | ) | % | |||||||||||||||
Interest-bearing cash (d) | 1,619,686 | 548,036 | 586,495 | 545,784 | 648,927 | NM | NM | |||||||||||||||||||
Total other earning assets | 2,041,433 | 1,375,022 | 1,242,174 | 1,117,650 | 1,290,003 | 48 | % | 58 | % | |||||||||||||||||
Total earning assets | 42,701,597 | 38,787,789 | 38,242,259 | 37,388,777 | 36,716,101 | 10 | % | 16 | % | |||||||||||||||||
Allowance for loan losses (e) | (475,606 | ) | (353,794 | ) | (195,863 | ) | (196,586 | ) | (188,243 | ) | 34 | % | NM | |||||||||||||
Cash and due from banks | 561,864 | 609,701 | 609,750 | 596,323 | 590,622 | (8 | ) | % | (5 | ) | % | |||||||||||||||
Fixed income receivables | 124,451 | 111,474 | 75,917 | 75,938 | 64,958 | 12 | % | 92 | % | |||||||||||||||||
Premises and equipment, net | 451,572 | 450,931 | 450,950 | 451,567 | 478,607 | * | (6 | ) | % | |||||||||||||||||
Derivative assets | 532,890 | 254,736 | 202,624 | 160,341 | 83,050 | NM | NM | |||||||||||||||||||
Other assets | 4,037,306 | 3,691,075 | 3,500,153 | 3,464,541 | 3,497,912 | 9 | % | 15 | % | |||||||||||||||||
Total assets | $ | 47,934,074 | $ | 43,551,912 | $ | 42,885,790 | $ | 41,940,901 | $ | 41,243,007 | 10 | % | 16 | % | ||||||||||||
Liabilities and equity: | ||||||||||||||||||||||||||
Interest-bearing liabilities: | ||||||||||||||||||||||||||
Interest-bearing deposits: | ||||||||||||||||||||||||||
Consumer interest | $ | 14,153,186 | $ | 13,760,968 | $ | 13,718,820 | $ | 13,670,745 | $ | 13,597,195 | 3 | % | 4 | % | ||||||||||||
Commercial interest | 6,002,315 | 6,006,364 | 6,145,681 | 6,321,835 | 6,599,793 | * | (9 | ) | % | |||||||||||||||||
Market-indexed (f) | 6,055,468 | 4,448,587 | 4,370,025 | 4,143,012 | 3,818,949 | 36 | % | 59 | % | |||||||||||||||||
Total interest-bearing deposits | 26,210,969 | 24,215,919 | 24,234,526 | 24,135,592 | 24,015,937 | 8 | % | 9 | % | |||||||||||||||||
Federal funds purchased | 1,037,107 | 746,686 | 1,163,701 | 886,445 | 519,497 | 39 | % | NM | ||||||||||||||||||
Securities sold under agreements to repurchase | 1,011,339 | 777,692 | 701,213 | 722,815 | 691,490 | 30 | % | 46 | % | |||||||||||||||||
Trading liabilities | 352,433 | 750,520 | 585,889 | 501,203 | 548,653 | (53 | ) | % | (36 | ) | % | |||||||||||||||
Other short-term borrowings (g) | 555,032 | 1,686,690 | 844,558 | 535,585 | 650,387 | (67 | ) | % | (15 | ) | % | |||||||||||||||
Term borrowings (h) | 1,426,261 | 791,043 | 928,214 | 1,185,853 | 1,183,205 | 80 | % | 21 | % | |||||||||||||||||
Total interest-bearing liabilities | 30,593,141 | 28,968,550 | 28,458,101 | 27,967,493 | 27,609,169 | 6 | % | 11 | % | |||||||||||||||||
Noninterest-bearing deposits | 11,315,526 | 8,666,087 | 8,542,521 | 8,235,806 | 7,947,607 | 31 | % | 42 | % | |||||||||||||||||
Fixed income payables | 25,899 | 54,900 | 34,510 | 33,059 | 25,579 | (53 | ) | % | 1 | % | ||||||||||||||||
Derivative liabilities | 63,966 | 16,171 | 59,114 | 19,632 | 61,715 | NM | 4 | % | ||||||||||||||||||
Other liabilities | 817,929 | 843,810 | 751,676 | 722,570 | 729,776 | (3 | ) | % | 12 | % | ||||||||||||||||
Total liabilities | 42,816,461 | 38,549,518 | 37,845,922 | 36,978,560 | 36,373,846 | 11 | % | 18 | % | |||||||||||||||||
Equity: | ||||||||||||||||||||||||||
Common stock | 195,097 | 194,827 | 194,574 | 194,930 | 196,319 | * | (1 | ) | % | |||||||||||||||||
Capital surplus | 2,940,736 | 2,935,372 | 2,928,463 | 2,934,276 | 2,964,824 | * | (1 | ) | % | |||||||||||||||||
Undivided profits (i) | 1,672,072 | 1,686,986 | 1,766,211 | 1,695,417 | 1,629,474 | (1 | ) | % | 3 | % | ||||||||||||||||
Accumulated other comprehensive loss, net | (135,398 | ) | (205,846 | ) | (240,435 | ) | (253,337 | ) | (312,511 | ) | (34 | ) | % | 57 | % | |||||||||||
Preferred stock (j) | 149,675 | 95,624 | 95,624 | 95,624 | 95,624 | 57 | % | 57 | % | |||||||||||||||||
Noncontrolling interest (k) | 295,431 | 295,431 | 295,431 | 295,431 | 295,431 | * | * | |||||||||||||||||||
Total equity | 5,117,613 | 5,002,394 | 5,039,868 | 4,962,341 | 4,869,161 | 2 | % | 5 | % | |||||||||||||||||
Total liabilities and equity | $ | 47,934,074 | $ | 43,551,912 | $ | 42,885,790 | $ | 41,940,901 | $ | 41,243,007 | 10 | % | 16 | % | ||||||||||||
NM - Not meaningful
*Amount is less than one percent.
(a) | In 3Q19, FHN prospectively reclassified approximately $410 million of regional banking market investor CRE loans from the C&I portfolio to the CRE portfolio. The reclassification did not have an impact on FHN’s consolidated balance sheet and the impact to the consolidated financial statements from the effect on the allowance for loan losses is immaterial. |
(b) | Includes loans on nonaccrual status. |
(c) | 2Q20 includes $631.2 million of SBA and USDA loans, $95.3 million of mortgage loans, and $4.9 million of other consumer loans. |
(d) | Includes excess balances held at Fed; 2Q20 increase driven by an influx of deposits. |
(e) | Effective 1/1/2020 FHN adopted ASU 2016-13, "Measurement of Credit Losses on Financial Instruments," (CECL) which resulted in an increase to the allowance for loan losses of $106.4 million; 2Q20 and 1Q20 increases reflect increased reserves established in association with the economic forecast attributable to the COVID-19 pandemic. |
(f) | Market-indexed deposits are tied to an index not administered by FHN and are comprised of insured network deposits, correspondent banking deposits, and trust/sweep deposits. |
(g) | Balance fluctuates largely based on the level of FHLB borrowings as a result of loan demand and deposit levels; 1Q20 increase used to support commercial loan growth, including loans to mortgage companies. |
(h) | In 2Q20 FHN issued $800 million of senior notes and First Horizon Bank issued $450 million of subordinated notes; In 4Q19 $400 million of First Horizon Bank senior capital notes matured. |
(i) | Effective 1/1/2020 FHN adopted ASU 2016-13 (CECL) which resulted in a net decrease to undivided profits of $96.1 million. |
(j) | In 2Q20 FHN issued $150 million of Non-Cumulative Perpetual Preferred Stock, Series E. |
(k) | Consists of preferred stock of subsidiaries. |
11
FHN CONSOLIDATED NET INTEREST INCOME (a)
Quarterly, Unaudited
2Q20 Changes vs. | ||||||||||||||||||||||||||
(Thousands) | 2Q20 | 1Q20 | 4Q19 | 3Q19 | 2Q19 | 1Q20 | 2Q19 | |||||||||||||||||||
Interest Income: | ||||||||||||||||||||||||||
Loans, net of unearned income (b) | $ | 308,184 | $ | 328,526 | $ | 356,176 | $ | 357,724 | $ | 354,067 | (6 | ) | % | (13 | ) | % | ||||||||||
Loans held-for-sale | 6,596 | 6,899 | 7,053 | 6,069 | 8,128 | (4 | ) | % | (19 | ) | % | |||||||||||||||
Investment securities: | ||||||||||||||||||||||||||
U.S. government agencies | 22,021 | 25,127 | 26,500 | 26,322 | 29,075 | (12 | ) | % | (24 | ) | % | |||||||||||||||
States and municipalities | 733 | 542 | 478 | 431 | 347 | 35 | % | NM | ||||||||||||||||||
Corporate bonds | 595 | 591 | 595 | 593 | 713 | 1 | % | (17 | ) | % | ||||||||||||||||
U.S. treasuries | 26 | — | — | — | — | NM | NM | |||||||||||||||||||
Other | 1,904 | 1,732 | 1,352 | 1,634 | 1,278 | 10 | % | 49 | % | |||||||||||||||||
Total investment securities | 25,279 | 27,992 | 28,925 | 28,980 | 31,413 | (10 | ) | % | (20 | ) | % | |||||||||||||||
Trading securities | 8,815 | 13,338 | 9,507 | 10,645 | 13,332 | (34 | ) | % | (34 | ) | % | |||||||||||||||
Other earning assets: | ||||||||||||||||||||||||||
Federal funds sold | 15 | 27 | 51 | 141 | 326 | (44 | ) | % | (95 | ) | % | |||||||||||||||
Securities purchased under agreements to resell (c) | (82 | ) | 2,303 | 2,467 | 2,800 | 3,301 | NM | NM | ||||||||||||||||||
Interest-bearing cash | 350 | 1,536 | 2,359 | 2,700 | 3,689 | (77 | ) | % | (91 | ) | % | |||||||||||||||
Total other earning assets | 283 | 3,866 | 4,877 | 5,641 | 7,316 | (93 | ) | % | (96 | ) | % | |||||||||||||||
Interest income | $ | 349,157 | $ | 380,621 | $ | 406,538 | $ | 409,059 | $ | 414,256 | (8 | ) | % | (16 | ) | % | ||||||||||
Interest Expense: | ||||||||||||||||||||||||||
Interest-bearing deposits: | ||||||||||||||||||||||||||
Consumer interest | $ | 10,197 | $ | 18,337 | $ | 22,957 | $ | 26,670 | $ | 25,666 | (44 | ) | % | (60 | ) | % | ||||||||||
Commercial interest | 9,041 | 19,061 | 24,366 | 28,112 | 29,927 | (53 | ) | % | (70 | ) | % | |||||||||||||||
Market-indexed (d) | 5,507 | 17,091 | 20,090 | 23,809 | 23,409 | (68 | ) | % | (76 | ) | % | |||||||||||||||
Total interest-bearing deposits | 24,745 | 54,489 | 67,413 | 78,591 | 79,002 | (55 | ) | % | (69 | ) | % | |||||||||||||||
Federal funds purchased | 315 | 2,214 | 5,026 | 4,898 | 3,142 | (86 | ) | % | (90 | ) | % | |||||||||||||||
Securities sold under agreements to repurchase | 907 | 2,623 | 2,843 | 3,301 | 3,580 | (65 | ) | % | (75 | ) | % | |||||||||||||||
Trading liabilities | 974 | 3,292 | 2,987 | 2,943 | 3,756 | (70 | ) | % | (74 | ) | % | |||||||||||||||
Other short-term borrowings | 233 | 5,027 | 3,989 | 3,333 | 4,316 | (95 | ) | % | (95 | ) | % | |||||||||||||||
Term borrowings (e) | 14,106 | 7,921 | 10,491 | 13,752 | 14,683 | 78 | % | (4 | ) | % | ||||||||||||||||
Interest expense | 41,280 | 75,566 | 92,749 | 106,818 | 108,479 | (45 | ) | % | (62 | ) | % | |||||||||||||||
Net interest income - tax equivalent basis | 307,877 | 305,055 | 313,789 | 302,241 | 305,777 | 1 | % | 1 | % | |||||||||||||||||
Fully taxable equivalent adjustment | (2,533 | ) | (2,253 | ) | (2,396 | ) | (1,565 | ) | (2,167 | ) | (12 | ) | % | (17 | ) | % | ||||||||||
Net interest income | $ | 305,344 | $ | 302,802 | $ | 311,393 | $ | 300,676 | $ | 303,610 | 1 | % | 1 | % | ||||||||||||
NM - Not meaningful
(a) | Net interest income adjusted to a fully taxable equivalent (“FTE”) basis assuming a statutory federal income tax of 21 percent and, where applicable, state income taxes. |
(b) | Includes interest on loans in nonaccrual status. |
(c) | 2Q20 balance driven by negative market rates on reverse repurchase agreements. |
(d) | Market-indexed deposits are tied to an index not administered by FHN and are comprised of insured network deposits, correspondent banking deposits, and trust/sweep deposits. |
(e) | In 2Q20 FHN issued $800 million of senior notes and First Horizon Bank issued $450 million of subordinated notes; In 4Q19 $400 million of First Horizon Bank senior capital notes matured. |
12
FHN CONSOLIDATED AVERAGE BALANCE SHEET: YIELDS AND RATES
Quarterly, Unaudited
2Q20 | 1Q20 | 4Q19 | 3Q19 | 2Q19 | |||||||||||||||
Assets: | |||||||||||||||||||
Earning assets (a) | |||||||||||||||||||
Loans, net of unearned income (b) | |||||||||||||||||||
Commercial loans | 3.56 | % | 4.33 | % | 4.63 | % | 4.78 | % | 5.05 | % | |||||||||
Consumer loans | 4.00 | 4.33 | 4.51 | 4.55 | 4.65 | ||||||||||||||
Total loans, net of unearned income (c) | 3.65 | 4.33 | 4.60 | 4.73 | 4.95 | ||||||||||||||
Loans held-for-sale | 3.61 | 4.67 | 4.85 | 5.33 | 5.36 | ||||||||||||||
Investment securities: | |||||||||||||||||||
U.S. government agencies | 2.05 | 2.32 | 2.45 | 2.45 | 2.61 | ||||||||||||||
States and municipalities | 3.48 | 3.35 | 3.53 | 3.51 | 3.31 | ||||||||||||||
Corporate bonds | 4.71 | 4.67 | 4.71 | 4.71 | 4.41 | ||||||||||||||
U.S. treasuries | 0.12 | NM | NM | NM | NM | ||||||||||||||
Other | 33.42 | 33.76 | 33.73 | 34.52 | 34.73 | ||||||||||||||
Total investment securities | 2.23 | 2.51 | 2.60 | 2.63 | 2.74 | ||||||||||||||
Trading securities | 2.48 | 2.91 | 3.01 | 3.06 | 3.41 | ||||||||||||||
Other earning assets: | |||||||||||||||||||
Federal funds sold | 0.22 | 1.05 | 2.10 | 2.64 | 2.74 | ||||||||||||||
Securities purchased under agreements to resell (d) | (0.08 | ) | 1.13 | 1.52 | 2.02 | 2.23 | |||||||||||||
Interest-bearing cash | 0.09 | 1.13 | 1.60 | 1.96 | 2.28 | ||||||||||||||
Total other earning assets | 0.06 | 1.13 | 1.56 | 2.00 | 2.27 | ||||||||||||||
Interest income/total earning assets | 3.29 | % | 3.94 | % | 4.22 | % | 4.35 | % | 4.52 | % | |||||||||
Liabilities: | |||||||||||||||||||
Interest-bearing liabilities: | |||||||||||||||||||
Interest-bearing deposits: | |||||||||||||||||||
Consumer interest | 0.29 | % | 0.54 | % | 0.66 | % | 0.77 | % | 0.76 | % | |||||||||
Commercial interest | 0.61 | 1.28 | 1.57 | 1.76 | 1.82 | ||||||||||||||
Market-indexed (e) | 0.37 | 1.55 | 1.82 | 2.28 | 2.46 | ||||||||||||||
Total interest-bearing deposits | 0.38 | 0.90 | 1.10 | 1.29 | 1.32 | ||||||||||||||
Federal funds purchased | 0.12 | 1.19 | 1.71 | 2.19 | 2.43 | ||||||||||||||
Securities sold under agreements to repurchase | 0.36 | 1.36 | 1.61 | 1.81 | 2.08 | ||||||||||||||
Trading liabilities | 1.11 | 1.76 | 2.02 | 2.33 | 2.75 | ||||||||||||||
Other short-term borrowings | 0.17 | 1.20 | 1.87 | 2.47 | 2.66 | ||||||||||||||
Term borrowings (f) | 3.96 | 4.01 | 4.52 | 4.64 | 4.96 | ||||||||||||||
Interest expense/total interest-bearing liabilities | 0.54 | 1.05 | 1.29 | 1.52 | 1.58 | ||||||||||||||
Net interest spread | 2.75 | % | 2.89 | % | 2.93 | % | 2.83 | % | 2.94 | % | |||||||||
Effect of interest-free sources used to fund earning assets | 0.15 | 0.27 | 0.33 | 0.38 | 0.40 | ||||||||||||||
Net interest margin | 2.90 | % | 3.16 | % | 3.26 | % | 3.21 | % | 3.34 | % | |||||||||
Total loan yield | 3.65 | % | 4.33 | % | 4.60 | % | 4.73 | % | 4.95 | % | |||||||||
Total deposit cost | 0.27 | % | 0.67 | % | 0.82 | % | 0.96 | % | 0.99 | % | |||||||||
Total funding cost | 0.40 | % | 0.81 | % | 1.00 | % | 1.17 | % | 1.22 | % | |||||||||
Yields are adjusted to a FTE basis assuming a statutory federal income tax rate of 21 percent and, where applicable, state income taxes.
(a) | Earning assets yields are expressed net of unearned income. |
(b) | Includes loan fees and cash basis interest income. |
(c) | Includes loans on nonaccrual status. |
(d) | 2Q20 yield driven by negative market rates on reverse repurchase agreements. |
(e) | Market-indexed deposits are tied to an index not administered by FHN and are comprised of insured network deposits, correspondent banking deposits, and trust/sweep deposits. |
(f) | Rates are expressed net of unamortized debenture cost for term borrowings; In 2Q20 FHN issued $800 million of senior notes and First Horizon Bank issued $450 million of subordinated notes; In 4Q19 $400 million of First Horizon Bank senior capital notes matured. |
13
FHN CAPITAL HIGHLIGHTS
Quarterly, Unaudited
2Q20 Changes vs. | ||||||||||||||||||||||||||
(Dollars and shares in thousands) | 2Q20 | 1Q20 | 4Q19 | 3Q19 | 2Q19 | 1Q20 | 2Q19 | |||||||||||||||||||
Common equity tier 1 capital (a) (b) (c) | $ | 3,457,447 | $ | 3,421,763 | $ | 3,408,936 | $ | 3,326,059 | $ | 3,270,484 | 1 | % | 6 | % | ||||||||||||
Tier 1 capital (a) (b) (c) | 3,992,552 | 3,812,203 | 3,760,450 | 3,679,158 | 3,620,001 | 5 | % | 10 | % | |||||||||||||||||
Total capital (a) (c) | 4,659,652 | 4,319,384 | 4,154,885 | 4,065,306 | 4,009,116 | 8 | % | 16 | % | |||||||||||||||||
Risk-weighted assets (“RWA”) (a) (b) (d) | 37,343,970 | 40,055,114 | 37,045,782 | 36,913,347 | 35,341,740 | (7 | ) | % | 6 | % | ||||||||||||||||
Average assets for leverage (a) (b) | 46,657,797 | 42,348,418 | 41,583,446 | 40,660,442 | 40,022,187 | 10 | % | 17 | % | |||||||||||||||||
Common equity tier 1 ratio (a) (b) (c) | 9.26 | % | 8.54 | % | 9.20 | % | 9.01 | % | 9.25 | % | ||||||||||||||||
Tier 1 ratio (a) (b) (c) | 10.69 | % | 9.52 | % | 10.15 | % | 9.97 | % | 10.24 | % | ||||||||||||||||
Total capital ratio (a) (c) | 12.48 | % | 10.78 | % | 11.22 | % | 11.01 | % | 11.34 | % | ||||||||||||||||
Leverage ratio (a) (b) (c) | 8.56 | % | 9.00 | % | 9.04 | % | 9.05 | % | 9.04 | % | ||||||||||||||||
Total equity to total assets (c) | 10.71 | % | 10.71 | % | 11.72 | % | 11.43 | % | 11.68 | % | ||||||||||||||||
Tangible common equity/tangible assets (“TCE/TA”) (c) (e) | 6.63 | % | 6.81 | % | 7.48 | % | 7.20 | % | 7.29 | % | ||||||||||||||||
Period-end shares outstanding | 312,359 | 311,863 | 311,469 | 311,180 | 312,478 | * | * | |||||||||||||||||||
Cash dividends declared per common share | $ | 0.15 | $ | 0.15 | $ | 0.14 | $ | 0.14 | $ | 0.14 | * | 7 | % | |||||||||||||
Book value per common share (c) | $ | 14.96 | $ | 14.96 | $ | 15.04 | $ | 14.80 | $ | 14.51 | ||||||||||||||||
Tangible book value per common share (c) (e) | $ | 9.99 | $ | 9.96 | $ | 10.02 | $ | 9.76 | $ | 9.47 | ||||||||||||||||
Market capitalization (millions) (f) | $ | 3,111.1 | $ | 2,513.6 | $ | 5,157.9 | $ | 5,041.1 | $ | 4,665.3 | ||||||||||||||||
Certain previously reported amounts have been reclassified to agree with current presentation.
* Amount is less than one percent.
(a) | Current quarter is an estimate. |
(b) | See Glossary of Terms for definition. |
(c) 2Q20 and 1Q20 include the impact of CECL adoption; amount calculated under the interim final rule to delay the effects of CECL on regulatory capital for two years, followed by a three-year transition period.
(d) 1Q20 increase in risk-weighted assets due to period-end commercial loan growth (primarily loans to mortgage companies), higher draw activity in March, and increased market risk assets for Fixed Income.
(e) | TCE/TA and Tangible book value per common share are non-GAAP measures and are reconciled to Total equity to total assets (GAAP) and to Book value per common share (GAAP), respectively, in the Non-GAAP to GAAP reconciliation on page 23 of this financial supplement. |
(f) | 1Q20 decrease driven by a sharp decline in FHN's share price attributable to market uncertainty associated with the COVID-19 pandemic. |
14
FHN BUSINESS SEGMENT HIGHLIGHTS
Quarterly, Unaudited
2Q20 Changes vs. | ||||||||||||||||||||||||||
(Thousands) | 2Q20 | 1Q20 | 4Q19 | 3Q19 | 2Q19 | 1Q20 | 2Q19 | |||||||||||||||||||
Regional Banking | ||||||||||||||||||||||||||
Net interest income (a) | $ | 349,749 | $ | 300,187 | $ | 310,880 | $ | 302,551 | $ | 297,534 | 17 | % | 18 | % | ||||||||||||
Noninterest income | 79,312 | 81,896 | 89,592 | 85,929 | 81,565 | (3 | ) | % | (3 | ) | % | |||||||||||||||
Total revenues | 429,061 | 382,083 | 400,472 | 388,480 | 379,099 | 12 | % | 13 | % | |||||||||||||||||
Provision for loan losses (b) | 108,311 | 145,441 | 14,370 | 20,471 | 17,776 | (26 | ) | % | NM | |||||||||||||||||
Noninterest expense (c) | 202,297 | 211,034 | 202,193 | 192,537 | 192,413 | (4 | ) | % | 5 | % | ||||||||||||||||
Income before income taxes | 118,453 | 25,608 | 183,909 | 175,472 | 168,910 | NM | (30 | ) | % | |||||||||||||||||
Provision for income taxes | 26,948 | 4,401 | 43,295 | 42,012 | 39,788 | NM | (32 | ) | % | |||||||||||||||||
Net income | $ | 91,505 | $ | 21,207 | $ | 140,614 | $ | 133,460 | $ | 129,122 | NM | (29 | ) | % | ||||||||||||
Fixed Income | ||||||||||||||||||||||||||
Net interest income | $ | 13,545 | $ | 10,914 | $ | 7,232 | $ | 5,311 | $ | 6,171 | 24 | % | NM | |||||||||||||
Noninterest income (d) | 113,235 | 95,723 | 81,185 | 77,809 | 65,622 | 18 | % | 73 | % | |||||||||||||||||
Total revenues | 126,780 | 106,637 | 88,417 | 83,120 | 71,793 | 19 | % | 77 | % | |||||||||||||||||
Noninterest expense (e) | 83,039 | 81,063 | 62,090 | 67,576 | 55,534 | 2 | % | 50 | % | |||||||||||||||||
Income before income taxes | 43,741 | 25,574 | 26,327 | 15,544 | 16,259 | 71 | % | NM | ||||||||||||||||||
Provision/(benefit) for income taxes | 10,679 | 6,099 | 6,362 | 3,708 | 3,840 | 75 | % | NM | ||||||||||||||||||
Net income | $ | 33,062 | $ | 19,475 | $ | 19,965 | $ | 11,836 | $ | 12,419 | 70 | % | NM | |||||||||||||
Corporate | ||||||||||||||||||||||||||
Net interest income/(expense) (a) | $ | (63,493 | ) | $ | (13,359 | ) | $ | (12,826 | ) | $ | (13,339 | ) | $ | (7,146 | ) | NM | NM | |||||||||
Noninterest income (f) | 12,943 | (3,718 | ) | 11,246 | 7,359 | 9,401 | NM | 38 | % | |||||||||||||||||
Total revenues | (50,550 | ) | (17,077 | ) | (1,580 | ) | (5,980 | ) | 2,255 | NM | NM | |||||||||||||||
Noninterest expense (f) (g) | 43,218 | 15,449 | 59,210 | 43,217 | 56,873 | NM | (24 | ) | % | |||||||||||||||||
Income/(loss) before income taxes | (93,768 | ) | (32,526 | ) | (60,790 | ) | (49,197 | ) | (54,618 | ) | NM | (72 | ) | % | ||||||||||||
Provision/ (benefit) for income taxes | (25,097 | ) | (6,372 | ) | (15,616 | ) | (11,881 | ) | (13,525 | ) | NM | (86 | ) | % | ||||||||||||
Net income/(loss) | $ | (68,671 | ) | $ | (26,154 | ) | $ | (45,174 | ) | $ | (37,316 | ) | $ | (41,093 | ) | NM | (67 | ) | % | |||||||
Non-Strategic | ||||||||||||||||||||||||||
Net interest income | $ | 5,543 | $ | 5,060 | $ | 6,107 | $ | 6,153 | $ | 7,051 | 10 | % | (21 | ) | % | |||||||||||
Noninterest income | 779 | 855 | 1,284 | 638 | 1,405 | (9 | ) | % | (45 | ) | % | |||||||||||||||
Total revenues | 6,322 | 5,915 | 7,391 | 6,791 | 8,456 | 7 | % | (25 | ) | % | ||||||||||||||||
Provision/(provision credit) for loan losses (b) | 1,689 | (441 | ) | (4,370 | ) | (5,471 | ) | (4,776 | ) | NM | NM | |||||||||||||||
Noninterest expense (h) | 3,614 | 3,773 | 3,954 | 4,342 | (4,426 | ) | (4 | ) | % | NM | ||||||||||||||||
Income before income taxes | 1,019 | 2,583 | 7,807 | 7,920 | 17,658 | (61 | ) | % | (94 | ) | % | |||||||||||||||
Provision for income taxes | 250 | 639 | 1,929 | 1,957 | 4,364 | (61 | ) | % | (94 | ) | % | |||||||||||||||
Net income | $ | 769 | $ | 1,944 | $ | 5,878 | $ | 5,963 | $ | 13,294 | (60 | ) | % | (94 | ) | % | ||||||||||
Total Consolidated | ||||||||||||||||||||||||||
Net interest income | $ | 305,344 | $ | 302,802 | $ | 311,393 | $ | 300,676 | $ | 303,610 | 1 | % | 1 | % | ||||||||||||
Noninterest income | 206,269 | 174,756 | 183,307 | 171,735 | 157,993 | 18 | % | 31 | % | |||||||||||||||||
Total revenues | 511,613 | 477,558 | 494,700 | 472,411 | 461,603 | 7 | % | 11 | % | |||||||||||||||||
Provision/(provision credit) for loan losses (b) | 110,000 | 145,000 | 10,000 | 15,000 | 13,000 | (24 | ) | % | NM | |||||||||||||||||
Noninterest expense | 332,168 | 311,319 | 327,447 | 307,672 | 300,394 | 7 | % | 11 | % | |||||||||||||||||
Income before income taxes | 69,445 | 21,239 | 157,253 | 149,739 | 148,209 | NM | (53 | ) | % | |||||||||||||||||
Provision for income taxes | 12,780 | 4,767 | 35,970 | 35,796 | 34,467 | NM | (63 | ) | % | |||||||||||||||||
Net income | $ | 56,665 | $ | 16,472 | $ | 121,283 | $ | 113,943 | $ | 113,742 | NM | (50 | ) | % | ||||||||||||
Certain previously reported amounts have been reclassified to agree with current presentation.
NM - Not meaningful
(a) | 2Q20 increase in NII in Regional Banking primarily driven by higher average balances of loans to mortgage companies and PPP lending activities coupled with wider loan spreads (Funds Transfer Pricing ("FTP") offset is in Corporate). |
(b) | 2Q20 and 1Q20 increases in provision expense primarily driven by the economic forecast attributable to the COVID-19 pandemic. |
(c) | 2Q20 decrease attributable to lower personnel and advertising and public relations expense, higher deferred loan origination costs, and lower travel and entertainment expenses, somewhat offset by an increase in expense on unfunded commitments; 2Q20 and 1Q20 include $11.2 million and $9.2 million of expense on unfunded commitments. |
(d) | 1Q20 includes elevated levels of commissionable revenues, partially offset by elevated levels of trading losses driven by extreme volatility in March 2020. |
(e) | 3Q19 includes a $7.5 million unfavorable adjustment associated with the net impact of the resolution of legal matters. |
(f) | Refer to the Deferred Compensation table at the bottom of the Corporate section on page 17 for additional information about the variability in quarterly balances. |
(g) | Refer to the Acquisition and Restructuring expense tables on page 9 for additional information about variability in quarterly balances; 4Q19 includes $11.0 million of charitable contributions and $6.4 million of costs related to rebranding; 3Q19 includes $4.0 million of valuation adjustments associated with derivatives related to prior sales of Visa Class B shares; 2Q19 includes $7.4 million of costs primarily associated with fixed asset impairments and technology-related expenses related to rebranding. |
(h) | 2Q19 includes an $8.3 million expense reversal related to the resolution of legal matters. |
15
FHN REGIONAL BANKING
Quarterly, Unaudited
2Q20 Changes vs. | ||||||||||||||||||||||||||
2Q20 | 1Q20 | 4Q19 | 3Q19 | 2Q19 | 1Q20 | 2Q19 | ||||||||||||||||||||
Income Statement (thousands) | ||||||||||||||||||||||||||
Net interest income (a) | $ | 349,749 | $ | 300,187 | $ | 310,880 | $ | 302,551 | $ | 297,534 | 17 | % | 18 | % | ||||||||||||
Provision for loan losses (b) | 108,311 | 145,441 | 14,370 | 20,471 | 17,776 | (26 | ) | % | NM | |||||||||||||||||
Noninterest income: | ||||||||||||||||||||||||||
NSF / Overdraft fees (c) | 6,373 | 10,922 | 13,325 | 13,703 | 12,350 | (42 | ) | % | (48 | ) | % | |||||||||||||||
Cash management fees | 9,576 | 9,289 | 9,200 | 9,561 | 8,026 | 3 | % | 19 | % | |||||||||||||||||
Debit card income (d) | 9,006 | 4,306 | 4,659 | 4,750 | 4,961 | NM | 82 | % | ||||||||||||||||||
Other | 4,587 | 4,311 | 4,472 | 4,592 | 5,294 | 6 | % | (13 | ) | % | ||||||||||||||||
Total deposit transactions and cash management | 29,542 | 28,828 | 31,656 | 32,606 | 30,631 | 2 | % | (4 | ) | % | ||||||||||||||||
Brokerage, management fees and commissions | 13,800 | 15,405 | 14,558 | 14,156 | 14,120 | (10 | ) | % | (2 | ) | % | |||||||||||||||
Trust services and investment management | 7,750 | 7,213 | 7,452 | 7,190 | 7,902 | 7 | % | (2 | ) | % | ||||||||||||||||
Bankcard income | 6,551 | 7,152 | 7,881 | 7,031 | 6,597 | (8 | ) | % | (1 | ) | % | |||||||||||||||
Other service charges | 4,517 | 5,156 | 5,697 | 5,655 | 5,466 | (12 | ) | % | (17 | ) | % | |||||||||||||||
Miscellaneous revenue (e) | 17,152 | 18,142 | 22,348 | 19,291 | 16,849 | (5 | ) | % | 2 | % | ||||||||||||||||
Total noninterest income | 79,312 | 81,896 | 89,592 | 85,929 | 81,565 | (3 | ) | % | (3 | ) | % | |||||||||||||||
Noninterest expense: | ||||||||||||||||||||||||||
Employee compensation, incentives, and benefits | 74,114 | 79,019 | 74,466 | 73,713 | 76,752 | (6 | ) | % | (3 | ) | % | |||||||||||||||
Other (f) | 128,183 | 132,015 | 127,727 | 118,824 | 115,661 | (3 | ) | % | 11 | % | ||||||||||||||||
Total noninterest expense | 202,297 | 211,034 | 202,193 | 192,537 | 192,413 | (4 | ) | % | 5 | % | ||||||||||||||||
Income before income taxes | $ | 118,453 | $ | 25,608 | $ | 183,909 | $ | 175,472 | $ | 168,910 | NM | (30 | ) | % | ||||||||||||
PPNR (g) | 226,764 | 171,049 | 198,279 | 195,943 | 186,686 | 33 | % | 21 | % | |||||||||||||||||
Balance Sheet (millions) | ||||||||||||||||||||||||||
Average loans | $ | 33,115 | $ | 29,615 | $ | 29,729 | $ | 28,966 | $ | 27,541 | 12 | % | 20 | % | ||||||||||||
Average other earning assets | 50 | 50 | 55 | 49 | 50 | * | * | |||||||||||||||||||
Total average earning assets | 33,165 | 29,665 | 29,784 | 29,015 | 27,591 | 12 | % | 20 | % | |||||||||||||||||
Total average deposits | 33,792 | 30,582 | 30,415 | 30,047 | 29,956 | 10 | % | 13 | % | |||||||||||||||||
Total period-end deposits | 34,401 | 30,731 | 30,595 | 30,062 | 30,274 | 12 | % | 14 | % | |||||||||||||||||
Total period-end assets | 34,444 | 35,116 | 32,898 | 33,159 | 31,343 | (2 | ) | % | 10 | % | ||||||||||||||||
Key Statistics | ||||||||||||||||||||||||||
Return on average assets (quarters are annualized) (h) | 1.03% | 0.27% | 1.72% | 1.67% | 1.71% | |||||||||||||||||||||
Return on allocated equity (h) (i) | 11.75% | 2.80% | 18.19% | 17.56% | 17.44% | |||||||||||||||||||||
Fee income to total revenue (h) | 18.49% | 21.43% | 22.37% | 22.12% | 21.52% | |||||||||||||||||||||
Efficiency ratio (h) | 47.15% | 55.23% | 50.49% | 49.56% | 50.76% | |||||||||||||||||||||
Net interest margin (j) | 4.27% | 4.10% | 4.17% | 4.16% | 4.35% | |||||||||||||||||||||
Net interest spread | 3.32% | 3.65% | 3.77% | 3.82% | 3.99% | |||||||||||||||||||||
Loan average yield | 3.56% | 4.24% | 4.50% | 4.68% | 4.88% | |||||||||||||||||||||
Deposit average rate | 0.24% | 0.59% | 0.73% | 0.86% | 0.89% | |||||||||||||||||||||
Regional banking net charge-offs/(recoveries) | $ | 17,989 | $ | 8,119 | $ | 5,886 | $ | 17,074 | $ | 7,841 | NM | NM | ||||||||||||||
Financial center locations (k) | 269 | 269 | 269 | 270 | 292 | * | (8 | ) | % | |||||||||||||||||
Certain previously reported amounts have been reclassified to agree with current presentation.
NM - Not meaningful
* Amount is less than one percent
(a) | 2Q20 increase in NII primarily driven by higher average balances of loans to mortgage companies and PPP lending activities coupled with wider loan spreads (FTP offset is in Corporate). |
(b) | 2Q20 and 1Q20 increase in provision expense primarily driven by the economic forecast attributable to the COVID-19 pandemic. |
(c) | Variability is driven by seasonality and changes in consumer behavior; 2Q20 decrease due to the impact of the COVID-19 pandemic. |
(d) | 2Q20 includes a $4.6 million debit card incentive payment. |
(e) | 4Q19 and 3Q19 include an increase in collections from CBF loans charged off prior to acquisition, under ASU 2016-13 (CECL) these collections are no longer recognized as part of fee income, but are accounted for as reductions of provision. |
(f) | 2Q20 decrease attributable to lower advertising and public relations expense, higher deferred loan origination costs, and lower travel and entertainment expenses, somewhat offset by an increase in expense on unfunded commitments; 2Q20 and 1Q20 include $11.2 million and $9.2 million of expense on unfunded commitments; 4Q19 increase due in large part to higher strategic investments in technology and advertising. |
(g) | This non-GAAP measure is reconciled to pre-tax income ("PTI") (GAAP) in the Non-GAAP to GAAP reconciliation on page 23 of this financial supplement. |
(h) | See Glossary of Terms for definitions of Key Ratios. |
(i) | Segment equity is allocated based on an internal allocation methodology. |
(j) | Net interest margin is computed using total NII adjusted for FTE assuming a statutory federal income tax rate of 21 percent, and, where applicable, state income taxes. |
(k) | 3Q19 decrease driven by restructuring, repositioning, and efficiency initiatives. |
16
FHN FIXED INCOME
Quarterly, Unaudited
2Q20 Changes vs. | ||||||||||||||||||||||||||
2Q20 | 1Q20 | 4Q19 | 3Q19 | 2Q19 | 1Q20 | 2Q19 | ||||||||||||||||||||
Income Statement (thousands) | ||||||||||||||||||||||||||
Net interest income | $ | 13,545 | $ | 10,914 | $ | 7,232 | $ | 5,311 | $ | 6,171 | 24 | % | NM | |||||||||||||
Noninterest income: | ||||||||||||||||||||||||||
Fixed income product revenue (a) | 100,272 | 78,354 | 65,772 | 63,646 | 54,533 | 28 | % | 84 | % | |||||||||||||||||
Other | 12,963 | 17,369 | 15,413 | 14,163 | 11,089 | (25 | ) | % | 17 | % | ||||||||||||||||
Total noninterest income | 113,235 | 95,723 | 81,185 | 77,809 | 65,622 | 18 | % | 73 | % | |||||||||||||||||
Noninterest expense (b) | 83,039 | 81,063 | 62,090 | 67,576 | 55,534 | 2 | % | 50 | % | |||||||||||||||||
Income before income taxes | $ | 43,741 | $ | 25,574 | $ | 26,327 | $ | 15,544 | $ | 16,259 | 71 | % | NM | |||||||||||||
Fixed income product average daily revenue | $ | 1,592 | $ | 1,264 | $ | 1,061 | $ | 994 | $ | 866 | 26 | % | 84 | % | ||||||||||||
Balance Sheet (millions) | ||||||||||||||||||||||||||
Average trading inventory | $ | 1,419 | $ | 1,831 | $ | 1,263 | $ | 1,390 | $ | 1,563 | (22 | ) | % | (9 | ) | % | ||||||||||
Average loans held-for-sale | 631 | 491 | 477 | 367 | 528 | 29 | % | 20 | % | |||||||||||||||||
Average other earning assets | 579 | 949 | 829 | 709 | 670 | (39 | ) | % | (14 | ) | % | |||||||||||||||
Total average earning assets | 2,629 | 3,271 | 2,569 | 2,466 | 2,761 | (20 | ) | % | (5 | ) | % | |||||||||||||||
Total period-end assets | 2,961 | 3,965 | 2,987 | 3,323 | 3,232 | (25 | ) | % | (8 | ) | % | |||||||||||||||
Key Statistics | ||||||||||||||||||||||||||
Return on average assets (c) | 4.08 | % | 2.08 | % | 2.65 | % | 1.63 | % | 1.59 | % | ||||||||||||||||
Return on allocated equity (c) (d) | 65.83 | % | 37.12 | % | 39.92 | % | 23.61 | % | 24.64 | % | ||||||||||||||||
Efficiency ratio (c) | 65.50 | % | 76.02 | % | 70.22 | % | 81.30 | % | 77.35 | % | ||||||||||||||||
Net interest margin (e) | 2.07 | % | 1.36 | % | 1.15 | % | 0.88 | % | 0.92 | % | ||||||||||||||||
NM - Not meaningful
(a) | 1Q20 includes elevated levels of commissionable revenues, partially offset by elevated levels of trading losses driven by extreme volatility in March 2020. |
(b) | 3Q19 includes a $7.5 million unfavorable adjustment associated with the net impact of the resolution of legal matters. |
(c) | See Glossary of Terms for definitions of Key Ratios. |
(d) | Segment equity is allocated based on an internal allocation methodology. |
(e) | Net interest margin is computed using total NII adjusted for FTE assuming a statutory federal income tax rate of 21 percent, and, where applicable, state income taxes. |
FHN CORPORATE
Quarterly, Unaudited
2Q20 Changes vs. | ||||||||||||||||||||||||||
2Q20 | 1Q20 | 4Q19 | 3Q19 | 2Q19 | 1Q20 | 2Q19 | ||||||||||||||||||||
Income Statement (thousands) | ||||||||||||||||||||||||||
Net interest income/(expense) (a) | $ | (63,493 | ) | $ | (13,359 | ) | $ | (12,826 | ) | $ | (13,339 | ) | $ | (7,146 | ) | NM | NM | |||||||||
Noninterest income excluding securities gains/(losses) (b) | 14,436 | (3,743 | ) | 11,249 | 7,262 | 9,352 | NM | 54 | % | |||||||||||||||||
Securities gains/(losses), net | (1,493 | ) | 25 | (3 | ) | 97 | 49 | NM | NM | |||||||||||||||||
Noninterest expense (c) | 43,218 | 15,449 | 59,210 | 43,217 | 56,873 | NM | (24 | ) | % | |||||||||||||||||
Income/(loss) before income taxes | $ | (93,768 | ) | $ | (32,526 | ) | $ | (60,790 | ) | $ | (49,197 | ) | $ | (54,618 | ) | NM | (72 | ) | % | |||||||
Average Balance Sheet (millions) | ||||||||||||||||||||||||||
Average investment securities | $ | 4,519 | $ | 4,446 | $ | 4,432 | $ | 4,389 | $ | 4,568 | 2 | % | (1 | ) | % | |||||||||||
Total earning assets | $ | 6,123 | $ | 5,010 | $ | 4,980 | $ | 4,916 | $ | 5,295 | 22 | % | 16 | % | ||||||||||||
Deferred Compensation (thousands) | ||||||||||||||||||||||||||
Other Income | $ | 8,171 | $ | (9,507 | ) | $ | 3,339 | $ | 472 | $ | 1,938 | NM | NM | |||||||||||||
Employee compensation, incentives, and benefits | $ | 9,299 | $ | (10,548 | ) | $ | 3,846 | $ | 567 | $ | 2,150 | NM | NM | |||||||||||||
Estimated effective duration of securities portfolio 1.4 years in 2Q20 compared to 1.3 years in 1Q20
NM - Not Meaningful
(a) | 2Q20 decrease in NII primarily driven by funds transfer pricing methodology with offset in Regional Banking. |
(b) | Variability in quarterly balances driven by fluctuations in deferred compensation income driven by equity market valuations and mirrored by changes in deferred compensation expense which is included in employee compensation expense. |
(c) | Refer to the Acquisition and Restructuring expense tables on page 9 for additional information about variability in quarterly balances; 4Q19 includes $11.0 million of charitable contributions and $6.4 million of costs related to rebranding; 3Q19 includes $4.0 million of valuation adjustments associated with derivatives related to prior sales of Visa Class B shares; 2Q19 includes $7.4 million of costs primarily associated with fixed asset impairments and technology-related expenses related to rebranding. |
17
FHN NON-STRATEGIC
Quarterly, Unaudited
2Q20 Changes vs. | ||||||||||||||||||||||||||
2Q20 | 1Q20 | 4Q19 | 3Q19 | 2Q19 | 1Q20 | 2Q19 | ||||||||||||||||||||
Income Statement (thousands) | ||||||||||||||||||||||||||
Net interest income | $ | 5,543 | $ | 5,060 | $ | 6,107 | $ | 6,153 | $ | 7,051 | 10 | % | (21 | ) | % | |||||||||||
Provision/(provision credit) for loan losses (a) | 1,689 | (441 | ) | (4,370 | ) | (5,471 | ) | (4,776 | ) | NM | NM | |||||||||||||||
Noninterest income | 779 | 855 | 1,284 | 638 | 1,405 | (9 | ) | % | (45 | ) | % | |||||||||||||||
Noninterest expense (b) | 3,614 | 3,773 | 3,954 | 4,342 | (4,426 | ) | (4 | ) | % | NM | ||||||||||||||||
Income before income taxes | $ | 1,019 | $ | 2,583 | $ | 7,807 | $ | 7,920 | $ | 17,658 | (61 | ) | % | (94 | ) | % | ||||||||||
Average Balance Sheet (millions) | ||||||||||||||||||||||||||
Loans | $ | 723 | $ | 779 | $ | 844 | $ | 927 | $ | 1,002 | (7 | ) | % | (28 | ) | % | ||||||||||
Other assets | 49 | 52 | 67 | 64 | 75 | (6 | ) | % | (35 | ) | % | |||||||||||||||
Total assets | 772 | 831 | 911 | 991 | 1,077 | (7 | ) | % | (28 | ) | % | |||||||||||||||
Key Statistics | ||||||||||||||||||||||||||
Return on average assets (c) | 0.40 | % | 0.94 | % | 2.56 | % | 2.39 | % | 4.95 | % | ||||||||||||||||
Return on allocated equity (c) (d) | 7.38 | % | 15.56 | % | 37.26 | % | 32.27 | % | 64.89 | % | ||||||||||||||||
Fee income to total revenue (c) | 12.32 | % | 14.45 | % | 17.37 | % | 9.39 | % | 16.62 | % | ||||||||||||||||
Efficiency ratio (c) | 57.17 | % | 63.79 | % | 53.50 | % | 63.94 | % | NM | |||||||||||||||||
Net interest margin (e) | 2.83 | % | 2.41 | % | 2.67 | % | 2.47 | % | 2.64 | % | ||||||||||||||||
Net charge-offs/(recoveries) | $ | (1,380 | ) | $ | (908 | ) | $ | (3,044 | ) | $ | (2,474 | ) | $ | (2,679 | ) | (52 | ) | % | 48 | % | ||||||
Certain previously reported amounts have been reclassified to agree with current presentation.
NM - Not meaningful
(a) | 2Q20 and 1Q20 increases in provision expense primarily driven by the economic forecast attributable to the COVID-19 pandemic. |
(b) | 2Q19 includes an $8.3 million expense reversal related to the settlement of litigation matters. |
(c) | See Glossary of Terms for definitions of Key Ratios. |
(d) | Segment equity is allocated based on an internal allocation methodology. |
(e) | Net interest margin is computed using total NII adjusted for FTE assuming a statutory federal income tax rate of 21 percent, and, where applicable, state income taxes. |
18
FHN ASSET QUALITY: CONSOLIDATED
Quarterly, Unaudited
2Q20 Changes vs. | ||||||||||||||||||||||||||||||||||
(Dollars in thousands) | 2Q20 | 1Q20 | 4Q19 | 3Q19 | 2Q19 | 1Q20 | 2Q19 | |||||||||||||||||||||||||||
Allowance for Loan Losses Walk-Forward | ||||||||||||||||||||||||||||||||||
Beginning reserve | $ | 444,490 | $ | 200,307 | $ | 193,149 | $ | 192,749 | $ | 184,911 | NM | NM | ||||||||||||||||||||||
ASU Adoption 2016-13 (a) | — | 106,394 | — | — | — | NM | NM | |||||||||||||||||||||||||||
Provision/(provision credit) for loan losses (a) | 110,000 | 145,000 | 10,000 | 15,000 | 13,000 | (24)% | NM | |||||||||||||||||||||||||||
Charge-offs | (22,907 | ) | (13,453 | ) | (11,646 | ) | (24,337 | ) | (12,223 | ) | (70)% | (87)% | ||||||||||||||||||||||
Recoveries | 6,298 | 6,242 | 8,804 | 9,737 | 7,061 | 1% | (11)% | |||||||||||||||||||||||||||
Ending balance | $ | 537,881 | $ | 444,490 | $ | 200,307 | $ | 193,149 | $ | 192,749 | 21% | NM | ||||||||||||||||||||||
Reserve for unfunded commitments (b) | 50,461 | 39,303 | 6,101 | 6,890 | 7,524 | 28% | NM | |||||||||||||||||||||||||||
Total allowance for loan losses plus reserve for unfunded commitments | $ | 588,342 | $ | 483,793 | $ | 206,408 | $ | 200,039 | $ | 200,273 | 22% | NM | ||||||||||||||||||||||
Allowance for Loan Losses (a) | ||||||||||||||||||||||||||||||||||
Regional Banking | $ | 503,876 | $ | 413,552 | $ | 182,730 | $ | 174,246 | $ | 170,849 | 22% | NM | ||||||||||||||||||||||
Non-Strategic | 34,005 | 30,938 | 17,577 | 18,903 | 21,900 | 10% | 55% | |||||||||||||||||||||||||||
Total allowance for loan losses | $ | 537,881 | $ | 444,490 | $ | 200,307 | $ | 193,149 | $ | 192,749 | 21% | NM | ||||||||||||||||||||||
Nonperforming Assets | ||||||||||||||||||||||||||||||||||
Regional Banking | ||||||||||||||||||||||||||||||||||
Nonperforming loans | $ | 175,188 | $ | 142,916 | $ | 113,187 | $ | 118,506 | $ | 145,265 | 23% | 21% | ||||||||||||||||||||||
OREO | 9,210 | 10,278 | 12,347 | 13,408 | 13,251 | (10)% | (30)% | |||||||||||||||||||||||||||
Total Regional Banking | $ | 184,398 | $ | 153,194 | $ | 125,534 | $ | 131,914 | $ | 158,516 | 20% | 16% | ||||||||||||||||||||||
Non-Strategic | ||||||||||||||||||||||||||||||||||
Nonperforming loans | $ | 49,594 | $ | 45,595 | $ | 47,651 | $ | 52,346 | $ | 57,654 | 9% | (14)% | ||||||||||||||||||||||
Nonperforming loans held-for-sale after fair value adjustments | 6,219 | 3,611 | 4,047 | 4,199 | 4,514 | 72% | 38% | |||||||||||||||||||||||||||
OREO | 3,967 | 3,603 | 3,313 | 4,408 | 3,342 | 10% | 19% | |||||||||||||||||||||||||||
Total Non-Strategic | $ | 59,780 | $ | 52,809 | $ | 55,011 | $ | 60,953 | $ | 65,510 | 13% | (9)% | ||||||||||||||||||||||
Corporate | ||||||||||||||||||||||||||||||||||
Nonperforming loans | $ | 1,209 | $ | 1,302 | $ | 1,327 | $ | 1,643 | $ | 1,667 | (7)% | (27)% | ||||||||||||||||||||||
Total nonperforming assets | $ | 245,387 | $ | 207,305 | $ | 181,872 | $ | 194,510 | $ | 225,693 | 18% | 9% | ||||||||||||||||||||||
Net Charge-Offs | ||||||||||||||||||||||||||||||||||
Regional Banking | $ | 17,989 | $ | 8,119 | $ | 5,886 | $ | 17,074 | $ | 7,841 | NM | NM | ||||||||||||||||||||||
Non-Strategic | (1,380 | ) | (908 | ) | (3,044 | ) | (2,474 | ) | (2,679 | ) | (52)% | 48% | ||||||||||||||||||||||
Total net charge-offs/(recoveries) | $ | 16,609 | $ | 7,211 | $ | 2,842 | $ | 14,600 | $ | 5,162 | NM | NM | ||||||||||||||||||||||
Consolidated Key Ratios (c) | ||||||||||||||||||||||||||||||||||
30+ Delinq. % (d) | 0.13 | % | 0.19 | % | 0.19 | % | 0.23 | % | 0.20 | % | ||||||||||||||||||||||||
NPL % | 0.69 | 0.57 | 0.52 | 0.55 | 0.69 | |||||||||||||||||||||||||||||
NPA % | 0.73 | 0.61 | 0.57 | 0.61 | 0.74 | |||||||||||||||||||||||||||||
Net charge-offs % (e) | 0.20 | 0.10 | 0.04 | 0.19 | 0.07 | |||||||||||||||||||||||||||||
Allowance / loans % (a) | 1.64 | 1.33 | 0.64 | 0.62 | 0.65 | |||||||||||||||||||||||||||||
Allowance / NPL (a) | 2.38 | x | 2.34 | x | 1.24 | x | 1.12 | x | 0.94 | x | ||||||||||||||||||||||||
Allowance / NPA (a) | 2.25 | x | 2.18 | x | 1.13 | x | 1.01 | x | 0.87 | x | ||||||||||||||||||||||||
Allowance / net charge-offs | 8.05 | x | 15.33 | x | 17.76 | x | 3.33 | x | 9.31 | x | ||||||||||||||||||||||||
Other | ||||||||||||||||||||||||||||||||||
Loans past due 90 days or more and still accruing (f) | $ | 20,600 | $ | 20,340 | $ | 28,343 | $ | 27,182 | $ | 28,663 | 1% | (28)% | ||||||||||||||||||||||
Guaranteed portion (f) | 5,998 | 5,165 | 6,417 | 6,028 | 5,628 | 16% | 7% | |||||||||||||||||||||||||||
Period-end loans, net of unearned income (millions) | 32,709 | 33,378 | 31,061 | 31,261 | 29,713 | (2)% | 10% | |||||||||||||||||||||||||||
30+ delinquencies (thousands) | $ | 41,654 | $ | 62,642 | $ | 57,911 | $ | 70,675 | $ | 58,861 | (34)% | (29)% | ||||||||||||||||||||||
NM - Not meaningful
* Amount is less than one percent.
(a) | Effective 1/1/2020 FHN adopted ASU 2016-13, "Measurement of Credit Losses on Financial Instruments," (CECL) which resulted in an increase to the allowance for loan losses of $106.4 million in 1Q20; 2Q20 and 1Q20 increases reflect increased reserves established in association with the economic forecast attributable to the COVID-19 pandemic. |
(b) | 2Q20 and 1Q20 increases reflect increased reserves established in association with the economic forecast attributable to the COVID-19 pandemic. |
(c) | See Glossary of Terms for definitions of Consolidated Key Ratios. |
(d) | 30+ Delinquency % includes all accounts delinquent more than one month and still accruing interest. |
(e) | 2Q20 increase in charge-offs as a percentage of loans was primarily driven by two credits; 3Q19 increase in charge-offs as a percentage of loans was primarily driven by two credits. |
(f) | Includes loans held-for-sale. |
19
FHN ASSET QUALITY: CONSOLIDATED
Quarterly, Unaudited
2Q20 Changes vs. | |||||||||||||||||||||||||||||
2Q20 | 1Q20 | 4Q19 | 3Q19 | 2Q19 | 1Q20 | 2Q19 | |||||||||||||||||||||||
Key Portfolio Details | |||||||||||||||||||||||||||||
C&I (a) | |||||||||||||||||||||||||||||
Period-end loans ($ millions) | $ | 21,394 | $ | 22,124 | $ | 20,051 | $ | 20,294 | $ | 19,054 | (3)% | 12% | |||||||||||||||||
30+ Delinq. % (b) (c) | 0.03 | % | 0.08 | % | 0.05 | % | 0.11 | % | 0.05 | % | |||||||||||||||||||
NPL % (d) | 0.60 | 0.43 | 0.37 | 0.38 | 0.56 | ||||||||||||||||||||||||
Charge-offs % (qtr. annualized) (e) | 0.30 | 0.12 | 0.07 | 0.32 | 0.14 | ||||||||||||||||||||||||
Allowance / loans % (f) | 1.49 | % | 1.15 | % | 0.61 | % | 0.56 | % | 0.61 | % | |||||||||||||||||||
Allowance / net charge-offs | 4.63 | x | 10.88 | x | 9.25 | x | 1.87 | x | 4.77 | x | |||||||||||||||||||
Commercial Real Estate (a) | |||||||||||||||||||||||||||||
Period-end loans ($ millions) | $ | 4,813 | $ | 4,640 | $ | 4,337 | $ | 4,229 | $ | 3,861 | 4% | 25% | |||||||||||||||||
30+ Delinq. % (b) | 0.00 | % | 0.01 | % | 0.02 | % | 0.04 | % | 0.07 | % | |||||||||||||||||||
NPL % | 0.04 | 0.05 | 0.04 | 0.05 | 0.07 | ||||||||||||||||||||||||
Charge-offs % (qtr. annualized) | NM | 0.00 | NM | 0.02 | 0.02 | ||||||||||||||||||||||||
Allowance / loans % (f) | 1.19 | % | 1.03 | % | 0.83 | % | 0.84 | % | 0.85 | % | |||||||||||||||||||
Allowance / net charge-offs | NM | NM | NM | 47.70 | x | 39.25 | x | ||||||||||||||||||||||
Consumer Real Estate (g) | |||||||||||||||||||||||||||||
Period-end loans ($ millions) | $ | 6,053 | $ | 6,119 | $ | 6,177 | $ | 6,245 | $ | 6,303 | (1)% | (4)% | |||||||||||||||||
30+ Delinq. % (b) | 0.53 | % | 0.66 | % | 0.70 | % | 0.68 | % | 0.66 | % | |||||||||||||||||||
NPL % | 1.59 | 1.49 | 1.39 | 1.50 | 1.50 | ||||||||||||||||||||||||
Charge-offs % (qtr. annualized) | NM | NM | NM | NM | NM | ||||||||||||||||||||||||
Allowance / loans % (f) | 2.38 | % | 2.01 | % | 0.46 | % | 0.49 | % | 0.50 | % | |||||||||||||||||||
Allowance / net charge-offs | NM | NM | NM | NM | NM | ||||||||||||||||||||||||
Credit Card and Other | |||||||||||||||||||||||||||||
Period-end loans ($ millions) | $ | 449 | $ | 495 | $ | 496 | $ | 493 | $ | 495 | (9)% | (9)% | |||||||||||||||||
30+ Delinq. % (b) | 0.77 | % | 0.99 | % | 0.93 | % | 0.94 | % | 1.06 | % | |||||||||||||||||||
NPL % | 0.06 | 0.07 | 0.07 | 0.07 | 0.09 | ||||||||||||||||||||||||
Charge-offs % (qtr. annualized) | 1.35 | 2.12 | 2.29 | 2.10 | 2.17 | ||||||||||||||||||||||||
Allowance / loans % (f) | 4.03 | % | 3.91 | % | 2.68 | % | 2.58 | % | 2.46 | % | |||||||||||||||||||
Allowance / net charge-offs | 2.82 | x | 1.83 | x | 1.14 | x | 1.21 | x | 1.13 | x | |||||||||||||||||||
NM - Not meaningful
* Amount is less than one percent.
(a) | In 3Q19, FHN prospectively reclassified approximately $410 million of regional banking market investor CRE loans from the C&I portfolio to the CRE portfolio. The reclassification did not have an impact on FHN’s consolidated balance sheet and the impact to the consolidated financial statements from the effect on the allowance for loan losses was immaterial. |
(b) | 30+ Delinquency % includes all accounts delinquent more than one month and still accruing interest. |
(c) | 2Q20 decrease in delinquencies as a percentage of total loans was driven by several loans that returned to current; 1Q20 increase in delinquencies as a percentage of total loans was primarily driven by two credits; 3Q19 increase in delinquencies as a percentages of total loans was primarily driven by one credit. |
(d) | 2Q20 increase in NPLs as a percentage of total loans was primarily driven by two credits; 1Q20 increase in NPLs as a percentage of total loans was primarily driven by one credit; 2Q19 NPLs as a percentage of total loans was primarily driven by one credit. |
(e) | 2Q20 charge-offs as a percentage of total loans was primarily driven by two credits; 1Q20 increase in charge-offs as a percentage of total loans was primarily driven by one credit; 3Q19 increase in charge-offs as a percentage of loans was primarily driven by two credits. |
(f) | Effective 1/1/2020 FHN adopted ASU 2016-13, "Measurement of Credit Losses on Financial Instruments," (CECL) which resulted in an increase to the allowance for loan losses of $106.4 million in 1Q20; 2Q20 and 1Q20 increases reflect increased reserves established in association with the economic forecast attributable to the COVID-19 pandemic. |
(g) | In 1Q20, the Permanent Mortgage portfolio was combined into Consumer Real Estate portfolio, all prior periods were revised for comparability. |
20
FHN ASSET QUALITY: REGIONAL BANKING
Quarterly, Unaudited
2Q20 Changes vs. | |||||||||||||||||||||||||||||
2Q20 | 1Q20 | 4Q19 | 3Q19 | 2Q19 | 1Q20 | 2Q19 | |||||||||||||||||||||||
Total Regional Banking | |||||||||||||||||||||||||||||
Period-end loans ($ millions) | $ | 31,990 | $ | 32,591 | $ | 30,213 | $ | 30,345 | $ | 28,711 | (2)% | 11% | |||||||||||||||||
30+ Delinq. % (b) (c) | 0.10 | % | 0.15 | % | 0.14 | % | 0.18 | % | 0.15 | % | |||||||||||||||||||
NPL % (d) | 0.55 | 0.44 | 0.37 | 0.39 | 0.51 | ||||||||||||||||||||||||
Charge-offs % (qtr. annualized) (e) | 0.22 | 0.11 | 0.08 | 0.23 | 0.11 | ||||||||||||||||||||||||
Allowance / loans % (f) | 1.58 | % | 1.27 | % | 0.60 | % | 0.57 | % | 0.60 | % | |||||||||||||||||||
Allowance / net charge-offs | 6.96 | x | 12.66 | x | 7.82 | x | 2.57 | x | 5.43 | x | |||||||||||||||||||
Key Portfolio Details | |||||||||||||||||||||||||||||
C&I (a) | |||||||||||||||||||||||||||||
Period-end loans ($ millions) | $ | 21,074 | $ | 21,798 | $ | 19,721 | $ | 19,962 | $ | 18,710 | (3)% | 13% | |||||||||||||||||
30+ Delinq. % (b) (c) | 0.03 | % | 0.07 | % | 0.05 | % | 0.11 | % | 0.05 | % | |||||||||||||||||||
NPL % (d) | 0.60 | 0.44 | 0.38 | 0.37 | 0.56 | ||||||||||||||||||||||||
Charge-offs % (qtr. annualized) (e) | 0.31 | 0.12 | 0.07 | 0.33 | 0.14 | ||||||||||||||||||||||||
Allowance / loans % (f) | 1.46 | % | 1.12 | % | 0.62 | % | 0.57 | % | 0.61 | % | |||||||||||||||||||
Allowance / net charge-offs | 4.48 | x | 10.45 | x | 9.23 | x | 1.87 | x | 4.73 | ||||||||||||||||||||
Commercial Real Estate (a) | |||||||||||||||||||||||||||||
Period-end loans ($ millions) | $ | 4,794 | $ | 4,608 | $ | 4,292 | $ | 4,172 | $ | 3,787 | 4% | 27% | |||||||||||||||||
30+ Delinq. % (b) | — | % | 0.01 | % | 0.02 | % | 0.04 | % | 0.07 | % | |||||||||||||||||||
NPL % | 0.04 | 0.05 | 0.04 | 0.05 | 0.07 | ||||||||||||||||||||||||
Charge-offs % (qtr. annualized) | NM | — | NM | 0.02 | 0.02 | ||||||||||||||||||||||||
Allowance / loans % (f) | 1.18 | % | 1.02 | % | 0.79 | % | 0.79 | % | 0.77 | % | |||||||||||||||||||
Allowance / net charge-offs | NM | NM | NM | 43.95 | 34.79 | ||||||||||||||||||||||||
Consumer Real Estate (g) | |||||||||||||||||||||||||||||
Period-end loans ($ millions) | $ | 5,692 | $ | 5,717 | $ | 5,738 | $ | 5,763 | $ | 5,776 | * | (1)% | |||||||||||||||||
30+ Delinq. % (b) | 0.42 | % | 0.51 | % | 0.50 | % | 0.48 | % | 0.50 | % | |||||||||||||||||||
NPL % (h) | 0.80 | 0.78 | 0.65 | 0.74 | 0.66 | ||||||||||||||||||||||||
Charge-offs % (qtr. annualized) | NM | NM | NM | NM | NM | ||||||||||||||||||||||||
Allowance / loans % (f) | 2.12 | % | 1.80 | % | 0.23 | % | 0.26 | % | 0.25 | % | |||||||||||||||||||
Allowance / net charge-offs | NM | NM | NM | NM | NM | ||||||||||||||||||||||||
Credit Card and Other | |||||||||||||||||||||||||||||
Period-end loans ($ millions) | $ | 430 | $ | 468 | $ | 462 | $ | 448 | $ | 438 | (8)% | (2)% | |||||||||||||||||
30+ Delinq. % (b) | 0.74 | % | 0.90 | % | 0.69 | % | 0.65 | % | 0.66 | % | |||||||||||||||||||
NPL % | 0.02 | 0.02 | 0.01 | 0.01 | 0.01 | ||||||||||||||||||||||||
Charge-offs % (qtr. annualized) | 1.42 | 2.14 | 2.32 | 2.02 | 1.84 | ||||||||||||||||||||||||
Allowance / loans % (f) | 4.14 | % | 4.06 | % | 2.87 | % | 2.83 | % | 2.77 | % | |||||||||||||||||||
Allowance / net charge-offs | 2.77 | x | 1.89 | x | 1.21 | x | 1.40 | x | 1.51 | x | |||||||||||||||||||
ASSET QUALITY: CORPORATE | |||||||||||||||||||||||||||||
Consumer Real Estate (g) | |||||||||||||||||||||||||||||
Period-end loans ($ millions) | $ | 28 | $ | 31 | $ | 31 | $ | 34 | $ | 35 | (10)% | (20)% | |||||||||||||||||
30+ Delinq. % (b) | 4.90 | % | 5.39 | % | 5.29 | % | 5.00 | % | 4.03 | % | |||||||||||||||||||
NPL % | 4.34 | 4.25 | 4.22 | 4.90 | 4.79 | ||||||||||||||||||||||||
Charge-offs % (qtr. annualized) | NM | NM | NM | NM | NM | ||||||||||||||||||||||||
Allowance / loans % | NM | NM | NM | NM | NM | ||||||||||||||||||||||||
Allowance / net charge-offs | NM | NM | NM | NM | NM | ||||||||||||||||||||||||
NM - Not meaningful
* Amount is less than one percent.
(a) | In 3Q19, FHN prospectively reclassified approximately $410 million of regional banking market investor CRE loans from the C&I portfolio to the CRE portfolio. The reclassification did not have an impact on FHN’s consolidated balance sheet and the impact to the consolidated financial statements from the effect on the allowance for loan losses was immaterial. |
(b) | 30+ Delinquency % includes all accounts delinquent more than one month and still accruing interest. |
(c) | 2Q20 decrease in delinquencies as a percentage of total loans was primarily driven by several loans to that returned to current; 1Q20 increase in delinquencies as a percentage of total loans was primarily driven by two credits; 3Q19 increase in delinquencies as a percentage of total loans was primarily driven by one credit. |
(d) | 2Q20 increase in NPLs as a percentage of total loans was primarily driven by two credits; 1Q20 increase in NPLs as a percentage of total loans was primarily driven by one credit. |
(e) | 2Q20 charge-offs as a percentage of total loans was primarily driven by two credits; 1Q20 charge-offs as a percentage of total loans was primarily driven by one credit; 3Q19 increase in charge-offs as a percentage of loans was primarily driven by two credits. |
(f) | Effective 1/1/2020 FHN adopted ASU 2016-13, "Measurement of Credit Losses on Financial Instruments," (CECL) which resulted in an increase to the allowance for loan losses of $106.4 million in 1Q20; 2Q20 and 1Q20 increases reflect increased reserves established in association with the economic forecast attributable to the COVID-19 pandemic. |
(g) | In 1Q20, the Permanent Mortgage portfolio was combined into Consumer Real Estate portfolio, all prior periods were revised for comparability. |
(h) | 1Q20 increase in NPL as a percentage of total loans was primarily driven by one credit. |
21
FHN ASSET QUALITY: NON-STRATEGIC
Quarterly, Unaudited
2Q20 Changes vs. | |||||||||||||||||||||||||||||
2Q20 | 1Q20 | 4Q19 | 3Q19 | 2Q19 | 1Q20 | 2Q19 | |||||||||||||||||||||||
Total Non-Strategic | |||||||||||||||||||||||||||||
Period-end loans ($ millions) | $ | 691 | $ | 756 | $ | 817 | $ | 882 | $ | 967 | (9)% | (29)% | |||||||||||||||||
30+ Delinq. % (a) | 1.06 | % | 1.56 | % | 1.72 | % | 1.67 | % | 1.42 | % | |||||||||||||||||||
NPL % | 7.17 | 6.03 | 5.83 | 5.93 | 5.96 | ||||||||||||||||||||||||
Charge-offs % (qtr. annualized) | NM | NM | NM | NM | NM | ||||||||||||||||||||||||
Allowance / loans % (b) | 4.92 | % | 4.09 | % | 2.15 | % | 2.14 | % | 2.27 | % | |||||||||||||||||||
Allowance / net charge-offs | NM | NM | NM | NM | NM | ||||||||||||||||||||||||
Key Portfolio Details | |||||||||||||||||||||||||||||
Commercial | |||||||||||||||||||||||||||||
Period-end loans ($ millions) | $ | 339 | $ | 358 | $ | 375 | $ | 388 | $ | 418 | (5)% | (19)% | |||||||||||||||||
30+ Delinq. % (a) (c) | — | % | 0.45 | % | — | % | — | % | — | % | |||||||||||||||||||
NPL % | — | — | — | 0.70 | 0.66 | ||||||||||||||||||||||||
Charge-offs % (qtr. annualized) | — | — | — | — | 0.02 | ||||||||||||||||||||||||
Allowance / loans % (b) | 3.19 | % | 2.95 | % | 0.65 | % | 0.77 | % | 1.20 | % | |||||||||||||||||||
Allowance / net charge-offs | NM | NM | NM | NM | 56.57 | ||||||||||||||||||||||||
Consumer Real Estate (d) | |||||||||||||||||||||||||||||
Period-end loans ($ millions) | $ | 332 | $ | 371 | $ | 407 | $ | 449 | $ | 492 | (11)% | (33)% | |||||||||||||||||
30+ Delinq. % (a) (e) | 2.11 | % | 2.56 | % | 3.10 | % | 2.91 | % | 2.30 | % | |||||||||||||||||||
NPL % | 14.88 | 12.19 | 11.63 | 10.98 | 11.07 | ||||||||||||||||||||||||
Charge-offs % (qtr. annualized) | NM | NM | NM | NM | NM | ||||||||||||||||||||||||
Allowance / loans % (b) | 6.89 | % | 5.40 | % | 3.71 | % | 3.54 | % | 3.42 | % | |||||||||||||||||||
Allowance / net charge-offs | NM | NM | NM | NM | NM | ||||||||||||||||||||||||
Other Consumer | |||||||||||||||||||||||||||||
Period-end loans ($ millions) | $ | 20 | $ | 27 | $ | 35 | $ | 45 | $ | 57 | (26)% | (65)% | |||||||||||||||||
30+ Delinq. % (a) | 1.42 | % | 2.60 | % | 4.05 | % | 3.78 | % | 4.21 | % | |||||||||||||||||||
NPL % | 0.79 | 0.94 | 0.85 | 0.72 | 0.72 | ||||||||||||||||||||||||
Charge-offs % (qtr. annualized) | NM | 1.82 | 1.83 | 2.84 | 4.41 | ||||||||||||||||||||||||
Allowance / loans % (b) | 1.57 | % | 1.21 | % | 0.09 | % | 0.09 | % | 0.09 | % | |||||||||||||||||||
Allowance / net charge-offs | NM | 0.58 | x | 0.04 | x | 0.03 | 0.02 | ||||||||||||||||||||||
NM - Not meaningful
(a) | 30+ Delinquency % includes all accounts delinquent more than one month and still accruing interest. |
(b) | Effective 1/1/2020 FHN adopted ASU 2016-13, "Measurement of Credit Losses on Financial Instruments," (CECL) which resulted in an increase to the allowance for loan losses of $106.4 million in 1Q20; 2Q20 and 1Q20 increases reflect increased reserves established in association with the economic forecast attributable to the COVID-19 pandemic. |
(c) | 1Q20 increase in delinquencies as a percentage of total loans was primarily driven by one credit |
(d) | In 1Q20, the Permanent Mortgage portfolio was combined into Consumer Real Estate portfolio, all prior periods were revised for comparability. |
(e) | 3Q19 increase in delinquencies as a percentage of total loans was primarily driven by two credits. |
22
FHN NON-GAAP TO GAAP RECONCILIATION |
Quarterly, Unaudited |
(Dollars and shares in thousands, except per share data) | 2Q20 | 1Q20 | 4Q19 | 3Q19 | 2Q19 | |||||||||||||||
Tangible Common Equity (Non-GAAP) | ||||||||||||||||||||
(A) Total equity (GAAP) | $ | 5,208,385 | $ | 5,055,580 | $ | 5,076,008 | $ | 4,996,043 | $ | 4,926,081 | ||||||||||
Less: Noncontrolling interest (a) | 295,431 | 295,431 | 295,431 | 295,431 | 295,431 | |||||||||||||||
Less: Preferred stock (a) | 240,289 | 95,624 | 95,624 | 95,624 | 95,624 | |||||||||||||||
(B) Total common equity | $ | 4,672,665 | $ | 4,664,525 | $ | 4,684,953 | $ | 4,604,988 | $ | 4,535,026 | ||||||||||
Less: Intangible assets (GAAP) (b) | 1,552,395 | 1,557,679 | 1,562,987 | 1,569,193 | 1,575,399 | |||||||||||||||
(C) Tangible common equity (Non-GAAP) | $ | 3,120,270 | $ | 3,106,846 | $ | 3,121,966 | $ | 3,035,795 | $ | 2,959,627 | ||||||||||
Tangible Assets (Non-GAAP) | ||||||||||||||||||||
(D) Total assets (GAAP) | $ | 48,644,659 | $ | 47,197,378 | $ | 43,310,900 | $ | 43,717,684 | $ | 42,171,770 | ||||||||||
Less: Intangible assets (GAAP) (b) | 1,552,395 | 1,557,679 | 1,562,987 | 1,569,193 | 1,575,399 | |||||||||||||||
(E) Tangible assets (Non-GAAP) | $ | 47,092,264 | $ | 45,639,699 | $ | 41,747,913 | $ | 42,148,491 | $ | 40,596,371 | ||||||||||
Average Tangible Common Equity (Non-GAAP) | ||||||||||||||||||||
(F) Average total equity (GAAP) | $ | 5,117,613 | $ | 5,002,394 | $ | 5,039,868 | $ | 4,962,341 | $ | 4,869,161 | ||||||||||
Less: Average noncontrolling interest (a) | 295,431 | 295,431 | 295,431 | 295,431 | 295,431 | |||||||||||||||
Less: Average preferred stock (a) | 149,675 | 95,624 | 95,624 | 95,624 | 95,624 | |||||||||||||||
(G) Total average common equity | $ | 4,672,507 | $ | 4,611,339 | $ | 4,648,813 | $ | 4,571,286 | $ | 4,478,106 | ||||||||||
Less: Average intangible assets (GAAP) (b) | 1,555,049 | 1,560,340 | 1,566,079 | 1,572,312 | 1,578,505 | |||||||||||||||
(H) Average tangible common equity (Non-GAAP) | $ | 3,117,458 | $ | 3,050,999 | $ | 3,082,734 | $ | 2,998,974 | $ | 2,899,601 | ||||||||||
Annualized Net Income/(loss) Available to Common Shareholders | ||||||||||||||||||||
(I) Net income /(loss) available to common shareholders (annualized) (GAAP) | $ | 210,205 | $ | 48,545 | $ | 463,483 | $ | 434,469 | $ | 438,562 | ||||||||||
Period-end Shares Outstanding | ||||||||||||||||||||
(J) Period-end shares outstanding | 312,359 | 311,863 | 311,469 | 311,180 | 312,478 | |||||||||||||||
Pre-provision Net Revenue ("PPNR") | ||||||||||||||||||||
Net interest income (GAAP) | $ | 305,344 | $ | 302,802 | $ | 311,393 | $ | 300,676 | $ | 303,610 | ||||||||||
Plus: Noninterest income (GAAP) | 206,269 | 174,756 | 183,307 | 171,735 | 157,993 | |||||||||||||||
Total revenues (GAAP) | 511,613 | 477,558 | 494,700 | 472,411 | 461,603 | |||||||||||||||
Less: Noninterest expense (GAAP) | 332,168 | 311,319 | 327,447 | 307,672 | 300,394 | |||||||||||||||
PPNR (Non-GAAP) | 179,445 | 166,239 | 167,253 | 164,739 | 161,209 | |||||||||||||||
Provision/(provision credit) for loan losses (GAAP) | 110,000 | 145,000 | 10,000 | 15,000 | 13,000 | |||||||||||||||
Income before income taxes (pre-tax income ("PTI")) (GAAP) | $ | 69,445 | $ | 21,239 | $ | 157,253 | $ | 149,739 | $ | 148,209 | ||||||||||
Ratios | ||||||||||||||||||||
(I)/(G) Return on average common equity (“ROCE”) (GAAP) | 4.50 | % | 1.05 | % | 9.97 | % | 9.50 | % | 9.79 | % | ||||||||||
(I)/(H) Return on average tangible common equity (“ROTCE”) (Non-GAAP) | 6.74 | % | 1.59 | % | 15.03 | % | 14.49 | % | 15.12 | % | ||||||||||
(A)/(D) Total equity to total assets (GAAP) | 10.71 | % | 10.71 | % | 11.72 | % | 11.43 | % | 11.68 | % | ||||||||||
(C)/(E) Tangible common equity to tangible assets (“TCE/TA”) (Non-GAAP) | 6.63 | % | 6.81 | % | 7.48 | % | 7.20 | % | 7.29 | % | ||||||||||
(B)/(J) Book value per common share (GAAP) | $ | 14.96 | $ | 14.96 | $ | 15.04 | $ | 14.80 | $ | 14.51 | ||||||||||
(C)/(J) Tangible book value per common share (Non-GAAP) | $ | 9.99 | $ | 9.96 | $ | 10.02 | $ | 9.76 | $ | 9.47 | ||||||||||
(a) | Included in Total equity on the Consolidated Balance Sheet. |
(b) | Includes goodwill and other intangible assets, net of amortization. |
23

FHN GLOSSARY OF TERMS
Average Assets for Leverage: The amount of assets a company uses to calculate the leverage ratio, which includes average total assets less disallowed portions of goodwill, other intangibles, and deferred tax assets, as well as certain other regulatory adjustments made to tier 1 capital.
Common Equity Tier 1 Ratio: Ratio consisting of common equity adjusted for certain unrealized gains/(losses) on available-for-sale securities, less disallowed portions of goodwill, other intangibles, and deferred tax assets as well as certain other regulatory deductions divided by risk-weighted assets.
Core Businesses: Management considers regional banking, fixed income, and corporate as FHN’s core businesses. Non-strategic has legacy assets and operations that are being wound down.
Current Expected Credit Loss (“CECL”): New accounting standard that focuses on estimation of expected losses over the life of the loans which is measured by the difference between amortized cost and the net amount expected to be collected.
Fully Taxable Equivalent (“FTE”): Reflects the amount of tax-exempt income adjusted to a level that would yield the same after-tax income had that income been subject to taxation.
Market-Indexed Deposits: Deposits with pricing tied to an index not administered by FHN. For FHN these are comprised of insured network deposits, correspondent banking deposits, and trust/sweep deposits.
Market-Indexed Deposits: Deposits with pricing tied to an index not administered by FHN. For FHN these are comprised of insured network deposits, correspondent banking deposits, and trust/sweep deposits.
Paycheck Protection Program (“PPP”): The Paycheck Protection Program is a loan designed to provide direct incentive for small businesses to keep their workers on the payroll. Loans guaranteed under the PPP will be 100 percent guaranteed by the Small Business Administration ("SBA"), and the full principal amount of the loans may qualify for loan forgiveness if all employees are kept on the payroll for eight weeks and the money is used for payroll, rent, mortgage interest, or utilities.
Tier 1 Capital Ratio: Ratio consisting of shareholders’ equity adjusted for certain unrealized gains/(losses) on available-for-sale securities, plus qualifying portions of noncontrolling interests, less disallowed portions of goodwill, other intangible assets, and deferred tax assets as well as certain other regulatory deductions divided by risk-weighted assets.
Key Ratios
Return on Average Assets: Ratio is annualized net income to average total assets.
Return on Average Common Equity: Ratio is annualized net income available to common shareholders to average common equity.
Return on Average Tangible Common Equity: Ratio is annualized net income available to common shareholders to average tangible common equity.
Fee Income to Total Revenue: Ratio is fee income excluding securities gains/(losses) to total revenue excluding securities gains/(losses).
Efficiency Ratio: Ratio is noninterest expense to total revenue excluding securities gains/(losses).
Leverage Ratio: Ratio is tier 1 capital to average assets for leverage.
Asset Quality - Consolidated Key Ratios
NPL %: Ratio is nonperforming loans in the loan portfolio to total period-end loans.
NPA %: Ratio is nonperforming assets related to the loan portfolio to total period-end loans plus foreclosed real estate and other assets.
Net charge-offs %: Ratio is annualized net charge-offs to total average loans.
Allowance / loans: Ratio is allowance for loan losses to total period-end loans.
Allowance / NPL: Ratio is allowance for loan losses to nonperforming loans in the loan portfolio.
Allowance / NPA: Ratio is allowance for loan losses to nonperforming assets related to the loan portfolio.
Allowance / charge-offs: Ratio is allowance for loan losses to annualized net charge-offs.
24