Attached files
| file | filename |
|---|---|
| EX-99.1 - EXHIBIT 99.1 - PACWEST BANCORP | tm2024794d1_ex99-1.htm |
| 8-K - FORM 8-K - PACWEST BANCORP | tm2024794-1_8k.htm |
Exhibit 99.2

2020 Second Quarter Results Earnings Release Presentation July 16, 2020

Second Quarter 2020 | PACW | p. 2 This communication contains certain forward - looking information about PacWest Bancorp that is intended to be covered by the safe harbor for “forward - looking statements” provided by the Private Securities Litigation Reform Act of 1995. Statements that are not historical or current facts, including statements about future financial and operational results, expectations, or intentions are forward - looking statements. Such statements are based on information available at the time of the communication and are based on current beliefs and expectations of the Company’s management and are subject to significant risks, uncertainties and contingencies, many of which are beyond our control. The COVID - 19 pandemic is adversely affecting PacWest Bancorp, its employees, customers and third - party service providers, and the ultimate extent of the impacts on its business, financial position, results of operations, liquidity and prospects is uncertain. The length of the COVID - 19 pandemic and the severity of its impact on key macro - economic indicators such as unemployment and GDP may have a material impact on our allowance for credit losses and related provision for credit losses. Continued deterioration in general business and economic conditions could adversely affect PacWest Bancorp’s revenues and the values of its assets and liabilities, including goodwill, lead to a tightening of credit and increase stock price volatility. In addition, PacWest Bancorp’s results could be adversely affected by changes in interest rates, sustained high unemployment rates, deterioration in the credit quality of its loan portfolio or in the value of the collateral securing those loans, deterioration in the value of its investment securities and legal and regulatory developments. Actual results may differ materially from those set forth or implied in the forward - looking statements due to a variety of factors, including the risk factors described in documents filed by the Company with the U.S. Securities and Exchange Commission. We are under no obligation (and expressly disclaim any such obligation) to update or alter our forward - looking statements, whether as a result of new information, future events or otherwise, except as required by law . Forward - Looking Statements

Second Quarter 2020 | PACW | p. 3 Presentation Index COVID - 19 Pandemic Update 4 Second Quarter Significant Items 8 Loans and Leases & Credit Quality 13 Deposits 34 Net Interest Margin 37 Investment Securities 42 Controlled Expenses 44 Company Overview 46 Non - GAAP Measurements 51

Second Quarter 2020 | PACW | p. 4 COVID - 19 Pandemic Update

Second Quarter 2020 | PACW | p. 5 Our Response to the COVID - 19 Pandemic Our Employees, Clients and Communities • Nearly all non - branch employees continue to work remotely • Business travel remains suspended • Provided a special bonus of $1,000 for employees in our branches and critical locations • Provided Personal Protection Equipment (PPE) to our employees • Made changes to facilities such as plexi - glass shields, enhanced cleaning and social distancing • Developed a Return - to - Office Strategy and Plan based on guidance from State/Local government agencies and the CDC; slow phased - in approach started in late June • Conducted employee training and provided guidance to ensure a safe environment • 27 branch lobbies remain closed where drive - up tellers are available • In June re - opened all but 3 of the 19 branches initially closed; and returned to normal business hours • Continue to monitor pandemic health metric trends to modify operations as needed • COVID - related donations to date of over $800,000 • COVID - related investments under Community Re - investment Act: $2.3 million
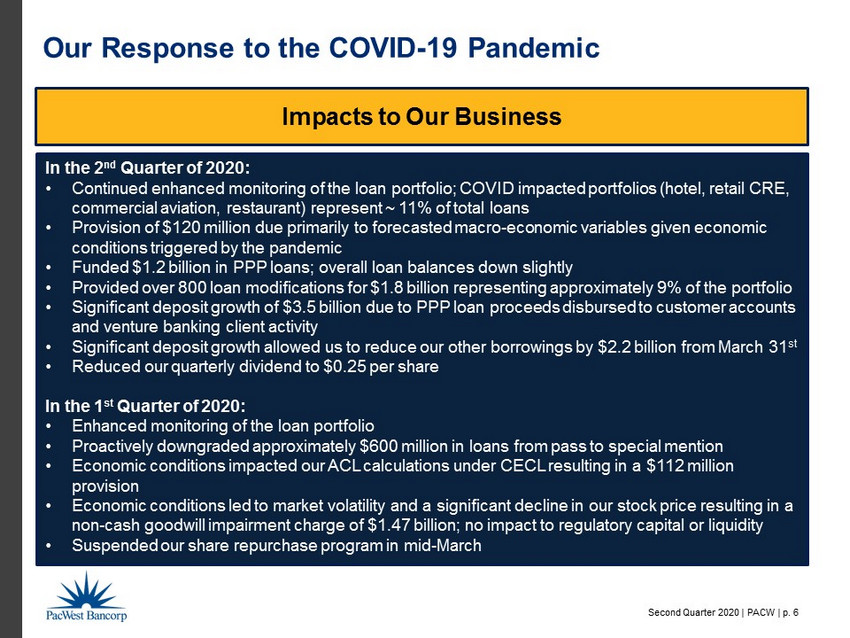
Second Quarter 2020 | PACW | p. 6 Our Response to the COVID - 19 Pandemic Impacts to O ur Business In the 2 nd Quarter of 2020: • Continued enhanced monitoring of the loan portfolio; COVID impacted portfolios (hotel, retail CRE, commercial aviation, restaurant) represent ~ 11% of total loans • Provision of $120 million due primarily to forecasted macro - economic variables given economic conditions triggered by the pandemic • Funded $1.2 billion in PPP loans; overall loan balances down slightly • Provided over 800 loan modifications for $1.8 billion representing approximately 9% of the portfolio • Significant deposit growth of $3.5 billion due to PPP loan proceeds disbursed to customer accounts and venture banking client activity • S ignificant deposit growth allowed us to reduce our other borrowings by $2.2 billion from March 31 st • Reduced our quarterly dividend to $0.25 per share In the 1 st Quarter of 2020: • Enhanced monitoring of the loan portfolio • Proactively downgraded approximately $600 million in loans from pass to special mention • Economic conditions impacted our ACL calculations under CECL resulting in a $112 million provision • Economic conditions led to market volatility and a significant decline in our stock price resulting in a non - cash goodwill impairment charge of $1.47 billion; no impact to regulatory capital or liquidity • Suspended our share repurchase program in mid - March

Second Quarter 2020 | PACW | p. 7 ($ in thousands) Gross Average Orig. Orig. Balance Range Count Amount Balance Fee % Fee $ Greater than or equal to $2,000,000 101 356,950$ 3,534$ 1.00% 3,570$ $350,001 - $1,999,999 731 573,838 785 3.00% 17,215 Less than or equal to $350,000 3,309 311,921 94 5.00% 15,596 Total 4,141 1,242,709$ 300$ 2.93% 36,381$ Our Response to the COVID - 19 Pandemic • Loan coupon 1% • Two - year term • Fee income amortized over 2 years; acceleration upon forgiveness or repayment Paycheck Protection Program (PPP) Loan Payment/Deferral Modifications • Data as of July 10, 2020 • Most modifications in May/June ~ 81% • Most deferrals were 3 months; some up to 6 months • Most extensions were 3 months; some up to one year • Some modifications requested by borrowers for liquidity preservation purposes • Further details on certain portfolios (see slides 20 - 27) Total Deferral & Portfolio Deferral and Count Portfolio Class Extensions Balance Balance Extensions % 117 Commercial Real Estate 858$ 4,222$ 20.3% 49 Income Producing Residential 225 3,734 6.0% 13 Commercial Construction 284 2,173 13.1% 6 Residential Construction 176 1,168 15.1% 42 Asset Based 111 3,413 3.3% 18 Venture Capital 16 1,814 0.9% 151 Other Commercial 46 2,760 1.7% 485 Consumer 33 411 8.0% 881 1,749$ 19,695$ 8.9% ($ in thousands)

Second Quarter 2020 | PACW | p. 8 Second Quarter Significant Items

Second Quarter 2020 | PACW | p. 9 Second Quarter Significant Items • Net earnings of $33.2 million, $0.28 EPS • Pre - provision, pre - goodwill impairment, pre - tax net revenues (“PPNR”) of $166.2 million; increase of $5.3mm from Q1 • PPNR ROAA of 2.51%; 2.39% in Q1 • Q2 includes $7.7mm of securities gains and $6.6mm of debt prepayment penalties Operating Results Key Metrics • Net interest margin of 4.20%; excluding PPP 4.25% • Loan and lease yield of 5.01%; excluding PPP 5.10% • Cost of deposits of 25bps; 59bps in Q1 • June 30th spot rate on deposits of 19bps • Efficiency ratio of 42.9%; excluding FHLB prepayment penalty would be 40.7% Loan Portfolio & Credit Quality • Loan production of $1.8bn; includes $1.2bn of PPP loans • Classified loans to total loans of 1.49% • Net charge - offs of $13.2 million; 27bps of average loans and leases down from 40bps in Q1 • Provision for credit losses of $120.0 million driven by CECL economic forecast Strong Deposit Base & Capital • Core deposits up $3.5bn in Q2; 85% of total deposits • Noninterest - bearing demand deposits at 38% of total deposits • Tangible common equity ratio of 8.93%; excluding PPP 9.36% • CET1 ratio of 9.97%

Second Quarter 2020 | PACW | p. 10 ∆ ($ in millions, except per share amounts) 2Q20 1Q20 Q / Q Total Assets 27,366$ 26,143$ 5% Loans and Leases HFI, net of deferred fees 19,695$ 19,745$ 0% Total Deposits 22,929$ 19,576$ 17% Core Deposits 19,536$ 16,051$ 22% Net Earnings (Loss) 33.2$ (1,433.1)$ 102% Earnings (Loss) Per Share 0.28$ (12.23)$ 102% Pre-Provision, Pre-Goodwill Impairment, Pre-Tax Net Revenue ("PPNR") (1) 166.2$ 160.9$ 3% Return on Average Assets 0.50% -21.27% 21.77 PPNR Return on Average Assets (1) 2.51% 2.39% 0.12 Return on Average Tangible Equity ("ROATE") (1) 6.39% 6.88% -0.49 Tangible Common Equity Ratio (1) 8.93% 9.10% -0.17 Tangible Book Value Per Share (1) 19.80$ 19.31$ 3% Tax Equivalent Net Interest Margin 4.20% 4.31% -0.11 Efficiency Ratio 42.9% 40.6% 2.3 Quarter - Over - Quarter Financial Highlights (1) See “Non - GAAP Measurements” slide on page 51.

Second Quarter 2020 | PACW | p. 11 Year - Over - Year Financial Highlights (1) See “Non - GAAP Measurements” slide on page 51. ∆ ($ in millions, except per share amounts) 2Q20 2Q19 Y / Y Total Assets 27,366$ 26,344$ 4% Loans and Leases HFI, net of deferred fees 19,695$ 18,473$ 7% Total Deposits 22,929$ 18,806$ 22% Core Deposits 19,536$ 15,617$ 25% Net Earnings 33.2$ 128.1$ -74% Earnings Per Share 0.28$ 1.07$ -74% Pre-Provision, Pre-Goodwill Impairment, Pre-Tax Net Revenue ("PPNR") (1) 166.2$ 186.4$ -11% Return on Average Assets 0.50% 1.99% -1.49 PPNR Return on Average Assets (1) 2.51% 2.89% -0.38 Return on Average Tangible Equity ("ROATE") (1) 6.39% 24.03% -17.64 Tangible Common Equity Ratio (1) 8.93% 9.50% -0.57 Tangible Book Value Per Share (1) 19.80$ 18.83$ 5% Tax Equivalent Net Interest Margin 4.20% 4.72% -0.52 Efficiency Ratio 42.9% 41.6% 1.3

Second Quarter 2020 | PACW | p. 12 Solid Capital Position – June 30, 2020 • Tier 1 leverage capital ratio increased 30bps in Q2 to 8.93%. • CET1 capital ratio increased 55bps in Q2 from 9.22% to 9.97%. • Total capital ratio increased 111bps in Q2 from 12.07% to 13.18%. (1) Excluding PPP loans from total assets given zero risk - weighting, consolidated leverage ratio would be 9.22% and bank leverage ratio would be 10.35%. PACWEST BANCORP For Capital Basel III For Adequacy Fully Well-Capitalized ($ in thousands) Balance Ratio Purposes Phased-In Classification Tier 1 leverage capital 2,270,504$ 8.93% (1) 4.00% 4.00% N/A Common equity Tier 1 capital 2,270,504$ 9.97% 4.50% 7.00% N/A Tier 1 capital 2,270,504$ 9.97% 6.00% 8.50% N/A Total capital 3,002,710$ 13.18% 8.00% 10.50% N/A PACIFIC WESTERN BANK For Capital Basel III For Adequacy Fully Well-Capitalized ($ in thousands) Balance Ratio Purposes Phased-In Classification Tier 1 leverage capital 2,544,093$ 10.03% (1) 4.00% 4.00% 5.00% Common equity Tier 1 capital 2,544,093$ 11.18% 4.50% 7.00% 6.50% Tier 1 capital 2,544,093$ 11.18% 6.00% 8.50% 8.00% Total capital 2,828,922$ 12.44% 8.00% 10.50% 10.00% Actual Actual

Second Quarter 2020 | PACW | p. 13 Loans and Leases & Credit Quality
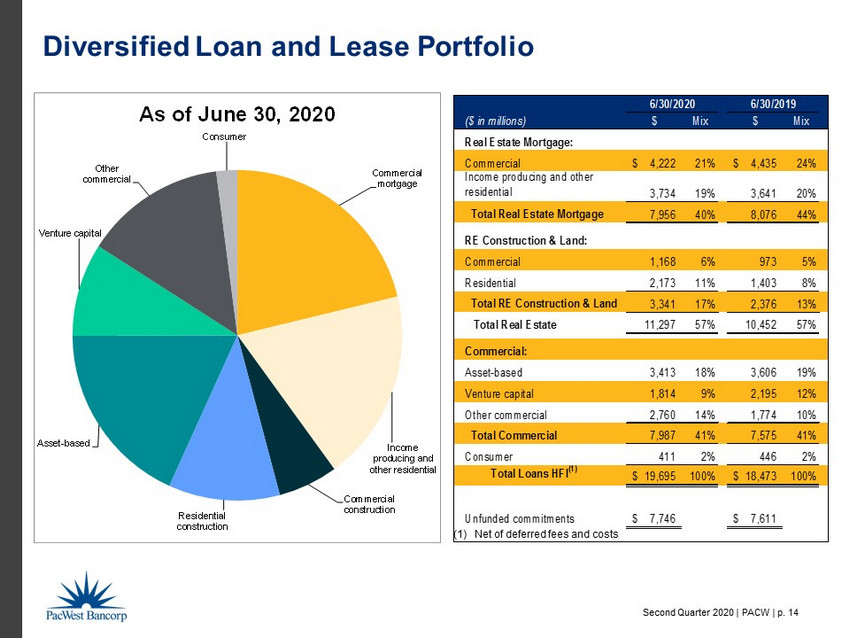
Second Quarter 2020 | PACW | p. 14 Commercial mortgage Income producing and other residential Commercial construction Residential construction Asset - based Venture capital Other commercial Consumer As of June 30, 2020 Diversified Loan and Lease Portfolio (1) Net of deferred fees and costs ($ in millions) $ Mix $ Mix Real Estate Mortgage: Commercial 4,222$ 21% 4,435$ 24% Income producing and other residential 3,734 19% 3,641 20% Total Real Estate Mortgage 7,956 40% 8,076 44% RE Construction & Land: Commercial 1,168 6% 973 5% Residential 2,173 11% 1,403 8% Total RE Construction & Land 3,341 17% 2,376 13% Total Real Estate 11,297 57% 10,452 57% Commercial: Asset-based 3,413 18% 3,606 19% Venture capital 1,814 9% 2,195 12% Other commercial 2,760 14% 1,774 10% Total Commercial 7,987 41% 7,575 41% Consumer 411 2% 446 2% Total Loans HFI (1) 19,695$ 100% 18,473$ 100% Unfunded commitments 7,746$ 7,611$ 6/30/2020 6/30/2019
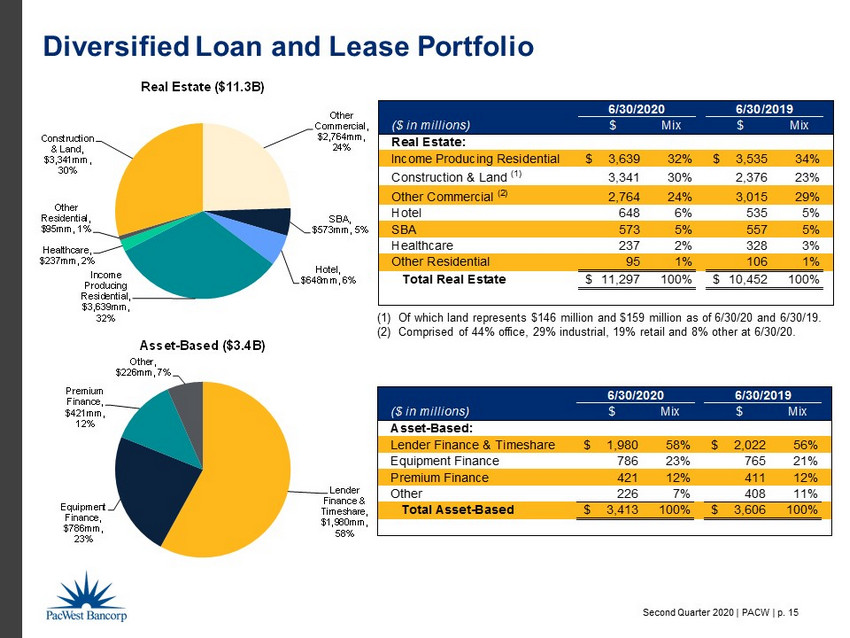
Second Quarter 2020 | PACW | p. 15 Other Commercial, $2,764mm, 24% SBA , $573mm , 5% Hotel , $648mm , 6% Income Producing Residential, $3,639mm, 32% Healthcare , $237mm , 2% Other Residential , $95mm , 1% Construction & Land , $3,341mm , 30% Real Estate ($11.3B) Lender Finance & Timeshare, $1,980mm, 58% Equipment Finance, $786mm, 23% Premium Finance, $421mm, 12% Other, $226mm, 7% Asset - Based ($3.4B) ($ in millions) $ Mix $ Mix Asset-Based: Lender Finance & Timeshare 1,980$ 58% 2,022$ 56% Equipment Finance 786 23% 765 21% Premium Finance 421 12% 411 12% Other 226 7% 408 11% Total Asset-Based 3,413$ 100% 3,606$ 100% 6/30/2020 6/30/2019 ($ in millions) $ Mix $ Mix Real Estate: Income Producing Residential 3,639$ 32% 3,535$ 34% Construction & Land (1) 3,341 30% 2,376 23% Other Commercial (2) 2,764 24% 3,015 29% Hotel 648 6% 535 5% SBA 573 5% 557 5% Healthcare 237 2% 328 3% Other Residential 95 1% 106 1% Total Real Estate 11,297$ 100% 10,452$ 100% 6/30/2020 6/30/2019 Diversified Loan and Lease Portfolio (1) Of which land represents $146 million and $159 million as of 6/30/20 and 6/30/19. (2) Comprised of 44% office, 29% industrial, 19% retail and 8% other at 6/30/20.

Second Quarter 2020 | PACW | p. 16 ($ in millions) $ Mix $ Mix Other Commercial: Paycheck Protection Program 1,211$ 44% -$ - Secured Business Loans 502 18% 557 31% Security Monitoring 499 18% 630 36% Unsecured Business Loans 213 8% 220 12% Municipal 154 6% 126 7% SBA 73 3% 85 5% HOA Loans 71 2% 68 4% Cash Flow 37 1% 88 5% Total Other Commercial 2,760$ 100% 1,774$ 100% 6/30/2020 6/30/2019 Secured Business Loans , $502mm , 18% Municipal , $154mm , 6% Cash Flow , $37mm , 1% SBA , $73mm , 3% Security Monitoring , $499mm , 18% HOA Loans , $71mm , 2% Unsecured Business Loans , $213mm , 8% Paycheck Protection Program , $1,211mm , 44% Other Commercial ($2.8B) Equity Fund Loans, $740mm, 41% Expansion Stage, $738mm, 41% Early Stage, $212mm, 11% Late Stage, $124mm, 7% Venture Capital ($1.8B) ($ in millions) $ Mix $ Mix Venture Capital: Equity Fund Loans 740$ 41% 1,116$ 51% Expansion Stage 738 41% 785 36% Early Stage 212 11% 221 10% Late Stage 124 7% 73 3% Total Venture Capital 1,814$ 100% 2,195$ 100% 6/30/2020 6/30/2019 Diversified Loan and Lease Portfolio

Second Quarter 2020 | PACW | p. 17 $1,436 $1,231 $1,021 $790 $546 $1,294 $1,288 $1,318 $1,997 $800 $1,257 $1,529 $1,391 $816 $813 $613 $980 $838 $1,407 $1,054 $2,022 $2,730 $2,519 $2,339 $2,787 $2,603 $2,509 $2,229 $2,223 $1,867 $2,635 0.0% 1.0% 2.0% 3.0% 4.0% 5.0% 6.0% $0 $500 $1,000 $1,500 $2,000 $2,500 $3,000 2Q19 3Q19 4Q19 1Q20 2Q20 Avg. Rate on Production Millions Production Disbursements PPP Loans Payoffs Paydowns Rate on Production ($ in millions) Production/ Disbursements Payoffs/ Paydowns Net Difference Rate on Production (1) ($ in millions) Loans Beginning Balance (2) Loans Ending Balance (2) Quarterly Change (3) 2Q20 2,603$ 2,635$ (32)$ 2.33% 2Q20 19,745$ 19,695$ (50)$ 1Q20 2,787 1,867 920 4.31% 1Q20 18,847 19,745 898 4Q19 2,339 2,223 116 4.73% 4Q19 18,736 18,847 111 3Q19 2,519 2,229 290 5.28% 3Q19 18,473 18,736 263 2Q19 2,730 2,509 221 5.15% 2Q19 18,308 18,473 165 Loan and Lease Production of $1.8 Billion in 2Q20 (1) The weighted average TE rate on production presents contractual rates and does not include amortized fees. Amortized fees add ed approximately 21 basis points to loan yields in 2020 and 22 basis points in 2019. (2) Net of deferred fees and costs (3) “Quarterly Change” equals “Net Difference” plus transfers to loans held for sale, transfers to OREO, charge - offs and loan sales. (4) Disbursements in 1Q20 of $2.0bn were larger than usual as borrowers drew on lines for liquidity preservation during pandemic cri sis. Segments with largest disbursements were venture capital, lender finance and business loans. (4)

Second Quarter 2020 | PACW | p. 18 Multi - Family Apts, 53% Condominiums , 6% Hotel , 14% Office, 7% Land , 3% Retail , 3% Mixed - Use, 4% Industrial, SFR & Other, 10% Commitments by Property Type Construction & Land Loans Nevada , 3% Other, 12% Florida, 6% Wash. DC, 5% New York, 11% Virginia , 3% N. Carolina , 3% California , 57% Portfolio by State Commitment Amount Count 6/30/20 Tota l 6/30/20 % of Tota l $0 ~ $10mm 166 $ 510mm 8% $10mm ~ $25mm 67 1,002mm 17% $25mm ~ $50mm 52 1,990mm 33% $50mm ~ $100mm 21 1,446mm 24% $100mm ~ $150mm 9 1,104mm 18% Total 315 $ 6,052mm LTC < 40 %, 5% LTC 40% - 50%, 11% LTC 50% - 60%, 37% LTC 60% - 70%, 31% LTC > 70%, 16% Commitments By Loan - To - Cost Range Risk Rating Count 6/30/20 Tota l Pass/Watch 313 $ 3,328mm Special Mention 1 12mm Classified 1 0.3mm Total 315 $ 3,341mm

Second Quarter 2020 | PACW | p. 19 California, 63% Washington DC , 6% Florida , 9% Washington , 4% Virginia , 6% N. Carolina , 4% Others , 8% $1.6bn (1) MF Construction Portfolio Multi - Family Loans Principal Balance Amount Count 6/30/20 Tota l 6/30/20 % of Tota l < $1mm 500 $ 211mm 6% $1mm ~ $5mm 621 1,482mm 41% $5mm ~ $10mm 161 1,097mm 30% $10mm ~ $25mm 43 612mm 17% $25mm ~ $106mm 3 237mm 6% Total 1,328 $ 3,639mm California, 71% Washington , 7% Florida , 6% Oregon , 4% New York , 3% Colorado , 3% Others , 6% $3.6bn (2) Income Producing Residential Portfolio Income Producing Residential (1) MF construction commitments total $3.4bn and have a weighted average loan - to - cost ratio of 60% as of June 30, 2020. (2) $1.9bn , or approximately 52%, of MF portfolio is 50% risk - weighted. LTC 40% - 50%, 10% LTC 50% - 60 %, 45% LTC 60% - 70 %, 27% LTC > 70 %, 18% Commitments By Loan - To - Cost Range Risk Rating Count 6/30/20 Tota l Pass/Watch 1,320 $ 3,632mm Special Mention 2 4mm Classified 6 3mm Total 1,328 $ 3,639mm

Second Quarter 2020 | PACW | p. 20 Residential 52% Commercial 45% Personal Emergency Response Systems 3% Portfolio by Revenue Source (1) Security Monitoring Loans ▪ A lending product since 2003, however, new technology is disrupting the security alarm business, causing increased customer acquisition costs and customer attrition and, thereby, adversely impacting business models and valuations ▪ Portfolio balance has declined $120mm in 2020 ; heightened monitoring of our credit risk for this portfolio in 2Q19; discontinued new originations in October 2019 ▪ $ 222mm or 44% of the portfolio are SNCs ▪ 4.78% WAC; 100% variable rate; WAM 23 months ▪ $ 122mm of unfunded commitments; subject to an availability formula based upon eligible recurring monthly revenue ▪ Downgraded three loans totaling $119.2 million to classified in 2Q20 ▪ COVID m odifications as of 6/30/20 - none Risk Rating Count 6/30/20 Tota l Pass/Watch 20 $ 287mm Special Mention 4 72mm Classified 6 140mm Total 30 $ 499mm Balance by Tranche Count 6/30/20 Tota l < $5mm 8 $ 20mm $5mm ~ $10mm 9 71mm $10mm ~ $20mm 2 28mm $20mm ~ $30mm 2 49mm $30mm ~ $40mm 7 235mm $40mm ~ $55mm 2 96mm Total 30 $ 499mm (1) Revenue allocated based upon the borrowers’ customer mix. $87mm $111mm $157mm $144mm 2020 2021 2022 2023-24 Contractual Maturity Table

Second Quarter 2020 | PACW | p. 21 ▪ Hotel industry significantly impacted by the pandemic and widespread travel restrictions. We are maintaining contact with borrowers and monitoring flash reports to assess impacts. ▪ No “conference center” hotels. ▪ Hotel construction borrowers are sophisticated sponsors with significant invested equity and resources. ▪ Majority of CRE and construction borrowers are experienced hotel operators with top franchise brands. ▪ Some hotel construction borrowers have seen delays in materials or labor shortages as a result of COVID - 19. ▪ Average loan - to - cost for hotel construction loans is 46%. ▪ SBA guarantied portions retained (75% average guaranty). ▪ $293.4mm CRE and $10.6mm construction downgraded to special mention in 1Q20. ▪ Indirect exposure from timeshare inventory loans ($24mm), hotel - related lender finance loans ($43mm) and venture banking loans ($9mm). ▪ COVID modifications as of 6/30/20 – 33 loans totaling $459mm. Hotel Portfolio Overview CA, $520mm Other, $31mm NJ, $23mm TN , $ 55mm NV , $64mm GA , $ 22mm FL, $133mm NY, $ 295mm Hotel by State $1.1bn (5.8% of total loans) Upper Upscale, $315mm, 49% Midscale, $48mm, 8% Upscale, $148mm, 23% Upper Midscale, $119mm, 18% Economy, $18mm, 2% Hotel CRE by Brands Count 6/30/20 Commitment 6/30/20 Outstanding Avg. O/S Balance Hotel CRE 48 $ 701mm $ 648mm $ 13.5mm Hotel Construction 18 839mm 464mm 25.8mm Hotel SBA 58 35mm 31mm 0.5mm Total 124 $ 1,575mm $ 1,143mm $ 9.2mm Hotels by Product Risk Rating Count 6/30/20 Tota l Pass/Watch 67 $ 836mm Special Mention 47 305mm Classified 10 2mm Total 124 $ 1,143mm

Second Quarter 2020 | PACW | p. 22 Urban luxury center 10% Lifestyle center 33% Suburban retail/strip center 26% Single Tenant 31% CRE Retail Property Types $466mm (2.4% of total loans) Loan Types • Construction - significant projects include: ▪ A lifestyle center in Studio City, CA ▪ A community shopping center in Encinitas, CA ▪ A grocery - anchored community shopping center in Cary, NC ▪ High traffic retail infill on San Vicente Blvd. in Los Angeles ▪ COVID modifications as of 6/30/20 – 2 loans totaling $42mm • Owner - Occupied ▪ Not adversely affected by rental market volatility ▪ SBA retail is 100% owner - occupied o SBA guarantied portions retained (75% average guaranty ) o COVID modifications as of 6/30/20 – 5 loans totaling $2mm • CRE ▪ Traditional retail - focused commercial real estate lending including: o National Lending $52mm portfolio mostly consists of two lifestyle centers (NJ & IN) totaling $42mm which were downgraded from special mention to classified in 2Q20 o Community Banking $414mm portfolio almost entirely in California focused on suburban retail/strip centers and single tenant retail storefronts o COVID modifications as of 6/30/20 – 18 loans totaling $198mm (1) $43 million in classified loans at June 30, 2020 (up from $5.1 million at March 31, 2020) with related SBA guaranties totaling $ 0.2 million . $42mm downgraded from special mention to classified in 2Q20. Retail Real Estate Portfolio Overview Risk Rating Count 6/30/20 Tota l Pass/Watch 226 $ 580mm Special Mention 5 2mm Classified 14 43mm Total 245 $ 625mm Count Net Commitment Recorded Investment Avg. O/S Balance Retail CRE 153 $ 513mm $ 466mm $ 3.0mm Coml. Construction 7 157mm 102mm 14.6mm Retail SBA 85 58mm 57mm 0.7mm Total 245 $ 728mm $ 625mm $ 2.6mm Retail by Product

Second Quarter 2020 | PACW | p. 23 ▪ Credits are to well - known U.S - based airlines (41%), foreign - based airlines (34%) and freight carriers (25%). ▪ Passenger transportation exposure is mostly narrow - body jets which have historically performed well in maintaining collateral value. ▪ One credit for $13.3 million more exposed to COVID - 19 as borrower is a tour operator with airline and cruise line. ▪ No classified or nonaccrual aviation loans at June 30, 2020. ▪ $119 million downgraded to special mention in 1Q20 and additional $38 million in 2Q20. ▪ COVID modifications as of 6/30/20 – 2 loans totaling $18mm. Commercial Aviation Portfolio Overview Passenger, $ 223mm , 75% Freight , $74mm, 25% Aviation by Type, $297mm (1.5% of total loans) Count 6/30/20 Commitment 6/30/20 Outstanding Avg. O/S Balance Equipment Finance 39 $ 284mm $ 281mm $ 7.2mm Operating leases 3 16mm 16mm 5.3mm Total 42 $ 300mm $ 297mm $ 7.1mm Aviation by Product Risk Rating Count 6/30/20 Tota l Pass/Watch 22 $ 147mm Special Mention 20 150mm Classified - - Total 42 $ 297mm

Second Quarter 2020 | PACW | p. 24 Other Impacted Portfolios Count Net Commitment Recorded Investment Avg. O/S Balance Operating Leases 5 $ 63.9mm $ 63.9mm $ 12.8mm Equipment Finance 7 71.1mm 54.4mm 7.8mm Asset - Based 6 20.0mm 5.6mm 0.9mm Venture Capital 2 2.5mm 1.0mm 0.5mm Total 20 $ 157.5mm $ 124.9mm $ 6.2mm Oil Services by Product Restaurant ▪ $ 161 million total exposure (0.8% of total loans and operating leases) of which $ 93 million is real estate secured. ▪ $ 92 million are SBA guaranteed (75% average guaranty as we don’t sell the guaranteed portions ). ▪ $ 11.5 million of classified loans at June 30, 2020 (estimated SBA guaranties of $8.5 million ). ▪ COVID modifications as of 6/30/20 – 27 loans totaling $38mm. Oil Services ▪ $125 million total exposure (0.6% of total loans and operating leases) ▪ $61 million loans receivable ▪ $64 million operating leases ▪ All credits are related to support services and $119.3 million is collateralized by equipment (railcars $63.9mm, land - based fracking equipment $28.0mm, offshore vessels $27.4mm) and $5.6 million is ABL lines collateralized by A/R and inventory. ▪ $63 million to borrowers rated BB - or above. ▪ $118 million, or 94%, outstanding to six borrowers with average balance of $19.7 million. ▪ One loan of $15.3 million classified and nonaccrual since 1Q’15. ▪ COVID modifications as of 6/30/20 – none. Count Net Commitment Recorded Investment Avg. O/S Balance SBA – Real Estate 65 $ 64.0mm $ 61.3mm $ 0.9mm SBA – Cash Flow 64 38.0mm 37.6mm 0.6mm Commercial Real Estate 35 33.8mm 31.4mm 0.9mm Collateralized Commercial Loans 20 27.1mm 26.0mm 1.3mm Unsecured Business Loans 69 14.3mm 4.7mm 0.1mm Venture Capital 4 14.1mm - - Total 257 $ 191.3mm $ 161.0mm $ 0.6mm Restaurant by Product
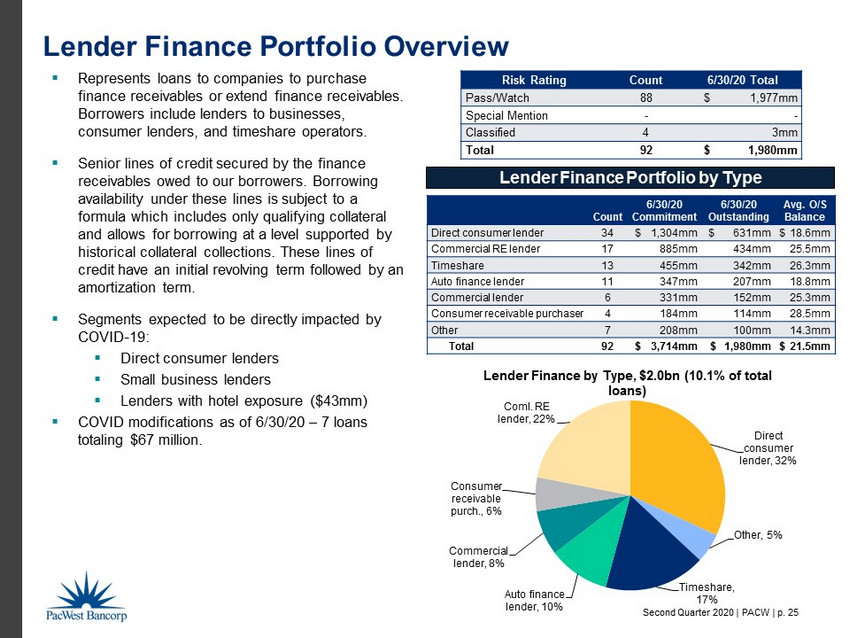
Second Quarter 2020 | PACW | p. 25 ▪ Represents loans to companies to purchase finance receivables or extend finance receivables. Borrowers include lenders to businesses, consumer lenders, and timeshare operators. ▪ Senior lines of credit secured by the finance receivables owed to our borrowers. Borrowing availability under these lines is subject to a formula which includes only qualifying collateral and allows for borrowing at a level supported by historical collateral collections. These lines of credit have an initial revolving term followed by an amortization term. ▪ Segments expected to be directly impacted by COVID - 19: ▪ Direct consumer lenders ▪ Small business lenders ▪ Lenders with hotel exposure ($43mm) ▪ COVID modifications as of 6/30/20 – 7 loans totaling $67 million. Lender Finance Portfolio Overview Direct consumer lender , 32% Other , 5% Timeshare, 17% Auto finance lender , 10% Commercial lender , 8% Consumer receivable purch. , 6% Coml. RE lender , 22% Lender Finance by Type, $2.0bn (10.1% of total loans) Count 6/30/20 Commitment 6/30/20 Outstanding Avg. O/S Balance Direct consumer lender 34 $ 1,304mm $ 631mm $ 18.6mm Commercial RE lender 17 885mm 434mm 25.5mm Timeshare 13 455mm 342mm 26.3mm Auto finance lender 11 347mm 207mm 18.8mm Commercial lender 6 331mm 152mm 25.3mm Consumer receivable purchaser 4 184mm 114mm 28.5mm Other 7 208mm 100mm 14.3mm Total 92 $ 3,714mm $ 1,980mm $ 21.5mm Lender Finance Portfolio by Type Risk Rating Count 6/30/20 Tota l Pass/Watch 88 $ 1,977mm Special Mention - - Classified 4 3mm Total 92 $ 1,980mm

Second Quarter 2020 | PACW | p. 26 CA 55% NY 7% TX 7% PA 5% NJ 3% FL 4% Other 19% Office by State $1,575mm (8.0% of total loans) Office Portfolio Overview Risk Rating Count 6/30/20 Tota l Pass/Watch 316 $ 1,566mm Special Mention 6 6mm Classified 7 3mm Total 329 $ 1,575mm Office by Product Count Net Commitment Recorded Investment Avg. O/S Balance Office CRE 214 $ 1,375mm $ 1,206mm $ 5.6mm Commercial Construction 12 440mm 259mm 21.6mm Office SBA 103 111mm 110mm 1.1mm Total 329 $ 1,926mm $ 1,575mm $ 4.8mm ▪ Disciplined underwriting based on the lesser of actual or market rents and market vacancy, not projections or positive market trends. ▪ $104 million of CRE and all $110 million of SBA are owner - occupied. ▪ Average loan - to - cost for office construction loans is 58%. ▪ COVID modifications as of 6/30/20 – 24 loans totaling $289 million. $0~$5mm , $200mm , 17% $5mm~$15mm , $201mm , 17% $15mm~$25mm , $174mm , 14% $25mm~$45mm , $214mm , 18% $45mm~$60mm , $267mm , 22% $60mm+ , $150mm , 12% CRE By Balance Range $60mm+ , $150mm , 34% $0~$5mm , $4mm , 1% $5mm~$15mm , $33mm , 8% $15mm~$25mm , $15mm , 3% $25mm~$45mm , $138mm , 31% $45mm~$60mm , $100mm , 23% Construction by Commitment Range
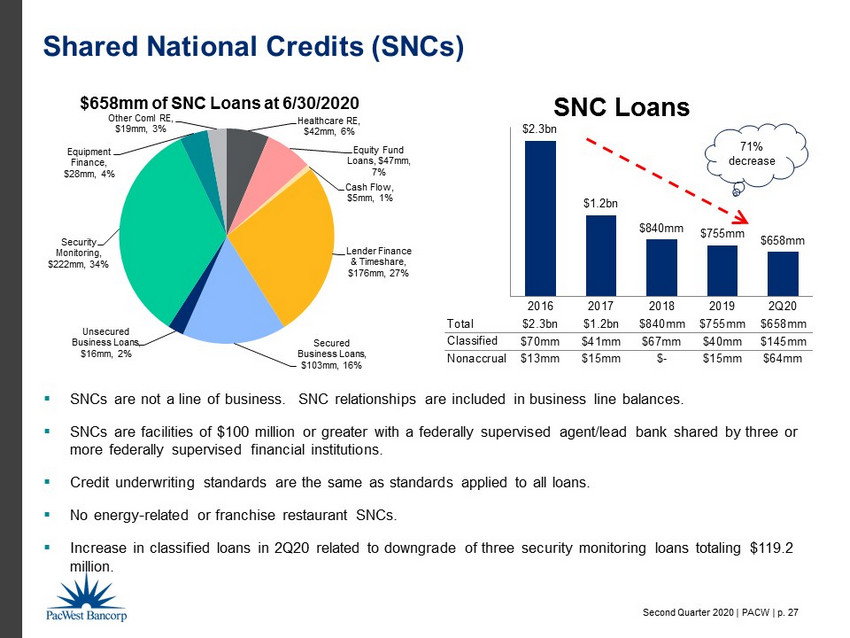
Second Quarter 2020 | PACW | p. 27 Shared National Credits (SNCs) $2.3bn $1.2bn $840mm $755mm $658mm 2016 2017 2018 2019 2Q20 Total $2.3bn $1.2bn $840mm $755mm $658mm Classified $70mm $41mm $67mm $40mm $145mm Nonaccrual $13mm $15mm $- $15mm $64mm SNC Loans Healthcare RE , $42mm , 6% Equity Fund Loans , $47mm , 7% Cash Flow , $5mm , 1% Lender Finance & Timeshare , $176mm , 27% Secured Business Loans , $103mm , 16% Unsecured Business Loans , $16mm , 2% Security Monitoring , $222mm , 34% Equipment Finance , $28mm , 4% Other Coml RE , $19mm , 3% $658mm of SNC Loans at 6/30/2020 ▪ SNCs are not a line of business. SNC relationships are included in business line balances. ▪ SNCs are facilities of $100 million or greater with a federally supervised agent/lead bank shared by three or more federally supervised financial institutions. ▪ Credit underwriting standards are the same as standards applied to all loans. ▪ No energy - related or franchise restaurant SNCs . ▪ Increase in classified loans in 2Q20 related to downgrade of three security monitoring loans totaling $119.2 million. 71% decrease
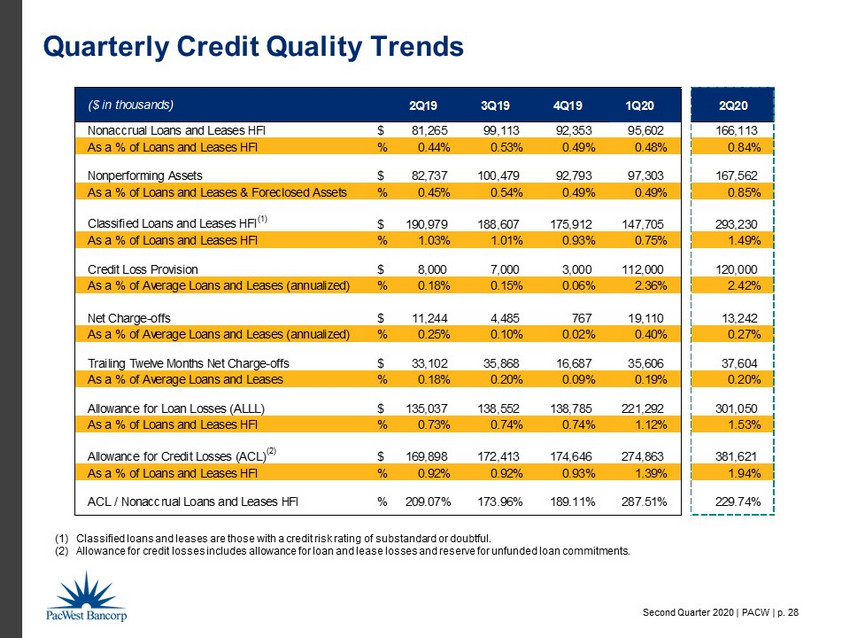
Second Quarter 2020 | PACW | p. 28 Quarterly Credit Quality Trends (1) Classified loans and leases are those with a credit risk rating of substandard or doubtful. (2) Allowance for credit losses includes allowance for loan and lease losses and reserve for unfunded loan commitments. ($ in thousands) 2Q19 3Q19 4Q19 1Q20 2Q20 Nonaccrual Loans and Leases HFI $ 81,265 99,113 92,353 95,602 166,113 As a % of Loans and Leases HFI % 0.44% 0.53% 0.49% 0.48% 0.84% Nonperforming Assets $ 82,737 100,479 92,793 97,303 167,562 As a % of Loans and Leases & Foreclosed Assets % 0.45% 0.54% 0.49% 0.49% 0.85% Classified Loans and Leases HFI (1) $ 190,979 188,607 175,912 147,705 293,230 As a % of Loans and Leases HFI % 1.03% 1.01% 0.93% 0.75% 1.49% Credit Loss Provision $ 8,000 7,000 3,000 112,000 120,000 As a % of Average Loans and Leases (annualized) % 0.18% 0.15% 0.06% 2.36% 2.42% Net Charge-offs $ 11,244 4,485 767 19,110 13,242 As a % of Average Loans and Leases (annualized) % 0.25% 0.10% 0.02% 0.40% 0.27% Trailing Twelve Months Net Charge-offs $ 33,102 35,868 16,687 35,606 37,604 As a % of Average Loans and Leases % 0.18% 0.20% 0.09% 0.19% 0.20% Allowance for Loan Losses (ALLL) $ 135,037 138,552 138,785 221,292 301,050 As a % of Loans and Leases HFI % 0.73% 0.74% 0.74% 1.12% 1.53% Allowance for Credit Losses (ACL) (2) $ 169,898 172,413 174,646 274,863 381,621 As a % of Loans and Leases HFI % 0.92% 0.92% 0.93% 1.39% 1.94% ACL / Nonaccrual Loans and Leases HFI % 209.07% 173.96% 189.11% 287.51% 229.74%

Second Quarter 2020 | PACW | p. 29 0.18% 0.20% 0.09% 0.19% 0.20% 2Q19 3Q19 4Q19 1Q20 2Q20 Trailing Twelve Months Net Charge - offs / Average Loans and Leases Key Credit Trends – Loans HFI 0.44% 0.53% 0.49% 0.48% 0.84% 2Q19 3Q19 4Q19 1Q20 2Q20 Nonaccrual Loans and Leases / Loans and Leases 0.92% 0.92% 0.93% 1.39% 1.94% 2Q19 3Q19 4Q19 1Q20 2Q20 ACL / Loans and Leases 1.03% 1.01% 0.93% 0.75% 1.49% 2Q19 3Q19 4Q19 1Q20 2Q20 Classified Loans and Leases/ Loans and Leases
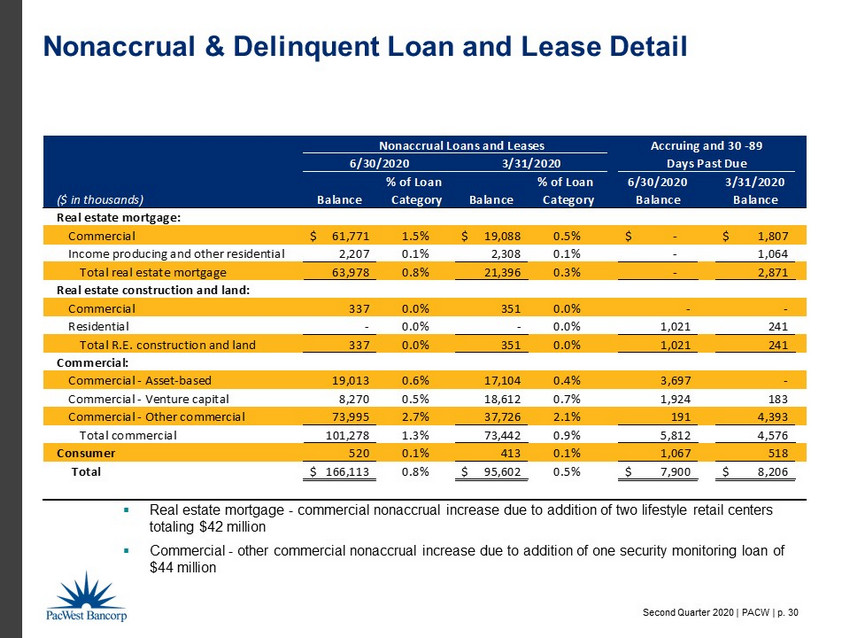
Second Quarter 2020 | PACW | p. 30 % of Loan % of Loan 6/30/2020 3/31/2020 ($ in thousands) Balance Category Balance Category Balance Balance Real estate mortgage: Commercial 61,771$ 1.5% 19,088$ 0.5% -$ 1,807$ Income producing and other residential 2,207 0.1% 2,308 0.1% - 1,064 Total real estate mortgage 63,978 0.8% 21,396 0.3% - 2,871 Real estate construction and land: Commercial 337 0.0% 351 0.0% - - Residential - 0.0% - 0.0% 1,021 241 Total R.E. construction and land 337 0.0% 351 0.0% 1,021 241 Commercial: Commercial - Asset-based 19,013 0.6% 17,104 0.4% 3,697 - Commercial - Venture capital 8,270 0.5% 18,612 0.7% 1,924 183 Commercial - Other commercial 73,995 2.7% 37,726 2.1% 191 4,393 Total commercial 101,278 1.3% 73,442 0.9% 5,812 4,576 Consumer 520 0.1% 413 0.1% 1,067 518 Total 166,113$ 0.8% 95,602$ 0.5% 7,900$ 8,206$ 6/30/2020 Nonaccrual Loans and Leases 3/31/2020 Accruing and 30 -89 Days Past Due Nonaccrual & Delinquent Loan and Lease Detail ▪ Real estate mortgage - commercial nonaccrual increase due to addition of two lifestyle retail centers totaling $42 million ▪ Commercial - other commercial nonaccrual increase due to addition of one security monitoring loan of $44 million

Second Quarter 2020 | PACW | p. 31 ($ in thousands) Classified Special Mention Pass/Watch Total Classified Special Mention Pass/Watch Total Real estate mortgage: Commercial real estate 71,446$ 322,312$ 3,828,317$ 4,222,075$ 33,908$ 371,687$ 3,815,074$ 4,220,649$ Residential real estate 6,941 6,151 3,720,568 3,733,659 7,083 2,491 3,778,721 3,788,295 Total real estate mortgage 78,387 328,462 7,548,885 7,955,734 40,991 374,158 7,593,795 8,008,944 Real estate construction: Commercial construction 337 12,354 1,154,918 1,167,609 351 10,577 1,076,577 1,087,505 Residential construction - - 2,172,919 2,172,919 - - 1,792,748 1,792,748 Total real estate construction 337 12,354 3,327,837 3,340,528 351 10,577 2,869,325 2,880,253 Commercial: Asset based 25,008 186,813 3,200,610 3,412,431 23,218 152,137 3,763,047 3,938,402 Venture capital 29,054 138,403 1,646,884 1,814,341 31,110 173,947 2,510,780 2,715,837 Other commercial 159,813 82,313 2,518,152 2,760,278 51,498 186,368 1,534,119 1,771,985 Total commercial 213,876 407,529 7,365,646 7,987,050 105,826 512,452 7,807,946 8,426,224 Consumer 630 18,053 392,636 411,318 537 1,471 427,876 429,884 Total loans and leases 293,230$ 766,397$ 18,635,004$ 19,694,631$ 147,705$ 898,658$ 18,698,942$ 19,745,305$ June 30, 2020 March 31, 2020 Loan Portfolio By Risk Rating ▪ Loan downgrades in Q2 were substantially all from special mention to classified. ▪ Real estate mortgage - commercial classified increase due to two lifestyle retail centers totaling $42mm downgraded from special mention ▪ Commercial - other commercial classified increase due to three security monitoring loans totaling $119.2 million downgraded from special mention to classified ▪ Consumer special mention increase due to downgrades of student loans
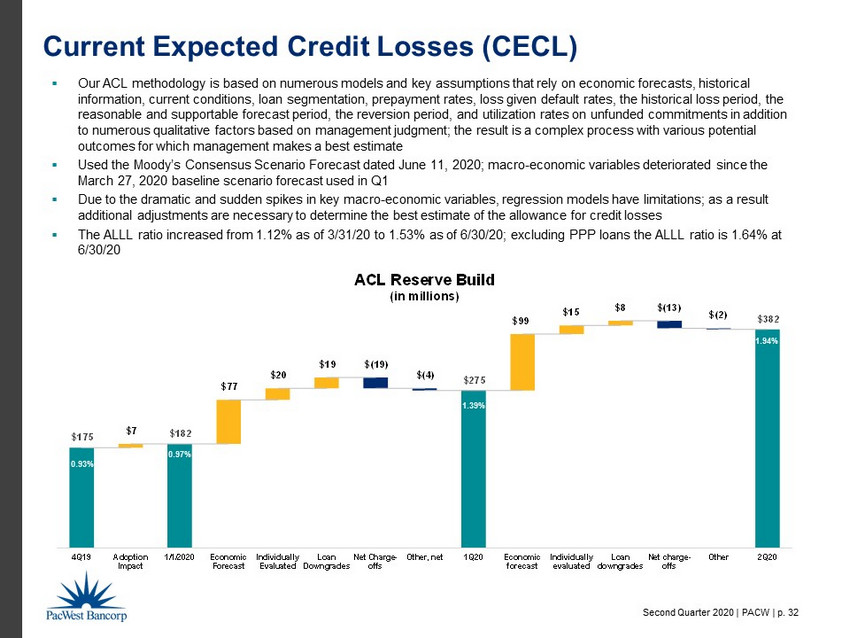
Second Quarter 2020 | PACW | p. 32 $175 $182 $275 $382 $7 $77 $20 $19 $(19) $(4) $99 $15 $8 $(13) $(2) 4Q19 Adoption Impact 1/1/2020 Economic Forecast Individually Evaluated Loan Downgrades Net Charge- offs Other, net 1Q20 Economic forecast Individually evaluated Loan downgrades Net charge- offs Other 2Q20 ACL Reserve Build (in millions) Current Expected Credit Losses (CECL) ▪ Our ACL methodology is based on numerous models and key assumptions that rely on economic forecasts, historical information, current conditions, loan segmentation, prepayment rates, loss given default rates, the historical loss period, t he reasonable and supportable forecast period, the reversion period, and utilization rates on unfunded commitments in addition to numerous qualitative factors based on management judgment; the result is a complex process with various potential outcomes for which management makes a best estimate ▪ Used the Moody’s Consensus Scenario Forecast dated June 11, 2020; macro - economic variables deteriorated since the March 27, 2020 baseline scenario forecast used in Q1 ▪ Due to the dramatic and sudden spikes in key macro - economic variables, regression models have limitations; as a result additional adjustments are necessary to determine the best estimate of the allowance for credit losses ▪ The ALLL ratio increased from 1.12% as of 3/31/20 to 1.53% as of 6/30/20; excluding PPP loans the ALLL ratio is 1.64% at 6/30/20 0.93% 0.97% 1.39% 1.94 %
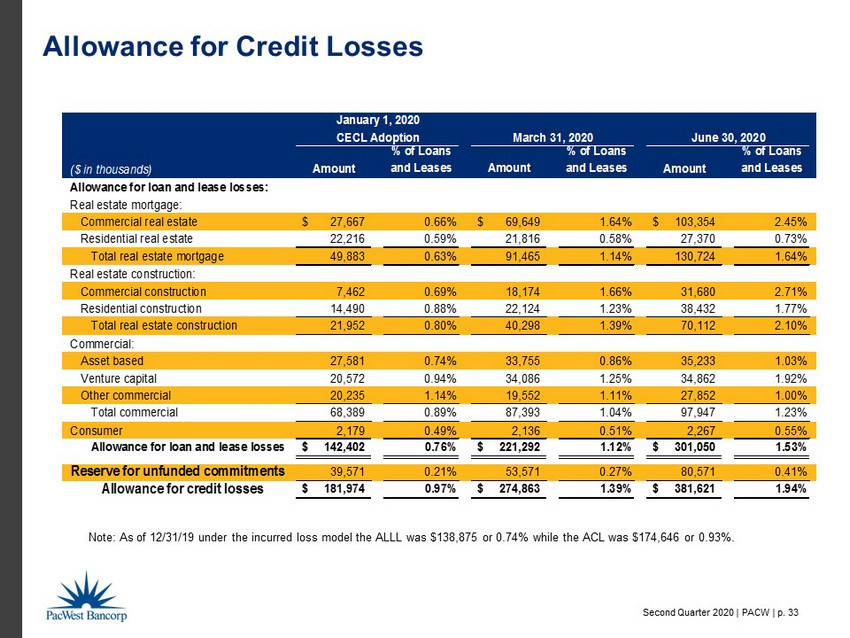
Second Quarter 2020 | PACW | p. 33 Allowance for Credit Losses Note: As of 12/31/19 under the incurred loss model the ALLL was $138,875 or 0.74% while the ACL was $174,646 or 0.93%. ($ in thousands) Amount % of Loans and Leases Amount % of Loans and Leases Amount % of Loans and Leases Allowance for loan and lease losses: Real estate mortgage: Commercial real estate 27,667$ 0.66% 69,649$ 1.64% 103,354$ 2.45% Residential real estate 22,216 0.59% 21,816 0.58% 27,370 0.73% Total real estate mortgage 49,883 0.63% 91,465 1.14% 130,724 1.64% Real estate construction: Commercial construction 7,462 0.69% 18,174 1.66% 31,680 2.71% Residential construction 14,490 0.88% 22,124 1.23% 38,432 1.77% Total real estate construction 21,952 0.80% 40,298 1.39% 70,112 2.10% Commercial: Asset based 27,581 0.74% 33,755 0.86% 35,233 1.03% Venture capital 20,572 0.94% 34,086 1.25% 34,862 1.92% Other commercial 20,235 1.14% 19,552 1.11% 27,852 1.00% Total commercial 68,389 0.89% 87,393 1.04% 97,947 1.23% Consumer 2,179 0.49% 2,136 0.51% 2,267 0.55% Allowance for loan and lease losses 142,402$ 0.76% 221,292$ 1.12% 301,050$ 1.53% Reserve for unfunded commitments 39,571 0.21% 53,571 0.27% 80,571 0.41% Allowance for credit losses 181,974$ 0.97% 274,863$ 1.39% 381,621$ 1.94% CECL Adoption January 1, 2020 March 31, 2020 June 30, 2020

Second Quarter 2020 | PACW | p. 34 Deposits
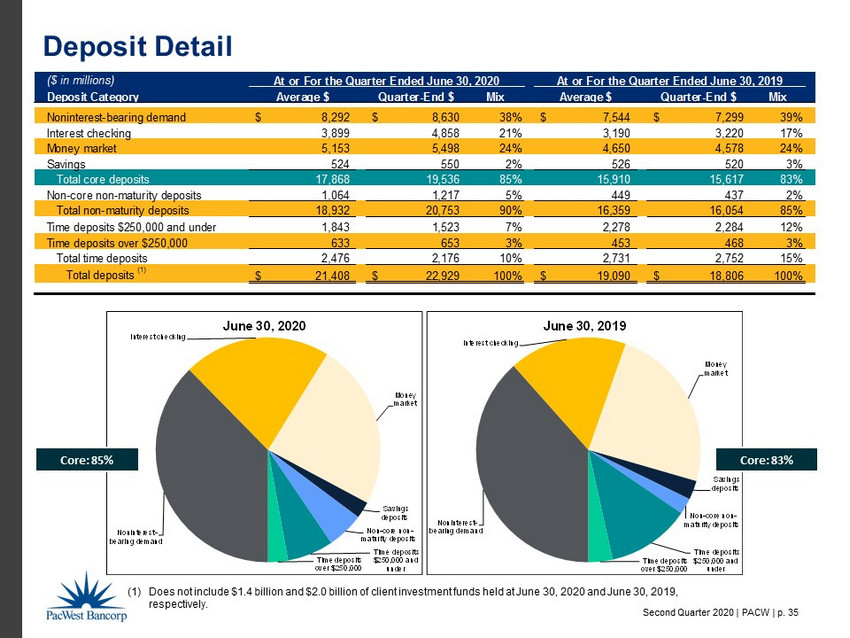
Second Quarter 2020 | PACW | p. 35 Noninterest - bearing demand Interest checking Money market Savings deposits Non - core non - maturity deposits Time deposits $250,000 and under Time deposits over $250,000 June 30, 2020 Noninterest - bearing demand Interest checking Money market Savings deposits Non - core non - maturity deposits Time deposits $250,000 and under Time deposits over $250,000 June 30, 2019 ($ in millions) Deposit Category Average $ Quarter-End $ Mix Average $ Quarter-End $ Mix Noninterest-bearing demand 8,292$ 8,630$ 38% 7,544$ 7,299$ 39% Interest checking 3,899 4,858 21% 3,190 3,220 17% Money market 5,153 5,498 24% 4,650 4,578 24% Savings 524 550 2% 526 520 3% Total core deposits 17,868 19,536 85% 15,910 15,617 83% Non-core non-maturity deposits 1,064 1,217 5% 449 437 2% Total non-maturity deposits 18,932 20,753 90% 16,359 16,054 85% Time deposits $250,000 and under 1,843 1,523 7% 2,278 2,284 12% Time deposits over $250,000 633 653 3% 453 468 3% Total time deposits 2,476 2,176 10% 2,731 2,752 15% Total deposits (1) 21,408$ 22,929$ 100% 19,090$ 18,806$ 100% At or For the Quarter Ended June 30, 2020 At or For the Quarter Ended June 30, 2019 Deposit Detail (1) Does not include $1.4 billion and $2.0 billion of client investment funds held at June 30, 2020 and June 30, 2019, respectively. Core: 85% Core: 83%
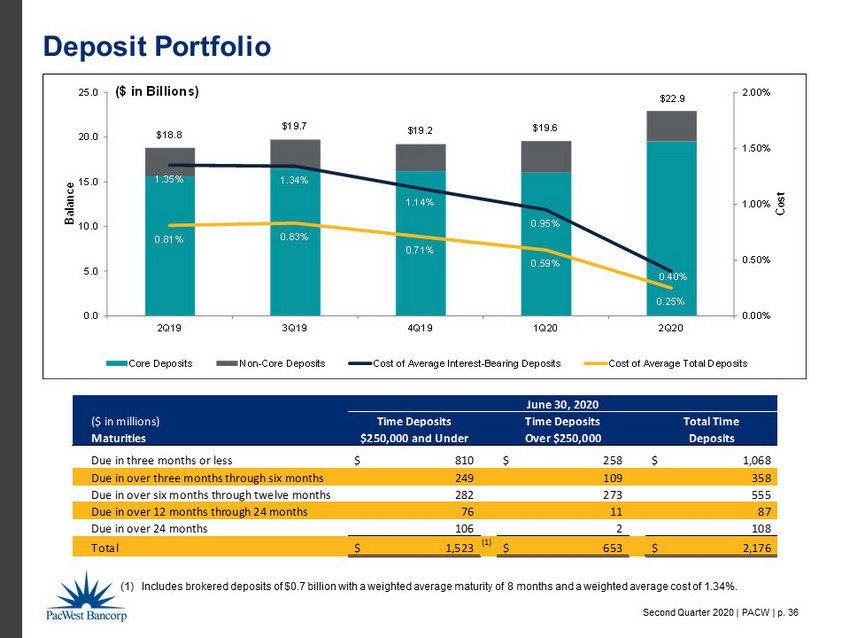
Second Quarter 2020 | PACW | p. 36 ($ in millions) Time Deposits Time Deposits Total Time Maturities $250,000 and Under Over $250,000 Deposits Due in three months or less 810$ 258$ 1,068$ Due in over three months through six months 249 109 358 Due in over six months through twelve months 282 273 555 Due in over 12 months through 24 months 76 11 87 Due in over 24 months 106 2 108 Total 1,523$ (1) 653$ 2,176$ June 30, 2020 $18.8 $19.7 $19.2 $19.6 $22.9 1.35% 1.34% 1.14% 0.95% 0.40% 0.81% 0.83% 0.71% 0.59% 0.25% 0.00% 0.50% 1.00% 1.50% 2.00% 0.0 5.0 10.0 15.0 20.0 25.0 2Q19 3Q19 4Q19 1Q20 2Q20 Cost Balance ($ in Billions) Core Deposits Non-Core Deposits Cost of Average Interest-Bearing Deposits Cost of Average Total Deposits Deposit Portfolio (1) Includes brokered deposits of $0.7 billion with a weighted average maturity of 8 months and a weighted average cost of 1.34%.
Second Quarter 2020 | PACW | p. 37 Net Interest Margin
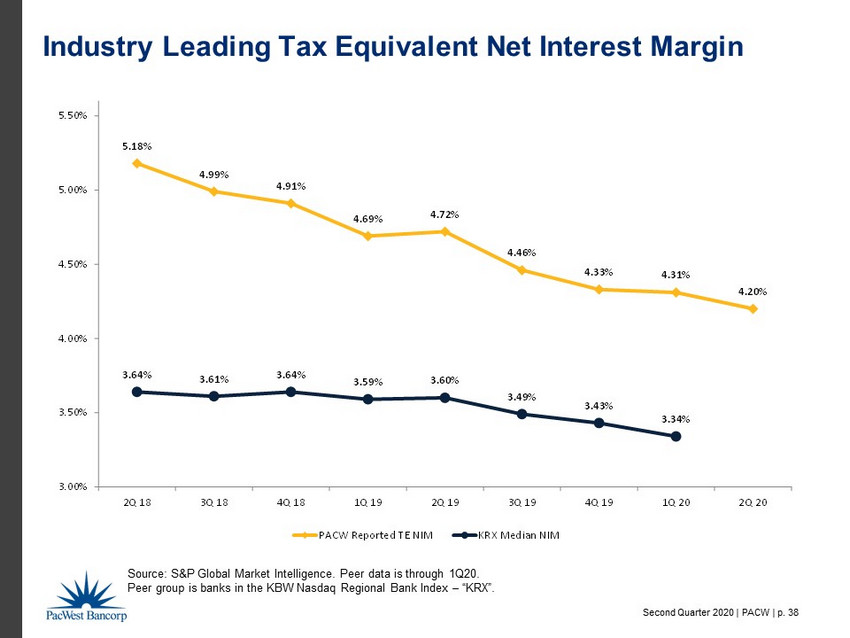
Second Quarter 2020 | PACW | p. 38 5.18% 4.99% 4.91% 4.69% 4.72% 4.46% 4.33% 4.31% 4.20% 3.64% 3.61% 3.64% 3.59% 3.60% 3.49% 3.43% 3.34% 3.00% 3.50% 4.00% 4.50% 5.00% 5.50% 2Q 18 3Q 18 4Q 18 1Q 19 2Q 19 3Q 19 4Q 19 1Q 20 2Q 20 PACW Reported TE NIM KRX Median NIM Industry Leading Tax Equivalent Net Interest Margin Source: S&P Global Market Intelligence. Peer data is through 1Q20. Peer group is banks in the KBW Nasdaq Regional Bank Index – “KRX”.

Second Quarter 2020 | PACW | p. 39 6.30% 6.20% 6.27% 6.16% 6.26% 5.91% 5.67% 5.54% 5.01% 6.09% 6.06% 6.11% 6.09% 6.18% 5.86% 5.60% 5.44% 4.96% 4.77% 4.87% 4.99% 5.08% 5.08% 4.96% 4.76% 4.57% 4.00% 4.50% 5.00% 5.50% 6.00% 6.50% 2Q 18 3Q 18 4Q 18 1Q 19 2Q 19 3Q 19 4Q 19 1Q 20 2Q 20 PACW - Reported TE Avg. Loan Yield PACW - Loan Yield Excluding Discount Accretion KRX - Median Loan Yield Higher Loan Yields From Disciplined & Diversified Lending Source: S&P Global Market Intelligence. Peer data is through 1Q20. Peer group is banks in the KBW Nasdaq Regional Bank Index – “KRX”.
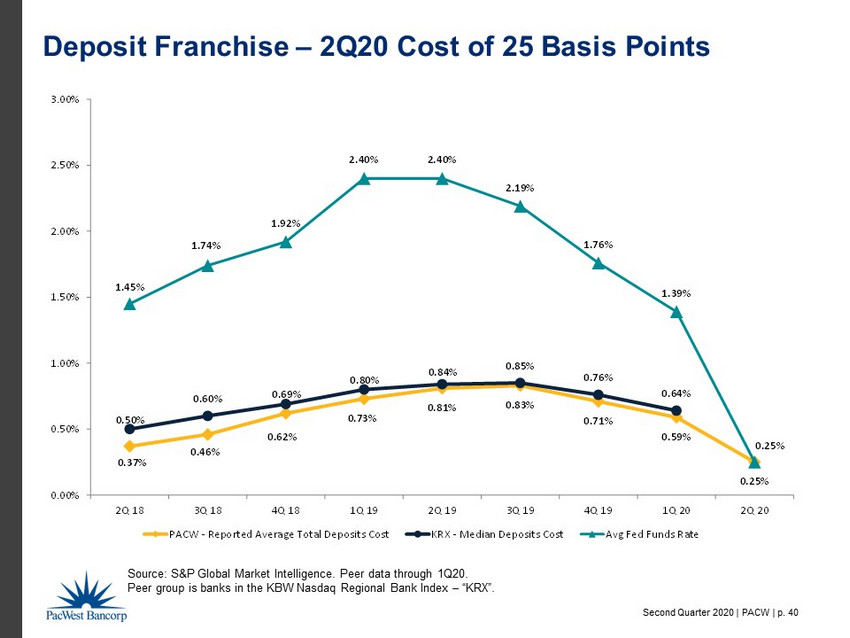
Second Quarter 2020 | PACW | p. 40 0.37% 0.46% 0.62% 0.73% 0.81% 0.83% 0.71% 0.59% 0.25% 0.50% 0.60% 0.69% 0.80% 0.84% 0.85% 0.76% 0.64% 1.45% 1.74% 1.92% 2.40% 2.40% 2.19% 1.76% 1.39% 0.25% 0.00% 0.50% 1.00% 1.50% 2.00% 2.50% 3.00% 2Q 18 3Q 18 4Q 18 1Q 19 2Q 19 3Q 19 4Q 19 1Q 20 2Q 20 PACW - Reported Average Total Deposits Cost KRX - Median Deposits Cost Avg Fed Funds Rate Deposit Franchise – 2Q20 Cost of 25 Basis Points Source: S&P Global Market Intelligence. Peer data through 1Q20. Peer group is banks in the KBW Nasdaq Regional Bank Index – “KRX”.

Second Quarter 2020 | PACW | p. 41 Interest Rate Components of the Loan and Lease Portfolio 74.0% 76.0% 78.0% 80.0% 82.0% 84.0% 8,000 8,250 8,500 8,750 9,000 Floor is In the Money Now cut 25 bps cut 50 bps cut 75 bps % of Variable Rate Loans Cumulative Balance ($ 000’s) Amount of Rate Cut Floor Analysis - Variable Rate Loans as of June 30, 2020 Volume Percent ($ in millions) Interest Rate Scenario Forecasted Net Interest Income* Percentage Change from Base Forecasted Net Interest Margin* Up 300 bps 1,145.3 15.9 4.65% Up 200 bps 1,036.4 4.9 4.21% Up 100 bps 1,015.1 2.7 4.12% Base case 998.43 - 4.22% Down 25 bps 1,010.8 - 0.3% 4.21% Down 50 bps 1,006.3 - 0.7% 4.19% * - Tax equivalent Note: The above table presents forecasted net interest income and net interest margin for the next 12 months using the forward yield curve as of June 30, 2020 as the base scenario and shocking the static balance sheet for immediate and sustained parallel upward movements in interest rates of 100, 200 and 300 basis points and a downward movement in interest rates of 25 and 50 basis points. $899mm $2,290mm $874mm $4,492mm 1 Year 2 Years 3 Years > 3 Years Fixed/Hybrid Years to Maturity/Repricing Fixed - Rate , 24% Variable - Rate, 57% Hybrid , 19%, Loan Portfolio by Repricing Type A1

Second Quarter 2020 | PACW | p. 42 Investment Securities
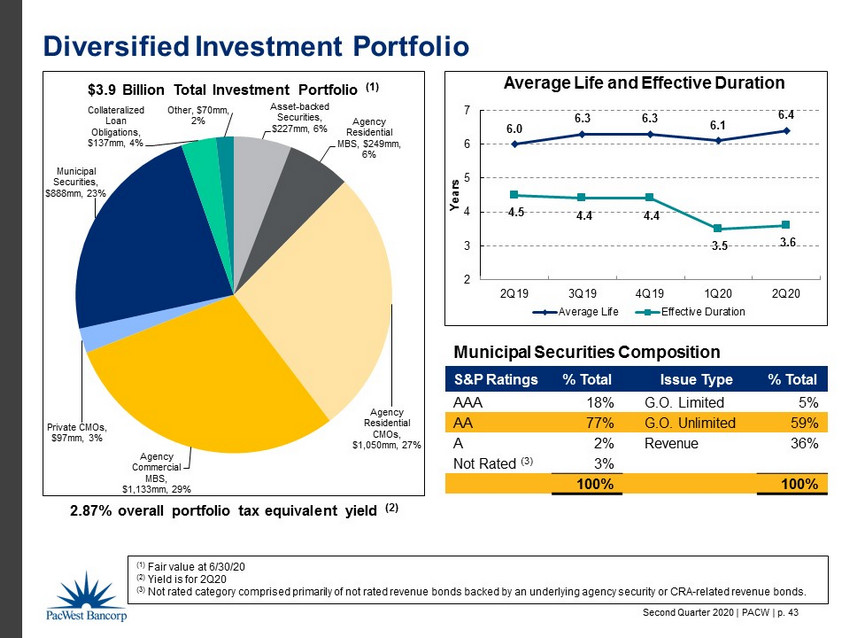
Second Quarter 2020 | PACW | p. 43 Diversified Investment Portfolio (1) Fair value at 6/30/20 (2) Yield is for 2Q20 (3) Not rated category comprised primarily of not rated revenue bonds backed by an underlying agency security or CRA - related revenue bon ds. Asset - backed Securities , $227mm , 6% Agency Residential MBS , $249mm , 6% Agency Residential CMOs , $1,050mm , 27% Agency Commercial MBS , $1,133mm , 29% Private CMOs , $97mm , 3% Municipal Securities , $888mm , 23% Collateralized Loan Obligations , $137mm , 4% Other, $70mm , 2% $3.9 Billion Total Investment Portfolio (1) 6.0 6.3 6.3 6.1 6.4 4.5 4.4 4.4 3.5 3.6 2 3 4 5 6 7 2Q19 3Q19 4Q19 1Q20 2Q20 Years Average Life and Effective Duration Average Life Effective Duration S&P Ratings % Total Issue Type % Total AAA 18% G.O. Limited 5% AA 77% G.O . Unlimited 59% A 2% Revenue 36% Not Rated (3) 3% 100% 100% 2.87% overall portfolio tax equivalent yield (2) Municipal Securities Composition
Second Quarter 2020 | PACW | p. 44 Controlled Expenses

Second Quarter 2020 | PACW | p. 45 39.8% 40.9% 41.7% 42.4% 41.6% 42.3% 44.8% 40.6% 42.9% 54.8% 53.7% 54.1% 54.3% 54.3% 54.1% 55.3% 56.4% 40.7% 35.0% 40.0% 45.0% 50.0% 55.0% 60.0% 2Q18 3Q18 4Q18 1Q19 2Q19 3Q19 4Q19 1Q20 2Q20 PACW Efficiency Ratio Median Efficiency Ratio Banks in KRX Index Efficiency Ratio Trend Excluding FHLB prepayment penalty

Second Quarter 2020 | PACW | p. 46 Company Overview
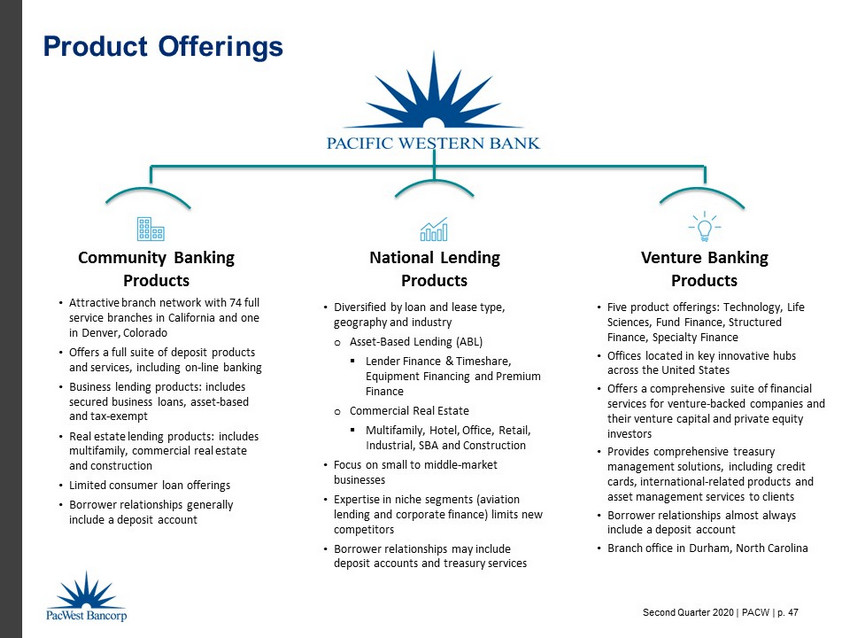
Second Quarter 2020 | PACW | p. 47 Product Offerings Community Banking Products National Lending Products Venture Banking Products • Attractive branch network with 74 full service branches in California and one in Denver, Colorado • Offers a full suite of deposit products and services, including on - line banking • Business lending products: includes secured business loans, asset - based and tax - exempt • Real estate lending products: includes multifamily, commercial real estate and construction • Limited consumer loan offerings • Borrower relationships generally include a deposit account • Diversified by loan and lease type, geography and industry o Asset - Based Lending (ABL) ▪ Lender Finance & Timeshare, Equipment Financing and Premium Finance o Commercial Real Estate ▪ Multifamily, Hotel, Office, Retail, Industrial, SBA and Construction • Focus on small to middle - market businesses • Expertise in niche segments (aviation lending and corporate finance) limits new competitors • Borrower relationships may include deposit accounts and treasury services • Five product offerings: Technology, Life Sciences, Fund Finance, Structured Finance, Specialty Finance • Offices located in key innovative hubs across the United States • Offers a comprehensive suite of financial services for venture - backed companies and their venture capital and private equity investors • Provides comprehensive treasury management solutions, including credit cards, international - related products and asset management services to clients • Borrower relationships almost always include a deposit account • Branch office in Durham, North Carolina
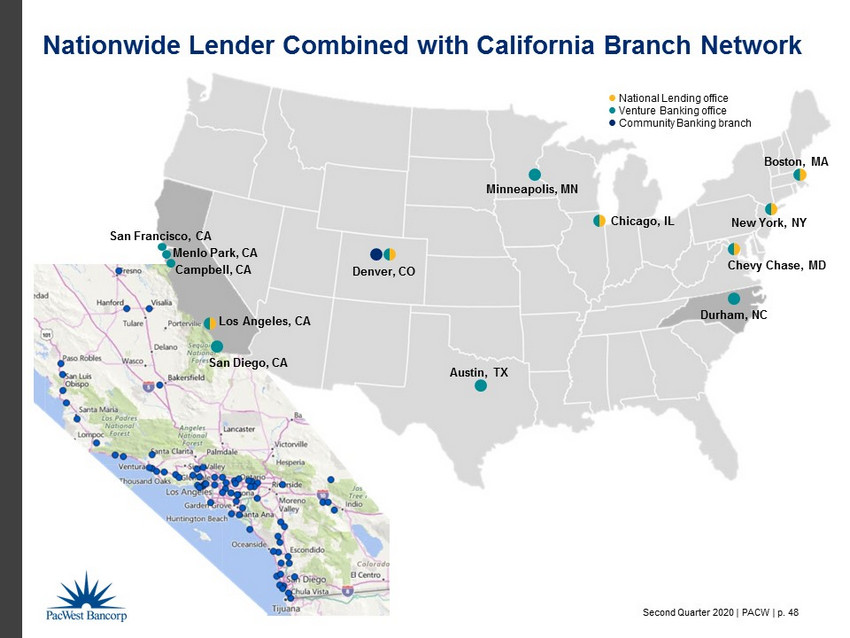
Second Quarter 2020 | PACW | p. 48 Nationwide Lender Combined with California Branch Network Los Angeles, CA Durham, NC Chevy Chase, MD Chicago, IL Denver, CO New York, NY Boston, MA Minneapolis, MN Austin, TX Campbell, CA Menlo Park, CA San Francisco, CA San Diego, CA National Lending office Venture Banking office Community Banking branch
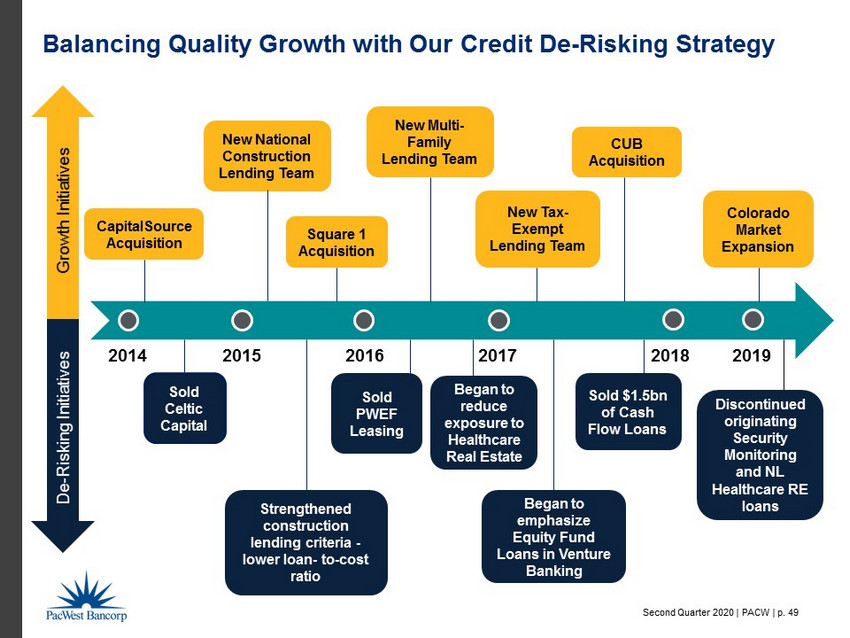
Second Quarter 2020 | PACW | p. 49 Balancing Quality Growth with Our Credit De - Risking Strategy 2014 2015 2016 2017 2018 2019 Sold PWEF Leasing Growth Initiatives De - Risking Initiatives New National Construction Lending Team New Multi - Family Lending Team Square 1 Acquisition CapitalSource Acquisition New Tax - Exempt Lending Team CUB Acquisition Colorado Market Expansion Strengthened construction lending criteria - lower loan - to - cost ratio Began to reduce exposure to Healthcare Real Estate Sold $1.5bn of Cash Flow Loans Began to emphasize Equity Fund Loans in Venture Banking Sold Celtic Capital Discontinued originating Security Monitoring and NL Healthcare RE loans

Second Quarter 2020 | PACW | p. 50 Credit De - Risking – Specific Portfolios $955mm $844mm $452mm $334mm $237mm 2016 2017 2018 2019 2Q20 Healthcare Real Estate Loans 16% 22% 39% 55% 52% 41% 15% 12% 5% 3% 5% 7% 46% 45% 45% 32% 34% 41% 23% 21% 11% 10% 9% 11% $2.0b $2.1b $2.0b $2.2b $2.7b $1.8b 2016 2017 2018 2019 1Q20 2Q20 Venture Banking Loan Portfolio Equity Fund Loans Late Stage Expansion Stage Early Stage ▪ Exited Cash Flow lending business in 2017 ▪ Shifted Venture Banking strategy to grow Equity Fund Loans ▪ Reduced exposure to Healthcare R.E. and in October 2019 ceased originating NL Healthcare R.E. loans ▪ Healthcare R.E. comprised of $98mm in skilled nursing, $79mm in assisted living and $60mm in other healthcare facilities $2,373mm $279mm $114mm $38mm $37mm 2016 2017 2018 2019 2Q20 Commercial Cash Flow Loans Exited Business Reduced Exposure
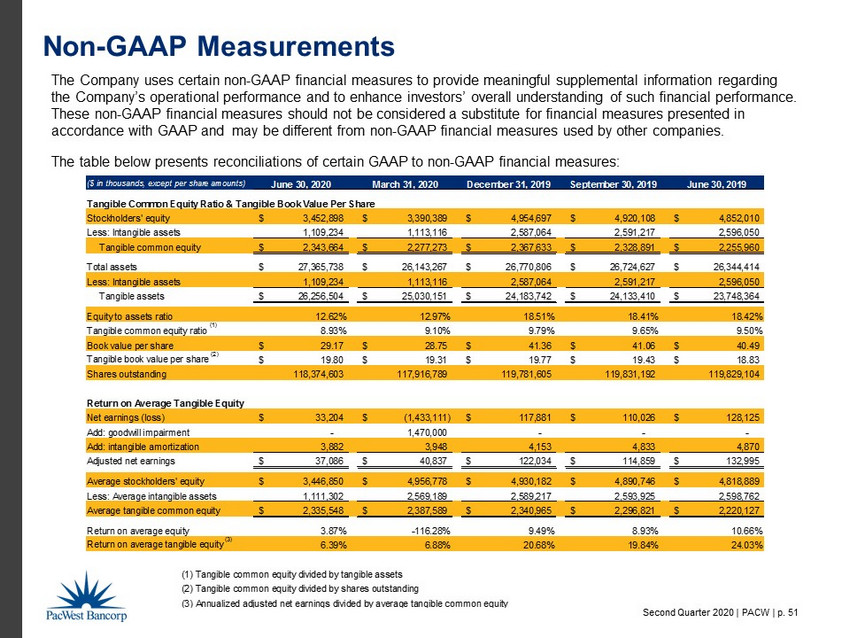
Second Quarter 2020 | PACW | p. 51 Non - GAAP Measurements The Company uses certain non - GAAP financial measures to provide meaningful supplemental information regarding the Company’s operational performance and to enhance investors’ overall understanding of such financial performance. These non - GAAP financial measures should not be considered a substitute for financial measures presented in accordance with GAAP and may be different from non - GAAP financial measures used by other companies. The table below presents reconciliations of certain GAAP to non - GAAP financial measures: ($ in thousands, except per share amounts) June 30, 2020 March 31, 2020 December 31, 2019 September 30, 2019 June 30, 2019 Tangible Common Equity Ratio & Tangible Book Value Per Share Stockholders' equity 3,452,898$ 3,390,389$ 4,954,697$ 4,920,108$ 4,852,010$ Less: Intangible assets 1,109,234 1,113,116 2,587,064 2,591,217 2,596,050 Tangible common equity 2,343,664$ 2,277,273$ 2,367,633$ 2,328,891$ 2,255,960$ Total assets 27,365,738$ 26,143,267$ 26,770,806$ 26,724,627$ 26,344,414$ Less: Intangible assets 1,109,234 1,113,116 2,587,064 2,591,217 2,596,050 Tangible assets 26,256,504$ 25,030,151$ 24,183,742$ 24,133,410$ 23,748,364$ Equity to assets ratio 12.62% 12.97% 18.51% 18.41% 18.42% Tangible common equity ratio (1) 8.93% 9.10% 9.79% 9.65% 9.50% Book value per share 29.17$ 28.75$ 41.36$ 41.06$ 40.49$ Tangible book value per share (2) 19.80$ 19.31$ 19.77$ 19.43$ 18.83$ Shares outstanding 118,374,603 117,916,789 119,781,605 119,831,192 119,829,104 Return on Average Tangible Equity Net earnings (loss) 33,204$ (1,433,111)$ 117,881$ 110,026$ 128,125$ Add: goodwill impairment - 1,470,000 - - - Add: intangible amortization 3,882 3,948 4,153 4,833 4,870 Adjusted net earnings 37,086$ 40,837$ 122,034$ 114,859$ 132,995$ Average stockholders' equity 3,446,850$ 4,956,778$ 4,930,182$ 4,890,746$ 4,818,889$ Less: Average intangible assets 1,111,302 2,569,189 2,589,217 2,593,925 2,598,762 Average tangible common equity 2,335,548$ 2,387,589$ 2,340,965$ 2,296,821$ 2,220,127$ Return on average equity 3.87% -116.28% 9.49% 8.93% 10.66% Return on average tangible equity (3) 6.39% 6.88% 20.68% 19.84% 24.03% (1) Tangible common equity divided by tangible assets (2) Tangible common equity divided by shares outstanding (3) Annualized adjusted net earnings divided by average tangible common equity
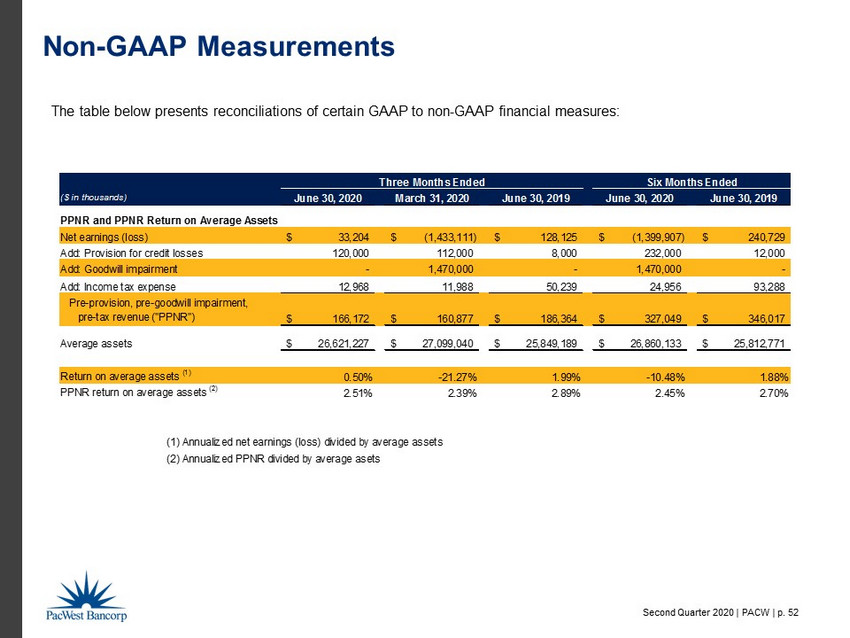
Second Quarter 2020 | PACW | p. 52 Non - GAAP Measurements The table below presents reconciliations of certain GAAP to non - GAAP financial measures: ($ in thousands) June 30, 2020 March 31, 2020 June 30, 2019 June 30, 2020 June 30, 2019 PPNR and PPNR Return on Average Assets Net earnings (loss) 33,204$ (1,433,111)$ 128,125$ (1,399,907)$ 240,729$ Add: Provision for credit losses 120,000 112,000 8,000 232,000 12,000 Add: Goodwill impairment - 1,470,000 - 1,470,000 - Add: Income tax expense 12,968 11,988 50,239 24,956 93,288 Pre-provision, pre-goodwill impairment, pre-tax revenue ("PPNR") 166,172$ 160,877$ 186,364$ 327,049$ 346,017$ Average assets 26,621,227$ 27,099,040$ 25,849,189$ 26,860,133$ 25,812,771$ Return on average assets (1) 0.50% -21.27% 1.99% -10.48% 1.88% PPNR return on average assets (2) 2.51% 2.39% 2.89% 2.45% 2.70% (1) Annualized net earnings (loss) divided by average assets (2) Annualized PPNR divided by average asets Three Months Ended Six Months Ended

Second Quarter 2020 | PACW | p. 53 Bank Holding Companies and Banks in the KRX Index Total Assets ( in billions ) Source: S&P Global Market Intelligence. Total assets as of March 31, 2020. Banks in the KRX Index as of June 30, 2020. 1 New York Community Bancorp, Inc. NYCB $ 54.261 26 Fulton Financial Corporation FULT $ 22.930 2 Signature Bank SBNY $ 53.075 27 BancorpSouth Bank BXS $ 21.033 3 Popular, Inc. BPOP $ 52.804 28 First Hawaiian, Inc. FHB $ 20.756 4 Synovus Financial Corp. SNV $ 50.620 29 Old National Bancorp ONB $ 20.741 5 TCF Financial Corp. TCF $ 48.594 30 United Bankshares , Inc. UBSI $ 20.371 6 East West Bancorp Inc. EWBC $ 45.949 31 First Midwest Bancorp, Inc. FMBI $ 19.753 7 Valley National Bancorp VLY $ 39.121 32 Bank of Hawaii Corporation BOH $ 18.542 8 Wintrust Financial Corporation WTFC $ 38.800 33 Cathay General Bancorp CATY $ 18.296 9 Texas Capital Bankshares , Inc. TCBI $ 35.879 34 Washington Federal, Inc. WAFD $ 17.376 10 F.N.B. Corporation FNB $ 35.049 35 Cadence Bancorporation CADE $ 17.238 11 Cullen/Frost Bankers, Inc. CFR $ 34.147 36 South State Corporation SSB $ 16.643 12 Associated Banc - Corp ASB $ 33.908 37 Hope Bancorp, Inc. HOPE $ 16.021 13 BankUnited , Inc. BKU $ 33.596 38 Home Bancshares, Inc. HOMB $ 15.532 14 Hancock Whitney Corporation HWC $ 31.762 39 Glacier Bancorp, Inc. GBCI $ 15.158 15 Prosperity Bancshares, Inc. PB $ 31.743 40 First Financial Bancorp FFBC $ 15.058 16 Webster Financial Corporation WBS $ 31.655 41 Columbia Banking Systems, Inc. COLB $ 14.039 17 Sterling Bancorp STL $ 30.335 42 Trustmark Corporation TRMK $ 14.020 18 Pinnacle Financial Partners, Inc. PNFP $ 29.264 43 United Community Banks, Inc. UCBI $ 13.086 19 Western Alliance Bancorporation WAL $ 29.158 44 Community Bank Systems, Inc. CBU $ 11.809 20 Umpqua Holdings Corporation UMPQ $ 27.540 45 CVB Financial Corp. CVBF $ 11.607 21 Commerce Bankshares , Inc. CBSH $ 26.793 46 Provident Financial Services, Inc. PFS $ 10.085 22 Investors Bancorp ISBC $ 26.678 47 First Financial Bankshares , Inc. FFIN $ 9.701 23 UMB Financial Corporation UMBF $ 26.245 48 Boston Private Financial Holdings, Inc. BPFH $ 8.746 24 PacWest Bancorp PACW $ 26.143 49 First Commonwealth Financial Corporation FCF $ 8.515 25 Bank OZK OZK $ 24.566 50 Brookline Bancorp, Inc. BRKL $ 8.462