Attached files
| file | filename |
|---|---|
| EX-99.1 - EX-99.1 - GOLDMAN SACHS GROUP INC | d53148dex991.htm |
| 8-K - 8-K - GOLDMAN SACHS GROUP INC | d53148d8k.htm |
Exhibit 99.2 Second Quarter 2020 Earnings Results Presentation July 15, 2020Exhibit 99.2 Second Quarter 2020 Earnings Results Presentation July 15, 2020
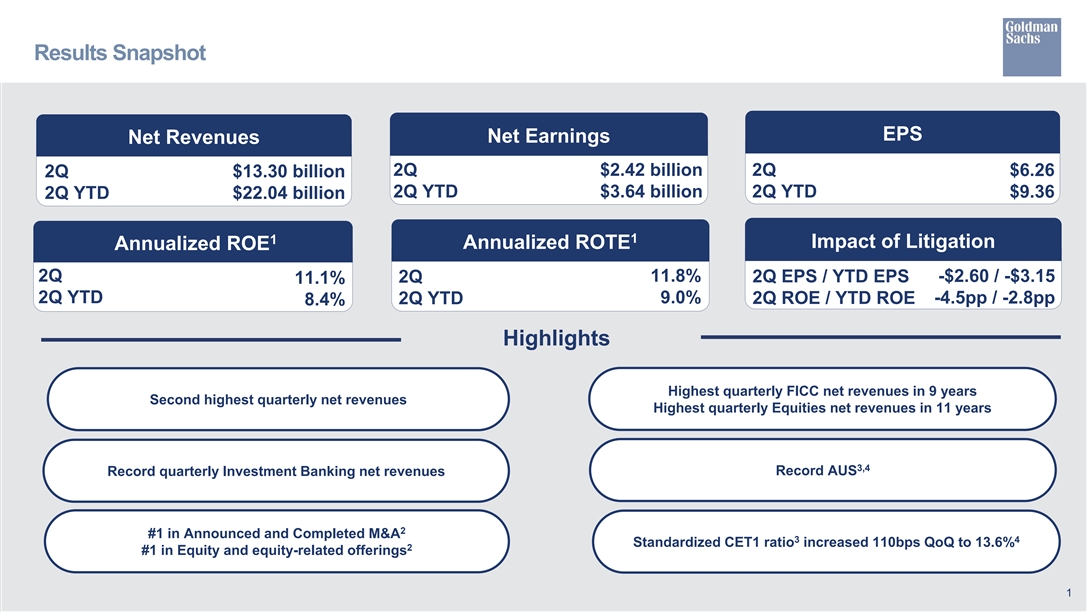
Results Snapshot EPS Net Earnings Net Revenues 2Q $2.42 billion 2Q $6.26 2Q $13.30 billion 2Q YTD $3.64 billion 2Q YTD $9.36 2Q YTD $22.04 billion 1 1 Impact of Litigation Annualized ROTE Annualized ROE 2Q 11.8% 2Q EPS / YTD EPS -$2.60 / -$3.15 2Q 11.1% 2Q YTD 9.0% 2Q YTD 2Q ROE / YTD ROE -4.5pp / -2.8pp 8.4% Highlights Highest quarterly FICC net revenues in 9 years Second highest quarterly net revenues Highest quarterly Equities net revenues in 11 years 3,4 Record AUS Record quarterly Investment Banking net revenues 2 #1 in Announced and Completed M&A 3 4 Standardized CET1 ratio increased 110bps QoQ to 13.6% 2 #1 in Equity and equity-related offerings 1Results Snapshot EPS Net Earnings Net Revenues 2Q $2.42 billion 2Q $6.26 2Q $13.30 billion 2Q YTD $3.64 billion 2Q YTD $9.36 2Q YTD $22.04 billion 1 1 Impact of Litigation Annualized ROTE Annualized ROE 2Q 11.8% 2Q EPS / YTD EPS -$2.60 / -$3.15 2Q 11.1% 2Q YTD 9.0% 2Q YTD 2Q ROE / YTD ROE -4.5pp / -2.8pp 8.4% Highlights Highest quarterly FICC net revenues in 9 years Second highest quarterly net revenues Highest quarterly Equities net revenues in 11 years 3,4 Record AUS Record quarterly Investment Banking net revenues 2 #1 in Announced and Completed M&A 3 4 Standardized CET1 ratio increased 110bps QoQ to 13.6% 2 #1 in Equity and equity-related offerings 1
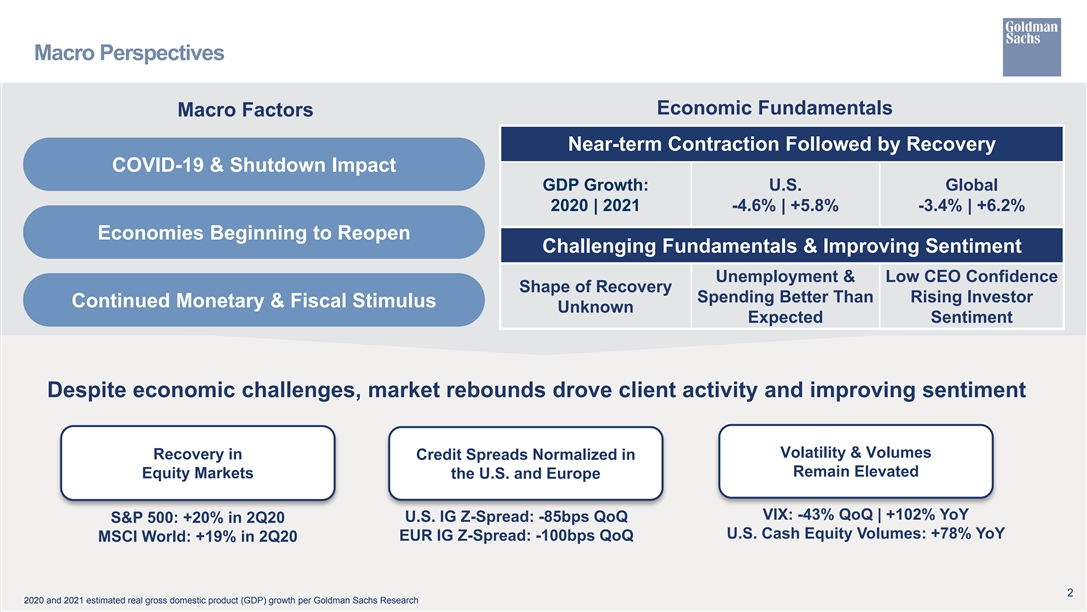
Macro Perspectives Economic Fundamentals Macro Factors Near-term Contraction Followed by Recovery COVID-19 & Shutdown Impact GDP Growth: U.S. Global 2020 | 2021 -4.6% | +5.8% -3.4% | +6.2% Economies Beginning to Reopen Challenging Fundamentals & Improving Sentiment Unemployment & Low CEO Confidence Shape of Recovery Spending Better Than Rising Investor Continued Monetary & Fiscal Stimulus Unknown Expected Sentiment Despite economic challenges, market rebounds drove client activity and improving sentiment Volatility & Volumes Recovery in Credit Spreads Normalized in Remain Elevated Equity Markets the U.S. and Europe VIX: -43% QoQ | +102% YoY U.S. IG Z-Spread: -85bps QoQ S&P 500: +20% in 2Q20 U.S. Cash Equity Volumes: +78% YoY EUR IG Z-Spread: -100bps QoQ MSCI World: +19% in 2Q20 2 2020 and 2021 estimated real gross domestic product (GDP) growth per Goldman Sachs ResearchMacro Perspectives Economic Fundamentals Macro Factors Near-term Contraction Followed by Recovery COVID-19 & Shutdown Impact GDP Growth: U.S. Global 2020 | 2021 -4.6% | +5.8% -3.4% | +6.2% Economies Beginning to Reopen Challenging Fundamentals & Improving Sentiment Unemployment & Low CEO Confidence Shape of Recovery Spending Better Than Rising Investor Continued Monetary & Fiscal Stimulus Unknown Expected Sentiment Despite economic challenges, market rebounds drove client activity and improving sentiment Volatility & Volumes Recovery in Credit Spreads Normalized in Remain Elevated Equity Markets the U.S. and Europe VIX: -43% QoQ | +102% YoY U.S. IG Z-Spread: -85bps QoQ S&P 500: +20% in 2Q20 U.S. Cash Equity Volumes: +78% YoY EUR IG Z-Spread: -100bps QoQ MSCI World: +19% in 2Q20 2 2020 and 2021 estimated real gross domestic product (GDP) growth per Goldman Sachs Research
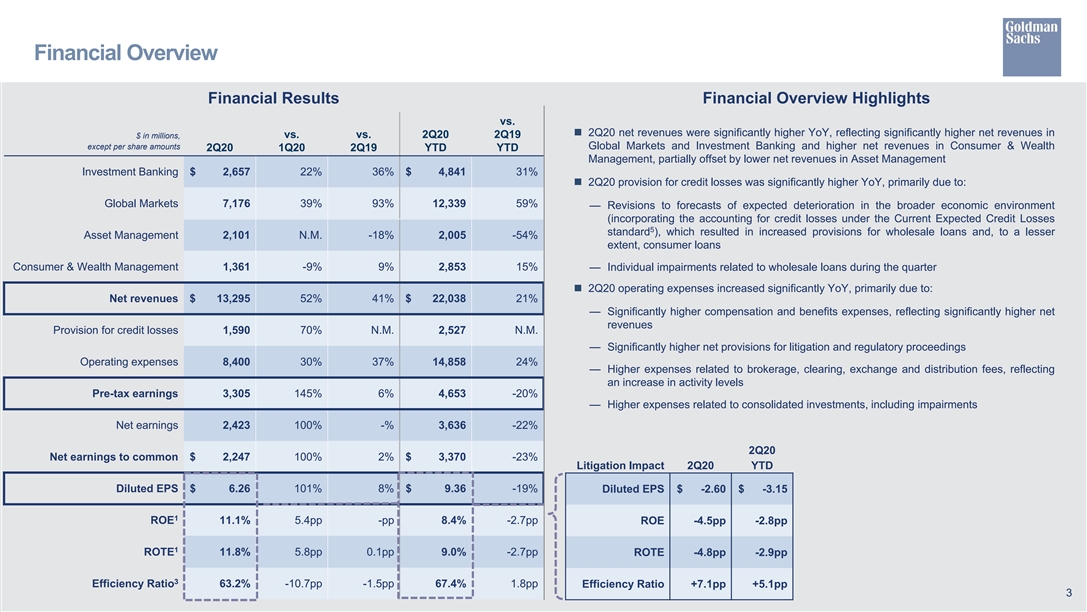
Financial Overview Financial Results Financial Overview Highlights vs. n 2Q20 net revenues were significantly higher YoY, reflecting significantly higher net revenues in $ in millions, vs. vs. 2Q20 2Q19 Global Markets and Investment Banking and higher net revenues in Consumer & Wealth except per share amounts 2Q20 1Q20 2Q19 YTD YTD Management, partially offset by lower net revenues in Asset Management Investment Banking $ 2,657 22% 36% $ 4,841 31% n 2Q20 provision for credit losses was significantly higher YoY, primarily due to: Global Markets 7,176 39% 93% 12,339 59% — Revisions to forecasts of expected deterioration in the broader economic environment (incorporating the accounting for credit losses under the Current Expected Credit Losses 5 standard ), which resulted in increased provisions for wholesale loans and, to a lesser Asset Management 2,101 N.M. -18% 2,005 -54% extent, consumer loans Consumer & Wealth Management 1,361 -9% 9% 2,853 15% — Individual impairments related to wholesale loans during the quarter n 2Q20 operating expenses increased significantly YoY, primarily due to: Net revenues $ 13,295 52% 41% $ 22,038 21% — Significantly higher compensation and benefits expenses, reflecting significantly higher net revenues Provision for credit losses 1,590 70% N.M. 2,527 N.M. — Significantly higher net provisions for litigation and regulatory proceedings Operating expenses 8,400 30% 37% 14,858 24% — Higher expenses related to brokerage, clearing, exchange and distribution fees, reflecting an increase in activity levels Pre-tax earnings 3,305 145% 6% 4,653 -20% — Higher expenses related to consolidated investments, including impairments Net earnings 2,423 100% -% 3,636 -22% 2Q20 Net earnings to common $ 2,247 100% 2% $ 3,370 -23% Litigation Impact 2Q20 YTD Diluted EPS $ 6.26 101% 8% $ 9.36 -19% Diluted EPS $ -2.60 $ -3.15 1 ROE 11.1% 5.4pp -pp 8.4% -2.7pp ROE -4.5pp -2.8pp 1 ROTE 11.8% 5.8pp 0.1pp 9.0% -2.7pp ROTE -4.8pp -2.9pp 3 Efficiency Ratio 63.2% -10.7pp -1.5pp 67.4% 1.8pp Efficiency Ratio +7.1pp +5.1pp 3Financial Overview Financial Results Financial Overview Highlights vs. n 2Q20 net revenues were significantly higher YoY, reflecting significantly higher net revenues in $ in millions, vs. vs. 2Q20 2Q19 Global Markets and Investment Banking and higher net revenues in Consumer & Wealth except per share amounts 2Q20 1Q20 2Q19 YTD YTD Management, partially offset by lower net revenues in Asset Management Investment Banking $ 2,657 22% 36% $ 4,841 31% n 2Q20 provision for credit losses was significantly higher YoY, primarily due to: Global Markets 7,176 39% 93% 12,339 59% — Revisions to forecasts of expected deterioration in the broader economic environment (incorporating the accounting for credit losses under the Current Expected Credit Losses 5 standard ), which resulted in increased provisions for wholesale loans and, to a lesser Asset Management 2,101 N.M. -18% 2,005 -54% extent, consumer loans Consumer & Wealth Management 1,361 -9% 9% 2,853 15% — Individual impairments related to wholesale loans during the quarter n 2Q20 operating expenses increased significantly YoY, primarily due to: Net revenues $ 13,295 52% 41% $ 22,038 21% — Significantly higher compensation and benefits expenses, reflecting significantly higher net revenues Provision for credit losses 1,590 70% N.M. 2,527 N.M. — Significantly higher net provisions for litigation and regulatory proceedings Operating expenses 8,400 30% 37% 14,858 24% — Higher expenses related to brokerage, clearing, exchange and distribution fees, reflecting an increase in activity levels Pre-tax earnings 3,305 145% 6% 4,653 -20% — Higher expenses related to consolidated investments, including impairments Net earnings 2,423 100% -% 3,636 -22% 2Q20 Net earnings to common $ 2,247 100% 2% $ 3,370 -23% Litigation Impact 2Q20 YTD Diluted EPS $ 6.26 101% 8% $ 9.36 -19% Diluted EPS $ -2.60 $ -3.15 1 ROE 11.1% 5.4pp -pp 8.4% -2.7pp ROE -4.5pp -2.8pp 1 ROTE 11.8% 5.8pp 0.1pp 9.0% -2.7pp ROTE -4.8pp -2.9pp 3 Efficiency Ratio 63.2% -10.7pp -1.5pp 67.4% 1.8pp Efficiency Ratio +7.1pp +5.1pp 3
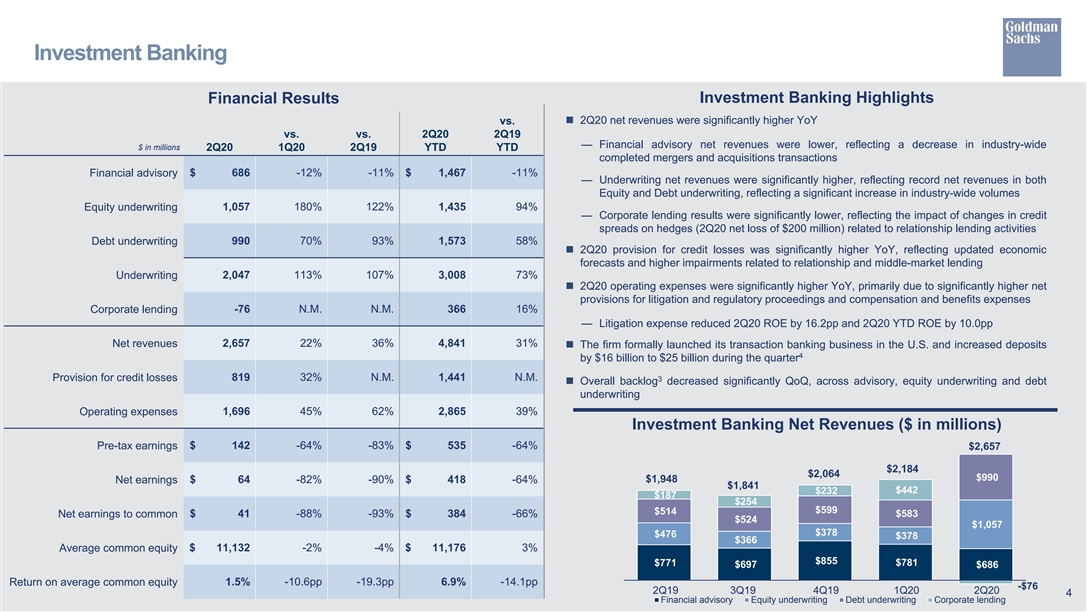
Investment Banking Investment Banking Highlights Financial Results n 2Q20 net revenues were significantly higher YoY vs. vs. vs. 2Q20 2Q19 — Financial advisory net revenues were lower, reflecting a decrease in industry-wide $ in millions 2Q20 1Q20 2Q19 YTD YTD completed mergers and acquisitions transactions $ 686 -12% -11% $ 1,467 -11% Financial advisory — Underwriting net revenues were significantly higher, reflecting record net revenues in both Equity and Debt underwriting, reflecting a significant increase in industry-wide volumes Equity underwriting 1,057 180% 122% 1,435 94% — Corporate lending results were significantly lower, reflecting the impact of changes in credit spreads on hedges (2Q20 net loss of $200 million) related to relationship lending activities Debt underwriting 990 70% 93% 1,573 58% n 2Q20 provision for credit losses was significantly higher YoY, reflecting updated economic forecasts and higher impairments related to relationship and middle-market lending Underwriting 2,047 113% 107% 3,008 73% n 2Q20 operating expenses were significantly higher YoY, primarily due to significantly higher net provisions for litigation and regulatory proceedings and compensation and benefits expenses Corporate lending -76 N.M. N.M. 366 16% — Litigation expense reduced 2Q20 ROE by 16.2pp and 2Q20 YTD ROE by 10.0pp Net revenues 2,657 22% 36% 4,841 31% n The firm formally launched its transaction banking business in the U.S. and increased deposits 4 by $16 billion to $25 billion during the quarter Provision for credit losses 819 32% N.M. 1,441 N.M. 3 n Overall backlog decreased significantly QoQ, across advisory, equity underwriting and debt underwriting Operating expenses 1,696 45% 62% 2,865 39% Investment Banking Net Revenues ($ in millions) Pre-tax earnings $ 142 -64% -83% $ 535 -64% $2,657 $2,184 $2,064 $990 $1,948 $ 64 -82% -90% $ 418 -64% Net earnings $1,841 $442 $232 $187 $254 $599 $514 $ 41 -88% -93% $ 384 -66% $583 Net earnings to common $524 $1,057 $378 $476 $378 $366 $ 11,132 -2% -4% $ 11,176 3% Average common equity $855 $771 $781 $697 $686 Return on average common equity 1.5% -10.6pp -19.3pp 6.9% -14.1pp -$76 2Q19 3Q19 4Q19 1Q20 2Q20 4 Financial advisory Equity underwriting Debt underwriting Corporate lendingInvestment Banking Investment Banking Highlights Financial Results n 2Q20 net revenues were significantly higher YoY vs. vs. vs. 2Q20 2Q19 — Financial advisory net revenues were lower, reflecting a decrease in industry-wide $ in millions 2Q20 1Q20 2Q19 YTD YTD completed mergers and acquisitions transactions $ 686 -12% -11% $ 1,467 -11% Financial advisory — Underwriting net revenues were significantly higher, reflecting record net revenues in both Equity and Debt underwriting, reflecting a significant increase in industry-wide volumes Equity underwriting 1,057 180% 122% 1,435 94% — Corporate lending results were significantly lower, reflecting the impact of changes in credit spreads on hedges (2Q20 net loss of $200 million) related to relationship lending activities Debt underwriting 990 70% 93% 1,573 58% n 2Q20 provision for credit losses was significantly higher YoY, reflecting updated economic forecasts and higher impairments related to relationship and middle-market lending Underwriting 2,047 113% 107% 3,008 73% n 2Q20 operating expenses were significantly higher YoY, primarily due to significantly higher net provisions for litigation and regulatory proceedings and compensation and benefits expenses Corporate lending -76 N.M. N.M. 366 16% — Litigation expense reduced 2Q20 ROE by 16.2pp and 2Q20 YTD ROE by 10.0pp Net revenues 2,657 22% 36% 4,841 31% n The firm formally launched its transaction banking business in the U.S. and increased deposits 4 by $16 billion to $25 billion during the quarter Provision for credit losses 819 32% N.M. 1,441 N.M. 3 n Overall backlog decreased significantly QoQ, across advisory, equity underwriting and debt underwriting Operating expenses 1,696 45% 62% 2,865 39% Investment Banking Net Revenues ($ in millions) Pre-tax earnings $ 142 -64% -83% $ 535 -64% $2,657 $2,184 $2,064 $990 $1,948 $ 64 -82% -90% $ 418 -64% Net earnings $1,841 $442 $232 $187 $254 $599 $514 $ 41 -88% -93% $ 384 -66% $583 Net earnings to common $524 $1,057 $378 $476 $378 $366 $ 11,132 -2% -4% $ 11,176 3% Average common equity $855 $771 $781 $697 $686 Return on average common equity 1.5% -10.6pp -19.3pp 6.9% -14.1pp -$76 2Q19 3Q19 4Q19 1Q20 2Q20 4 Financial advisory Equity underwriting Debt underwriting Corporate lending
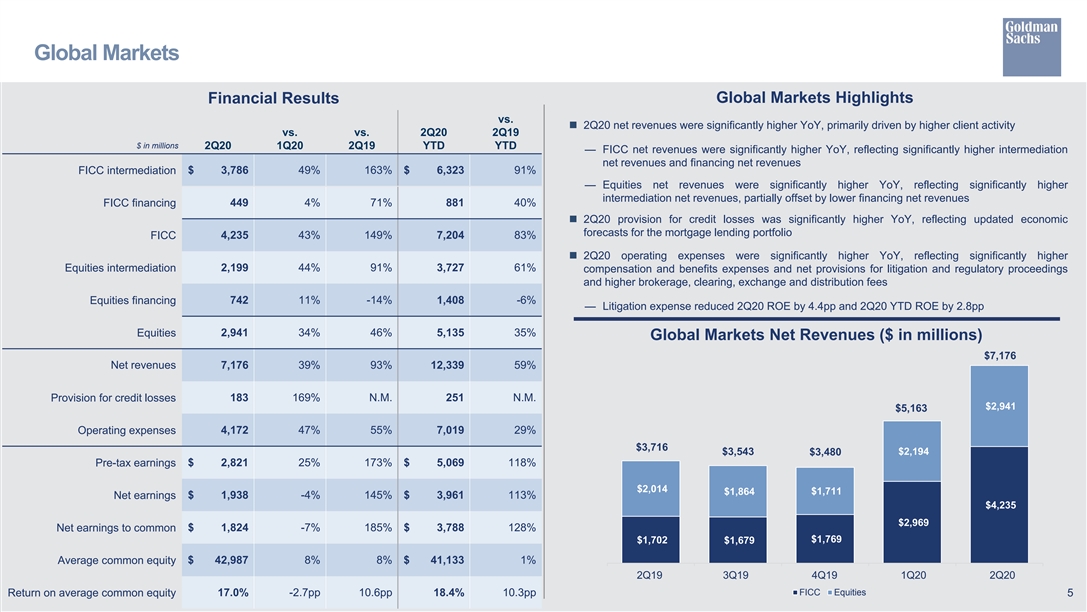
Global Markets Global Markets Highlights Financial Results vs. n 2Q20 net revenues were significantly higher YoY, primarily driven by higher client activity vs. vs. 2Q20 2Q19 $ in millions 2Q20 1Q20 2Q19 YTD YTD — FICC net revenues were significantly higher YoY, reflecting significantly higher intermediation net revenues and financing net revenues FICC intermediation $ 3,786 49% 163% $ 6,323 91% — Equities net revenues were significantly higher YoY, reflecting significantly higher intermediation net revenues, partially offset by lower financing net revenues 449 4% 71% 881 40% FICC financing n 2Q20 provision for credit losses was significantly higher YoY, reflecting updated economic forecasts for the mortgage lending portfolio FICC 4,235 43% 149% 7,204 83% n 2Q20 operating expenses were significantly higher YoY, reflecting significantly higher 2,199 44% 91% 3,727 61% Equities intermediation compensation and benefits expenses and net provisions for litigation and regulatory proceedings and higher brokerage, clearing, exchange and distribution fees Equities financing 742 11% -14% 1,408 -6% — Litigation expense reduced 2Q20 ROE by 4.4pp and 2Q20 YTD ROE by 2.8pp 2,941 34% 46% 5,135 35% Equities Global Markets Net Revenues ($ in millions) $7,176 Net revenues 7,176 39% 93% 12,339 59% 183 169% N.M. 251 N.M. Provision for credit losses $2,941 $5,163 Operating expenses 4,172 47% 55% 7,019 29% $3,716 $3,543 $2,194 $3,480 $ 2,821 25% 173% $ 5,069 118% Pre-tax earnings $2,014 $1,864 $1,711 Net earnings $ 1,938 -4% 145% $ 3,961 113% $4,235 $2,969 $ 1,824 -7% 185% $ 3,788 128% Net earnings to common $1,702 $1,769 $1,679 Average common equity $ 42,987 8% 8% $ 41,133 1% 2Q19 3Q19 4Q19 1Q20 2Q20 FICC Equities 17.0% -2.7pp 10.6pp 18.4% 10.3pp Return on average common equity 5Global Markets Global Markets Highlights Financial Results vs. n 2Q20 net revenues were significantly higher YoY, primarily driven by higher client activity vs. vs. 2Q20 2Q19 $ in millions 2Q20 1Q20 2Q19 YTD YTD — FICC net revenues were significantly higher YoY, reflecting significantly higher intermediation net revenues and financing net revenues FICC intermediation $ 3,786 49% 163% $ 6,323 91% — Equities net revenues were significantly higher YoY, reflecting significantly higher intermediation net revenues, partially offset by lower financing net revenues 449 4% 71% 881 40% FICC financing n 2Q20 provision for credit losses was significantly higher YoY, reflecting updated economic forecasts for the mortgage lending portfolio FICC 4,235 43% 149% 7,204 83% n 2Q20 operating expenses were significantly higher YoY, reflecting significantly higher 2,199 44% 91% 3,727 61% Equities intermediation compensation and benefits expenses and net provisions for litigation and regulatory proceedings and higher brokerage, clearing, exchange and distribution fees Equities financing 742 11% -14% 1,408 -6% — Litigation expense reduced 2Q20 ROE by 4.4pp and 2Q20 YTD ROE by 2.8pp 2,941 34% 46% 5,135 35% Equities Global Markets Net Revenues ($ in millions) $7,176 Net revenues 7,176 39% 93% 12,339 59% 183 169% N.M. 251 N.M. Provision for credit losses $2,941 $5,163 Operating expenses 4,172 47% 55% 7,019 29% $3,716 $3,543 $2,194 $3,480 $ 2,821 25% 173% $ 5,069 118% Pre-tax earnings $2,014 $1,864 $1,711 Net earnings $ 1,938 -4% 145% $ 3,961 113% $4,235 $2,969 $ 1,824 -7% 185% $ 3,788 128% Net earnings to common $1,702 $1,769 $1,679 Average common equity $ 42,987 8% 8% $ 41,133 1% 2Q19 3Q19 4Q19 1Q20 2Q20 FICC Equities 17.0% -2.7pp 10.6pp 18.4% 10.3pp Return on average common equity 5
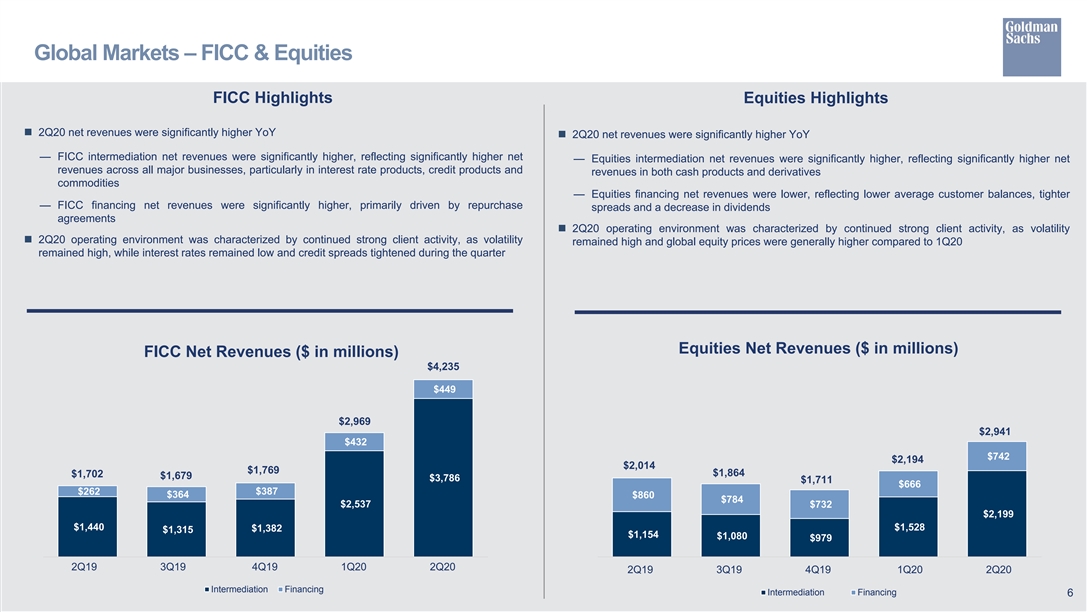
Global Markets – FICC & Equities FICC Highlights Equities Highlights n 2Q20 net revenues were significantly higher YoY n 2Q20 net revenues were significantly higher YoY — FICC intermediation net revenues were significantly higher, reflecting significantly higher net — Equities intermediation net revenues were significantly higher, reflecting significantly higher net revenues across all major businesses, particularly in interest rate products, credit products and revenues in both cash products and derivatives commodities — Equities financing net revenues were lower, reflecting lower average customer balances, tighter — FICC financing net revenues were significantly higher, primarily driven by repurchase spreads and a decrease in dividends agreements n 2Q20 operating environment was characterized by continued strong client activity, as volatility n 2Q20 operating environment was characterized by continued strong client activity, as volatility remained high and global equity prices were generally higher compared to 1Q20 remained high, while interest rates remained low and credit spreads tightened during the quarter Equities Net Revenues ($ in millions) FICC Net Revenues ($ in millions) $4,235 $449 $2,969 $2,941 $432 $742 $2,194 $2,014 $1,769 $1,864 $1,702 $1,679 $3,786 $1,711 $666 $262 $387 $364 $860 $784 $2,537 $732 $2,199 $1,440 $1,528 $1,382 $1,315 $1,154 $1,080 $979 2Q19 3Q19 4Q19 1Q20 2Q20 2Q19 3Q19 4Q19 1Q20 2Q20 Intermediation Financing Intermediation Financing 6Global Markets – FICC & Equities FICC Highlights Equities Highlights n 2Q20 net revenues were significantly higher YoY n 2Q20 net revenues were significantly higher YoY — FICC intermediation net revenues were significantly higher, reflecting significantly higher net — Equities intermediation net revenues were significantly higher, reflecting significantly higher net revenues across all major businesses, particularly in interest rate products, credit products and revenues in both cash products and derivatives commodities — Equities financing net revenues were lower, reflecting lower average customer balances, tighter — FICC financing net revenues were significantly higher, primarily driven by repurchase spreads and a decrease in dividends agreements n 2Q20 operating environment was characterized by continued strong client activity, as volatility n 2Q20 operating environment was characterized by continued strong client activity, as volatility remained high and global equity prices were generally higher compared to 1Q20 remained high, while interest rates remained low and credit spreads tightened during the quarter Equities Net Revenues ($ in millions) FICC Net Revenues ($ in millions) $4,235 $449 $2,969 $2,941 $432 $742 $2,194 $2,014 $1,769 $1,864 $1,702 $1,679 $3,786 $1,711 $666 $262 $387 $364 $860 $784 $2,537 $732 $2,199 $1,440 $1,528 $1,382 $1,315 $1,154 $1,080 $979 2Q19 3Q19 4Q19 1Q20 2Q20 2Q19 3Q19 4Q19 1Q20 2Q20 Intermediation Financing Intermediation Financing 6
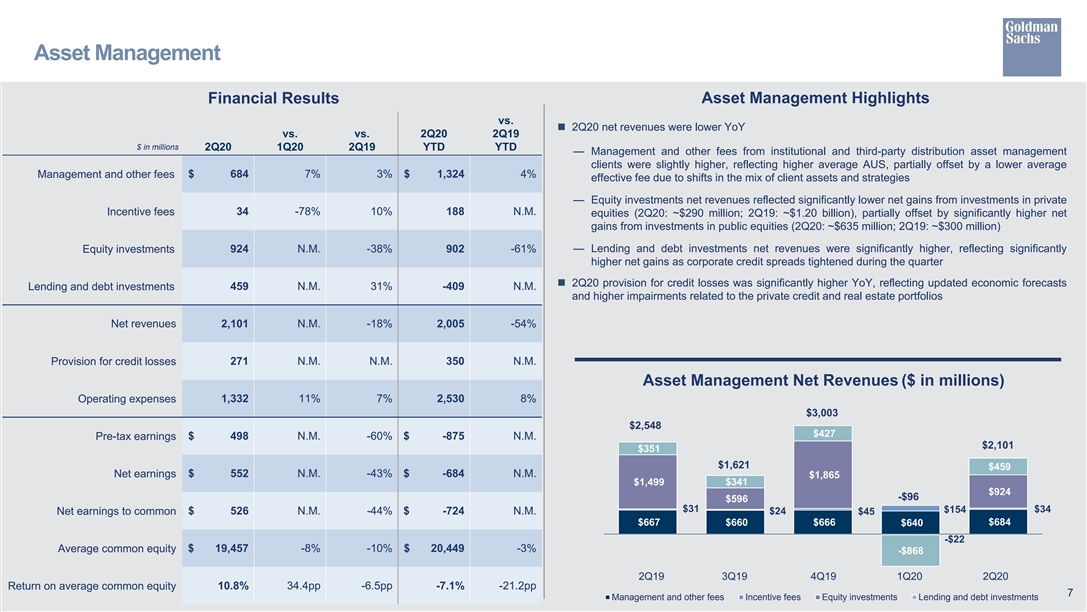
Asset Management Asset Management Highlights Financial Results vs. n 2Q20 net revenues were lower YoY vs. vs. 2Q20 2Q19 $ in millions 2Q20 1Q20 2Q19 YTD YTD — Management and other fees from institutional and third-party distribution asset management clients were slightly higher, reflecting higher average AUS, partially offset by a lower average Management and other fees $ 684 7% 3% $ 1,324 4% effective fee due to shifts in the mix of client assets and strategies — Equity investments net revenues reflected significantly lower net gains from investments in private Incentive fees 34 -78% 10% 188 N.M. equities (2Q20: ~$290 million; 2Q19: ~$1.20 billion), partially offset by significantly higher net gains from investments in public equities (2Q20: ~$635 million; 2Q19: ~$300 million) — Lending and debt investments net revenues were significantly higher, reflecting significantly Equity investments 924 N.M. -38% 902 -61% higher net gains as corporate credit spreads tightened during the quarter n 2Q20 provision for credit losses was significantly higher YoY, reflecting updated economic forecasts Lending and debt investments 459 N.M. 31% -409 N.M. and higher impairments related to the private credit and real estate portfolios Net revenues 2,101 N.M. -18% 2,005 -54% Provision for credit losses 271 N.M. N.M. 350 N.M. Asset Management Net Revenues ($ in millions) 1,332 11% 7% 2,530 8% Operating expenses $3,003 $2,548 $427 Pre-tax earnings $ 498 N.M. -60% $ -875 N.M. $2,101 $351 $1,621 $459 Net earnings $ 552 N.M. -43% $ -684 N.M. $1,865 $1,499 $341 $924 -$96 $596 $31 $34 $154 Net earnings to common $ 526 N.M. -44% $ -724 N.M. $24 $45 $684 $667 $660 $666 $640 -$22 Average common equity $ 19,457 -8% -10% $ 20,449 -3% -$868 2Q19 3Q19 4Q19 1Q20 2Q20 10.8% 34.4pp -6.5pp -7.1% -21.2pp Return on average common equity 7 Management and other fees Incentive fees Equity investments Lending and debt investmentsAsset Management Asset Management Highlights Financial Results vs. n 2Q20 net revenues were lower YoY vs. vs. 2Q20 2Q19 $ in millions 2Q20 1Q20 2Q19 YTD YTD — Management and other fees from institutional and third-party distribution asset management clients were slightly higher, reflecting higher average AUS, partially offset by a lower average Management and other fees $ 684 7% 3% $ 1,324 4% effective fee due to shifts in the mix of client assets and strategies — Equity investments net revenues reflected significantly lower net gains from investments in private Incentive fees 34 -78% 10% 188 N.M. equities (2Q20: ~$290 million; 2Q19: ~$1.20 billion), partially offset by significantly higher net gains from investments in public equities (2Q20: ~$635 million; 2Q19: ~$300 million) — Lending and debt investments net revenues were significantly higher, reflecting significantly Equity investments 924 N.M. -38% 902 -61% higher net gains as corporate credit spreads tightened during the quarter n 2Q20 provision for credit losses was significantly higher YoY, reflecting updated economic forecasts Lending and debt investments 459 N.M. 31% -409 N.M. and higher impairments related to the private credit and real estate portfolios Net revenues 2,101 N.M. -18% 2,005 -54% Provision for credit losses 271 N.M. N.M. 350 N.M. Asset Management Net Revenues ($ in millions) 1,332 11% 7% 2,530 8% Operating expenses $3,003 $2,548 $427 Pre-tax earnings $ 498 N.M. -60% $ -875 N.M. $2,101 $351 $1,621 $459 Net earnings $ 552 N.M. -43% $ -684 N.M. $1,865 $1,499 $341 $924 -$96 $596 $31 $34 $154 Net earnings to common $ 526 N.M. -44% $ -724 N.M. $24 $45 $684 $667 $660 $666 $640 -$22 Average common equity $ 19,457 -8% -10% $ 20,449 -3% -$868 2Q19 3Q19 4Q19 1Q20 2Q20 10.8% 34.4pp -6.5pp -7.1% -21.2pp Return on average common equity 7 Management and other fees Incentive fees Equity investments Lending and debt investments
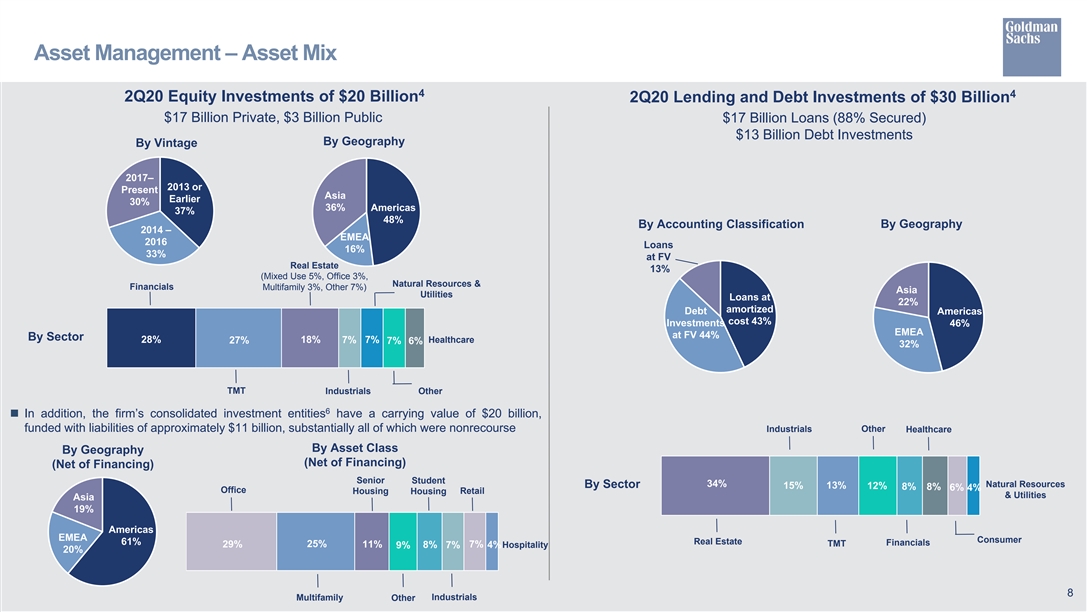
Asset Management – Asset Mix 4 4 2Q20 Equity Investments of $20 Billion 2Q20 Lending and Debt Investments of $30 Billion $17 Billion Private, $3 Billion Public $17 Billion Loans (88% Secured) $13 Billion Debt Investments By Geography By Vintage 2017– 2013 or Present Asia Earlier 30% 36% Americas 37% 48% By Accounting Classification By Geography 2014 – EMEA 2016 Loans 16% 33% at FV Real Estate 13% (Mixed Use 5%, Office 3%, Natural Resources & Financials Multifamily 3%, Other 7%) Asia Utilities Loans at 22% amortized Debt Americas cost 43% Investments 46% EMEA at FV 44% By Sector 28% 18% 7% 7% Healthcare 27% 7% 6% 32% TMT Industrials Other 6 n In addition, the firm’s consolidated investment entities have a carrying value of $20 billion, funded with liabilities of approximately $11 billion, substantially all of which were nonrecourse Industrials Other Healthcare By Asset Class By Geography (Net of Financing) (Net of Financing) Senior Student 34% Natural Resources By Sector 15% 13% 12% 8% 8% 6% 4% Office Housing Housing Retail & Utilities Asia 19% Americas EMEA Consumer 61% Real Estate Financials 25% TMT 29% 11% 8% 7% 7% 4%Hospitality 9% 20% 8 Industrials Multifamily OtherAsset Management – Asset Mix 4 4 2Q20 Equity Investments of $20 Billion 2Q20 Lending and Debt Investments of $30 Billion $17 Billion Private, $3 Billion Public $17 Billion Loans (88% Secured) $13 Billion Debt Investments By Geography By Vintage 2017– 2013 or Present Asia Earlier 30% 36% Americas 37% 48% By Accounting Classification By Geography 2014 – EMEA 2016 Loans 16% 33% at FV Real Estate 13% (Mixed Use 5%, Office 3%, Natural Resources & Financials Multifamily 3%, Other 7%) Asia Utilities Loans at 22% amortized Debt Americas cost 43% Investments 46% EMEA at FV 44% By Sector 28% 18% 7% 7% Healthcare 27% 7% 6% 32% TMT Industrials Other 6 n In addition, the firm’s consolidated investment entities have a carrying value of $20 billion, funded with liabilities of approximately $11 billion, substantially all of which were nonrecourse Industrials Other Healthcare By Asset Class By Geography (Net of Financing) (Net of Financing) Senior Student 34% Natural Resources By Sector 15% 13% 12% 8% 8% 6% 4% Office Housing Housing Retail & Utilities Asia 19% Americas EMEA Consumer 61% Real Estate Financials 25% TMT 29% 11% 8% 7% 7% 4%Hospitality 9% 20% 8 Industrials Multifamily Other
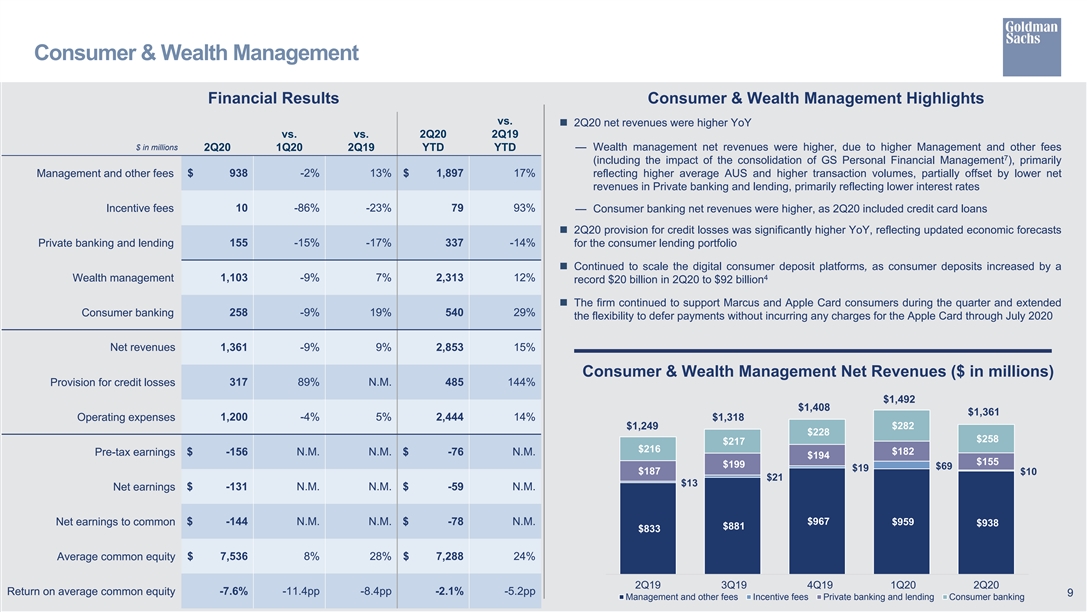
Consumer & Wealth Management Financial Results Consumer & Wealth Management Highlights vs. n 2Q20 net revenues were higher YoY vs. vs. 2Q20 2Q19 $ in millions 2Q20 1Q20 2Q19 YTD YTD — Wealth management net revenues were higher, due to higher Management and other fees 7 (including the impact of the consolidation of GS Personal Financial Management ), primarily Management and other fees $ 938 -2% 13% $ 1,897 17% reflecting higher average AUS and higher transaction volumes, partially offset by lower net revenues in Private banking and lending, primarily reflecting lower interest rates Incentive fees 10 -86% -23% 79 93% — Consumer banking net revenues were higher, as 2Q20 included credit card loans n 2Q20 provision for credit losses was significantly higher YoY, reflecting updated economic forecasts Private banking and lending 155 -15% -17% 337 -14% for the consumer lending portfolio n Continued to scale the digital consumer deposit platforms, as consumer deposits increased by a 4 1,103 -9% 7% 2,313 12% Wealth management record $20 billion in 2Q20 to $92 billion n The firm continued to support Marcus and Apple Card consumers during the quarter and extended Consumer banking 258 -9% 19% 540 29% the flexibility to defer payments without incurring any charges for the Apple Card through July 2020 Net revenues 1,361 -9% 9% 2,853 15% Consumer & Wealth Management Net Revenues ($ in millions) Provision for credit losses 317 89% N.M. 485 144% $1,492 $1,408 $1,361 Operating expenses 1,200 -4% 5% 2,444 14% $1,318 $282 $1,249 $228 $258 $217 $216 $182 Pre-tax earnings $ -156 N.M. N.M. $ -76 N.M. $194 $155 $199 $69 $19 $187 $10 $21 $13 $ -131 N.M. N.M. $ -59 N.M. Net earnings Net earnings to common $ -144 N.M. N.M. $ -78 N.M. $967 $959 $938 $881 $833 Average common equity $ 7,536 8% 28% $ 7,288 24% 2Q19 3Q19 4Q19 1Q20 2Q20 Return on average common equity -7.6% -11.4pp -8.4pp -2.1% -5.2pp 9 Management and other fees Incentive fees Private banking and lending Consumer bankingConsumer & Wealth Management Financial Results Consumer & Wealth Management Highlights vs. n 2Q20 net revenues were higher YoY vs. vs. 2Q20 2Q19 $ in millions 2Q20 1Q20 2Q19 YTD YTD — Wealth management net revenues were higher, due to higher Management and other fees 7 (including the impact of the consolidation of GS Personal Financial Management ), primarily Management and other fees $ 938 -2% 13% $ 1,897 17% reflecting higher average AUS and higher transaction volumes, partially offset by lower net revenues in Private banking and lending, primarily reflecting lower interest rates Incentive fees 10 -86% -23% 79 93% — Consumer banking net revenues were higher, as 2Q20 included credit card loans n 2Q20 provision for credit losses was significantly higher YoY, reflecting updated economic forecasts Private banking and lending 155 -15% -17% 337 -14% for the consumer lending portfolio n Continued to scale the digital consumer deposit platforms, as consumer deposits increased by a 4 1,103 -9% 7% 2,313 12% Wealth management record $20 billion in 2Q20 to $92 billion n The firm continued to support Marcus and Apple Card consumers during the quarter and extended Consumer banking 258 -9% 19% 540 29% the flexibility to defer payments without incurring any charges for the Apple Card through July 2020 Net revenues 1,361 -9% 9% 2,853 15% Consumer & Wealth Management Net Revenues ($ in millions) Provision for credit losses 317 89% N.M. 485 144% $1,492 $1,408 $1,361 Operating expenses 1,200 -4% 5% 2,444 14% $1,318 $282 $1,249 $228 $258 $217 $216 $182 Pre-tax earnings $ -156 N.M. N.M. $ -76 N.M. $194 $155 $199 $69 $19 $187 $10 $21 $13 $ -131 N.M. N.M. $ -59 N.M. Net earnings Net earnings to common $ -144 N.M. N.M. $ -78 N.M. $967 $959 $938 $881 $833 Average common equity $ 7,536 8% 28% $ 7,288 24% 2Q19 3Q19 4Q19 1Q20 2Q20 Return on average common equity -7.6% -11.4pp -8.4pp -2.1% -5.2pp 9 Management and other fees Incentive fees Private banking and lending Consumer banking
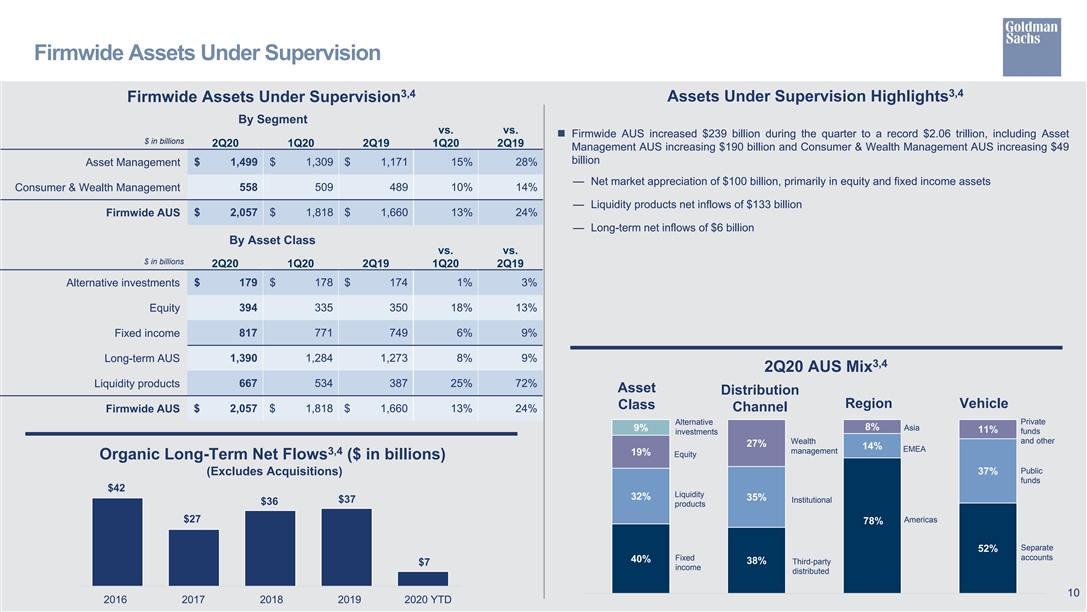
Firmwide Assets Under Supervision 3,4 3,4 Firmwide Assets Under Supervision Assets Under Supervision Highlights By Segment vs. vs. n Firmwide AUS increased $239 billion during the quarter to a record $2.06 trillion, including Asset $ in billions 2Q20 1Q20 2Q19 1Q20 2Q19 Management AUS increasing $190 billion and Consumer & Wealth Management AUS increasing $49 billion Asset Management $ 1,499 $ 1,309 $ 1,171 15% 28% — Net market appreciation of $100 billion, primarily in equity and fixed income assets Consumer & Wealth Management 558 509 489 10% 14% — Liquidity products net inflows of $133 billion Firmwide AUS $ 2,057 $ 1,818 $ 1,660 13% 24% — Long-term net inflows of $6 billion By Asset Class vs. vs. $ in billions 2Q20 1Q20 2Q19 1Q20 2Q19 $ 179 $ 178 $ 174 1% 3% Alternative investments 394 335 350 18% 13% Equity Fixed income 817 771 749 6% 9% Long-term AUS 1,390 1,284 1,273 8% 9% 3,4 2Q20 AUS Mix Liquidity products 667 534 387 25% 72% Asset Distribution Region Vehicle Class $ 2,057 $ 1,818 $ 1,660 13% 24% Channel Firmwide AUS Private Alternative 8% 9% Asia 11% funds investments Wealth and other 27% 14% EMEA management 3,4 19% Equity Organic Long-Term Net Flows ($ in billions) Public (Excludes Acquisitions) 37% funds $42 Liquidity 32% 35% $37 Institutional $36 products Americas $27 78% Separate 52% accounts Fixed 40% 38% Third-party $7 income distributed 10 2016 2017 2018 2019 2020 YTDFirmwide Assets Under Supervision 3,4 3,4 Firmwide Assets Under Supervision Assets Under Supervision Highlights By Segment vs. vs. n Firmwide AUS increased $239 billion during the quarter to a record $2.06 trillion, including Asset $ in billions 2Q20 1Q20 2Q19 1Q20 2Q19 Management AUS increasing $190 billion and Consumer & Wealth Management AUS increasing $49 billion Asset Management $ 1,499 $ 1,309 $ 1,171 15% 28% — Net market appreciation of $100 billion, primarily in equity and fixed income assets Consumer & Wealth Management 558 509 489 10% 14% — Liquidity products net inflows of $133 billion Firmwide AUS $ 2,057 $ 1,818 $ 1,660 13% 24% — Long-term net inflows of $6 billion By Asset Class vs. vs. $ in billions 2Q20 1Q20 2Q19 1Q20 2Q19 $ 179 $ 178 $ 174 1% 3% Alternative investments 394 335 350 18% 13% Equity Fixed income 817 771 749 6% 9% Long-term AUS 1,390 1,284 1,273 8% 9% 3,4 2Q20 AUS Mix Liquidity products 667 534 387 25% 72% Asset Distribution Region Vehicle Class $ 2,057 $ 1,818 $ 1,660 13% 24% Channel Firmwide AUS Private Alternative 8% 9% Asia 11% funds investments Wealth and other 27% 14% EMEA management 3,4 19% Equity Organic Long-Term Net Flows ($ in billions) Public (Excludes Acquisitions) 37% funds $42 Liquidity 32% 35% $37 Institutional $36 products Americas $27 78% Separate 52% accounts Fixed 40% 38% Third-party $7 income distributed 10 2016 2017 2018 2019 2020 YTD
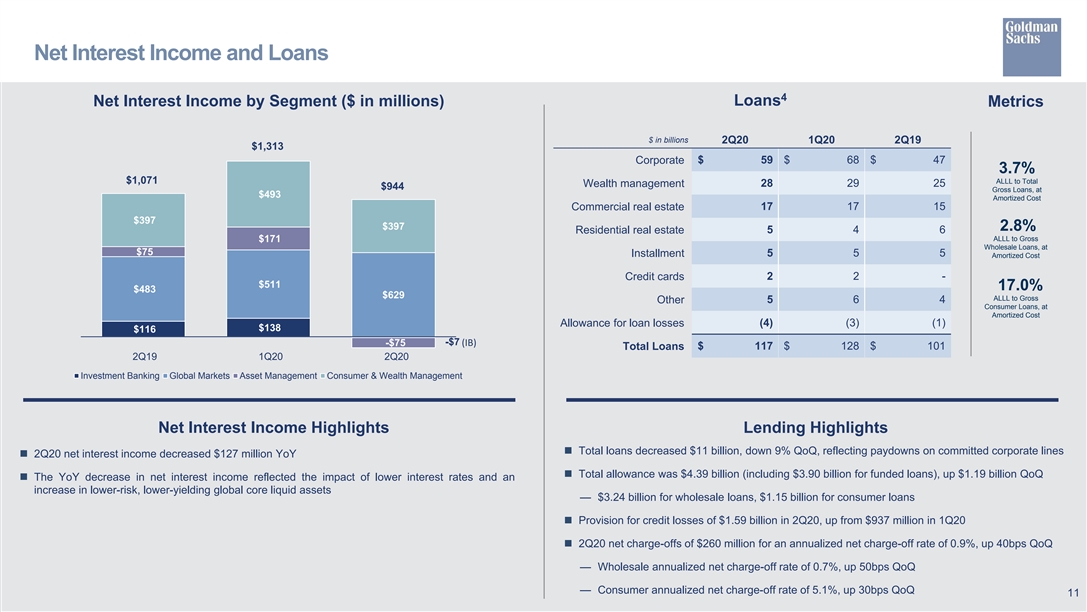
Net Interest Income and Loans 4 Net Interest Income by Segment ($ in millions) Loans Metrics $ in billions 2Q20 1Q20 2Q19 $1,313 Corporate $ 59 $ 68 $ 47 3.7% $1,071 ALLL to Total Wealth management 28 29 25 $944 Gross Loans, at $493 Amortized Cost Commercial real estate 17 17 15 $397 $397 2.8% 5 4 6 Residential real estate ALLL to Gross $171 Wholesale Loans, at $75 Installment 5 5 5 Amortized Cost Credit cards 2 2 - $511 17.0% $483 $629 ALLL to Gross Other 5 6 4 Consumer Loans, at Amortized Cost (4) (3) (1) Allowance for loan losses $138 $116 -$7 -$75 (IB) Total Loans $ 117 $ 128 $ 101 2Q19 1Q20 2Q20 Investment Banking Global Markets Asset Management Consumer & Wealth Management Net Interest Income Highlights Lending Highlights n Total loans decreased $11 billion, down 9% QoQ, reflecting paydowns on committed corporate lines n 2Q20 net interest income decreased $127 million YoY n Total allowance was $4.39 billion (including $3.90 billion for funded loans), up $1.19 billion QoQ n The YoY decrease in net interest income reflected the impact of lower interest rates and an increase in lower-risk, lower-yielding global core liquid assets — $3.24 billion for wholesale loans, $1.15 billion for consumer loans n Provision for credit losses of $1.59 billion in 2Q20, up from $937 million in 1Q20 n 2Q20 net charge-offs of $260 million for an annualized net charge-off rate of 0.9%, up 40bps QoQ — Wholesale annualized net charge-off rate of 0.7%, up 50bps QoQ — Consumer annualized net charge-off rate of 5.1%, up 30bps QoQ 11Net Interest Income and Loans 4 Net Interest Income by Segment ($ in millions) Loans Metrics $ in billions 2Q20 1Q20 2Q19 $1,313 Corporate $ 59 $ 68 $ 47 3.7% $1,071 ALLL to Total Wealth management 28 29 25 $944 Gross Loans, at $493 Amortized Cost Commercial real estate 17 17 15 $397 $397 2.8% 5 4 6 Residential real estate ALLL to Gross $171 Wholesale Loans, at $75 Installment 5 5 5 Amortized Cost Credit cards 2 2 - $511 17.0% $483 $629 ALLL to Gross Other 5 6 4 Consumer Loans, at Amortized Cost (4) (3) (1) Allowance for loan losses $138 $116 -$7 -$75 (IB) Total Loans $ 117 $ 128 $ 101 2Q19 1Q20 2Q20 Investment Banking Global Markets Asset Management Consumer & Wealth Management Net Interest Income Highlights Lending Highlights n Total loans decreased $11 billion, down 9% QoQ, reflecting paydowns on committed corporate lines n 2Q20 net interest income decreased $127 million YoY n Total allowance was $4.39 billion (including $3.90 billion for funded loans), up $1.19 billion QoQ n The YoY decrease in net interest income reflected the impact of lower interest rates and an increase in lower-risk, lower-yielding global core liquid assets — $3.24 billion for wholesale loans, $1.15 billion for consumer loans n Provision for credit losses of $1.59 billion in 2Q20, up from $937 million in 1Q20 n 2Q20 net charge-offs of $260 million for an annualized net charge-off rate of 0.9%, up 40bps QoQ — Wholesale annualized net charge-off rate of 0.7%, up 50bps QoQ — Consumer annualized net charge-off rate of 5.1%, up 30bps QoQ 11
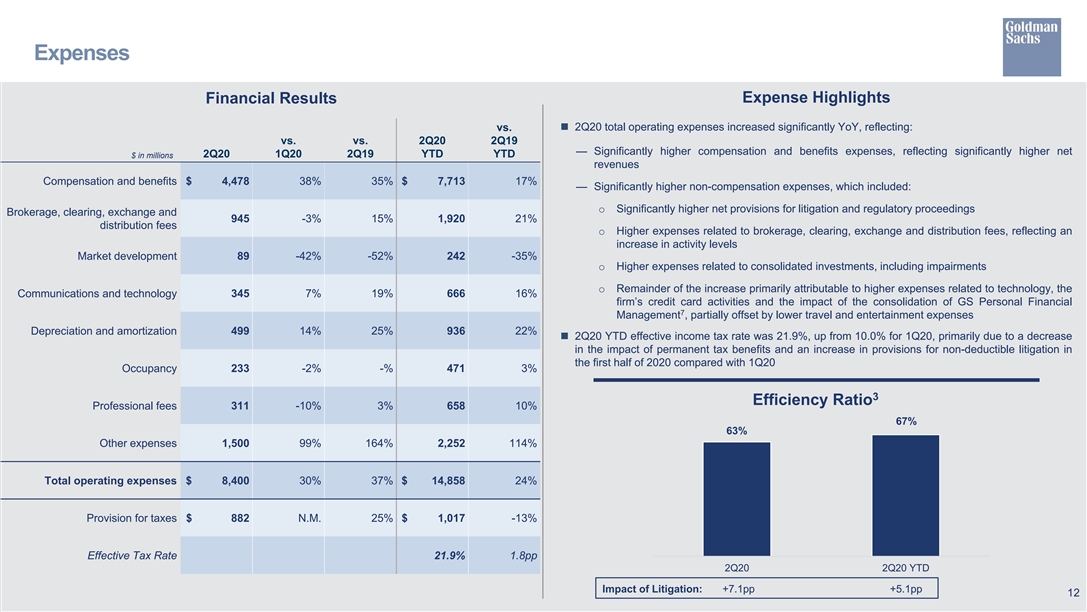
Expenses Expense Highlights Financial Results vs.n 2Q20 total operating expenses increased significantly YoY, reflecting: vs. vs. 2Q20 2Q19 — Significantly higher compensation and benefits expenses, reflecting significantly higher net $ in millions 2Q20 1Q20 2Q19 YTD YTD revenues Compensation and benefits $ 4,478 38% 35% $ 7,713 17% — Significantly higher non-compensation expenses, which included: o Significantly higher net provisions for litigation and regulatory proceedings Brokerage, clearing, exchange and 945 -3% 15% 1,920 21% distribution fees o Higher expenses related to brokerage, clearing, exchange and distribution fees, reflecting an increase in activity levels Market development 89 -42% -52% 242 -35% o Higher expenses related to consolidated investments, including impairments o Remainder of the increase primarily attributable to higher expenses related to technology, the Communications and technology 345 7% 19% 666 16% firm’s credit card activities and the impact of the consolidation of GS Personal Financial 7 Management , partially offset by lower travel and entertainment expenses Depreciation and amortization 499 14% 25% 936 22% n 2Q20 YTD effective income tax rate was 21.9%, up from 10.0% for 1Q20, primarily due to a decrease in the impact of permanent tax benefits and an increase in provisions for non-deductible litigation in the first half of 2020 compared with 1Q20 Occupancy 233 -2% -% 471 3% 3 Efficiency Ratio Professional fees 311 -10% 3% 658 10% 67% 63% Other expenses 1,500 99% 164% 2,252 114% Total operating expenses $ 8,400 30% 37% $ 14,858 24% Provision for taxes $ 882 N.M. 25% $ 1,017 -13% Effective Tax Rate 21.9% 1.8pp 2Q20 2Q20 YTD Impact of Litigation: +7.1pp +5.1pp 12Expenses Expense Highlights Financial Results vs.n 2Q20 total operating expenses increased significantly YoY, reflecting: vs. vs. 2Q20 2Q19 — Significantly higher compensation and benefits expenses, reflecting significantly higher net $ in millions 2Q20 1Q20 2Q19 YTD YTD revenues Compensation and benefits $ 4,478 38% 35% $ 7,713 17% — Significantly higher non-compensation expenses, which included: o Significantly higher net provisions for litigation and regulatory proceedings Brokerage, clearing, exchange and 945 -3% 15% 1,920 21% distribution fees o Higher expenses related to brokerage, clearing, exchange and distribution fees, reflecting an increase in activity levels Market development 89 -42% -52% 242 -35% o Higher expenses related to consolidated investments, including impairments o Remainder of the increase primarily attributable to higher expenses related to technology, the Communications and technology 345 7% 19% 666 16% firm’s credit card activities and the impact of the consolidation of GS Personal Financial 7 Management , partially offset by lower travel and entertainment expenses Depreciation and amortization 499 14% 25% 936 22% n 2Q20 YTD effective income tax rate was 21.9%, up from 10.0% for 1Q20, primarily due to a decrease in the impact of permanent tax benefits and an increase in provisions for non-deductible litigation in the first half of 2020 compared with 1Q20 Occupancy 233 -2% -% 471 3% 3 Efficiency Ratio Professional fees 311 -10% 3% 658 10% 67% 63% Other expenses 1,500 99% 164% 2,252 114% Total operating expenses $ 8,400 30% 37% $ 14,858 24% Provision for taxes $ 882 N.M. 25% $ 1,017 -13% Effective Tax Rate 21.9% 1.8pp 2Q20 2Q20 YTD Impact of Litigation: +7.1pp +5.1pp 12
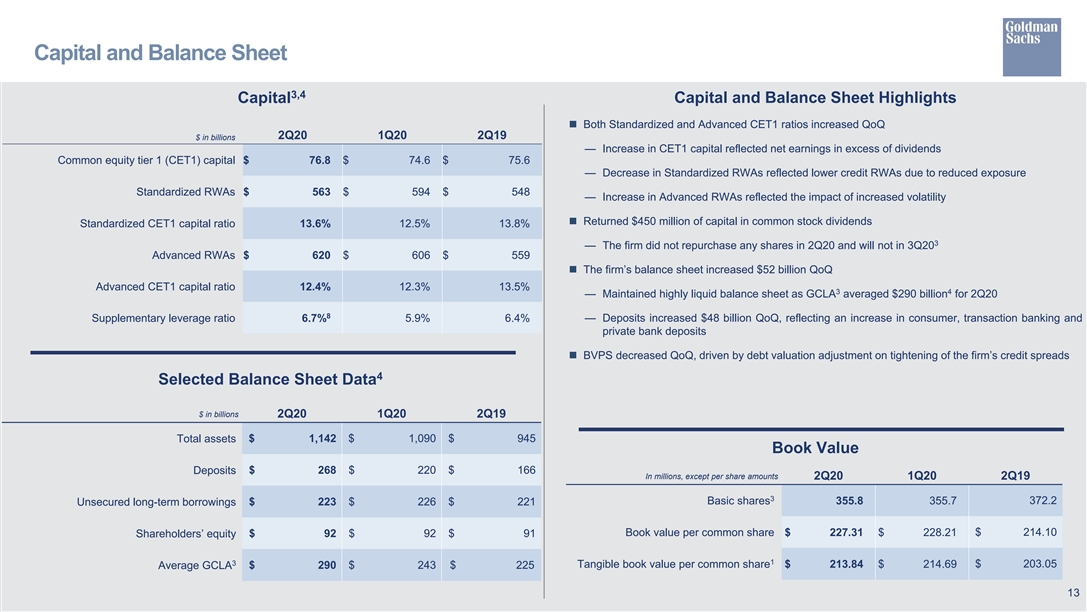
Capital and Balance Sheet 3,4 Capital Capital and Balance Sheet Highlights n Both Standardized and Advanced CET1 ratios increased QoQ 2Q20 1Q20 2Q19 $ in billions — Increase in CET1 capital reflected net earnings in excess of dividends Common equity tier 1 (CET1) capital $ 76.8 $ 74.6 $ 75.6 — Decrease in Standardized RWAs reflected lower credit RWAs due to reduced exposure Standardized RWAs $ 563 $ 594 $ 548 — Increase in Advanced RWAs reflected the impact of increased volatility n Returned $450 million of capital in common stock dividends Standardized CET1 capital ratio 13.6% 12.5% 13.8% 3 — The firm did not repurchase any shares in 2Q20 and will not in 3Q20 Advanced RWAs $ 620 $ 606 $ 559 n The firm’s balance sheet increased $52 billion QoQ Advanced CET1 capital ratio 12.4% 12.3% 13.5% 3 4 — Maintained highly liquid balance sheet as GCLA averaged $290 billion for 2Q20 8 Supplementary leverage ratio 6.7% 5.9% 6.4% — Deposits increased $48 billion QoQ, reflecting an increase in consumer, transaction banking and private bank deposits n BVPS decreased QoQ, driven by debt valuation adjustment on tightening of the firm’s credit spreads 4 Selected Balance Sheet Data $ in billions 2Q20 1Q20 2Q19 Total assets $ 1,142 $ 1,090 $ 945 Book Value Deposits $ 268 $ 220 $ 166 In millions, except per share amounts 2Q20 1Q20 2Q19 3 Basic shares 355.8 355.7 372.2 Unsecured long-term borrowings $ 223 $ 226 $ 221 Book value per common share $ 227.31 $ 228.21 $ 214.10 Shareholders’ equity $ 92 $ 92 $ 91 1 3 Tangible book value per common share $ 213.84 $ 214.69 $ 203.05 Average GCLA $ 290 $ 243 $ 225 13Capital and Balance Sheet 3,4 Capital Capital and Balance Sheet Highlights n Both Standardized and Advanced CET1 ratios increased QoQ 2Q20 1Q20 2Q19 $ in billions — Increase in CET1 capital reflected net earnings in excess of dividends Common equity tier 1 (CET1) capital $ 76.8 $ 74.6 $ 75.6 — Decrease in Standardized RWAs reflected lower credit RWAs due to reduced exposure Standardized RWAs $ 563 $ 594 $ 548 — Increase in Advanced RWAs reflected the impact of increased volatility n Returned $450 million of capital in common stock dividends Standardized CET1 capital ratio 13.6% 12.5% 13.8% 3 — The firm did not repurchase any shares in 2Q20 and will not in 3Q20 Advanced RWAs $ 620 $ 606 $ 559 n The firm’s balance sheet increased $52 billion QoQ Advanced CET1 capital ratio 12.4% 12.3% 13.5% 3 4 — Maintained highly liquid balance sheet as GCLA averaged $290 billion for 2Q20 8 Supplementary leverage ratio 6.7% 5.9% 6.4% — Deposits increased $48 billion QoQ, reflecting an increase in consumer, transaction banking and private bank deposits n BVPS decreased QoQ, driven by debt valuation adjustment on tightening of the firm’s credit spreads 4 Selected Balance Sheet Data $ in billions 2Q20 1Q20 2Q19 Total assets $ 1,142 $ 1,090 $ 945 Book Value Deposits $ 268 $ 220 $ 166 In millions, except per share amounts 2Q20 1Q20 2Q19 3 Basic shares 355.8 355.7 372.2 Unsecured long-term borrowings $ 223 $ 226 $ 221 Book value per common share $ 227.31 $ 228.21 $ 214.10 Shareholders’ equity $ 92 $ 92 $ 91 1 3 Tangible book value per common share $ 213.84 $ 214.69 $ 203.05 Average GCLA $ 290 $ 243 $ 225 13
Cautionary Note Regarding Forward-Looking Statements This presentation contains “forward-looking statements” within the meaning of the safe harbor provisions of the U.S. Private Securities Litigation Reform Act of 1995. Forward-looking statements are not historical facts, but instead represent only the firm’s beliefs regarding future events, many of which, by their nature, are inherently uncertain and outside of the firm’s control. It is possible that the firm’s actual results, financial condition and liquidity may differ, possibly materially, from the anticipated results, financial condition and liquidity indicated in these statements. For information about some of the risks and important factors that could affect the firm’s future results, financial condition and liquidity and the forward-looking statements below, see “Risk Factors” in Part II, Item 1A of the firm’s Quarterly Report on Form 10-Q for the period ended March 31, 2020 and in Part I, Item 1A of the firm’s Annual Report on Form 10-K for the year ended December 31, 2019. Information regarding the firm’s assets under supervision, capital ratios, risk-weighted assets, supplementary leverage ratio, balance sheet data and global core liquid assets (GCLA) consists of preliminary estimates. These estimates are forward-looking statements and are subject to change, possibly materially, as the firm completes its financial statements. Statements regarding (i) estimated GDP growth, (ii) the impact of the COVID-19 pandemic on the firm’s business, results, financial position and liquidity, (iii) the timing, profitability, benefits and other prospective aspects of business initiatives and the achievability of medium- and long-term targets and goals, (iv) the future state of the firm’s liquidity and regulatory capital ratios, (v) the firm’s prospective capital distributions (including dividends), (vi) the firm’s future effective income tax rate, and (vii) the firm’s investment banking transaction backlog are forward-looking statements. Statements regarding estimated GDP growth are subject to the risk that actual GDP growth may differ, possibly materially, due to, among other things, changes in general economic conditions. Statements about the effects of the COVID-19 pandemic on the firm’s business, results, financial position and liquidity are subject to the risk that the actual impact may differ, possibly materially, from what is currently expected. Statements about the timing, profitability, benefits and other prospective aspects of business initiatives and the achievability of medium and long-term targets and goals are based on the firm’s current expectations regarding our ability to implement these initiatives and achieve these targets and goals and may change, possibly materially, from what is currently expected. Statements about the future state of the firm’s liquidity and regulatory capital ratios, as well as its prospective capital distributions, are subject to the risk that the firm’s actual liquidity, regulatory capital ratios and capital distributions may differ, possibly materially, from what is currently expected. Statements about the firm’s future effective income tax rate are subject to the risk that the firm’s future effective income tax rate may differ from the anticipated rate indicated, possibly materially, due to, among other things, changes in the firm’s earnings mix or profitability, the entities in which the firm generates profits and the assumptions made in forecasting the firm’s expected tax rate, and potential future guidance from the U.S. IRS. Statements about the firm’s investment banking transaction backlog are subject to the risk that transactions may be modified or not completed at all and associated net revenues may not be realized or may be materially less than those currently expected. Important factors that could have such a result include, for underwriting transactions, a decline or weakness in general economic conditions, an outbreak of hostilities, volatility in the securities markets or an adverse development with respect to the issuer of the securities and, for financial advisory transactions, a decline in the securities markets, an inability to obtain adequate financing, an adverse development with respect to a party to the transaction or a failure to obtain a required regulatory approval. 14Cautionary Note Regarding Forward-Looking Statements This presentation contains “forward-looking statements” within the meaning of the safe harbor provisions of the U.S. Private Securities Litigation Reform Act of 1995. Forward-looking statements are not historical facts, but instead represent only the firm’s beliefs regarding future events, many of which, by their nature, are inherently uncertain and outside of the firm’s control. It is possible that the firm’s actual results, financial condition and liquidity may differ, possibly materially, from the anticipated results, financial condition and liquidity indicated in these statements. For information about some of the risks and important factors that could affect the firm’s future results, financial condition and liquidity and the forward-looking statements below, see “Risk Factors” in Part II, Item 1A of the firm’s Quarterly Report on Form 10-Q for the period ended March 31, 2020 and in Part I, Item 1A of the firm’s Annual Report on Form 10-K for the year ended December 31, 2019. Information regarding the firm’s assets under supervision, capital ratios, risk-weighted assets, supplementary leverage ratio, balance sheet data and global core liquid assets (GCLA) consists of preliminary estimates. These estimates are forward-looking statements and are subject to change, possibly materially, as the firm completes its financial statements. Statements regarding (i) estimated GDP growth, (ii) the impact of the COVID-19 pandemic on the firm’s business, results, financial position and liquidity, (iii) the timing, profitability, benefits and other prospective aspects of business initiatives and the achievability of medium- and long-term targets and goals, (iv) the future state of the firm’s liquidity and regulatory capital ratios, (v) the firm’s prospective capital distributions (including dividends), (vi) the firm’s future effective income tax rate, and (vii) the firm’s investment banking transaction backlog are forward-looking statements. Statements regarding estimated GDP growth are subject to the risk that actual GDP growth may differ, possibly materially, due to, among other things, changes in general economic conditions. Statements about the effects of the COVID-19 pandemic on the firm’s business, results, financial position and liquidity are subject to the risk that the actual impact may differ, possibly materially, from what is currently expected. Statements about the timing, profitability, benefits and other prospective aspects of business initiatives and the achievability of medium and long-term targets and goals are based on the firm’s current expectations regarding our ability to implement these initiatives and achieve these targets and goals and may change, possibly materially, from what is currently expected. Statements about the future state of the firm’s liquidity and regulatory capital ratios, as well as its prospective capital distributions, are subject to the risk that the firm’s actual liquidity, regulatory capital ratios and capital distributions may differ, possibly materially, from what is currently expected. Statements about the firm’s future effective income tax rate are subject to the risk that the firm’s future effective income tax rate may differ from the anticipated rate indicated, possibly materially, due to, among other things, changes in the firm’s earnings mix or profitability, the entities in which the firm generates profits and the assumptions made in forecasting the firm’s expected tax rate, and potential future guidance from the U.S. IRS. Statements about the firm’s investment banking transaction backlog are subject to the risk that transactions may be modified or not completed at all and associated net revenues may not be realized or may be materially less than those currently expected. Important factors that could have such a result include, for underwriting transactions, a decline or weakness in general economic conditions, an outbreak of hostilities, volatility in the securities markets or an adverse development with respect to the issuer of the securities and, for financial advisory transactions, a decline in the securities markets, an inability to obtain adequate financing, an adverse development with respect to a party to the transaction or a failure to obtain a required regulatory approval. 14
Footnotes 1. Annualized return on average common shareholders’ equity (ROE) is calculated by dividing annualized net earnings applicable to common shareholders by average monthly common shareholders’ equity. Annualized return on average tangible common shareholders’ equity (ROTE) is calculated by dividing annualized net earnings applicable to common shareholders by average monthly tangible common shareholders’ equity. Tangible common shareholders’ equity is calculated as total shareholders’ equity less preferred stock, goodwill and identifiable intangible assets. Tangible book value per common share (TBVPS) is calculated by dividing tangible common shareholders’ equity by basic shares. Management believes that tangible common shareholders’ equity and TBVPS are meaningful because they are measures that the firm and investors use to assess capital adequacy and that ROTE is meaningful because it measures the performance of businesses consistently, whether they were acquired or developed internally. Tangible common shareholders’ equity, ROTE and TBVPS are non-GAAP measures and may not be comparable to similar non-GAAP measures used by other companies. The table below presents a reconciliation of average and ending common shareholders’ equity to average and ending tangible common shareholders’ equity: AVERAGE FOR THE AS OF THREE MONTHS ENDED SIX MONTHS ENDED Unaudited, $ in millions JUNE 30, 2020 JUNE 30, 2020 JUNE 30, 2020 MARCH 31, 2020 JUNE 30, 2019 Total shareholders’ equity $ 92,315 $ 91,249 $ 92,079 $ 92,379 $ 90,892 Preferred stock (11,203) (11,203) (11,203) (11,203) (11,203) Common shareholders’ equity 81,112 80,046 80,876 81,176 79,689 Goodwill and identifiable intangible assets (4,806) (4,814) (4,792) (4,810) (4,114) Tangible common shareholders’ equity $ 76,306 $ 75,232 $ 76,084 $ 76,366 $ 75,575 2. Dealogic – January 1, 2020 through June 30, 2020. 3. For information about the following items, see the referenced sections in Part I, Item 2 “Management’s Discussion and Analysis of Financial Condition and Results of Operations” in the firm’s Quarterly Report on Form 10-Q for the period ended March 31, 2020: (i) investment banking transaction backlog – see “Results of Operations – Investment Banking” (ii) assets under supervision – see “Results of Operations – Assets Under Supervision” (iii) efficiency ratio – see “Results of Operations – Operating Expenses” (iv) basic shares – see “Balance Sheet and Funding Sources – Balance Sheet Analysis and Metrics” (v) share repurchase program – see “Equity Capital Management and Regulatory Capital – Equity Capital Management” and (vi) global core liquid assets – see “Risk Management – Liquidity Risk Management.” For information about risk-based capital ratios and the supplementary leverage ratio, see Note 20 “Regulation and Capital Adequacy” in Part I, Item 1 “Financial Statements (Unaudited)” in the firm’s Quarterly Report on Form 10-Q for the period ended March 31, 2020. 4. Represents a preliminary estimate for the second quarter of 2020 and may be revised in the firm’s Quarterly Report on Form 10-Q for the period ended June 30, 2020. 5. In the first quarter of 2020, the firm adopted ASU No. 2016-13, Financial Instruments - Credit Losses (Topic 326) – Measurement of Credit Losses on Financial Instruments. For further information about ASU No. 2016-13, see Note 3 Significant Accounting Policies in Part I, Item 1 Financial Statements (Unaudited) in the firm's Quarterly Report on Form 10-Q for the period ended March 31, 2020. 6. Includes consolidated investment entities, substantially all of which related to entities engaged in real estate investment activities. These assets are generally accounted for at historical cost less depreciation. 7. GS Personal Financial Management, formerly United Capital Financial Partners, Inc., was acquired by the firm in the third quarter of 2019. 8. In the second quarter of 2020, the U.S. Federal Reserve revised the calculation of the supplementary leverage ratio to exclude U.S. Treasury securities and cash held at the U.S. Federal Reserve. The estimated impact of this change was an increase in the firm’s supplementary leverage ratio of approximately 0.8 percentage points. 15Footnotes 1. Annualized return on average common shareholders’ equity (ROE) is calculated by dividing annualized net earnings applicable to common shareholders by average monthly common shareholders’ equity. Annualized return on average tangible common shareholders’ equity (ROTE) is calculated by dividing annualized net earnings applicable to common shareholders by average monthly tangible common shareholders’ equity. Tangible common shareholders’ equity is calculated as total shareholders’ equity less preferred stock, goodwill and identifiable intangible assets. Tangible book value per common share (TBVPS) is calculated by dividing tangible common shareholders’ equity by basic shares. Management believes that tangible common shareholders’ equity and TBVPS are meaningful because they are measures that the firm and investors use to assess capital adequacy and that ROTE is meaningful because it measures the performance of businesses consistently, whether they were acquired or developed internally. Tangible common shareholders’ equity, ROTE and TBVPS are non-GAAP measures and may not be comparable to similar non-GAAP measures used by other companies. The table below presents a reconciliation of average and ending common shareholders’ equity to average and ending tangible common shareholders’ equity: AVERAGE FOR THE AS OF THREE MONTHS ENDED SIX MONTHS ENDED Unaudited, $ in millions JUNE 30, 2020 JUNE 30, 2020 JUNE 30, 2020 MARCH 31, 2020 JUNE 30, 2019 Total shareholders’ equity $ 92,315 $ 91,249 $ 92,079 $ 92,379 $ 90,892 Preferred stock (11,203) (11,203) (11,203) (11,203) (11,203) Common shareholders’ equity 81,112 80,046 80,876 81,176 79,689 Goodwill and identifiable intangible assets (4,806) (4,814) (4,792) (4,810) (4,114) Tangible common shareholders’ equity $ 76,306 $ 75,232 $ 76,084 $ 76,366 $ 75,575 2. Dealogic – January 1, 2020 through June 30, 2020. 3. For information about the following items, see the referenced sections in Part I, Item 2 “Management’s Discussion and Analysis of Financial Condition and Results of Operations” in the firm’s Quarterly Report on Form 10-Q for the period ended March 31, 2020: (i) investment banking transaction backlog – see “Results of Operations – Investment Banking” (ii) assets under supervision – see “Results of Operations – Assets Under Supervision” (iii) efficiency ratio – see “Results of Operations – Operating Expenses” (iv) basic shares – see “Balance Sheet and Funding Sources – Balance Sheet Analysis and Metrics” (v) share repurchase program – see “Equity Capital Management and Regulatory Capital – Equity Capital Management” and (vi) global core liquid assets – see “Risk Management – Liquidity Risk Management.” For information about risk-based capital ratios and the supplementary leverage ratio, see Note 20 “Regulation and Capital Adequacy” in Part I, Item 1 “Financial Statements (Unaudited)” in the firm’s Quarterly Report on Form 10-Q for the period ended March 31, 2020. 4. Represents a preliminary estimate for the second quarter of 2020 and may be revised in the firm’s Quarterly Report on Form 10-Q for the period ended June 30, 2020. 5. In the first quarter of 2020, the firm adopted ASU No. 2016-13, Financial Instruments - Credit Losses (Topic 326) – Measurement of Credit Losses on Financial Instruments. For further information about ASU No. 2016-13, see Note 3 Significant Accounting Policies in Part I, Item 1 Financial Statements (Unaudited) in the firm's Quarterly Report on Form 10-Q for the period ended March 31, 2020. 6. Includes consolidated investment entities, substantially all of which related to entities engaged in real estate investment activities. These assets are generally accounted for at historical cost less depreciation. 7. GS Personal Financial Management, formerly United Capital Financial Partners, Inc., was acquired by the firm in the third quarter of 2019. 8. In the second quarter of 2020, the U.S. Federal Reserve revised the calculation of the supplementary leverage ratio to exclude U.S. Treasury securities and cash held at the U.S. Federal Reserve. The estimated impact of this change was an increase in the firm’s supplementary leverage ratio of approximately 0.8 percentage points. 15