As filed with the Securities and Exchange Commission on July 13, 2020
Registration No. 333-239291
| file | filename |
|---|---|
| EX-23.2 - EXHIBIT 23.2 - Trean Insurance Group, Inc. | nt10008305x10_ex23-2.htm |
| EX-23.1 - EXHIBIT 23.1 - Trean Insurance Group, Inc. | nt10008305x10_ex23-1.htm |
| EX-10.1 - EXHIBIT 10.1 - Trean Insurance Group, Inc. | nt10008305x10_ex10-1.htm |
| EX-5.1 - EXHIBIT 5.1 - Trean Insurance Group, Inc. | nt10008305x10_ex5-1.htm |
| EX-3.2 - EXHIBIT 3.2 - Trean Insurance Group, Inc. | nt10008305x10_ex3-2.htm |
| EX-3.1 - EXHIBIT 3.1 - Trean Insurance Group, Inc. | nt10008305x10_ex3-1.htm |
| EX-1.1 - EXHIBIT 1.1 - Trean Insurance Group, Inc. | nt10008305x10_ex1-1.htm |
Delaware | | | 6331 | | | 84-4512647 |
(State or other jurisdiction of incorporation or organization) | | | (Primary Standard Industrial Classification Code Number) | | | (I.R.S. Employer Identification Number) |
Dwight S. Yoo Skadden, Arps, Slate, Meagher & Flom LLP One Manhattan West New York, New York 10001 (212) 735-3000 | | | Richard D. Truesdell, Jr. Shane Tintle Davis Polk & Wardwell LLP 450 Lexington Avenue New York, New York 10017 (212) 450-4000 |
Large accelerated filer | | | ☐ | | | Accelerated filer | | | ☐ |
Non-accelerated filer | | | ☒ | | | Smaller reporting company | | | ☐ |
| | | | | Emerging growth company | | | ☒ |
| | | Per Share | | | Total | |
Initial public offering price | | | $ | | | $ |
Underwriting discounts and commissions(1) | | | $ | | | $ |
Proceeds, before expenses, to us | | | $ | | | $ |
Proceeds, before expenses, to the selling stockholders | | | $ | | | $ |
(1) | See “Underwriting” for a description of the compensation payable to the underwriters. |
Joint Book-Running Managers | ||||||
J.P. Morgan | | | Evercore ISI | | | William Blair |
Co-Manager | |||
JMP Securities |
| | | Page | |
| | | ||
| | | ||
| | | ||
| | | ||
| | | ||
| | | ||
| | | ||
| | | ||
| | | ||
| | | ||
| | | ||
| | | ||
| | | ||
| | | ||
| | | ||
| | | ||
| | | ||
| | | ||
| | | ||
| | | ||
| | | ||
| | | ||
| | | ||
| | | ||
| | |
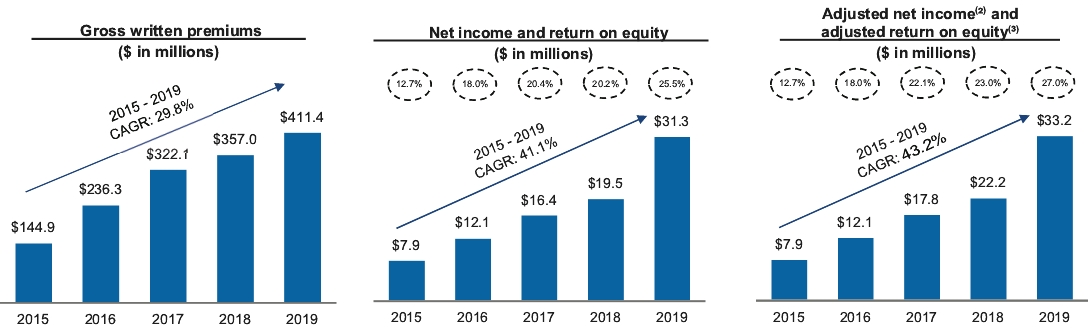
(1) | Return on tangible equity is a non-GAAP financial measure. See “Management’s discussion and analysis of financial condition and results of operations — Reconciliation of non-GAAP financial measures” for a reconciliation of return on tangible equity to return on equity in accordance with U.S. generally accepted accounting principles (“GAAP”). |
(2) | Adjusted net income is a non-GAAP financial measure. See “Management’s discussion and analysis of financial condition and results of operations — Reconciliation of non-GAAP financial measures” for a reconciliation of adjusted net income to net income in accordance with GAAP. |
(3) | Adjusted return on equity is a non-GAAP financial measure defined as adjusted net income expressed on an annualized basis as a percentage of average beginning and ending members’ equity during the period. See “Management’s discussion and analysis of financial condition and results of operations — Reconciliation of non-GAAP financial measures” for a reconciliation of adjusted return on equity to return on equity in accordance with GAAP. |
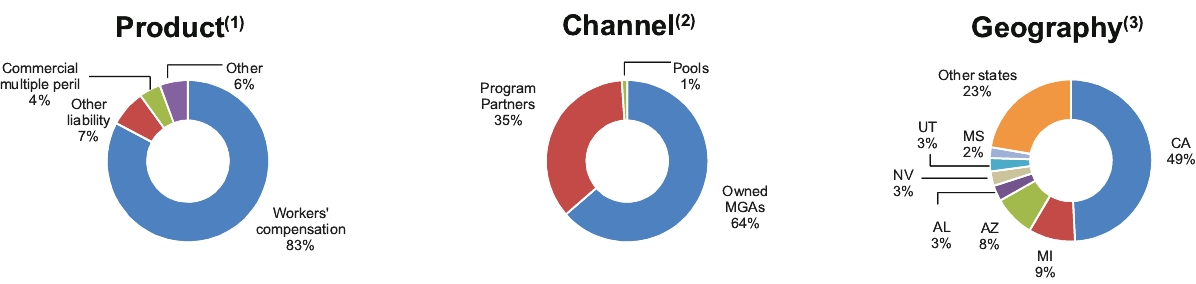
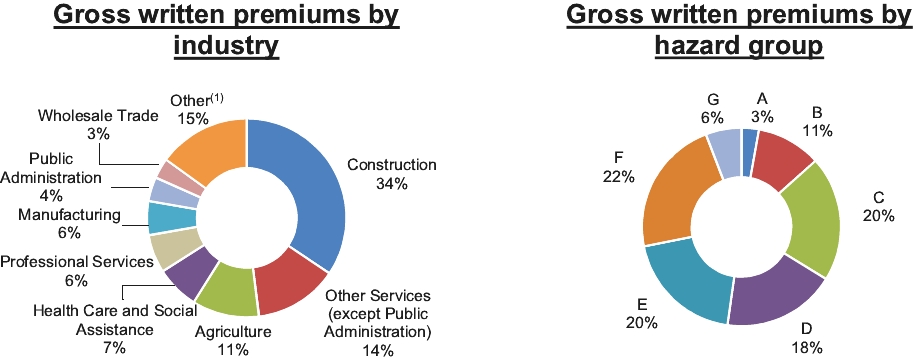
(1) | Other includes group accident & health, commercial auto liability, auto physical damage, private passenger auto liability, boiler and machinery, surety, fire and inland marine. |
(2) | Pools are state insurance pools. |
(3) | Other states include Montana, Tennessee, New Jersey and other U.S. geographical areas. |
• | failure of our Program Partners or our Owned MGAs to properly market, underwrite or administer policies could adversely affect us; |
• | we depend on a limited number of Program Partners for a substantial portion of our gross written premiums; |
• | more than half of our gross written premiums are written in three key states; |
• | a downgrade in the A.M. Best financial strength ratings of our insurance company subsidiaries may negatively affect our business; |
• | if we are unable to accurately underwrite risks and charge competitive yet profitable rates to our clients and policyholders, our business, financial condition and results of operations may be materially and adversely affected; |
• | adverse economic factors, including recession, inflation, periods of high unemployment or lower economic activity could result in the sale of fewer policies than expected or an increase in frequency or severity of claims and premium defaults or both, which, in turn, could affect our growth and profitability; |
• | negative developments in the workers’ compensation insurance industry could adversely affect our business, financial condition and results of operations; |
• | our failure to accurately and timely pay claims could harm our business; |
• | we are subject to reinsurance counterparty credit risk and our reinsurers may not pay on losses in a timely fashion, or at all; |
• | if we are unable to obtain reinsurance coverage at reasonable prices or on terms that adequately protect us, we may be required to bear increased risks or reduce the level of our underwriting commitments; |
• | retention of business written by our Program Partners could expose us to potential losses; |
• | our loss reserves may be inadequate to cover our actual losses; |
• | we may not be able to manage our growth effectively; |
• | any shift in our investment strategy could increase the riskiness of our investment portfolio and the volatility of our results, which, in turn, may adversely affect our profitability; |
• | our results of operations, liquidity, financial condition and FSRs are subject to the effects of natural and man-made catastrophic events; |
• | disruptions related to COVID-19, including economic impacts of the COVID-19-related governmental actions, could materially and adversely affect our business, financial condition and results of operations; |
• | because our business depends on insurance brokers, we are exposed to certain risks arising out of our reliance on these distribution channels that could adversely affect our results; |
• | regulators may challenge our use of fronting arrangements in states in which our Program Partners are not licensed; |
• | our principal stockholders will be able to exert significant influence over us and our corporate decisions; |
• | our principal stockholders could sell their interests in us to a third party in a private transaction, which may result in your not realizing any change-of-control premium on your shares and subject us to the influence of a currently unknown third party; and |
• | we will incur significant increased costs as a result of operating as a public company, and operating as a public company will place additional demands on our management. |
• | we may present as few as two years of audited financial statements and two years of related management’s discussion and analysis of financial condition and results of operations in this prospectus; |
• | we are exempt from the requirement to obtain an attestation report from our auditors on management’s assessment of our internal control over financial reporting under the Sarbanes-Oxley Act of 2002 for up to five years or until we no longer qualify as an emerging growth company; |
• | we are permitted to provide reduced disclosure regarding our executive compensation arrangements pursuant to the rules applicable to smaller reporting companies, which means we do not have to include a compensation discussion and analysis and certain other disclosures regarding our executive compensation; and |
• | we are not required to hold non-binding advisory votes on executive compensation. |
• | assumes that the initial public offering price of the common stock will be $14.00 per share (the midpoint of the price range set forth on the cover of this prospectus); |
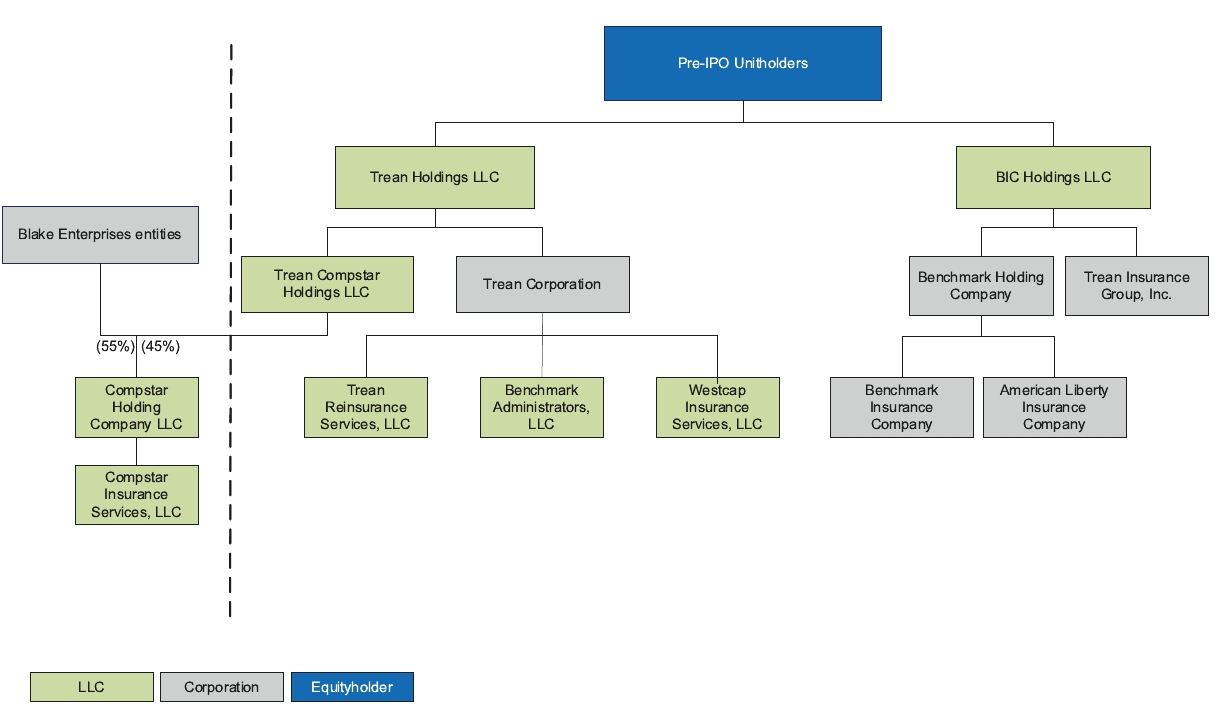
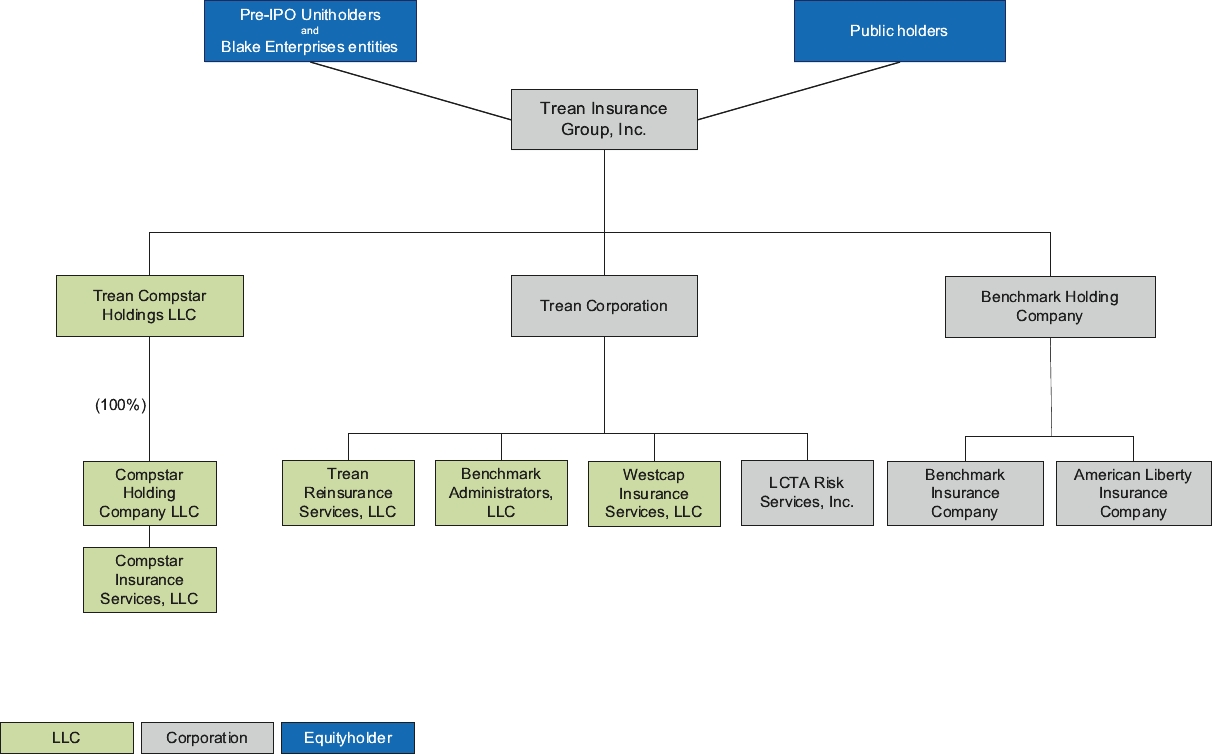
• | gives effect to the completion of the reorganization transactions; and |
• | assumes no exercise of the option granted to the underwriters to purchase up to an additional 1,607,142 shares of our common stock to cover over-allotments. |
| | | Three months ended March 31, | | | Year ended December 31, | |||||||
| | | 2020 | | | 2019 | | | 2019 | | | 2018 | |
| | | (in thousands) | ||||||||||
Revenues: | | | | | | | | | ||||
Gross written premiums | | | $107,859 | | | $101,534 | | | $411,401 | | | $357,007 |
Increase in gross unearned premiums | | | (7,373) | | | (10,952) | | | (13,598) | | | (16,862) |
Gross earned premiums | | | 100,486 | | | 90,582 | | | 397,803 | | | 340,145 |
Ceded earned premiums | | | (78,027) | | | (70,958) | | | (311,325) | | | (273,569) |
Net earned premiums | | | 22,459 | | | 19,624 | | | 86,478 | | | 66,576 |
Net investment income | | | 3,272 | | | 1,287 | | | 6,245 | | | 4,816 |
Net realized capital gains (losses) | | | 3,234 | | | 612 | | | 667 | | | (715) |
Other revenue | | | 4,392 | | | 3,595 | | | 9,125 | | | 7,826 |
Total revenue | | | 33,357 | | | 25,118 | | | 102,515 | | | 78,503 |
| | | | | | | | | |||||
Expenses: | | | | | | | | | ||||
Losses and loss adjustment expenses | | | 12,934 | | | 11,456 | | | 44,661 | | | 35,729 |
General and administrative expenses | | | 8,160 | | | 3,969 | | | 21,005 | | | 15,706 |
Interest expense | | | 461 | | | 624 | | | 2,169 | | | 1,557 |
Total expenses | | | 21,555 | | | 16,049 | | | 67,835 | | | 52,992 |
| | | | | | | | | |||||
Other income | | | 14 | | | 93 | | | 121 | | | 639 |
Income before taxes | | | 11,816 | | | 9,162 | | | 34,801 | | | 26,150 |
| | | | | | | | | |||||
Provision for income taxes | | | 2,912 | | | 1,319 | | | 7,074 | | | 5,546 |
Equity earnings (losses) in affiliates, net of tax | | | 702 | | | 608 | | | 3,558 | | | (1,082) |
Net income | | | $9,606 | | | $8,451 | | | $31,285 | | | $19,522 |
Adjusted net income(1) | | | $6,602 | | | $8,369 | | | $33,194 | | | $22,197 |
| | | Three months ended March 31, 2020 | | | Year ended December 31, 2019 | |
Pro forma per share data(2): | | | | | ||
Pro forma earnings (loss) per share outstanding | | | | | ||
Basic and diluted | | | $0.20 | | | $0.68 |
Pro forma weighted average shares outstanding | | | | | ||
Basic and diluted | | | 51,142,857 | | | 51,142,857 |
(1) | Adjusted net income is a non-GAAP financial measure. See “Management’s discussion and analysis of financial condition and results of operations — Reconciliation of non-GAAP financial measures” for a reconciliation of adjusted net income to net income in accordance with GAAP. |
(2) | Pro forma earnings per share outstanding gives pro forma effect to: (a) the issuance of 37,386,394 shares of our common stock to Trean Holdings and BIC Holdings in exchange for the contribution of all of their respective assets and liabilities to Trean Insurance Group, Inc., (b) the issuance of 6,613,606 shares of our common stock in connection with the acquisition from the Blake Enterprises entities of their 55% equity interest in Compstar, (c) the issuance of 7,142,857 shares of our common stock by us in the IPO and (d) equity in the net income of Compstar (net of tax) for the 55% that we do not currently own as if we had owned 100% of Compstar at the beginning of the period. See “Organizational structure.” See “Selected historical combined financial and other data” for the calculation of pro forma earnings per share outstanding. |
| | | At March 31, 2020 | | | At December 31, | ||||
| | | 2019 | | | 2018 | ||||
| | | (in thousands) | |||||||
Balance sheet data: | | | | | | | |||
Accrued investment income | | | $2,420 | | | $2,468 | | | $2,372 |
Premiums and other receivables | | | 67,773 | | | 62,460 | | | 62,400 |
Related party receivables | | | 21,871 | | | 22,221 | | | 15,934 |
Reinsurance recoverable | | | 313,760 | | | 307,338 | | | 257,509 |
Prepaid reinsurance premiums | | | 83,694 | | | 80,088 | | | 66,765 |
Deferred policy acquisition cost, net | | | 3,103 | | | 2,115 | | | 2,976 |
Property and equipment, net | | | 8,238 | | | 7,937 | | | 8,134 |
Deferred tax asset | | | 1,280 | | | 1,367 | | | 1,823 |
Goodwill | | | 2,822 | | | 2,822 | | | 2,822 |
Other assets | | | 7,572 | | | 3,277 | | | 1,963 |
Total assets | | | 954,583 | | | 919,034 | | | 800,119 |
Unpaid loss and loss adjustment expenses | | | 418,757 | | | 406,716 | | | 340,415 |
Unearned premiums | | | 111,162 | | | 103,789 | | | 90,074 |
Funds held under reinsurance agreements | | | 165,018 | | | 163,445 | | | 166,838 |
Reinsurance premiums payable | | | 48,099 | | | 53,620 | | | 40,135 |
Accounts payable and accrued expenses | | | 18,360 | | | 14,995 | | | 15,004 |
Total liabilities | | | 799,302 | | | 772,319 | | | 688,988 |
Redeemable preferred stock | | | 5,100 | | | 5,100 | | | 6,000 |
Total members’ equity | | | 150,181 | | | 141,615 | | | 105,131 |
Total liabilities and members’ equity | | | 954,583 | | | 919,034 | | | 800,119 |
| | | Three months ended March 31, | | | Year ended December 31, | |||||||
| | | 2020 | | | 2019 | | | 2019 | | | 2018 | |
Underwriting and other ratios: | | | | | | | | | ||||
Loss ratio(1) | | | 57.6% | | | 58.4% | | | 51.6% | | | 53.7% |
Expense ratio(2) | | | 36.3% | | | 20.2% | | | 24.3% | | | 23.6% |
Combined ratio(3) | | | 93.9% | | | 78.6% | | | 75.9% | | | 77.3% |
Return on equity(4) | | | 26.3% | | | 30.5% | | | 25.5% | | | 20.2% |
Adjusted return on equity(5) | | | 18.1% | | | 30.2% | | | 27.0% | | | 23.0% |
Return on tangible equity(6) | | | 26.9% | | | 31.4% | | | 26.1% | | | 20.6% |
Adjusted return on tangible equity(7) | | | 18.5% | | | 31.1% | | | 27.7% | | | 23.4% |
(1) | The loss ratio is the ratio, expressed as a percentage, of losses and loss adjustment expenses to net earned premiums. |
(2) | The expense ratio is the ratio, expressed as a percentage, of general and administrative expenses to net earned premiums. |
(3) | The combined ratio is the sum of the loss ratio and the expense ratio. A combined ratio under 100% generally indicates an underwriting profit. A combined ratio over 100% generally indicates an underwriting loss. |
(4) | Return on equity represents net income expressed on an annualized basis as a percentage of average beginning and ending members’ equity during the period. |
(5) | Adjusted return on equity is a non-GAAP financial measure defined as adjusted net income expressed on an annualized basis as a percentage of average beginning and ending members’ equity during the period. See “Management’s discussion and analysis of financial condition and results of operations — Reconciliation of non-GAAP financial measures” for a reconciliation of adjusted return on equity to return on equity in accordance with GAAP. |
(6) | Return on tangible equity is a non-GAAP financial measure defined as net income expressed on an annualized basis as a percentage of average beginning and ending tangible members’ equity during the period. See “Management’s discussion and analysis of financial condition and results of operations — Reconciliation of non-GAAP financial measures” for a reconciliation of return on tangible equity to return on equity in accordance with GAAP. |
(7) | Adjusted return on tangible equity is a non-GAAP financial measure defined as adjusted net income expressed on an annualized basis as a percentage of average beginning and ending tangible members’ equity during the period. See “Management’s discussion and analysis of financial condition and results of operations — Reconciliation of non-GAAP financial measures” for a reconciliation of adjusted return on tangible equity to return on tangible equity in accordance with GAAP. |
• | collect and properly analyze a substantial volume of data from our insureds; |
• | develop, test and apply appropriate actuarial projections and ratings formulas; |
• | closely monitor and timely recognize changes in trends; and |
• | project both frequency and severity of our insureds’ losses with reasonable accuracy. |
• | insufficient or unreliable data; |
• | incorrect or incomplete analysis of available data; |
• | uncertainties generally inherent in estimates and assumptions; |
• | our failure to implement appropriate actuarial projections and ratings formulas or other pricing methodologies; |
• | regulatory constraints on rate increases; |
• | our failure to accurately estimate investment yields and the duration of our liability for losses and LAE; and |
• | unanticipated court decisions, legislation or regulatory action. |
• | judicial expansion of policy coverage and the impact of new theories of liability; |
• | plaintiffs targeting property and casualty (“P&C”) insurers in purported class action litigation relating to claims-handling and other practices; |
• | medical developments that link health issues to particular causes, resulting in liability claims; and |
• | claims relating to unanticipated consequences of current or new technologies, including cyber-security related risks and claims relating to potentially changing climate conditions. |
• | the terms of the reinsurance contract do not reflect the intent of the parties of the contract or there is a disagreement between the parties as to their intent; |
• | the terms of the contract cannot be legally enforced; |
• | the terms of the contract are interpreted by a court or arbitration panel differently than intended; |
• | the reinsurance transaction performs differently than we anticipated due to a flawed design of the reinsurance structure, terms or conditions; or |
• | a change in laws and regulations, or in the interpretation of the laws and regulations, materially affects a reinsurance transaction. |
• | loss emergence and cedant reporting patterns; |
• | underlying policy terms and conditions; |
• | business and exposure mix; |
• | trends in claim frequency and severity; |
• | changes in operations; |
• | emerging economic and social trends; |
• | inflation; and |
• | changes in the regulatory and litigation environments. |
• | widespread claim costs associated with P&C and workers’ compensation claims; |
• | losses resulting from a decline in the value of our invested assets; |
• | losses resulting from actual policy experience that is adverse compared to the assumptions made in product pricing; |
• | declines in value and/or losses with respect to companies and other entities whose securities we hold and counterparties with whom we transact business to whom we have credit exposure, including reinsurers, and declines in the value of investments; and |
• | significant interruptions to our systems and operations. |
• | Legislative or regulatory action seeking to retroactively mandate coverage for losses, which our policies would not otherwise cover or have been priced to cover; |
• | Regulatory actions relaxing reporting requirements for claims, which may affect coverage under our claims made and reported policies; |
• | Legislative actions prohibiting us from cancelling policies in accordance with our policy terms or non-renewing policies at their expiration date; |
• | Legislative orders to provide premium refunds, extend premium payment grace periods and allow time extensions for past due premium payments; |
• | We may have increased workers’ compensation loss expense and claims frequency if policyholder employees in high risk roles with essential businesses contract COVID-19 in the workplace; |
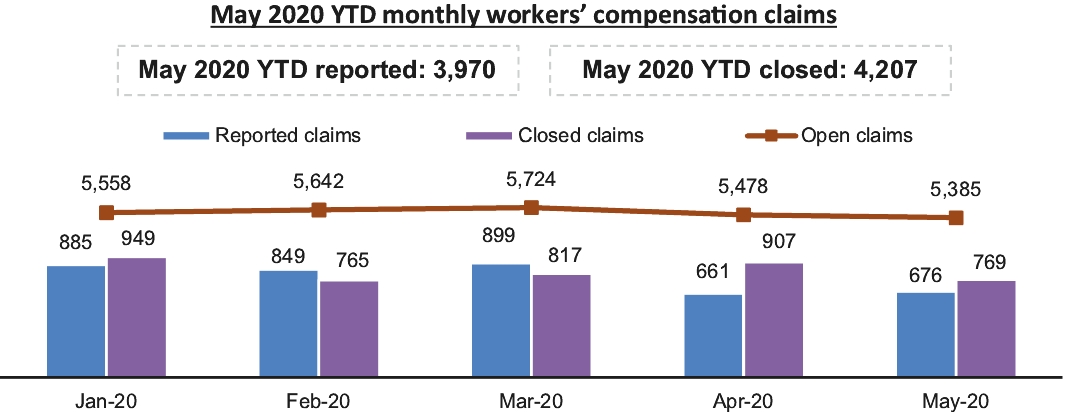
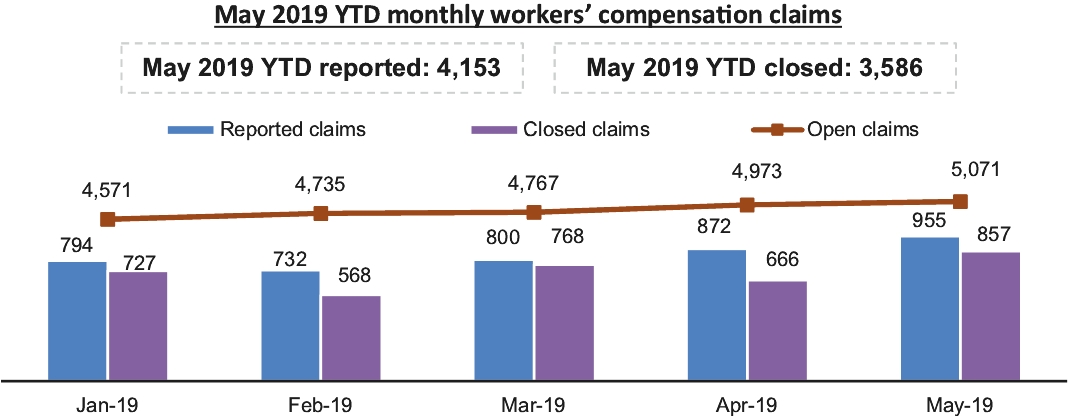
• | While we have seen through the two months ended May 31, 2020 fewer claims reported despite insuring more employees and have not seen a significant impact on the average value of incurred losses due to the COVID-19 pandemic, high unemployment and low interest rates could adversely affect our profitability and declining payrolls could adversely affect our workers' compensation written premiums; |
• | Travel restrictions and quarantines leading to a lack of in-person meetings, which would hinder our ability to establish relationships or originate new business; |
• | Alternative working arrangements, including employees working remotely, which could negatively impact our business should such arrangements remain for an extended period of time; |
• | We may experience elevated frequency and severity in our workers’ compensation lines as a result of legislative or regulatory action to effectively expand workers’ compensation coverage for certain types of workers; and |
• | We may experience delayed reporting of losses, settlement negotiations and disputed claims resolution above our normal claims resolution trends. |
• | approval of policy forms and premium rates; |
• | standards of solvency, including risk-based capital measurements; |
• | licensing of insurers; |
• | challenging our use of fronting arrangements in states in which our Program Partner is not licensed; |
• | imposing minimum capital and surplus requirements for insurance company subsidiaries; |
• | restrictions on agreements with our large revenue-producing agents; |
• | cancellation and non-renewal of policies; |
• | restrictions on the nature, quality and concentration of investments; |
• | restrictions on the ability of our insurance company subsidiaries to pay dividends to us; |
• | restrictions on transactions between our insurance company subsidiaries and their affiliates; |
• | restrictions on the size of risks insurable under a single policy; |
• | requiring deposits for the benefit of policyholders; |
• | requiring certain methods of accounting; |
• | periodic examinations of our operations and finances; |
• | prescribing the form and content of records of financial condition required to be filed; and |
• | requiring reserves for unearned premium, losses and other purposes. |
• | our operating and financial performance and prospects; |
• | our announcements or our competitors’ announcements regarding new products or services, enhancements, significant contracts, acquisitions or strategic investments; |
• | changes in earnings estimates or recommendations by securities analysts who cover our common stock; |
• | fluctuations in our quarterly financial results or earnings guidance or the quarterly financial results or earnings guidance of companies perceived to be similar to us; |
• | changes in our capital structure, such as future issuances of securities, sales of large blocks of common stock by our stockholders, including our principal stockholders, or the incurrence of additional debt; |
• | departure of key personnel; |
• | reputational issues; |
• | changes in general economic and market conditions; |
• | changes in industry conditions or perceptions or changes in the market outlook for the insurance industry; and |
• | changes in applicable laws, rules or regulations, regulatory actions affecting us and other dynamics. |
• | the ability of our board of directors to issue one or more series of preferred stock; |
• | the filling of any vacancies on our board of directors by the affirmative vote of a majority of the remaining directors, even if less than a quorum, or by a sole remaining director or by the stockholders; provided, however, that after the first time when the principal stockholders cease to beneficially own, in the aggregate, at least 50% of our outstanding common stock, any vacancy occurring in our board of directors may only be filled by a majority of the directors then in office, although less than a quorum, or by a sole remaining director (and not by the stockholders); |
• | certain limitations on convening special stockholder meetings; |
• | advance notice for nominations of directors by stockholders and for stockholders to include matters to be considered at our annual meetings; and |
• | stockholder action by written consent only until the first time when our principal stockholders cease to beneficially own, in the aggregate, 50% or greater of our outstanding common stock. |
• | actual basis; |
• | as adjusted basis giving effect to the reorganization transactions; and |
• | as further adjusted basis giving effect to the issuance and sale by us of 7,142,857 shares of our common stock in this offering and the application of the net proceeds therefrom as described in “Use of proceeds,” based on an assumed initial public offering price of $14.00 per share, which is the midpoint of the price range set forth on the cover page of this prospectus. |
| | | As of March 31, 2020 | |||||||
| | | Actual | | | As adjusted | | | As further adjusted(1) | |
| | | (in thousands, except shares and per share data) | |||||||
Long-term debt | | | $28,721 | | | $48,981 | | | $20,989 |
Redeemable preferred stock,1,000,000 shares authorized; 51 shares issued and outstanding, actual and as adjusted; no shares issued and outstanding, as further adjusted | | | 5,100 | | | 5,100 | | | — |
Stockholders’ / members’ equity: | | | | | | | |||
Members’ equity | | | 78,458 | | | — | | | — |
Common stock, $0.01 par value per share, no shares authorized or issued and outstanding, actual; 600,000,000 shares authorized, 44,000,000 shares issued and outstanding, as adjusted; 51,142,857 shares issued and outstanding, as further adjusted | | | — | | | 440 | | | 511 |
Preferred stock, $0.01 par value per share, no shares authorized or issued and outstanding, actual; 100,000,000 shares authorized, no shares issued and outstanding, as adjusted and as further adjusted | | | — | | | — | | | — |
Additional paid-in capital | | | 17,995 | | | 188,604 | | | 276,795 |
Retained earnings | | | 49,967 | | | 114,468 | | | 114,468 |
Accumulated other comprehensive income | | | 3,761 | | | 3,761 | | | 3,761 |
Total stockholders’ / members’ equity | | | 150,181 | | | 307,273 | | | 395,535 |
Total capitalization(2) | | | $ 184,002 | | | $361,354 | | | $416,524 |
(1) | Each $1.00 increase or decrease in the assumed initial public offering price of $14.00 per share of common stock (the midpoint of the price range set forth on the cover page of this prospectus) would increase (decrease) total stockholders’ equity by approximately $6.6 million, assuming that the number of shares offered by us, as set forth on the cover page of this prospectus, remains the same, and after deducting the underwriting discount and commissions and estimated offering expenses payable by us. We may also increase or decrease the number of shares we are offering. Each 1,000,000 increase or decrease in the number of shares of common stock offered in this offering by us would increase or decrease total stockholders’ equity by approximately $13.0 million, assuming that the assumed initial public offering price remains the same, and after deducting the underwriting discount and commissions and estimated offering expenses payable by us. |
(2) | Actual and As adjusted each include $5.1 million of redeemable preferred stock. |
Assumed initial public offering price per share | | | | | $14.00 | |
As adjusted net tangible book value per share as of March 31, 2020 | | | $2.67 | | | |
Increase in as adjusted net tangible book value per share attributable to new investors purchasing shares in this offering | | | 1.35 | | | |
As further adjusted net tangible book value per share immediately after this offering | | | | | $4.02 | |
Dilution per share to new investors in this offering | | | | | $9.98 |
| | | Shares Purchased | | | Total Consideration | | | Average Price Per Share | |||||||
| | | Number | | | Percent | | | Amount | | | Percent | | |||
Existing stockholders | | | 40,428,571 | | | 79.1% | | | $565,999,994 | | | 79.1% | | | $14.00 |
New investors in this offering | | | 10,714,286 | | | 20.9% | | | $150,000,004 | | | 20.9% | | | $14.00 |
Total | | | 51,142,857 | | | 100% | | | $715,999,998 | | | 100% | | | |
| | | Three months ended March 31, | | | Year ended December 31, | |||||||
| | | 2020 | | | 2019 | | | 2019 | | | 2018 | |
| | | (in thousands) | ||||||||||
Revenues: | | | | | | | | | ||||
Gross written premiums | | | $107,859 | | | $101,534 | | | $411,401 | | | $357,007 |
Increase in gross unearned premiums | | | (7,373) | | | (10,952) | | | (13,598) | | | (16,862) |
Gross earned premiums | | | 100,486 | | | 90,582 | | | 397,803 | | | 340,145 |
Ceded earned premiums | | | (78,027) | | | (70,958) | | | (311,325) | | | (273,569) |
Net earned premiums | | | 22,459 | | | 19,624 | | | 86,478 | | | 66,576 |
Net investment income | | | 3,272 | | | 1,287 | | | 6,245 | | | 4,816 |
Net realized capital gains (losses) | | | 3,234 | | | 612 | | | 667 | | | (715) |
Other revenue | | | 4,392 | | | 3,595 | | | 9,125 | | | 7,826 |
Total revenue | | | 33,357 | | | 25,118 | | | 102,515 | | | 78,503 |
| | | | | | | | | |||||
Expenses: | | | | | | | | | ||||
Losses and loss adjustment expenses | | | 12,934 | | | 11,456 | | | 44,661 | | | 35,729 |
General and administrative expenses | | | 8,160 | | | 3,969 | | | 21,005 | | | 15,706 |
Interest expense | | | 461 | | | 624 | | | 2,169 | | | 1,557 |
Total expenses | | | 21,555 | | | 16,049 | | | 67,835 | | | 52,992 |
| | | | | | | | | |||||
Other income | | | 14 | | | 93 | | | 121 | | | 639 |
Income before taxes | | | 11,816 | | | 9,162 | | | 34,801 | | | 26,150 |
| | | | | | | | | |||||
Provision for income taxes | | | 2,912 | | | 1,319 | | | 7,074 | | | 5,546 |
Equity earnings (losses) in affiliates, net of tax | | | 702 | | | 608 | | | 3,558 | | | (1,082) |
Net income | | | $9,606 | | | $8,451 | | | $31,285 | | | $19,522 |
Adjusted net income(1) | | | $6,602 | | | $8,369 | | | $33,194 | | | $22,197 |
| | | Three months ended March 31, 2020 | | | Year ended December 31, 2019 | |
Pro forma per share data(2): | | | | | ||
Pro forma earnings per share outstanding | | | | | ||
Basic and diluted | | | $0.20 | | | $0.68 |
Pro forma weighted average shares outstanding | | | | | ||
Basic and diluted | | | 51,142,857 | | | 51,142,857 |
(1) | Adjusted net income is a non-GAAP financial measure. See “Management’s discussion and analysis of financial condition and results of operations — Reconciliation of non-GAAP financial measures” for a reconciliation of adjusted net income to net income in accordance with GAAP. |
(2) | Pro forma earnings per share outstanding gives pro forma effect to: (a) the issuance of 37,386,394 shares of our common stock to Trean Holdings and BIC Holdings in exchange for the contribution of all of their respective assets and liabilities to Trean Insurance Group, Inc., (b) the issuance of 6,613,606 shares of our common stock in connection with the acquisition from the Blake Enterprises |
| | | Three months ended March 31, 2020 | | | Year ended December 31, 2019 | |
| | | (in thousands, except share and per share data) | ||||
Numerator: | | | | | ||
Net income | | | $9,606 | | | $31,285 |
Pro forma adjustment: 55% equity in net income of Compstar (net of tax) | | | 858 | | | 3,409 |
Pro forma net income | | | $10,464 | | | $34,694 |
| | | | | |||
Denominator: | | | | | ||
Issuance of our common stock to Trean Holdings and BIC Holdings in exchange for contribution | | | 37,386,394 | | | 37,386,394 |
| | | | | |||
Issuance of common stock in connection with acquisition from the Blake Baker Enterprises Entities of their 55% equity interest in Compstar Holding Company LLC | | | 6,613,606 | | | 6,613,606 |
Issuance of common stock by us in this offering | | | 7,142,857 | | | 7,142,857 |
Pro forma shares outstanding | | | 51,142,857 | | | 51,142,857 |
Pro forma earnings per share outstanding | | | | | ||
Basic and diluted | | | $0.20 | | | $0.68 |
| | | At March 31, 2020 | | | At December 31, | ||||
| | | 2019 | | | 2018 | ||||
| | | (in thousands) | |||||||
Balance sheet data: | | | | | | | |||
Accrued investment income | | | $2,420 | | | $2,468 | | | $2,372 |
Premiums and other receivables | | | 67,773 | | | 62,460 | | | 62,400 |
Related party receivables | | | 21,871 | | | 22,221 | | | 15,934 |
Reinsurance recoverable | | | 313,760 | | | 307,338 | | | 257,509 |
Prepaid reinsurance premiums | | | 83,694 | | | 80,088 | | | 66,765 |
Deferred policy acquisition cost, net | | | 3,103 | | | 2,115 | | | 2,976 |
Property and equipment, net | | | 8,238 | | | 7,937 | | | 8,134 |
Deferred tax asset | | | 1,280 | | | 1,367 | | | 1,823 |
Goodwill | | | 2,822 | | | 2,822 | | | 2,822 |
Other assets | | | 7,572 | | | 3,277 | | | 1,963 |
Total assets | | | 954,583 | | | 919,034 | | | 800,119 |
Unpaid loss and loss adjustment expenses | | | 418,757 | | | 406,716 | | | 340,415 |
Unearned premiums | | | 111,162 | | | 103,789 | | | 90,074 |
Funds held under reinsurance agreements | | | 165,018 | | | 163,445 | | | 166,838 |
Reinsurance premiums payable | | | 48,099 | | | 53,620 | | | 40,135 |
Accounts payable and accrued expenses | | | 18,360 | | | 14,995 | | | 15,004 |
Total liabilities | | | 799,302 | | | 772,319 | | | 688,988 |
Redeemable preferred stock | | | 5,100 | | | 5,100 | | | 6,000 |
Total members’ equity | | | 150,181 | | | 141,615 | | | 105,131 |
Total liabilities and members’ equity | | | $954,583 | | | $919,034 | | | $800,119 |
| | | Three months ended March 31, | | | Year ended December 31, | |||||||
| | | 2020 | | | 2019 | | | 2019 | | | 2018 | |
Underwriting and other ratios: | | | | | | | | | ||||
Loss ratio(1) | | | 57.6% | | | 58.4% | | | 51.6% | | | 53.7% |
Expense ratio(2) | | | 36.3% | | | 20.2% | | | 24.3% | | | 23.6% |
Combined ratio(3) | | | 93.9% | | | 78.6% | | | 75.9% | | | 77.3% |
Return on equity(4) | | | 26.3% | | | 30.5% | | | 25.5% | | | 20.2% |
Adjusted return on equity(5) | | | 18.1% | | | 30.2% | | | 27.0% | | | 23.0% |
Return on tangible equity(6) | | | 26.9% | | | 31.4% | | | 26.1% | | | 20.6% |
Adjusted return on tangible equity(7) | | | 18.5% | | | 31.1% | | | 27.7% | | | 23.4% |
(1) | The loss ratio is the ratio, expressed as a percentage, of losses and loss adjustment expenses to net earned premiums. |
(2) | The expense ratio is the ratio, expressed as a percentage, of general and administrative expenses to net earned premiums. |
(3) | The combined ratio is the sum of the loss ratio and the expense ratio. A combined ratio under 100% generally indicates an underwriting profit. A combined ratio over 100% generally indicates an underwriting loss. |
(4) | Return on equity represents net income expressed on an annualized basis as a percentage of average beginning and ending members’ equity during the period. |
(5) | Adjusted return on equity is a non-GAAP financial measure defined as adjusted net income expressed on an annualized basis as a percentage of average beginning and ending members’ equity during the period. See “Management’s discussion and analysis of financial condition and results of operations — Reconciliation of non-GAAP financial measures” for a reconciliation of adjusted return on equity to return on equity in accordance with GAAP. |
(6) | Return on tangible equity is a non-GAAP financial measure defined as net income expressed on an annualized basis as a percentage of average beginning and ending tangible members’ equity during the period. See “Management’s discussion and analysis of financial condition and results of operations — Reconciliation of non-GAAP financial measures” for a reconciliation of return on tangible equity to return on equity in accordance with GAAP. |
(7) | Adjusted return on tangible equity is a non-GAAP financial measure defined as adjusted net income expressed on an annualized basis as a percentage of average beginning and ending tangible members’ equity during the period. See “Management’s discussion and analysis of financial condition and results of operations — Reconciliation of non-GAAP financial measures” for a reconciliation of adjusted return on tangible equity to return on tangible equity in accordance with GAAP. |
• | Addition and retention of Program Partners; |
• | New business submissions to our Program Partners; |
• | Binding of new business submissions into policies; |
• | Renewals of existing policies; and |
• | Average size and premium rate of bound policies. |
• | frequency of claims associated with the particular types of insurance contracts that we write; |
• | trends in the average size of losses incurred on a particular type of business; |
• | mix of business written by us; |
• | changes in the legal or regulatory environment related to the business we write; |
• | trends in legal defense costs; |
• | wage inflation; and |
• | inflation in medical costs. |
| | | Three months ended March 31, | | | Change | | | Percentage Change | ||||
| | | 2020 | | | 2019 | | ||||||
| | | ($ in thousands) | | | | | ||||||
Revenues | | | | | | | | | ||||
Gross written premiums | | | $107,859 | | | $101,534 | | | $6,325 | | | 6% |
Increase in gross unearned premiums | | | (7,373) | | | (10,952) | | | (3,579) | | | (33) |
Gross earned premiums | | | 100,486 | | | 90,582 | | | 9,904 | | | 11 |
Ceded earned premiums | | | (78,027) | | | (70,958) | | | 7,069 | | | 10 |
Net earned premiums | | | 22,459 | | | 19,624 | | | 2,835 | | | 14 |
Expenses | | | | | | | | | ||||
Losses and loss adjustment expenses | | | 12,934 | | | 11,456 | | | 1,478 | | | 13 |
General and administrative expenses | | | 8,160 | | | 3,969 | | | 4,191 | | | 106 |
Underwriting income(1) | | | 1,365 | | | 4,199 | | | (2,834) | | | (67) |
Net investment income | | | 3,272 | | | 1,287 | | | 1,985 | | | 154 |
Net realized capital gains (losses) | | | 3,234 | | | 612 | | | 2,622 | | | 428 |
Other revenue | | | 4,392 | | | 3,595 | | | 797 | | | 22 |
Interest expense | | | (461) | | | (624) | | | 163 | | | 26 |
Other income | | | 14 | | | 93 | | | (79) | | | (85) |
Income before taxes | | | 11,816 | | | 9,162 | | | 2,654 | | | 29 |
Provision for income taxes | | | 2,912 | | | 1,319 | | | 1,593 | | | 121 |
Equity earnings (losses) in affiliates, net of tax | | | 702 | | | 608 | | | 94 | | | 15 |
Net income | | | $9,606 | | | $8,451 | | | $1,155 | | | 14% |
Adjusted net income(2) | | | $6,602 | | | $8,369 | | | $(1,767) | | | (21)% |
(1) | Underwriting income is a non-GAAP financial measure. See “— Reconciliation of non-GAAP financial measures” for a reconciliation of underwriting income to net income in accordance with GAAP. |
(2) | Adjusted net income is a non-GAAP financial measure. See “— Reconciliation of non-GAAP financial measures” for a reconciliation of adjusted net income to net income in accordance with GAAP. |
| | | Three months ended March 31, | ||||
| | | 2020 | | | 2019 | |
Key metrics: | | | | | ||
Loss ratio | | | 57.6% | | | 58.4% |
Expense ratio | | | 36.3% | | | 20.2% |
Combined ratio | | | 93.9% | | | 78.6% |
Return on equity | | | 26.3% | | | 30.5% |
Adjusted return on equity(1) | | | 18.1% | | | 30.2% |
Return on tangible equity(2) | | | 26.9% | | | 31.4% |
Adjusted return on tangible equity(3) | | | 18.5% | | | 31.1% |
(1) | Adjusted return on equity is a non-GAAP financial measure. See “— Reconciliation of non-GAAP financial measures” for a reconciliation of adjusted return on equity to return on equity in accordance with GAAP. |
(2) | Return on tangible equity is a non-GAAP financial measure. See “— Reconciliation of non-GAAP financial measures” for a reconciliation of return on tangible equity to return on equity in accordance with GAAP. |
(3) | Adjusted return on tangible equity is a non-GAAP financial measure. See “— Reconciliation of non-GAAP financial measures” for a reconciliation of adjusted return on tangible equity to return on tangible equity in accordance with GAAP. |
| | | Three months ended March 31, | | | Change | | | Percentage Change | ||||
| | | 2020 | | | 2019 | | ||||||
| | | (in thousands) | | | | | ||||||
Revenues: | | | | | | | | | ||||
Gross written premiums | | | $107,859 | | | $101,534 | | | $6,325 | | | 6% |
Increase in gross unearned premiums | | | (7,373) | | | (10,952) | | | (3,579) | | | (33) |
Gross earned premiums | | | 100,486 | | | 90,582 | | | 9,904 | | | 11 |
Ceded earned premiums | | | (78,027) | | | (70,958) | | | 7,069 | | | 10 |
Net earned premiums | | | $22,459 | | | $19,624 | | | $2,835 | | | 14% |
| | | Year ended December 31, | | | Change | | | Percentage Change | ||||
| | | 2019 | | | 2018 | | ||||||
| | | ($ in thousands) | | | | | ||||||
Revenues | | | | | | | | | ||||
Gross written premiums | | | $411,401 | | | $357,007 | | | $54,394 | | | 15% |
Increase in gross unearned premiums | | | (13,598) | | | (16,862) | | | (3,264) | | | (19) |
Gross earned premiums | | | 397,803 | | | 340,145 | | | 57,658 | | | 17 |
Ceded earned premiums | | | (311,325) | | | (273,569) | | | 37,756 | | | 14 |
Net earned premiums | | | 86,478 | | | 66,576 | | | 19,902 | | | 30 |
Expenses | | | | | | | | | ||||
Losses and loss adjustment expenses | | | 44,661 | | | 35,729 | | | 8,932 | | | 25 |
General and administrative expenses | | | 21,005 | | | 15,706 | | | 5,299 | | | 34 |
Underwriting income(1) | | | 20,812 | | | 15,141 | | | 5,671 | | | 38 |
Net investment income | | | 6,245 | | | 4,816 | | | 1,429 | | | 30 |
Net realized capital gains (losses) | | | 667 | | | (715) | | | 1,382 | | | 193 |
Other revenue | | | 9,125 | | | 7,826 | | | 1,299 | | | 17 |
Interest expense | | | 2,169 | | | 1,557 | | | (612) | | | (39) |
Other income | | | 121 | | | 639 | | | (518) | | | (81) |
Income before taxes | | | 34,801 | | | 26,150 | | | 8,651 | | | 33 |
Provision for income taxes | | | 7,074 | | | 5,546 | | | 1,528 | | | 28 |
Equity earnings (losses) in affiliates, net of tax | | | 3,558 | | | (1,082) | | | 4,640 | | | 429 |
Net income | | | $31,285 | | | $19,522 | | | $11,763 | | | 60% |
Adjusted net income(2) | | | $33,194 | | | $22,197 | | | $10,997 | | | 50% |
(1) | Underwriting income is a non-GAAP financial measure. See “— Reconciliation of non-GAAP financial measures” for a reconciliation of underwriting income to net income in accordance with GAAP. |
(2) | Adjusted net income is a non-GAAP financial measure. See “— Reconciliation of non-GAAP financial measures” for a reconciliation of adjusted net income to net income in accordance with GAAP. |
| | | Year ended December 31, | ||||
| | | 2019 | | | 2018 | |
Key metrics: | | | | | ||
Loss ratio | | | 51.6% | | | 53.7% |
Expense ratio | | | 24.3% | | | 23.6% |
Combined ratio | | | 75.9% | | | 77.3% |
Return on equity | | | 25.5% | | | 20.2% |
Adjusted return on equity(1) | | | 27.0% | | | 23.0% |
Return on tangible equity(2) | | | 26.1% | | | 20.6% |
Adjusted return on tangible equity(3) | | | 27.7% | | | 23.4% |
(1) | Adjusted return on equity is a non-GAAP financial measure. See “— Reconciliation of non-GAAP financial measures” for a reconciliation of adjusted return on equity to return on equity in accordance with GAAP. |
(2) | Return on tangible equity is a non-GAAP financial measure. See “— Reconciliation of non-GAAP financial measures” for a reconciliation of return on tangible equity to return on equity in accordance with GAAP. |
(3) | Adjusted return on tangible equity is a non-GAAP financial measure. See “— Reconciliation of non-GAAP financial measures” for a reconciliation of adjusted return on tangible equity to return on tangible equity in accordance with GAAP. |
| | | Year ended December 31, | | | Change | | | Percentage Change | ||||
| | | 2019 | | | 2018 | | ||||||
| | | (in thousands) | | | | | ||||||
Revenues: | | | | | | | | | ||||
Gross written premiums | | | $411,401 | | | $357,007 | | | $54,394 | | | 15% |
Increase in gross unearned premiums | | | (13,598) | | | (16,862) | | | (3,264) | | | (19) |
Gross earned premiums | | | 397,803 | | | 340,145 | | | 57,658 | | | 17 |
Ceded earned premiums | | | (311,325) | | | (273,569) | | | 37,756 | | | 14 |
Net earned premiums | | | $86,478 | | | $66,576 | | | $19,902 | | | 30% |
| | | Three months ended March 31, | | | Change | | | Percentage Change | ||||
| | | 2020 | | | 2019 | | ||||||
| | | (in thousands) | | | | | ||||||
Cash, cash equivalents and restricted cash provided by (used in): | | | | | | | | | ||||
Operating activities | | | $7,428 | | | $9,332 | | | $(1,904) | | | (20)% |
Investing activities | | | (9,470) | | | (11,480) | | | 2,010 | | | 18 |
Financing activities | | | (344) | | | (372) | | | 28 | | | 8 |
Net increase in cash, cash equivalents and restricted cash | | | $(2,386) | | | $(2,520) | | | $134 | | | 5% |
| | | Year ended December 31, | | | Change | | | Percentage Change | ||||
| | | 2019 | | | 2018 | | ||||||
| | | (in thousands) | | | | | ||||||
Cash provided by (used in): | | | | | | | | | ||||
Operating activities | | | $52,173 | | | $75,266 | | | $(23,093) | | | (31)% |
Investing activities | | | (23,943) | | | (78,559) | | | 54,616 | | | 70 |
Financing activities | | | (8,125) | | | 14,282 | | | (22,407) | | | (157) |
Net increase in cash, cash equivalents and restricted cash | | | $20,105 | | | $10,989 | | | $9,116 | | | 83% |
| | | Payments Due by Period | |||||||||||||
| | | Total | | | Less than one year | | | One Year to Less Than Three Years | | | Three Years to Less Than Five Years | | | More Than Five Years | |
| | | ($ in thousands) | |||||||||||||
Reserve for losses and loss adjustment expenses | | | $406,716 | | | $94,765 | | | $157,806 | | | $60,194 | | | $93,951 |
Debt securities and credit agreements | | | 29,369 | | | 1,891 | | | 5,844 | | | 13,902 | | | 7,732 |
Interest payable(1) | | | 11,340 | | | 1,788 | | | 3,125 | | | 1,146 | | | 5,282 |
Operating lease obligations | | | 6,572 | | | 1,688 | | | 3,145 | | | 1,793 | | | (54) |
Total | | | $453,997 | | | $100,132 | | | $169,919 | | | $77,035 | | | $106,911 |
(1) | Interest on the subordinated debt and the note payable under the Secured Credit Facility is calculated using 5.94% & 6.33%, respectively, in effect at December 31, 2019 with the assumption that interest rates remain flat over the remainder of the period that the note is outstanding. At our option, we may prepay the note payable in whole or in part without premium or penalty. |
The amortized cost and fair value on available-for-sale securities were as follows: | | | Cost or Amortized Cost | | | Fair Value | | | Cost or Amortized Cost | | | Fair Value |
| | | At March 31, 2020 | | | At December 31, 2019 | |||||||
| | | (in thousands) | ||||||||||
Fixed maturities: | | | | | | | | | ||||
U.S. government and government securities | | | $15,374 | | | $15,882 | | | $15,965 | | | $16,129 |
Foreign governments | | | 299 | | | 306 | | | 299 | | | 302 |
States, territories and possessions | | | 5,612 | | | 5,733 | | | 4,789 | | | 4,923 |
Political subdivisions of states, territories and possessions | | | 24,992 | | | 25,726 | | | 24,444 | | | 25,104 |
Special revenue and special assessment obligations | | | 64,694 | | | 67,326 | | | 59,149 | | | 61,405 |
Industrial and public utilities | | | 116,362 | | | 118,012 | | | 119,735 | | | 123,207 |
Commercial mortgage-backed securities | | | 15,547 | | | 16,334 | | | 15,586 | | | 16,312 |
Residential mortgage-backed securities | | | 55,492 | | | 57,351 | | | 53,467 | | | 54,109 |
Other loan-backed securities | | | 41,651 | | | 40,474 | | | 35,849 | | | 36,011 |
Hybrid securities | | | 357 | | | 353 | | | 357 | | | 363 |
Total fixed maturities | | | 340,380 | | | 347,497 | | | 329,640 | | | 337,865 |
Equity securities: | | | | | | | | | ||||
Preferred stock | | | 332 | | | 310 | | | 337 | | | 343 |
Common stock | | | 1,554 | | | 3,353 | | | 492 | | | 492 |
Total equity maturities | | | 1,886 | | | 3,663 | | | 829 | | | 835 |
Total securities available for sale | | | $ 342,266 | | | $ 351,160 | | | $ 330,469 | | | $ 338,700 |
| | | Three months ended March 31, | | | Change | | | Percentage Change | | ||||||
| | | 2020 | | | 2019 | | |||||||||
| | | (in thousands) | | | | | | | |||||||
Net income | | | $9,606 | | | $8,451 | | | $1,155 | | | 14% | | ||
Provision for income taxes | | | 2,912 | | | 1,319 | | | 1,593 | | | 121 | | ||
Equity (earnings) in affiliates, net of tax | | | (702) | | | (608) | | | 94 | | | 15 | | ||
Income before taxes | | | 11,816 | | | 9,162 | | | 2,654 | | | 29 | | ||
Other revenue | | | 4,392 | | | 3,595 | | | 797 | | | 22 | | ||
Net investment income | | | 3,272 | | | 1,287 | | | 1,985 | | | 154 | | ||
Net realized capital gains/(losses) | | | 3,234 | | | 612 | | | 2,622 | | | 428 | | ||
Interest expense | | | (461) | | | (624) | | | (163) | | | (26) | | ||
Other income | | | 14 | | | 93 | | | (79) | | | (85) | | ||
Underwriting income | | | $1,365 | | | $4,199 | | | $(2,834) | | | (67)% | | ||
| | | Year ended December 31, | | | Change | | | Percentage Change | ||||
| | | 2019 | | | 2018 | | ||||||
| | | (in thousands) | | | | | ||||||
Net income | | | $ 31,285 | | | $ 19,522 | | | $ 11,763 | | | 60% |
Provision for income taxes | | | 7,074 | | | 5,546 | | | 1,528 | | | 28 |
Equity (earnings) losses in affiliates, net of tax | | | (3,558) | | | 1,082 | | | 4,640 | | | 429 |
Income before taxes | | | 34,801 | | | 26,150 | | | 8,651 | | | 33 |
Other revenue | | | (9,125) | | | (7,826) | | | 1,299 | | | 17 |
Net investment income | | | (6,245) | | | (4,816) | | | 1,429 | | | 30 |
Net realized capital (gains)/losses | | | (667) | | | 715 | | | 1,382 | | | 193 |
Interest expense | | | 2,169 | | | 1,557 | | | 612 | | | 39 |
Other income | | | (121) | | | (639) | | | 518 | | | 81 |
Underwriting income | | | $20,812 | | | $15,141 | | | $5,671 | | | 37% |
| | | Three months ended March 31, | | | Change | | | Percentage Change | ||||
| | | 2020 | | | 2019 | | ||||||
| | | ($ in thousands) | | | ||||||||
Net income | | | $ 9,606 | | | $ 8,451 | | | $ 1,155 | | | 14% |
Net gain on purchase and disposal of subsidiaries | | | (3,116) | | | (634) | | | (2,482) | | | (391) |
FMV adjustment of remaining investment in subsidiary | | | (2,000) | | | — | | | (2,000) | | | (100) |
Expenses associated with Altaris management fee, including cash bonuses paid to unitholders | | | 441 | | | 441 | | | — | | | — |
Expenses associated with IPO, Compstar transaction and other one-time consulting expenses | | | 792 | | | 227 | | | 565 | | | 249 |
Expenses associated with debt issuance costs | | | 25 | | | 25 | | | — | | | — |
Expenses associated with the purchase accounting impact of the reorganization transactions | | | — | | | — | | | — | | | — |
Tax impact of adjustments | | | 854 | | | (141) | | | 995 | | | 706 |
Adjusted net income | | | $6,602 | | | $8,369 | | | $(1,767) | | | (21)% |
| | | Year ended December 31, | | | Change | | | Percentage Change | ||||
| | | 2019 | | | 2018 | | ||||||
| | | ($ in thousands) | | | ||||||||
Net income | | | $ 31,285 | | | $ 19,522 | | | $11,763 | | | 60% |
Net gain on purchase and disposal of subsidiaries | | | (600) | | | — | | | (600) | | | (100) |
Expenses associated with Altaris management fee, including cash bonuses paid to unitholders | | | 1,765 | | | 1,765 | | | — | | | — |
Expenses associated with IPO, Compstar transaction and other one-time consulting expenses | | | 1,292 | | | 785 | | | 507 | | | 65 |
Expenses associated with purchase of outstanding voting shares of ALIC | | | — | | | 770 | | | (770) | | | (100) |
Expenses associated with debt issuance costs | | | 101 | | | 75 | | | 26 | | | 35 |
Expenses associated with the purchase accounting impact of the reorganization transactions | | | — | | | — | | | — | | | — |
Tax impact of adjustments | | | (649) | | | (720) | | | 71 | | | 10 |
Adjusted net income | | | $33,194 | | | $22,197 | | | $ 10,997 | | | 50% |
| | | Year ended December 31, | | | Change | | | Percentage Change | ||||
| | | 2018 | | | 2017 | | ||||||
| | | ($ in thousands) | | | ||||||||
Net income | | | $ 19,522 | | | $ 16,408 | | | $ 3,114 | | | 19% |
Expenses associated with Altaris management fee, including cash bonuses paid to unitholders | | | 1,765 | | | 1,600 | | | 165 | | | 10 |
Expenses associated with IPO, Compstar transaction and other one-time consulting expenses | | | 785 | | | — | | | 785 | | | 100 |
Expenses associated with purchase of outstanding voting shares of ALIC | | | 770 | | | 385 | | | 385 | | | 100 |
Expenses associated with debt issuance costs | | | 75 | | | — | | | 75 | | | 100 |
Tax impact of adjustments | | | (720) | | | (622) | | | (98) | | | (16) |
Adjusted net income | | | $22,197 | | | $17,771 | | | $4,426 | | | 25% |
| | | Three months ended March 31, | ||||
| | | 2020 | | | 2019 | |
Adjusted return on equity calculation: | | | | | ||
Numerator: adjusted net income | | | $ 6,602 | | | $ 8,369 |
Denominator: average members’ equity | | | 145,898 | | | 110,717 |
Adjusted return on equity | | | 18.1% | | | 30.2% |
Return on equity | | | 26.3% | | | 30.5% |
| | | Year ended December 31, | |||||||
| | | 2019 | | | 2018 | | | 2017 | |
Adjusted return on equity calculation: | | | | | | | |||
Numerator: adjusted net income | | | $33,194 | | | $22,197 | | | $17,771 |
Denominator: average members’ equity | | | 122,873 | | | 96,648 | | | 80,589 |
Adjusted return on equity | | | 27.0% | | | 23.0% | | | 22.1% |
Return on equity | | | 25.5% | | | 20.2% | | | 20.4% |
| | | Three months ended March 31, | | | Year ended December 31, | |||||||
| | | 2020 | | | 2019 | | | 2019 | | | 2018 | |
Return on tangible equity calculation: | | | | | | | | | ||||
Numerator: net income | | | $9,606 | | | $8,451 | | | $31,285 | | | $19,522 |
Denominator: | | | | | | | | | ||||
Average members’ equity | | | 145,898 | | | 110,681 | | | 122,873 | | | 96,648 |
Less: Average goodwill and other intangible assets | | | 2,971 | | | 3,017 | | | 3,000 | | | 1,940 |
Average tangible members’ equity | | | 142,927 | | | 107,664 | | | 119,873 | | | 94,708 |
Return on tangible equity | | | 26.9% | | | 31.4% | | | 26.1% | | | 20.6% |
Return on equity | | | 26.3% | | | 30.5% | | | 25.5% | | | 20.2% |
| | | Three months ended March 31, | | | Year ended December 31, | |||||||
| | | 2020 | | | 2019 | | | 2019 | | | 2018 | |
Adjusted return on tangible equity calculation: | | | | | | | | | ||||
Numerator: adjusted net income | | | $6,602 | | | $8,369 | | | $33,194 | | | $22,197 |
Denominator: average tangible members’ equity | | | 142,927 | | | 107,664 | | | 119,873 | | | 94,708 |
Adjusted return on tangible equity | | | 18.5% | | | 31.1% | | | 27.7% | | | 23.4% |
Return on tangible equity | | | 26.9% | | | 31.4% | | | 26.1% | | | 20.6% |
| | | Year Ended December 31, 2019 | ||||||||||
| | | Gross | | | % of Total | | | Net | | | % of Total | |
| | | ($ in thousands) | ||||||||||
Case Reserves | | | $ 130,409 | | | 32% | | | $ 30,868 | | | 30% |
IBNR | | | 276,307 | | | 68% | | | 71,843 | | | 70% |
Total | | | $406,716 | | | 100% | | | $102,711 | | | 100% |
| | | Year Ended December 31, 2018 | ||||||||||
| | | Gross | | | % of Total | | | Net | | | % of Total | |
| | | ($ in thousands) | ||||||||||
Case Reserves | | | $ 104,953 | | | 31% | | | $ 26,262 | | | 32% |
IBNR | | | 235,462 | | | 69% | | | 56,732 | | | 68% |
Total | | | $340,415 | | | 100% | | | $82,994 | | | 100% |
| | | December 31, 2019 | | | Potential impact of 2019 | |||||||||||||
Sensitivity | | | Accident year | | | Net ultimate losses and LAE sensitivity factor | | | Net ultimate incurred losses and LAE | | | Net losses and LAE reserve | | | Pre-tax income | | | Stockholders’ equity |
Sample increases | | | 2019 | | | 5.0% | | | $53,009 | | | $43,081 | | | $(2,650) | | | $(2,094) |
| | | 2018 | | | 2.5% | | | 36,738 | | | 18,591 | | | (918) | | | (726) | |
| | | Prior | | | 1.0% | | | 179,010 | | | 41,039 | | | (1,790) | | | (1,414) | |
Sample decreases | | | 2019 | | | -5.0% | | | 53,009 | | | 43,081 | | | 2,650 | | | 2,094 |
| | | 2018 | | | -2.5% | | | 36,738 | | | 18,591 | | | 918 | | | 726 | |
| | | Prior | | | -1.0% | | | 179,019 | | | 41,039 | | | 1,790 | | | 1,414 | |
| | | Year ended December 31, | ||||||||||
| | | 2019 | | | 2018 | |||||||
| | | Gross Written Premiums | | | Net Written Premiums | | | Gross Written Premiums | | | Net Written Premiums | |
| | | (in thousands) | ||||||||||
Workers’ compensation | | | $ 340,444 | | | $ 73,287 | | | $ 277,291 | | | $ 59,764 |
Other liability – occurrence* | | | 20,129 | | | 5,269 | | | 20,923 | | | 7,089 |
Commercial multiple peril | | | 17,662 | | | 4,059 | | | 13,128 | | | 3,597 |
Commercial auto liability | | | 9,935 | | | 1,474 | | | 7,251 | | | 1,076 |
Group accident and health | | | 7,678 | | | 3 | | | 22,450 | | | 123 |
Products liability – occurrence* | | | 7,368 | | | — | | | 6,496 | | | — |
Auto physical damage | | | 4,843 | | | 874 | | | 4,404 | | | 651 |
Excess workers’ compensation* | | | 2,539 | | | 546 | | | 1,090 | | | 227 |
Boiler and machinery | | | 783 | | | — | | | 599 | | | — |
Fire | | | 64 | | | — | | | 42 | | | — |
Surety | | | 52 | | | 52 | | | 29 | | | 29 |
Inland marine | | | 4 | | | — | | | 3 | | | — |
Private passenger auto liability | | | (100) | | | — | | | 3,301 | | | — |
Total: | | | $ 411,401 | | | $85,564 | | | $357,007 | | | $72,556 |
* | Included in other liability. |
| | | Year ended December 31, | ||||||||||
| | | 2019 | | | 2018 | |||||||
| | | Gross Written Premiums | | | Net Written Premiums | | | Gross Written Premiums | | | Net Written Premiums | |
| | | (in thousands) | ||||||||||
California | | | $ 202,446 | | | $ 39,066 | | | $ 153,611 | | | $ 32,259 |
Michigan | | | 38,174 | | | 7,990 | | | 37,084 | | | 7,741 |
Arizona | | | 34,215 | | | 5,394 | | | 28,350 | | | 6,227 |
Alabama | | | 12,946 | | | 5,551 | | | 11,907 | | | 5,694 |
Nevada | | | 11,869 | | | 2,918 | | | 9,225 | | | 2,417 |
Utah | | | 10,900 | | | 768 | | | 11,379 | | | 2,093 |
Mississippi | | | 8,910 | | | 4,399 | | | 7,143 | | | 3,705 |
Tennessee | | | 8,065 | | | 3,764 | | | 7,809 | | | 3,986 |
Indiana | | | 6,295 | | | 1,295 | | | * | | | * |
New Jersey | | | 6,222 | | | 82 | | | 7,580 | | | (292) |
Other geographical areas | | | 71,359 | | | 14,337 | | | 73,316 | | | 8,694 |
Total: | | | $411,401 | | | $85,564 | | | $357,007 | | | $72,556 |
* | The amount for the state is relevant for 2019 but not in 2018 and therefore, was not presented in 2018. |
• | small- to mid-sized books of business (less than $30 million of annual gross premiums at the inception of the relationship); |
• | operating in markets where we believe we can leverage our distinctive expertise, multi-service offering and market relationships to create a competitive advantage; |
• | track record of underwriting success supported with credible data; |
• | proven ability to administer the program pursuant to agreed-upon underwriting and claims guidelines; |
• | ability and willingness to assume a meaningful quota share risk participation in the program, typically through ownership of an insurance company or captive; |
• | collaborative, entrepreneurial management team; and |
• | willingness and ability for us to control the structuring and placement of reinsurance. |
Reinsurers: | | | A.M. Best Rating | | | Reinsurance Recoverables | | | Collateral | | | Net Recoverables |
| | | (in thousands) | ||||||||||
Markel Global Reinsurance Company | | | A | | | $ 70,510 | | | $ 4,617 | | | $ 65,893 |
Provistar Insurance Company, Limited | | | NR | | | 51,120 | | | 62,017 | | | (10,897) |
Arch Reinsurance Company (U.S.) | | | A+ | | | 40,021 | | | 3,313 | | | 36,708 |
Greenlight Reinsurance, Limited | | | A- | | | 39,624 | | | 56,510 | | | (16,886) |
Sunz Insurance Company | | | NR | | | 13,050 | | | 29,960 | | | (16,910) |
Synergy Comp. Insurance Company | | | NR | | | 12,238 | | | 15,409 | | | (3,171) |
VGM Insurance Companies Of America Limited | | | NR | | | 9,931 | | | 15,672 | | | (5,741) |
Employers National Insurance Company Inc. | | | NR | | | 9,599 | | | 13,423 | | | (3,824) |
First Insurance Company Of Oklahoma, Inc. | | | NR | | | 9,250 | | | 13,216 | | | (3,966) |
Steadpoint Insurance Company | | | NR | | | 6,611 | | | 8,815 | | | (2,204) |
Total | | | | | 261,954 | | | 222,952 | | | 39,002 | |
| | | | | | | | | |||||
All other reinsurers | | | | | 45,384 | | | 38,577 | | | 6,807 | |
Total recoverables | | | | | $307,338 | | | $261,529 | | | $45,809 | |
• | type of loss; |
• | severity of the injury or damage; |
• | age and occupation of the injured employee; |
• | estimated length of temporary disability; |
• | anticipated permanent disability; |
• | expected medical procedures, costs and duration; |
• | our knowledge of the circumstances surrounding the claim; |
• | insurance policy provisions, including coverage, related to the claim; |
• | jurisdiction of the occurrence; and |
• | other benefits defined by applicable statute. |
Incurred claims and allocated claim adjustment expenses, net of reinsurance For the years ended December 31, (in thousands) | | | As of December 31,2019 | |||||||||||||||||||||||||||||||||
Accident Year | | | 2010 | | | 2011 | | | 2012 | | | 2013 | | | 2014 | | | 2015 | | | 2016 | | | 2017 | | | 2018 | | | 2019 | | | Total of IBNR liabilities plus expected development on reported claims | | | Cumulative number of reported claims |
2010 | | | $11,800 | | | $11,580 | | | $12,396 | | | $12,806 | | | $12,730 | | | $13,557 | | | $13,972 | | | $13,976 | | | $13,777 | | | $13,754 | | | $874 | | | 3,871 |
2011 | | | | | 14,456 | | | 14,923 | | | 16,636 | | | 17,578 | | | 17,620 | | | 17,854 | | | 18,419 | | | 18,834 | | | 18,793 | | | 360 | | | 3,835 | |
2012 | | | | | | | 21,857 | | | 21,831 | | | 20,697 | | | 21,053 | | | 20,331 | | | 20,058 | | | 20,646 | | | 20,690 | | | 642 | | | 4,019 | ||
2013 | | | | | | | | | 24,661 | | | 24,755 | | | 24,280 | | | 21,361 | | | 21,342 | | | 21,506 | | | 21,465 | | | 902 | | | 4,364 | |||
2014 | | | | | | | | | | | 24,580 | | | 22,777 | | | 21,726 | | | 21,571 | | | 21,095 | | | 21,054 | | | 2,118 | | | 4,938 | ||||
2015 | | | | | | | | | | | | | 25,653 | | | 26,571 | | | 26,392 | | | 25,430 | | | 25,630 | | | 5,561 | | | 6,265 | |||||
2016 | | | | | | | | | | | | | | | 33,041 | | | 31,632 | | | 30,746 | | | 28,616 | | | 7,846 | | | 11,049 | ||||||
2017 | | | | | | | | | | | | | | | | | 39,295 | | | 31,462 | | | 29,008 | | | 8,410 | | | 16,396 | |||||||
2018 | | | | | | | | | | | | | | | | | | | 42,349 | | | 36,738 | | | 12,183 | | | 15,031 | ||||||||
2019 | | | | | | | | | | | | | | | | | | | | | 53,009 | | | 27,173 | | | 12,179 | |||||||||
Total | | | | | | | | | | | | | | | | | | | | | $268,757 | | | | | |||||||||||
Cumulative paid claims and allocated claim adjustment expenses, net of reinsurance For the years ended December 31, (in thousands) | ||||||||||||||||||||||||||||||
Accident Year | | | 2010 | | | 2011 | | | 2012 | | | 2013 | | | 2014 | | | 2015 | | | 2016 | | | 2017 | | | 2018 | | | 2019 |
2010 | | | $3,594 | | | $7,007 | | | $8,696 | | | $10,095 | | | $10,911 | | | $11,384 | | | $11,779 | | | $12,154 | | | $12,365 | | | $12,499 |
2011 | | | | | 3,954 | | | 8,815 | | | 12,631 | | | 14,107 | | | 15,405 | | | 16,347 | | | 17,085 | | | 17,515 | | | 18,091 | |
2012 | | | | | | | 6,143 | | | 11,996 | | | 14,480 | | | 16,249 | | | 17,196 | | | 18,188 | | | 19,098 | | | 19,399 | ||
2013 | | | | | | | | | 6,799 | | | 12,602 | | | 15,984 | | | 17,708 | | | 19,246 | | | 19,712 | | | 20,129 | |||
2014 | | | | | | | | | | | 6,011 | | | 12,005 | | | 14,814 | | | 16,666 | | | 17,260 | | | 18,238 | ||||
2015 | | | | | | | | | | | | | 6,269 | | | 13,770 | | | 16,493 | | | 18,026 | | | 18,903 | |||||
2016 | | | | | | | | | | | | | | | 7,509 | | | 15,516 | | | 18,182 | | | 19,286 | ||||||
2017 | | | | | | | | | | | | | | | | | 7,845 | | | 15,259 | | | 18,126 | |||||||
2018 | | | | | | | | | | | | | | | | | | | 8,326 | | | 18,905 | ||||||||
2019 | | | | | | | | | | | | | | | | | | | | | 11,813 | |||||||||
| | | | | | | | | | | | | | | | | | | | | 175,389 | ||||||||||
All outstanding liabilities before 2010, net of reinsurance | | | 4,811 | |||||||||||||||||||||||||||
Liabilities for claims and claim adjustment expenses, net of reinsurance | | | $98,179 | |||||||||||||||||||||||||||
| | | Three months ended March 31, 2020 | | | Year ended December 31, 2019 | |||||||||||||
| | | Cost or Amortized Cost | | | Fair Value | | | % of Total Fair Value | | | Cost or Amortized Cost | | | Fair Value | | | % of Total Fair Value | |
| | | ($ in thousands) | | | | | ($ in thousands) | | | |||||||||
Fixed maturities: | | | | | | | | | | | | | ||||||
U.S. government and government securities | | | $15,374 | | | $15,882 | | | 4.5% | | | $ 15,965 | | | $ 16,129 | | | 4.8% |
Foreign governments | | | 299 | | | 306 | | | 0.1% | | | 299 | | | 302 | | | 0.1% |
States, territories and possessions | | | 5,612 | | | 5,733 | | | 1.6% | | | 4,789 | | | 4,923 | | | 1.5% |
Political subdivisions of states, territories and possessions | | | 24,992 | | | 25,726 | | | 7.3% | | | 24,444 | | | 25,104 | | | 7.4% |
Special revenue and special assessment obligations | | | 64,694 | | | 67,326 | | | 19.2% | | | 59,149 | | | 61,405 | | | 18.1% |
Industrial and public utilities | | | 116,362 | | | 118,012 | | | 33.6% | | | 119,735 | | | 123,207 | | | 36.4% |
Commercial mortgage-backed securities | | | 15,547 | | | 16,334 | | | 4.7% | | | 15,586 | | | 16,312 | | | 4.8% |
Residential mortgage-backed securities | | | 55,492 | | | 57,351 | | | 16.3% | | | 53,467 | | | 54,109 | | | 16.0% |
Other loan-backed securities | | | 41,651 | | | 40,474 | | | 11.5% | | | 35,849 | | | 36,011 | | | 10.6% |
Hybrid securities | | | 357 | | | 353 | | | 0.1% | | | 357 | | | 363 | | | 0.1% |
Total fixed maturities | | | 340,380 | | | 347,497 | | | 98.9% | | | $329,640 | | | $337,865 | | | 99.8% |
| | | | | | | | | | | | | |||||||
Equity securities: | | | | | | | | |||||||||||
Preferred stock | | | 332 | | | 310 | | | 0.1% | | | 337 | | | 343 | | | 0.1% |
Common stock | | | 1,554 | | | 3,353 | | | 1.0% | | | 492 | | | 492 | | | 0.1% |
Total equity securities | | | 1,886 | | | 3,663 | | | 1.1% | | | 829 | | | 835 | | | 0.2% |
Total securities available for sale | | | $342,266 | | | $351,160 | | | 100.0% | | | $330,469 | | | $338,700 | | | 100.0% |
| | | Three months ended March 31, 2020 | | | Year ended December 31, 2019 | |||||||||||||
| | | Cost or Amortized Cost | | | Fair Value | | | % of Total Fair Value | | | Cost or Amortized Cost | | | Fair Value | | | % of Total Fair Value | |
| | | ($ in thousands) | | | | | ($ in thousands) | | | |||||||||
Available for sale: | | | | | | | | | | | | | ||||||
Due in one year or less | | | $19,827 | | | $19,897 | | | 5.7% | | | $ 17,822 | | | $ 17,872 | | | 5.3% |
Due after one year but before five years | | | 115,089 | | | 116,766 | | | 33.6% | | | 120,772 | | | 123,603 | | | 36.6% |
Due after five years but before ten years | | | 53,322 | | | 55,663 | | | 16.0% | | | 50,398 | | | 52,893 | | | 15.7% |
Due after ten years | | | 39,452 | | | 41,012 | | | 11.8% | | | 35,746 | | | 37,065 | | | 11.0% |
Commercial mortgage-backed securities | | | 15,547 | | | 16,334 | | | 4.7% | | | 15,586 | | | 16,312 | | | 4.8% |
Residential mortgage-backed securities | | | 55,492 | | | 57,351 | | | 16.5% | | | 53,467 | | | 54,109 | | | 16.0% |
Other loan-backed securities | | | 41,651 | | | 40,474 | | | 11.7% | | | 35,849 | | | 36,011 | | | 10.6% |
Total | | | $340,380 | | | $347,497 | | | 100.0% | | | $329,640 | | | $337,865 | | | 100.0% |
| | | Three months ended March 31, 2020 | | | Year ended December 31, 2019 | |||||||
| | | Fair Value | | | % of Total Fair Value | | | Fair Value | | | % of Total Fair Value | |
| | | ($ in thousands) | | | ($ in thousands) | |||||||
Rating: | | | | | | | | | ||||
AAA | | | $57,569 | | | 16.6% | | | $ 52,571 | | | 15.6% |
AA | | | 164,382 | | | 47.3% | | | 153,838 | | | 45.5% |
A | | | 96,994 | | | 27.9% | | | 101,040 | | | 29.9% |
BBB | | | 27,060 | | | 7.8% | | | 30,245 | | | 9.0% |
BB | | | 1,443 | | | 0.4% | | | 119 | | | 0.0% |
NR | | | 49 | | | —% | | | 52 | | | 0.0% |
Total | | | $347,497 | | | 100.0% | | | $337,865 | | | 100.0% |
• | Company Action Level Event. Total Adjusted Capital is greater than or equal to 150% but less than 200% of RBC or Total Adjusted Capital greater than or equal to 200% but less than 250% of RBC, and has a negative trend. If there is a Company Action Level Event, the insurer must submit a plan (an “RBC Plan”) outlining, among other things, the corrective actions it intends to take in order to remedy its capital deficiency. |
• | Regulatory Action Level Event. Total Adjusted Capital is greater than or equal to 100% but less than 150% of RBC or the insurer has failed to comply with filing deadlines for its RBC Report or RBC Plan. If there is a Regulatory Action Level Event, the insurer is also required to submit an RBC Plan. In addition, the insurance regulator must undertake a comprehensive examination of the insurer’s financial condition and must issue any appropriate corrective orders. |
• | Authorized Control Level Event. Total Adjusted Capital is below RBC but greater than or equal to 70% of RBC or the insurer has failed to respond to a corrective order. As noted above, if there is an Authorized Control Level Event, the insurance regulator may seek rehabilitation or liquidation of the insurer if it deems it to be in the best interests of the policyholders and creditors of the insurer and the public. |
• | Mandatory Control Level Event. Total Adjusted Capital is below 70% of RBC. If there is a Mandatory Control Level Event, the insurance regulator must seek rehabilitation or liquidation of the insurer. |
Name | | | Age | | | Position |
Andrew M. O’Brien | | | 68 | | | President and Chief Executive Officer, Director |
Julie A. Baron | | | 54 | | | Chief Financial Officer, Treasurer and Secretary |
Joy N. Edler | | | 42 | | | Chief Operating Officer |
Nicholas J. Vassallo | | | 56 | | | Chief Accounting Officer |
Jill K. Johnson | | | 43 | | | General Counsel |
Steven B. Lee | | | 68 | | | Senior Vice President and Director |
Martin A. Ericson | | | 60 | | | Senior Vice President of Underwriting |
Matthew J. Spencer | | | 43 | | | Chief Information Officer |
Daniel G. Tully | | | 59 | | | Chairman |
David G. Ellison | | | 37 | | | Director |
Randall D. Jones | | | 66 | | | Director |
Terry P. Mayotte* | | | 60 | | | Director |
* | Mr. Mayotte is currently a director nominee and will be appointed as a director upon consummation of this offering. |
• | the quality and integrity of our combined financial statements and our financial reporting process; |
• | internal and external auditing and the independent registered public accounting firm’s qualifications and independence; |
• | the performance of our internal audit function and independent registered public accounting firm; |
• | the integrity of our systems of internal accounting and financial controls; and |
• | our compliance with legal and regulatory requirements. |
• | identifying individuals qualified to become board members; |
• | recommending to the board of directors the director nominees for the next annual meeting of stockholders; |
• | leading the board of directors in its annual review of performance; and |
• | recommending a code of conduct and, if deemed appropriate by the compensation, nominating and corporate governance committee, corporate governance guidelines, to the board of directors. |
• | honest and ethical conduct, including the ethical handling of actual or apparent conflicts of interest between personal and professional relationships; |
• | full, fair, accurate, timely and understandable disclosure in reports and documents that we file with, or submit to, the SEC and in other public communications made by us; |
• | compliance with applicable governmental laws, rules and regulations; and |
• | prompt internal reporting to an appropriate person or persons identified in the code of conduct of violations of the code of conduct; and accountability for adherence to the code of conduct. |
Name | | | Fees Earned or Paid in Cash ($)(1) | | | Stock Awards ($)(2) | | | Total ($) |
David G. Ellison | | | — | | | — | | | — |
Randall D. Jones | | | 75,000 | | | — | | | 75,000 |
Daniel G. Tully | | | — | | | — | | | — |
Terry P. Mayotte(3) | | | — | | | — | | | — |
(1) | The amount in this column reflects the cash compensation earned by Mr. Jones, our only non-affiliated and non-employee director, during the fiscal year ended December 31, 2019. |
(2) | None of our directors received stock awards during the fiscal year ended December 31, 2019. As of December 31, 2019, Mr. Jones held 5.43 Class C units in Trean Holdings (of which 2.7 Class C units were unvested as of December 31, 2019) and 393,169.29 Class C units in BIC Holdings (of which 196,584.6 Class C units were unvested as of December 31, 2019). As further described in the section titled “Our organizational structure” on page 12, upon the completion of the transfers, Trean Holdings and BIC Holdings will be dissolved and will distribute in-kind shares of our common stock to the Pre-IPO Unitholders, including Mr. Jones. With respect to each of his Class C units, Mr. Jones will receive an economically equivalent amount of fully-vested shares of our common stock determined based on the initial public offering price. Assuming an initial public offering price of $14.00 per share (the midpoint of the price range set forth on the cover page of this prospectus), Mr. Jones will receive 146,806 shares of our common stock, with a value of $2,055,284. |
(3) | Mr. Mayotte is currently a director nominee and will be appointed as a director upon consummation of this offering. |
• | an annual cash retainer in the amount of $75,000; |
• | for the chairman of any committee of our board of directors, an additional annual cash retainer in the amount of $15,000; |
• | for any member of a committee of our board of directors (not including the chairman), an additional cash retainer in the amount of $5,000; |
• | an annual equity award in the form of service-based restricted stock units; and |
• | reimbursement for all reasonable out-of-pocket expenses incurred in connection with service on our board of directors (including affiliated and employee directors). |
Name and principal position | | | Year | | | Salary ($) | | | Bonus ($)(1) | | | All other compensation ($)(2) | | | Total ($) |
Andrew M. O’Brien President, Chief Executive Officer and Director | | | 2019 | | | 400,000 | | | 600,000 | | | 8,058 | | | 1,008,058 |
Steven B. Lee Senior Vice President and Director | | | 2019 | | | 165,000 | | | 165,000 | | | 12,122 | | | 342,122 |
Julie A. Baron Chief Financial Officer, Treasurer and Secretary | | | 2019 | | | 202,833 | | | 80,000 | | | 7,093 | | | 289,926 |
(1) | Amounts represent a discretionary cash bonus earned by each NEO with respect to performance during the fiscal year ended December 31, 2019. |
(2) | Amounts represent the items listed in the following table: |
Name | | | 401(k) matching contributions ($) | | | Company-paid life insurance premiums ($) |
Andrew M. O’Brien | | | — | | | 8,058 |
Steven B. Lee | | | 4,152 | | | 7,970 |
Julie A. Baron | | | 5,071 | | | 2,022 |
• | the amounts involved exceeded or will exceed the lesser of (i) $120,000 and (ii) 1% of the average of our total assets at year end for the last two completed fiscal years; and |
• | any of our directors, director nominees or executive officers (in each case, including their immediate family members) or beneficial holders of more than 5% of any class of our voting securities had or will have a direct or indirect material interest. |
• | each person or group whom we know to own beneficially more than 5% of our common stock; |
• | each of the directors, the director nominee and named executive officers individually; |
• | all directors, the director nominee and executive officers as a group; and |
• | each of the other selling stockholders. |
Name and Address of Beneficial Owner | | | Shares Beneficially Owned After Reorganization Transactions and Before this Offering | | | Shares of Common Stock Offered | | | Shares Beneficially Owned After Reorganization Transactions and this Offering | | | Shares to be Sold Assuming Full Exercise of Over-allotment Option | | | Shares Beneficially Owned After Reorganization Transactions and this Offering Assuming Full Exercise of Over-allotment Option | |||||||||
| | Shares | | | Percentage | | | Shares | | | Percentage | | | Shares | | | Percentage | ||||||||
Greater than 5% and Selling Stockholders: | | | | | | | | | | | | | | | | | ||||||||
Altaris Funds(1) | | | 30,900,152 | | | 70.2% | | | 1,565,605 | | | 29,334,547 | | | 57.4% | | | 1,393,621 | | | 27,940,926 | | | 54.6% |
Blake Enterprises entities(2) | | | 6,613,606 | | | 15.0% | | | 1,504,435 | | | 5,109,171 | | | 9.9% | | | — | | | 5,109,171 | | | 9.9% |
Named executive officers, directors and director nominee: | | | | | | | | | | | | | | | | | ||||||||
Andrew M. O’Brien(3) | | | 4,734,313 | | | 10.8% | | | 484,662 | | | 4,249,651 | | | 8.3% | | | 213,521 | | | 4,036,130 | | | 7.9% |
Julie A. Baron | | | — | | | — | | | — | | | — | | | — | | | — | | | — | | | — |
David G. Ellison | | | — | | | — | | | — | | | — | | | — | | | — | | | — | | | — |
Randall D. Jones | | | 146,806 | | | * | | | 16,727 | | | 130,079 | | | * | | | — | | | 130,079 | | | * |
Steven B. Lee | | | 1,151,776 | | | 2.6% | | | — | | | 1,151,776 | | | 2.3% | | | — | | | 1,151,776 | | | 2.3% |
Daniel G. Tully | | | — | | | — | | | — | | | — | | | — | | | — | | | — | | | — |
Terry P. Mayotte | | | — | | | — | | | — | | | — | | | — | | | — | | | — | | | — |
All executive officers, directors and director nominee as a group (12 persons) | | | 43,546,653 | | | 99.0% | | | 3,571,429 | | | 39,975,224 | | | 78.2% | | | 1,607,142 | | | 38,368,082 | | | 75.0% |
* | Less than 1% |
(1) | Prior to this offering, consists of (i) 25,113,898 shares of our common stock held by AHP-BHC LLC and 347 shares of our common stock held by AHP-TH LLC and (ii) 5,785,827 shares of our common stock held by ACP-BHC LLC and 80 shares of our common stock held by ACP-TH LLC (collectively, the “Altaris Funds”). After this offering, consists of (i) 23,841,463 shares of our common stock held by AHP-BHC LLC and 329 shares of our common stock held by AHP-TH LLC and (ii) 5,492,679 shares of our common stock held by ACP-BHC LLC and 76 shares of our common stock held by ACP-TH LLC. Daniel G. Tully and George E. Aitken-Davies are members of the board of managers of Altaris Partners, LLC, which has investment and voting control over the shares held by the Altaris Funds. The address of the Altaris Funds is 10 East 53rd Street, 31st floor, New York, NY 10022. |
(2) | Prior to this offering, consists of (i) 4,208,658 shares of our common stock held by Blake Baker Enterprises I, Inc., (ii) 1,202,474 shares of our common stock held by Blake Baker Enterprises II, Inc. and (iii) 1,202,474 shares of our common stock held by Blake Baker Enterprises III, Inc. After this offering, consists of (i) 3,251,291 shares of our common stock held by Blake Baker Enterprises I, Inc., (ii) 928,940 shares of our common stock held by Blake Baker Enterprises II, Inc. and (iii) 928,940 shares of our common stock held by Blake Baker Enterprises III, Inc. The Blake Enterprises entities are owned by The Baker Family Trust, dated July 8, 2019, of which Blake Baker is the sole settlor and trustee. The address of the Blake Enterprises entities is 26650 The Old Road, Suite 110, Valencia, CA 91381. |
(3) | Prior to this offering, consists of 4,734,313 shares of our common stock held by the Andrew M. O’Brien Premarital Trust, of which Mr. O’Brien is the trustee. After this offering, consists of 4,249,651 shares of our common stock held by the Andrew M. O’Brien Premarital Trust, of which Mr. O’Brien is the trustee. |
• | dividend rates; |
• | conversion rights; |
• | voting rights; |
• | terms of redemption and liquidation preferences; and |
• | the number of shares constituting each series. |
• | before the stockholder became interested, the board of directors approved either the business combination or the transaction which resulted in the stockholder becoming an interested stockholder; |
• | upon consummation of the transaction which resulted in the stockholder becoming an interested stockholder, the interested stockholder owned at least 85% of the voting stock of the corporation outstanding at the time the transaction commenced, excluding for purposes of determining the voting stock outstanding, shares owned by persons who are directors and officers; or |
• | at or after the time the stockholder became interested, the business combination was approved by the board of directors of the corporation and authorized at an annual or special meeting of the stockholders by the affirmative vote of at least two-thirds of the outstanding voting stock which is not owned by the interested stockholder. |
Shares of Common Stock | | | Shares Available for Public Sale |
10,714,286 | | | The date of this prospectus |
40,428,571 | | | 180 days following the date of this prospectus, subject to volume, manner of sale and other limitations for affiliates |
• | a citizen or individual resident of the United States; |
• | a corporation, or other entity taxable as a corporation for U.S. federal tax purposes, created or organized in the United States or under the laws of the United States, any state thereof or the District of Columbia; |
• | an estate, the income of which is includible in gross income for U.S. federal income tax purposes regardless of its source; |
• | a trust if (i) a court within the United States is able to exercise primary supervision over the administration of the trust and one or more U.S. persons have the authority to control all substantial decisions of the trust or (ii) it has a valid election in effect under applicable U.S. Treasury regulations to be treated as a U.S. person for U.S. federal income tax purposes; or |
• | an entity or arrangement treated as a partnership for U.S. federal tax purposes. |
• | the gain is effectively connected with a trade or business carried on by the non-U.S. holder within the United States and, if required by an applicable income tax treaty, is attributable to a U.S. permanent establishment of the non-U.S. holder; |
• | the non-U.S. holder is an individual and is present in the United States for 183 days or more in the taxable year of disposition and certain other conditions are satisfied; or |
• | we are or have been a U.S. real property holding corporation for U.S. federal income tax purposes at any time within the shorter of the five-year period ending on the date of the disposition and the non-U.S. holder’s holding period and certain other conditions are satisfied. |
Name | | | Number of Shares |
J.P. Morgan Securities LLC | | | |
Evercore Group, L.L.C. | | | |
William Blair & Company, L.L.C. | | | |
JMP Securities LLC | | | |
Total | | |
| | | Without option to purchase additional shares exercise | | | With full option to purchase additional shares exercise | |
Per Share | | | $ | | | $ |
Total | | | $ | | | $ |
(A) | transfers pursuant to the terms of this offering; |
(B) | transfers of shares of common stock: |
(i) | as a bona fide gift or gifts, |
(ii) | by will, testamentary document or intestate succession, |
(iii) | to any trust, family limited partnership or other entity for the direct or indirect benefit of the lock-up party or the immediate family of the lock-up party (for purposes of the lock-up agreements, “immediate family” shall mean any relationship by blood, marriage or adoption, not more remote than first cousin), |
(iv) | to partners, members, stockholders, trust beneficiaries or other equity owners of the lock-up party (including any subsequent in-kind distributions to or by the lock-up party’s transferees), |
(v) | if the lock-up party is a corporation, partnership, limited liability company, trust or other entity, to any direct or indirect affiliate (as defined in Rule 405 under the Securities Act of 1933) of such party or to any investment fund or other entity controlled or managed by such party or by the management company or investment adviser that controls or manages such party (or an affiliate of such management company or investment adviser), |
(vi) | solely by operation of law, pursuant to a qualified domestic order or in connection with a divorce settlement, and |
(vii) | pursuant to a bona fide third-party tender offer, merger, consolidation or other similar transaction approved by the Company’s board of directors and made to all holders of the Company’s securities involving a Change of Control of the Company, provided that in the event that such tender offer, merger, consolidation or other such transaction is not completed, the common stock owned by the lock-up party shall remain subject to the lock-up restrictions, provided, further, that for purposes of this clause (vii), “Change of Control” shall mean the transfer (whether by tender offer, merger, consolidation, spin-off or other such transaction), in one transaction or a series of related transactions, to a person or group of affiliated persons (other than an Underwriter pursuant to this offering), of the Company’s voting securities if, after such transfer, such person or group of affiliated persons would hold more than 50% of the outstanding voting securities of the Company (or the surviving entity), and provided, further, that any common stock transferred in connection with the tender offer, merger, consolidation or other such transaction shall remain subject to the lock-up restrictions; |
(C) | transfers of common stock or any security convertible into or exercisable or exchangeable for common stock in connection with any of the reorganization transactions as described in this prospectus; |
(D) | common stock acquired by the lock-up party in this offering or in open market transactions subsequent to the closing of this offering, provided that no filing under the Exchange Act or other public announcement shall be required or voluntarily made by the lock-up party regarding such acquisition of common stock; |
(E) | the establishment of a written plan for trading securities pursuant to and in accordance with Rule 10b5-1(c) (a “Rule 10b5-1 Plan”) under the Exchange Act, provided that (i) such Rule 10b5-1 Plan does not provide for the transfer of common stock (and no sales of common stock pursuant to such Rule 10b5-1 Plan shall be made) during the Restricted Period and (ii) no filing under the Exchange Act, or other public announcement shall be required or voluntarily made by the Company regarding the establishment of such Rule 10b5-1 Plan during the lock-up period; |
(F) | transfers of common stock to the Company (or the withholding of common stock by the Company) (i) as payment for the exercise price of any options granted in the ordinary course pursuant to any of the Company’s current or future stock option, equity incentive or benefit plans described in this prospectus or (ii) to satisfy any tax withholding obligations upon the exercise of any such option or the vesting of any restricted common stock or other equity awards granted under any such plan, with any common stock received as contemplated by any transaction described in this clause (E) remaining subject to the lock-up restrictions; provided that any shares of common stock received upon such exercise shall be subject to the restrictions set forth in the lock-up agreements; and provided, further, that any filing required under Section 16(a) of the Exchange Act shall clearly indicate in the footnotes thereto and the transaction codes that any such disposition was made in connection with a “cashless” exercise solely to the Company; and |
(G) | any demands or requests for, exercise any right with respect to, or take any action in preparation of, the registration by the Company under the Securities Act of 1933 of the lock-up party’s shares of common stock, provided that no transfer of the lock-up party’s shares of common stock registered pursuant to the exercise of any such right and no registration statement shall be filed under the Securities Act of 1933 with respect to any of the lock-up party’s shares of common stock during the lock-up period. |
• | the information set forth in this prospectus and otherwise available to the representatives; |
• | our prospects and the history and prospects for the industry in which we compete; |
• | an assessment of our management; |
• | our prospects for future earnings; |
• | the general condition of the securities markets at the time of this offering; |
• | the recent market prices of, and demand for, publicly traded common stock of generally comparable companies; and |
• | other factors deemed relevant by the underwriters, the selling stockholders and us. |
(a) | to any legal entity which is a qualified investor as defined under the Prospectus Regulation; |
(b) | to fewer than 150 natural or legal persons (other than qualified investors as defined under the Prospectus Regulation), subject to obtaining the prior consent of the underwriters; or |
(c) | in any other circumstances falling within Article 1(4) of the Prospectus Regulation, |
(a) | to an institutional investor (as defined in Section 4A of the Securities and Futures Act (Chapter 289) of Singapore, as modified or amended from time to time (the “SFA”)) pursuant to Section 274 of the SFA; |
(b) | to a relevant person (as defined in Section 275(2) of the SFA) pursuant to Section 275(1) of the SFA, or any person pursuant to Section 275(1A) of the SFA, and in accordance with the conditions specified in Section 275 of the SFA; or |
(c) | otherwise pursuant to, and in accordance with the conditions of, any other applicable provision of the SFA. |
(a) | a corporation (which is not an accredited investor (as defined in Section 4A of the SFA)) the sole business of which is to hold investments and the entire share capital of which is owned by one or more individuals, each of whom is an accredited investor; or |
(b) | a trust (where the trustee is not an accredited investor) whose sole purpose is to hold investments and each beneficiary of the trust is an individual who is an accredited investor, securities or securities-based derivatives contracts (each term as defined in Section 2(1) of the SFA) of that corporation or the beneficiaries’ rights and interest (howsoever described) in that trust shall not be transferred within six months after that corporation or that trust has acquired the shares of common stock pursuant to an offer made under Section 275 of the SFA except: |
(i) | to an institutional investor or to a relevant person, or to any person arising from an offer referred to in Section 275(1A) or Section 276(4)(i)(B) of the SFA; |
(ii) | where no consideration is or will be given for the transfer; |
(iii) | where the transfer is by operation of law; |
(iv) | as specified in Section 276(7) of the SFA; or |
(v) | as specified in Regulation 37A of the Securities and Futures (Offers of Investments) (Securities and Securities-based Derivatives Contracts) Regulations 2018. |
| | | Page | |
Trean Insurance Group, Inc. | | | |
Balance Sheets | | | |
| | | ||
| | | ||
| | | ||
| | | ||
BIC Holdings LLC and Trean Holdings LLC | | | |
Unaudited Interim Condensed Combined Financial Statements | | | |
| | | ||
| | | ||
| | | ||
| | | ||
| | | ||
| | | ||
| | | ||
Audited Combined Financial Statements | | | |
| | | ||
| | | ||
| | | ||
| | | ||
| | | ||
| | | ||
| | | ||
| | | ||
| | | ||
| | | ||
| | |
| | | March 31, 2020 | | | February 29, 2020 | |
| | | (unaudited) | | | ||
Assets: | | | | | ||
Current assets: | | | | | ||
Cash | | | $ 10 | | | $ 10 |
Total assets | | | $10 | | | $10 |
| | | | | |||
Commitments and contingencies (Note 3) | | | $— | | | $— |
| | | | | |||
Stockholders’ equity: | | | | | ||
Stockholders’ equity | | | $— | | | $— |
Common stock, par value $0.01 per share, 1,000 shares authorized, issued, and outstanding | | | $10 | | | $10 |
Total stockholders’ equity | | | $10 | | | $10 |
| | | March 31, 2020 | | | December 31, 2019 | |
Assets | | | | | ||
Fixed maturities, at fair value (amortized cost of $340,380 and $329,640, respectively) | | | $347,497 | | | $337,865 |
Preferred stock, at fair value (amortized cost of $332 and $337, respectively) | | | 310 | | | 343 |
Common stock, at fair value (cost $1,554 and $492, respectively) | | | 3,353 | | | 492 |
Equity method investments | | | 11,487 | | | 12,173 |
Total investments | | | 362,647 | | | 350,873 |
Cash and cash equivalents | | | 70,656 | | | 74,268 |
Restricted cash | | | 3,026 | | | 1,800 |
Accrued investment income | | | 2,420 | | | 2,468 |
Premiums and other receivables | | | 67,773 | | | 62,460 |
Related party receivables | | | 21,871 | | | 22,221 |
Reinsurance recoverable | | | 313,760 | | | 307,338 |
Prepaid reinsurance premiums | | | 83,694 | | | 80,088 |
Deferred policy acquisition cost, net | | | 3,103 | | | 2,115 |
Property and equipment, net | | | 8,238 | | | 7,937 |
Right of use asset | | | 5,721 | | | — |
Deferred tax asset | | | 1,280 | | | 1,367 |
Goodwill | | | 2,822 | | | 2,822 |
Other assets | | | 7,572 | | | 3,277 |
Total assets | | | $954,583 | | | $919,034 |
| | | | | |||
Liabilities | | | | | ||
Unpaid loss and loss adjustment expenses | | | $418,757 | | | $406,716 |
Unearned premiums | | | 111,162 | | | 103,789 |
Funds held under reinsurance agreements | | | 165,018 | | | 163,445 |
Reinsurance premiums payable | | | 48,099 | | | 53,620 |
Accounts payable and accrued expenses | | | 18,360 | | | 14,995 |
Lease liability | | | 5,926 | | | — |
Income taxes payable | | | 3,259 | | | 714 |
Long-term debt | | | 28,721 | | | 29,040 |
Total liabilities | | | 799,302 | | | 772,319 |
| | | | | |||
Commitments and contingencies | | | | | ||
Redeemable preferred stock (1,000,000 authorized; 51 outstanding) | | | 5,100 | | | 5,100 |
| | | | | |||
Members' equity | | | | | ||
Members' equity | | | 78,458 | | | 78,438 |
Additional paid-in capital | | | 17,995 | | | 17,995 |
Retained earnings | | | 49,967 | | | 40,361 |
Accumulated other comprehensive income | | | 3,761 | | | 4,821 |
Total members' equity | | | 150,181 | | | 141,615 |
Total liabilities and members' equity | | | $954,583 | | | $919,034 |
| | | Three Months Ended March 31, | ||||
| | | 2020 | | | 2019 | |
Revenues | | | | | ||
Gross written premiums | | | $107,859 | | | $101,534 |
Increase in gross unearned premiums | | | (7,373) | | | (10,952) |
Gross earned premiums | | | 100,486 | | | 90,582 |
Ceded earned premiums | | | (78,027) | | | (70,958) |
Net earned premiums | | | 22,459 | | | 19,624 |
Net investment income | | | 3,272 | | | 1,287 |
Net realized capital gains | | | 3,234 | | | 612 |
Other revenue | | | 4,392 | | | 3,595 |
Total revenue | | | 33,357 | | | 25,118 |
| | | | | |||
Expenses | | | | | ||
Losses and loss adjustment expenses | | | 12,934 | | | 11,456 |
General and administrative expenses | | | 8,160 | | | 3,969 |
Interest expense | | | 461 | | | 624 |
Total expenses | | | 21,555 | | | 16,049 |
| | | | | |||
Other income | | | 14 | | | 93 |
Income before taxes | | | 11,816 | | | 9,162 |
| | | | | |||
Income tax expense | | | 2,912 | | | 1,319 |
Equity earnings in affiliates, net of tax | | | 702 | | | 608 |
Net income | | | $9,606 | | | $8,451 |
| | | Three Months Ended March 31, | ||||
| | | 2020 | | | 2019 | |
Net income | | | $9,606 | | | $8,451 |
| | | | | |||
Other comprehensive income (loss), net of tax: | | | | | ||
Unrealized investment gains (losses): | | | | | ||
Unrealized investment gains (losses) arising during the period | | | (1,223) | | | 4,971 |
Income tax expense (benefit) | | | (256) | | | 1,044 |
Unrealized investment gains (losses), net of tax | | | (967) | | | 3,927 |
| | | | | |||
Less reclassification adjustments to: | | | | | ||
Net realized investment gains (losses) included in net realized capital gains (losses) | | | 119 | | | (22) |
Income tax expense (benefit) | | | 26 | | | (5) |
Total reclassifications included in net income (loss), net of tax | | | 93 | | | (17) |
| | | | | |||
Other comprehensive income (loss) | | | (1,060) | | | 3,944 |
| | | | | |||
Total comprehensive income | | | $8,546 | | | $12,395 |
| | | | | | | | | | | Members' Equity | | | ||||||||||||||||||||||||||||||||||||
| | | Redeemable Preferred Stock | | | Preferred Stock | | | Class A - Non Voting | | | Class B - Voting | | | Class B - Non Voting | | | Class C - Non Voting | | | Additional Paid in Capital | | | Accumulated Other Comprehensive Income (Loss) | | | Retained Earnings | | | Total Members' Equity | |||||||||||||||||||
| | | Shares | | | Amount | | | Shares | | | Amount | | | Units | | | Amount | | | Units | | | Amount | | | Units | | | Amount | | | Units | | | Amount | | ||||||||||||
Balance at December 31, 2019 | | | 51 | | | $5,100 | | | — | | | $— | | | 65,036,780 | | | $65,037 | | | 5,045,215 | | | $5,045 | | | 8,159,775 | | | $8,160 | | | 196,588 | | | $196 | | | $17,995 | | | $4,821 | | | $40,361 | | | $141,615 |
Issuance of Class C units | | | — | | | — | | | — | | | — | | | — | | | — | | | — | | | — | | | — | | | — | | | 19,659 | | | 20 | | | — | | | — | | | — | | | 20 |
Other comprehensive loss | | | — | | | — | | | — | | | — | | | — | | | — | | | — | | | — | | | — | | | — | | | — | | | — | | | — | | | (1,060) | | | — | | | (1,060) |
Net income | | | — | | | — | | | — | | | — | | | — | | | — | | | — | | | — | | | — | | | — | | | — | | | — | | | — | | | — | | | 9,606 | | | 9,606 |
Balance at March 31, 2020 | | | 51 | | | $5,100 | | | — | | | $— | | | 65,036,780 | | | $65,037 | | | 5,045,215 | | | $5,045 | | | 8,159,775 | | | $8,160 | | | 216,247 | | | $216 | | | $17,995 | | | $3,761 | | | $49,967 | | | $150,181 |
| | | | | | | | | | | Members' Equity | | | ||||||||||||||||||||||||||||||||||||
| | | Redeemable Preferred Stock | | | Preferred Stock | | | Class A - Non Voting | | | Class B - Voting | | | Class B - Non Voting | | | Class C - Non Voting | | | Additional Paid in Capital | | | Accumulated Other Comprehensive Income (Loss) | | | Retained Earnings | | | Total Members' Equity | |||||||||||||||||||
| | | Shares | | | Amount | | | Shares | | | Amount | | | Units | | | Amount | | | Units | | | Amount | | | Units | | | Amount | | | Units | | | Amount | | ||||||||||||
Balance at December 31, 2018 | | | 60 | | | $6,000 | | | 10 | | | $1,000 | | | 65,036,780 | | | $65,037 | | | 5,045,215 | | | $5,045 | | | 8,159,775 | | | $8,160 | | | 117,953 | | | $118 | | | $17,995 | | | $(2,003) | | | $9,779 | | | $105,131 |
Cumulative effect of adopting ASC Topic 606 | | | — | | | — | | | — | | | — | | | — | | | — | | | — | | | — | | | — | | | — | | | — | | | — | | | — | | | — | | | 695 | | | 695 |
Issuance of Class C units | | | — | | | — | | | — | | | — | | | — | | | — | | | — | | | — | | | — | | | — | | | 19,659 | | | 19 | | | — | | | — | | | — | | | 19 |
Dividends paid on Series A preferred stock | | | — | | | — | | | — | | | — | | | — | | | — | | | — | | | — | | | — | | | — | | | — | | | — | | | — | | | — | | | (9) | | | (9) |
Other comprehensive income | | | — | | | — | | | — | | | — | | | — | | | — | | | — | | | — | | | — | | | — | | | — | | | — | | | — | | | 3,944 | | | — | | | 3,944 |
Net income | | | — | | | — | | | — | | | — | | | — | | | — | | | — | | | — | | | — | | | — | | | — | | | — | | | — | | | — | | | 8,451 | | | 8,451 |
Balance at March 31, 2019 | | | 60 | | | $6,000 | | | 10 | | | $1,000 | | | 65,036,780 | | | $65,037 | | | 5,045,215 | | | $5,045 | | | 8,159,775 | | | $8,160 | | | 137,612 | | | $137 | | | $17,995 | | | $1,941 | | | $18,916 | | | $118,231 |
| | | Three Months Ended March 31, | ||||
| | | 2020 | | | 2019 | |
Operating activities | | | | | ||
Net income | | | $9,606 | | | $8,451 |
Adjustments to reconcile net income to net cash from operating activities: | | | | | ||
Depreciation and amortization | | | 208 | | | 182 |
Net capital gains on investments | | | (5,018) | | | (106) |
Deferred offering costs | | | (432) | | | — |
Gain on bargain purchase of subsidiary | | | — | | | (634) |
Bond amortization and accretion | | | 399 | | | 433 |
Issuance of member units as compensation | | | 20 | | | 19 |
Equity earnings in affiliates, net of tax | | | (702) | | | (608) |
Distributions from equity method investments | | | 1,389 | | | 518 |
Deferred income taxes | | | 367 | | | (162) |
Deferred financing costs | | | 25 | | | 25 |
Changes in operating assets and liabilities: | | | | | ||
Accrued investment income | | | 48 | | | (84) |
Premiums and other receivables | | | (4,962) | | | (10,756) |
Reinsurance recoverable on paid and unpaid losses | | | (6,422) | | | (13,758) |
Prepaid reinsurance premiums | | | (3,606) | | | (9,490) |
Right of use asset | | | (5,721) | | | — |
Other assets | | | (2,791) | | | (1,133) |
Unpaid loss and loss adjustment expenses | | | 12,042 | | | 17,518 |
Unearned premiums | | | 7,373 | | | 10,365 |
Funds held under reinsurance agreements | | | 1,358 | | | 2,833 |
Reinsurance premiums payable | | | (5,522) | | | 6,616 |
Accounts payable and accrued expenses | | | 1,299 | | | (2,554) |
Lease liability | | | 5,926 | | | — |
Income taxes payable | | | 2,544 | | | 1,657 |
Net cash provided by operating activities | | | 7,428 | | | 9,332 |
Investing activities | | | | | ||
Payments for capital expenditures | | | (504) | | | (245) |
Proceeds from sale of equity method investment | | | 3,000 | | | — |
Return of capital on equity method investment | | | 115 | | | — |
Purchase of investments, available for sale | | | (24,323) | | | (23,630) |
Proceeds from investments sold, matured or repaid | | | 12,242 | | | 17,891 |
Acquisition of subsidiary, net of cash received | | | — | | | (5,496) |
Net cash used in investing activities | | | (9,470) | | | (11,480) |
Financing activities | | | | | ||
Principal payments on long-term debt | | | (344) | | | (344) |
Dividends paid on preferred stock | | | — | | | (28) |
Net cash used in financing activities | | | (344) | | | (372) |
Net decrease in cash, cash equivalents and restricted cash | | | (2,386) | | | (2,520) |
Cash, cash equivalents and restricted cash - beginning of period | | | 76,068 | | | 55,962 |
Cash, cash equivalents and restricted cash - end of period | | | $73,682 | | | $53,442 |
Disaggregation of cash and restricted cash: | | | As of March 31, 2020 | | | As of March 31, 2019 |
Cash and cash equivalents | | | $70,656 | | | $51,933 |
Restricted cash and restricted cash equivalents | | | 3,026 | | | 1,509 |
Total cash, cash equivalents and restricted cash | | | $73,682 | | | $53,442 |
| | | Three Months Ended March 31, | ||||
Supplemental disclosure of cash flow information: | | | 2020 | | | 2019 |
Cash paid during the year for: | | | | | ||
Interest | | | $436 | | | $364 |
Non-cash investing and financing activity: | | | | | ||
Issuance of Class C member units as compensation | | | 20 | | | 19 |
Right-of-use assets obtained in exchange for new operating lease liabilities | | | 6,261 | | | — |
Cash paid for amounts included in the measurement of lease liabilities: | | | | | ||
Operating cash flows from operating leases | | | 424 | | | — |
Fair value of total consideration transferred | | | $5,314 |
Recognized amounts of identifiable assets acquired and liabilities assumed: | | | |
Cash | | | 973 |
Investments | | | 4,252 |
Accrued investment income | | | 40 |
Premiums and other receivables | | | 1,571 |
Deferred tax asset | | | 242 |
Other assets | | | 10 |
Unpaid loss and loss adjustment expenses | | | (6,426) |
Unearned premiums | | | (1,003) |
Funds held under reinsurance agreements | | | 7,980 |
Reinsurance premiums payable | | | (1,037) |
Accounts payable and accrued expenses | | | (316) |
Income taxes payable | | | (338) |
Net assets acquired | | | 5,948 |
Gain on bargain purchase | | | $634 |
| | | March 31, 2020 | ||||||||||
(in thousands) | | | Level 1 | | | Level 2 | | | Level 3 | | | Total |
Fixed maturities: | | | | | | | | | ||||
U.S. government and government securities | | | $15,707 | | | $175 | | | $— | | | $15,882 |
Foreign governments | | | — | | | 306 | | | — | | | 306 |
States, territories and possessions | | | — | | | 5,733 | | | — | | | 5,733 |
Political subdivisions of states territories and possessions | | | — | | | 25,726 | | | — | | | 25,726 |
Special revenue and special assessment obligations | | | — | | | 67,326 | | | — | | | 67,326 |
Industrial and public utilities | | | — | | | 118,012 | | | — | | | 118,012 |
Commercial mortgage-backed securities | | | — | | | 16,334 | | | — | | | 16,334 |
Residential mortgage-backed securities | | | — | | | 57,351 | | | — | | | 57,351 |
Other loan-backed securities | | | — | | | 40,474 | | | — | | | 40,474 |
Hybrid securities | | | — | | | 353 | | | — | | | 353 |
Total fixed maturities | | | 15,707 | | | 331,790 | | | — | | | 347,497 |
Equity securities: | | | | | | | | | ||||
Preferred stock | | | — | | | 310 | | | — | | | 310 |
Common stock | | | 777 | | | 576 | | | 2,000 | | | 3,353 |
Total equity securities | | | 777 | | | 886 | | | 2,000 | | | 3,663 |
Total investments | | | $16,484 | | | $332,676 | | | $2,000 | | | $351,160 |
| | | | | | | | | |||||
Funds held under reinsurance agreements | | | — | | | 165,018 | | | — | | | 165,018 |
| | | | | | | | | |||||
Long-term debt: | | | | | | | | | ||||
Junior subordinated debt | | | — | | | 7,732 | | | — | | | 7,732 |
Secured credit facility | | | — | | | 21,293 | | | — | | | 21,293 |
Total long-term debt | | | $— | | | $29,025 | | | $— | | | $29,025 |
| | | December 31, 2019 | ||||||||||
(in thousands) | | | Level 1 | | | Level 2 | | | Level 3 | | | Total |
Fixed maturities: | | | | | | | | | ||||
U.S. government and government securities | | | $16,129 | | | $— | | | $— | | | $16,129 |
Foreign governments | | | — | | | 302 | | | — | | | 302 |
States, territories and possessions | | | — | | | 4,923 | | | — | | | 4,923 |
Political subdivisions of states, territories and possessions | | | — | | | 25,104 | | | — | | | 25,104 |
Special revenue and special assessment obligations | | | — | | | 61,405 | | | — | | | 61,405 |
Industrial and public utilities | | | — | | | 123,207 | | | — | | | 123,207 |
Commercial mortgage-backed securities | | | — | | | 16,312 | | | — | | | 16,312 |
Residential mortgage-backed securities | | | — | | | 54,109 | | | — | | | 54,109 |
Other loan-backed securities | | | — | | | 36,011 | | | — | | | 36,011 |
Hybrid securities | | | — | | | 363 | | | — | | | 363 |
Total fixed maturities | | | 16,129 | | | 321,736 | | | — | | | 337,865 |
Equity securities: | | | | | | | | | ||||
Preferred stock | | | — | | | 343 | | | — | | | 343 |
Common stock | | | — | | | 492 | | | — | | | 492 |
Total equity securities | | | — | | | 835 | | | — | | | 835 |
Total investments | | | $16,129 | | | $322,571 | | | $— | | | $338,700 |
| | | | | | | | | |||||
Funds held under reinsurance agreements | | | — | | | 163,445 | | | — | | | 163,445 |
| | | | | | | | | |||||
Long-term debt: | | | | | | | | | ||||
Junior subordinated debt | | | — | | | 7,732 | | | — | | | 7,732 |
Secured credit facility | | | — | | | 21,637 | | | — | | | 21,637 |
Total long-term debt | | | $— | | | $29,369 | | | $— | | | $29,369 |
| | | March 31, 2020 | ||||||||||
(in thousands) | | | Cost or Amortized Cost | | | Gross Unrealized Gains | | | Gross Unrealized Losses | | | Fair Value |
Fixed maturities: | | | | | | | | | ||||
U.S. government and government securities | | | $15,374 | | | $508 | | | $— | | | $15,882 |
Foreign governments | | | 299 | | | 7 | | | — | | | 306 |
States, territories and possessions | | | 5,612 | | | 123 | | | (2) | | | 5,733 |
Political subdivisions of states, territories and possessions | | | 24,992 | | | 757 | | | (23) | | | 25,726 |
Special revenue and special assessment obligations | | | 64,694 | | | 2,672 | | | (40) | | | 67,326 |
Industrial and public utilities | | | 116,362 | | | 2,417 | | | (767) | | | 118,012 |
Commercial mortgage-backed securities | | | 15,547 | | | 878 | | | (91) | | | 16,334 |
Residential mortgage-backed securities | | | 55,492 | | | 1,955 | | | (96) | | | 57,351 |
Other loan-backed securities | | | 41,651 | | | 142 | | | (1,319) | | | 40,474 |
Hybrid securities | | | 357 | | | 1 | | | (5) | | | 353 |
Total fixed maturities available for sale | | | $340,380 | | | $9,460 | | | $(2,343) | | | $347,497 |
| | | December 31, 2019 | ||||||||||
(in thousands) | | | Cost or Amortized Cost | | | Gross Unrealized Gains | | | Gross Unrealized Losses | | | Fair Value |
Fixed maturities: | | | | | | | | | ||||
U.S. government and government securities | | | $15,965 | | | $167 | | | $(3) | | | $16,129 |
Foreign governments | | | 299 | | | 3 | | | — | | | 302 |
States, territories and possessions | | | 4,789 | | | 134 | | | — | | | 4,923 |
Political subdivisions of states, territories and possessions | | | 24,444 | | | 670 | | | (10) | | | 25,104 |
Special revenue and special assessment obligations | | | 59,149 | | | 2,298 | | | (42) | | | 61,405 |
Industrial and public utilities | | | 119,735 | | | 3,490 | | | (18) | | | 123,207 |
Commercial mortgage-backed securities | | | 15,586 | | | 757 | | | (31) | | | 16,312 |
Residential mortgage-backed securities | | | 53,467 | | | 679 | | | (37) | | | 54,109 |
Other loan-backed securities | | | 35,849 | | | 281 | | | (119) | | | 36,011 |
Hybrid securities | | | 357 | | | 6 | | | — | | | 363 |
Total fixed maturities available for sale | | | $329,640 | | | $8,485 | | | $(260) | | | $337,865 |
| | | March 31, 2020 | ||||||||||||||||
| | | Less Than 12 Months | | | 12 Months or More | | | Total | ||||||||||
(in thousands) | | | Fair Value | | | Unrealized Loss | | | Fair Value | | | Unrealized Loss | | | Fair Value | | | Unrealized Loss |
Fixed maturities: | | | | | | | | | | | | | ||||||
U.S. government and government securities | | | $275 | | | $— | | | $— | | | $— | | | $275 | | | $— |
Foreign governments | | | — | | | — | | | — | | | — | | | — | | | — |
States, territories and possessions | | | 1,346 | | | (2) | | | — | | | — | | | 1,346 | | | (2) |
Political subdivisions of states, territories and possessions | | | 1,019 | | | (23) | | | — | | | — | | | 1,019 | | | (23) |
Special revenue and special assessment obligations | | | 3,666 | | | (40) | | | — | | | — | | | 3,666 | | | (40) |
Industrial and public utilities | | | 26,650 | | | (767) | | | — | | | — | | | 26,650 | | | (767) |
Commercial mortgage-backed securities | | | 1,966 | | | (91) | | | — | | | — | | | 1,966 | | | (91) |
Residential mortgage-backed securities | | | 862 | | | (65) | | | 502 | | | (31) | | | 1,364 | | | (96) |
Other loan-backed securities | | | 19,746 | | | (522) | | | 10,011 | | | (797) | | | 29,757 | | | (1,319) |
Hybrid securities | | | 102 | | | (5) | | | — | | | — | | | 102 | | | (5) |
Total bonds | | | $55,632 | | | $(1,515) | | | $10,513 | | | $(828) | | | $66,145 | | | $(2,343) |
| | | December 31, 2019 | ||||||||||||||||
| | | Less Than 12 Months | | | 12 Months or More | | | Total | ||||||||||
(in thousands) | | | Fair Value | | | Unrealized Loss | | | Fair Value | | | Unrealized Loss | | | Fair Value | | | Unrealized Loss |
Fixed maturities: | | | | | | | | | | | | | ||||||
U.S. government and government securities | | | $293 | | | $(2) | | | $1,349 | | | $(1) | | | $1,642 | | | $(3) |
Foreign governments | | | — | | | — | | | — | | | — | | | — | | | — |
States, territories and possessions | | | — | | | — | | | — | | | — | | | — | | | — |
Political subdivisions of states, territories and possessions | | | 1,500 | | | (9) | | | 690 | | | (1) | | | 2,190 | | | (10) |
Special revenue and special assessment obligations | | | 3,206 | | | (42) | | | 181 | | | — | | | 3,387 | | | (42) |
Industrial and public utilities | | | 5,939 | | | (16) | | | 1,094 | | | (2) | | | 7,033 | | | (18) |
Commercial mortgage-backed securities | | | 2,138 | | | (30) | | | 129 | | | (1) | | | 2,267 | | | (31) |
Residential mortgage-backed securities | | | 6,936 | | | (13) | | | 1,917 | | | (24) | | | 8,853 | | | (37) |
Other loan-backed securities | | | 2,189 | | | (11) | | | 13,885 | | | (108) | | | 16,074 | | | (119) |
Hybrid securities | | | — | | | — | | | — | | | — | | | — | | | — |
Total bonds | | | $22,201 | | | $(123) | | | $19,245 | | | $(137) | | | $41,446 | | | $(260) |
(in thousands) | | | Cost or Amortized Cost | | | Fair Value |
Available for sale: | | | | | ||
Due in one year or less | | | $19,827 | | | $19,897 |
Due after one year but before five years | | | 115,089 | | | 116,766 |
Due after five years but before ten years | | | 53,322 | | | 55,663 |
Due after ten years | | | 39,452 | | | 41,012 |
Commercial mortgage-backed securities | | | 15,547 | | | 16,334 |
Residential mortgage-backed securities | | | 55,492 | | | 57,351 |
Other loan-backed securities | | | 41,651 | | | 40,474 |
Total | | | $340,380 | | | $347,497 |
| | | Three Months Ended March 31, | ||||
(in thousands) | | | 2020 | | | 2019 |
Fixed maturities: | | | | | ||
Gains | | | $119 | | | $1 |
Losses | | | — | | | (23) |
Total fixed maturities | | | 119 | | | (22) |
Equity securities: | | | | | ||
Equity method investments: | | | | | ||
Gains | | | 3,115 | | | — |
Total equity securities | | | 3,115 | | | — |
Total net investment realized gains (losses) | | | $3,234 | | | $(22) |
| | | Three Months Ended March 31, | ||||
(in thousands) | | | 2020 | | | 2019 |
Fixed maturities | | | $1,472 | | | $1,269 |
Preferred stock | | | (14) | | | (4) |
Common stock | | | 1,799 | | | — |
Interest earned on cash and short-term investments | | | 15 | | | 22 |
Net investment income | | | $3,272 | | | $1,287 |
(in thousands) | | | March 31, 2020 | | | December 31, 2019 |
Junior subordinated debt | | | $7,732 | | | $7,732 |
Secured credit facility | | | 21,293 | | | 21,637 |
Long-term debt | | | 29,025 | | | 29,369 |
Less: unamortized deferred financing costs | | | (304) | | | (329) |
Net long-term debt | | | $28,721 | | | $29,040 |
| | | Three Months Ended March 31, | ||||
(in thousands) | | | 2020 | | | 2019 |
Brokerage | | | $3,693 | | | $2,703 |
Managing general agent fees | | | 154 | | | 340 |
Third-party administrator fees | | | 384 | | | 414 |
Consulting fees | | | 161 | | | 138 |
Total revenue from contracts with customers | | | $4,392 | | | $3,595 |
(in thousands) | | | March 31, 2020 | | | December 31, 2019 |
Contract assets | | | $3,049 | | | $1,103 |
| | | Three Months Ended March 31, | ||||
(in thousands) | | | 2020 | | | 2019 |
Unpaid losses and LAE reserves at beginning of period | | | $406,716 | | | $340,415 |
Less losses ceded through reinsurance | | | (304,005) | | | (257,421) |
Net unpaid losses and LAE at beginning of period | | | 102,711 | | | 82,994 |
Acquisition of First Choice Casualty Insurance Company | | | — | | | 6,366 |
Incurred losses and LAE related to: | | | | | ||
Current period | | | 14,169 | | | 12,929 |
Prior period | | | (1,235) | | | (1,473) |
Total incurred losses and LAE | | | 12,934 | | | 11,456 |
Paid losses and LAE, net of reinsurance, related to: | | | | | ||
Current period | | | 1,198 | | | 1,098 |
Prior period | | | 7,795 | | | 6,363 |
Total paid losses and LAE | | | 8,993 | | | 7,461 |
Net unpaid losses and LAE at end of period | | | 106,652 | | | 93,355 |
Plus losses ceded through reinsurance | | | 312,105 | | | 271,005 |
Unpaid losses and LAE reserves at end of period | | | $418,757 | | | $364,360 |
| | | Three Months Ended March 31, | ||||||||||||||||||||||
| | | 2020 | | | 2019 | |||||||||||||||||||
(in thousands) | | | Gross | | | Assumed | | | Ceded | | | Net | | | Gross | | | Assumed | | | Ceded | | | Net |
Written premiums | | | $105,977 | | | $1,882 | | | $(81,632) | | | $26,227 | | | $99,358 | | | $2,176 | | | $(80,449) | | | $21,085 |
Earned premiums | | | 98,543 | | | 1,943 | | | (78,027) | | | 22,459 | | | 88,553 | | | 2,029 | | | (70,958) | | | 19,624 |
(dollars in thousands) | | | March 31, 2020 |
Right of use asset | | | $5,721 |
Lease liability | | | $5,926 |
Weighted average remaining lease term | | | 3.91 years |
Weighted average discount rate | | | 6.51% |
(in thousands) | | | Operating Leases |
2020 | | | $1,333 |
2021 | | | 1,724 |
2022 | | | 1,689 |
2023 | | | 1,217 |
2024 | | | 670 |
Thereafter | | | 86 |
Total lease payments | | | 6,719 |
Less: imputed interest | | | (793) |
Total lease liabilities | | | $5,926 |
(in thousands) | | | Rent Expense |
2020 | | | $1,718 |
2021 | | | 1,614 |
2022 | | | 1,594 |
2023 | | | 1,191 |
2024 | | | 669 |
Thereafter | | | 46 |
Total lease payments | | | $6,832 |
1) | Class A Units: Receive an allocation of profits and losses incurred by the Company as well as maintain the right to receive distributions, along with Class B Units, on a pro rata basis prior to distributions made to other classes of ownership units. |
2) | Class B Units: Receive an allocation of profits and losses incurred by the Company as well as maintain the right to receive distributions, along with Class A Units, on a pro rata basis prior to distributions made to other classes of ownership units. Class B maintains both voting and non-voting units. Each Class B Voting Unit is entitled to one vote per Class B Voting Unit on each matter to which the members are entitled to vote. Class B Non-Voting Units maintain all rights, preferences and privileges allowed to Class B Voting Units with the exception of voting rights. |
3) | Class C Units: Receive an allocation of profits and losses incurred by the Company. Participating Class C Units maintain the right to receive distributions after any Class A or Class B units based on the unit holders’ pro rata share. |
1. | Upon demand by a majority of the shareholders having voting rights in the Company |
2. | Upon termination of the underlying stock purchase agreement between the Series A holders and Trean (only applicable to Series A shares) |
3. | Any refinancing, recapitalization, sale of assets or stock by Trean Corp or Benchmark Holding Company that results in a realization of gain by the shareholders, to the extent the same is distributed to shareholders, whether in a single or a series of distributions (only applicable to Series A shares) |
4. | Change in the majority control of the Company (only applicable to Series B shares) |
5. | The termination of the shareholder customer agreement (only applicable to Series B shares) |
6. | A qualified initial public offering of Trean Corp or Benchmark Holding Company |
| | | Three Months Ended March 31, 2019 | |||||||
| | | Total Dividend | | | Dividend per Share | | | Weighted Average Shares | |
Dividends on preferred shares - Series A | | | $9 | | | $878.59 | | | 10.00 |
| | | Three Months Ended March 31, | ||||
(in thousands) | | | 2020 | | | 2019 |
Balance at beginning of period | | | $4,821 | | | $(2,003) |
Other comprehensive income (loss), net of tax: | | | | | ||
Unrealized investment gains (losses): | | | | | ||
Unrealized investment gains (losses) arising during the period | | | (1,223) | | | 4,971 |
Income tax expense (benefit) | | | (256) | | | 1,044 |
Unrealized investment gains (losses), net of tax | | | (967) | | | 3,927 |
Less: reclassification adjustments to: | | | | | ||
Net realized investment gains (losses) included in net realized capital gains (losses) | | | 119 | | | (22) |
Income tax expense (benefit) | | | 26 | | | (5) |
Total reclassifications included in net income, net of tax | | | 93 | | | (17) |
Other comprehensive income (loss) | | | (1,060) | | | 3,944 |
Balance at end of period | | | $3,761 | | | $1,941 |
(in thousands, except share data) | | | 2019 | | | 2018 | | ||
Assets | | | | | | ||||
Fixed maturities, at fair value (amortized cost of $329,640 and $309,771, respectively) | | | $337,865 | | | $307,237 | | ||
Preferred stock, at fair value (amortized cost of $337 and $325, respectively) | | | 343 | | | 321 | | ||
Common stock, at fair value (amortized cost of $492 and $0, respectively) | | | 492 | | | — | | ||
Equity method investments | | | 12,173 | | | 13,900 | | ||
Total investments | | | 350,873 | | | 321,458 | | | |
Cash and cash equivalents | | | 74,268 | | | 53,574 | | ||
Restricted cash | | | 1,800 | | | 2,389 | | ||
Accrued investment income | | | 2,468 | | | 2,372 | | ||
Premiums and other receivables | | | 62,460 | | | 62,400 | | ||
Related party receivables | | | 22,221 | | | 15,934 | | ||
Reinsurance recoverable | | | 307,338 | | | 257,509 | | ||
Prepaid reinsurance premiums | | | 80,088 | | | 66,765 | | ||
Deferred policy acquisition cost, net | | | 2,115 | | | 2,976 | | ||
Property and equipment, net | | | 7,937 | | | 8,134 | | ||
Deferred tax asset | | | 1,367 | | | 1,823 | | ||
Goodwill | | | 2,822 | | | 2,822 | | ||
Other assets | | | 3,277 | | | 1,963 | | ||
Total assets | | | $919,034 | | | $800,119 | | ||
| | | | | | |||||
Liabilities | | | | | | ||||
Unpaid loss and loss adjustment expenses | | | $406,716 | | | $340,415 | | ||
Unearned premiums | | | 103,789 | | | 90,074 | | ||
Funds held under reinsurance agreements | | | 163,445 | | | 166,838 | | ||
Reinsurance premiums payable | | | 53,620 | | | 40,135 | | ||
Accounts payable and accrued expenses | | | 14,995 | | | 15,004 | | ||
Shares subject to mandatory redemption | | | — | | | 1,096 | | ||
Income taxes payable | | | 714 | | | 1,655 | | ||
Long-term debt | | | 29,040 | | | 33,771 | | ||
Total liabilities | | | 772,319 | | | 688,988 | | ||
| | | | | | |||||
Commitments and contingencies (Note 18 and Note 23) | | | | | | ||||
Redeemable preferred stock (1,000,000 authorized; 51 and 60 outstanding, respectively) | | | 5,100 | | | 6,000 | | ||
| | | | | | |||||
Members’ equity | | | | | | ||||
Members’ equity | | | 78,438 | | | 78,360 | | ||
Preferred stock, $0.01 par value (1,000,000 authorized; 0 and 10 outstanding, respectively) | | | — | | | 1,000 | | ||
Additional paid-in capital | | | 17,995 | | | 17,995 | | ||
Retained earnings | | | 40,361 | | | 9,779 | | ||
Accumulated other comprehensive income (loss) | | | 4,821 | | | (2,003) | | ||
Total members’ equity | | | 141,615 | | | 105,131 | | ||
Total liabilities and members’ equity | | | $919,034 | | | $800,119 | |
(in thousands) | | | 2019 | | | 2018 |
Revenues | | | | | ||
Gross written premiums | | | $411,401 | | | $357,007 |
Increase in gross unearned premiums | | | (13,598) | | | (16,862) |
Gross earned premiums | | | 397,803 | | | 340,145 |
Ceded earned premiums | | | (311,325) | | | (273,569) |
Net earned premiums | | | 86,478 | | | 66,576 |
Net investment income | | | 6,245 | | | 4,816 |
Net realized capital gains (losses) | | | 667 | | | (715) |
Other revenue | | | 9,125 | | | 7,826 |
Total revenue | | | 102,515 | | | 78,503 |
| | | | | |||
Expenses | | | | | ||
Losses and loss adjustment expenses | | | 44,661 | | | 35,729 |
General and administrative expenses | | | 21,005 | | | 15,706 |
Interest expense | | | 2,169 | | | 1,557 |
Total expenses | | | 67,835 | | | 52,992 |
| | | | | |||
Other income | | | 121 | | | 639 |
Income before taxes | | | 34,801 | | | 26,150 |
| | | | | |||
Provision for income taxes | | | 7,074 | | | 5,546 |
Equity earnings (losses) in affiliates, net of tax | | | 3,558 | | | (1,082) |
Net income | | | $31,285 | | | $19,522 |
(in thousands) | | | 2019 | | | 2018 |
Net income | | | $31,285 | | | $19,522 |
| | | | | |||
Other comprehensive income (loss), net of tax: | | | | | ||
Unrealized investment gains (losses): | | | | | ||
Unrealized investment gains (losses) arising during the period | | | 8,708 | | | (3,964) |
Income tax expense (benefit) | | | 1,831 | | | (832) |
Unrealized investment gains (losses), net of tax | | | 6,877 | | | (3,132) |
| | | | | |||
Less: reclassification adjustments to: | | | | | ||
Net realized investment gains (losses) included in net realized capital gains (losses) | | | 67 | | | (225) |
Income tax expense (benefit) | | | 14 | | | (47) |
Total reclassifications included in net income (loss), net of tax | | | 53 | | | (178) |
| | | | | |||
Other comprehensive income (loss) | | | 6,824 | | | (2,954) |
| | | | | |||
Total comprehensive income | | | $38,109 | | | $16,568 |
| | | | | | | | | | | Members’ Equity | | | | | | | | | ||||||||||||||||||||||||||||||
| | | Redeemable Preferred Stock | | | Preferred Stock | | | Class A - Non-Voting | | | Class B - Voting | | | Class B - Non-Voting | | | Class C - Non- Voting | | | Additional Paid in Capital | | | Accumulated Other Comprehensive Income (Loss) | | | (Accumulated Deficit) Retained Earnings | | | Total Members’ Equity | |||||||||||||||||||
(in thousands, except for share and unit data) | | | Shares | | | Amount | | | Shares | | | Amount | | | Units | | | Amount | | | Units | | | Amount | | | Units | | | Amount | | | Units | | | Amount | | |||||||||||
Balance at January 1, 2018 | | | 50 | | | $5,000 | | | 30 | | | $3,000 | | | 65,036,780 | | | $65,037 | | | 5,045,215 | | | $5,045 | | | 8,159,775 | | | $8,160 | | | 39,317 | | | $39 | | | $17,995 | | | $951 | | | $(8,062) | | | $92,165 |
Issuance of Class C units | | | — | | | — | | | — | | | — | | | — | | | — | | | — | | | — | | | — | | | — | | | 78,636 | | | 79 | | | — | | | — | | | — | | | 79 |
Distributions to members | | | — | | | — | | | — | | | — | | | — | | | — | | | — | | | — | | | — | | | — | | | — | | | — | | | — | | | — | | | (1,456) | | | (1,456) |
Dividends paid on Series A preferred stock (Note 19) | | | — | | | — | | | — | | | — | | | — | | | — | | | — | | | — | | | — | | | — | | | — | | | — | | | — | | | — | | | (45) | | | (45) |
Dividends paid on Series B preferred stock (Note 19) | | | — | | | — | | | — | | | — | | | — | | | — | | | — | | | — | | | — | | | — | | | — | | | — | | | — | | | — | | | (180) | | | (180) |
Redemption of Series A Redeemable Preferred Stock | | | — | | | — | | | (20) | | | (2,000) | | | — | | | — | | | — | | | — | | | — | | | — | | | — | | | — | | | — | | | — | | | — | | | (2,000) |
Issuance of Series B Redeemable Preferred Stock | | | 10 | | | 1,000 | | | — | | | — | | | — | | | — | | | — | | | — | | | — | | | — | | | — | | | — | | | — | | | — | | | — | | | — |
Other comprehensive income | | | — | | | — | | | — | | | — | | | — | | | — | | | — | | | — | | | — | | | — | | | — | | | — | | | — | | | (2,954) | | | — | | | (2,954) |
Net income | | | — | | | — | | | — | | | — | | | — | | | — | | | — | | | — | | | — | | | — | | | — | | | — | | | — | | | — | | | 19,522 | | | 19,522 |
Balance at December 31, 2018 | | | 60 | | | $6,000 | | | 10 | | | $1,000 | | | 65,036,780 | | | $65,037 | | | 5,045,215 | | | $5,045 | | | 8,159,775 | | | $8,160 | | | 117,953 | | | $118 | | | $17,995 | | | $(2,003) | | | $9,779 | | | $105,131 |
Cumulative effect of adopting ASC Topic 606 (Note 2) | | | — | | | — | | | — | | | — | | | — | | | — | | | — | | | — | | | — | | | — | | | — | | | — | | | — | | | — | | | 695 | | | 695 |
Issuance of Class C units | | | — | | | — | | | — | | | — | | | — | | | — | | | — | | | — | | | — | | | — | | | 78,635 | | | 78 | | | — | | | — | | | — | | | 78 |
Distributions to members | | | — | | | — | | | — | | | — | | | — | | | — | | | — | | | — | | | — | | | — | | | — | | | — | | | — | | | — | | | (1,144) | | | (1,144) |
Dividends paid on Series A preferred stock (Note 19) | | | — | | | — | | | — | | | — | | | — | | | — | | | — | | | — | | | — | | | — | | | — | | | — | | | — | | | — | | | (43) | | | (43) |
Dividends paid on Series B preferred stock (Note 19) | | | — | | | — | | | — | | | — | | | — | | | — | | | — | | | — | | | — | | | — | | | — | | | — | | | — | | | — | | | (211) | | | (211) |
Redemption of Series A Redeemable Preferred Stock | | | — | | | — | | | (10) | | | (1,000) | | | — | | | — | | | — | | | — | | | — | | | — | | | — | | | — | | | — | | | — | | | — | | | (1,000) |
Redemption of Series B Redeemable Preferred Stock | | | (9) | | | (900) | | | — | | | — | | | — | | | — | | | — | | | — | | | — | | | — | | | — | | | — | | | — | | | — | | | — | | | — |
Other comprehensive income | | | — | | | — | | | — | | | — | | | — | | | — | | | — | | | — | | | — | | | — | | | — | | | — | | | — | | | 6,824 | | | — | | | 6,824 |
Net income | | | — | | | — | | | — | | | — | | | — | | | — | | | — | | | — | | | — | | | — | | | — | | | — | | | — | | | — | | | 31,285 | | | 31,285 |
Balance at December 31, 2019 | | | 51 | | | $5,100 | | | — | | | $— | | | 65,036,780 | | | $65,037 | | | 5,045,215 | | | $5,045 | | | 8,159,775 | | | $8,160 | | | 196,588 | | | $196 | | | $17,995 | | | $4,821 | | | $40,361 | | | $141,615 |
(in thousands) | | | 2019 | | | 2018 |
Operating activities | | | | | ||
Net income | | | $31,285 | | | $19,522 |
Adjustments to reconcile net income to net cash from operating activities: | | | | | ||
Depreciation and amortization | | | 876 | | | 497 |
Net capital (gains) losses on investments | | | (76) | | | 225 |
Deferred offering costs | | | (411) | | | — |
Gain on bargain purchase of subsidiary | | | (634) | | | — |
Loss on disposal of subsidiary | | | 34 | | | — |
Net realized losses on sale of building | | | — | | | 619 |
Bond amortization and accretion | | | 1,713 | | | 1,957 |
Issuance of member units as compensation | | | 78 | | | 79 |
Equity (earnings) losses in affiliates, net of tax | | | (3,558) | | | 1,082 |
Distributions from equity method investments | | | 5,489 | | | 2,852 |
Deferred income taxes | | | (1,118) | | | (71) |
Deferred financing costs | | | 101 | | | 76 |
Changes in operating assets and liabilities: | | | | | ||
Accrued investment income | | | (56) | | | 567 |
Premiums and other receivables | | | (4,777) | | | (13,862) |
Reinsurance recoverable on paid and unpaid losses | | | (49,829) | | | (50,776) |
Prepaid reinsurance premiums | | | (13,323) | | | (10,881) |
Other assets | | | 631 | | | (769) |
Unpaid loss and loss adjustment expenses | | | 59,874 | | | 62,744 |
Unearned premiums | | | 12,712 | | | 16,450 |
Funds held under reinsurance agreements | | | 2,631 | | | 35,826 |
Reinsurance premiums payable | | | 12,448 | | | 4,899 |
Accounts payable and accrued expenses | | | (639) | | | 3,647 |
Income taxes payable | | | (1,278) | | | 583 |
Net cash provided by operating activities | | | 52,173 | | | 75,266 |
Investing activities | | | | | ||
Payments for capital expenditures | | | (633) | | | (3,218) |
Proceeds from sale of property and equipment | | | — | | | 2,296 |
Purchase of investments, available for sale | | | (89,171) | | | (124,571) |
Proceeds from investments sold, matured or repaid | | | 71,357 | | | 65,518 |
Purchase of investments, equity method | | | — | | | (17,798) |
Acquisition of subsidiary, net of cash received | | | (5,496) | | | (786) |
Net cash used in investing activities | | | (23,943) | | | (78,559) |
Financing activities | | | | | ||
Proceeds from credit agreement | | | — | | | 26,994 |
Principal payments on long-term debt | | | (4,832) | | | (10,031) |
Proceeds from issuance of preferred shares | | | — | | | 1,000 |
Buyback of preferred shares | | | (1,900) | | | (2,000) |
Distributions to members | | | (1,144) | | | (1,456) |
Dividends paid on preferred stock | | | (249) | | | (225) |
Net cash (used in) provided by financing activities | | | (8,125) | | | 14,282 |
Net increase in cash, cash equivalents and restricted cash | | | 20,105 | | | 10,989 |
Cash, cash equivalents and restricted cash - beginning of period | | | 55,963 | | | 44,974 |
Cash, cash equivalents and restricted cash - end of period | | | $76,068 | | | $55,963 |
(in thousands) | | | 2019 | | | 2018 |
Disaggregation of cash and restricted cash: | | | | | ||
Cash and cash equivalents | | | $74,268 | | | $53,574 |
Restricted cash and restricted cash equivalents | | | 1,800 | | | 2,389 |
Total cash, cash equivalents and restricted cash | | | $76,068 | | | $55,963 |
| | | | | |||
Supplemental disclosure of cash flow information: | | | | | ||
Cash paid during the year for: | | | | | ||
Interest | | | $2,068 | | | $2,004 |
Income taxes | | | 9,137 | | | 4,962 |
Non-cash investing and financing activity: | | | | | ||
Issuance of Class C member units as compensation | | | 78 | | | 79 |
Accrued shares subject to mandatory redemption | | | — | | | 770 |
(in thousands) | | | 2019 | | | 2018 |
Premiums receivable | | | $61,774 | | | $60,987 |
Trade receivables | | | 1,053 | | | 1,390 |
Notes receivable | | | 23 | | | 23 |
Total premiums and other receivables | | | 62,850 | | | 62,400 |
Less: Allowance for doubtful accounts | | | (390) | | | — |
Net premiums and other receivables | | | $62,460 | | | $62,400 |
Asset class | | | Depreciation period |
Building and building improvements | | | 30 years |
Furniture and fixtures | | | 7 years |
Office equipment | | | 5 years |
Software and computer equipment | | | 3 years |
(in thousands) | | | 2019 | | | 2018 |
California | | | $202,446 | | | $153,611 |
Michigan | | | 38,174 | | | 37,084 |
Arizona | | | 34,215 | | | 28,350 |
Alabama | | | 12,946 | | | 11,907 |
Nevada | | | 11,869 | | | 9,225 |
Utah | | | 10,900 | | | 11,379 |
Mississippi | | | 8,910 | | | 7,143 |
Tennessee | | | 8,065 | | | 7,809 |
Indiana | | | 6,295 | | | * |
New Jersey | | | 6,222 | | | 7,580 |
Other geographical areas | | | 71,359 | | | 82,919 |
Total | | | $411,401 | | | $357,007 |
* | The amount for the state is relevant for 2019 but not in 2018 and therefore, was not presented in 2018. |
| | | For the year ended December 31, 2019 | |||||||
(in thousands) | | | Legacy GAAP | | | ASC Topic 606 Impact | | | As Reported |
Other revenue | | | $8,925 | | | $200 | | | $9,125 |
Total revenue | | | 102,315 | | | 200 | | | 102,515 |
Income before taxes | | | 34,601 | | | 200 | | | 34,801 |
Provision for income taxes | | | 7,028 | | | 46 | | | 7,074 |
Net income | | | $31,131 | | | $154 | | | $31,285 |
| | | December 31, 2019 | |||||||
(in thousands) | | | Legacy GAAP | | | ASC Topic 606 Impact | | | As Reported |
Assets | | | | | | | |||
Deferred tax asset | | | $1,621 | | | $(254) | | | $1,367 |
Other assets | | | $2,174 | | | $1,103 | | | $3,277 |
| | | | | | | ||||
Members’ Equity | | | | | | | |||
Retained earnings | | | $39,512 | | | $849 | | | $40,361 |
| | | Adjustments | |||||||
(in thousands) | | | As of December 31, 2018 | | | ASC Topic 606 | | | As of January 1, 2019 |
Assets | | | | | | | |||
Deferred tax asset | | | $1,823 | | | (208) | | | 1,615 |
Other assets | | | $1,963 | | | $903 | | | $2,866 |
| | | | | | | ||||
Members’ Equity | | | | | | | |||
Retained earnings | | | $9,779 | | | $695 | | | $10,474 |
| | | 2019 | ||||||||||
(in thousands) | | | Cost or Amortized Cost | | | Gross Unrealized Gains | | | Gross Unrealized Losses | | | Fair Value |
Fixed maturities: | | | | | | | | | ||||
U.S. government and government securities | | | $15,965 | | | $167 | | | $(3) | | | $16,129 |
Foreign governments | | | 299 | | | 3 | | | — | | | 302 |
States, territories and possessions | | | 4,789 | | | 134 | | | — | | | 4,923 |
Political subdivisions of states, territories and possessions | | | 24,444 | | | 670 | | | (10) | | | 25,104 |
Special revenue and special assessment obligations | | | 59,149 | | | 2,298 | | | (42) | | | 61,405 |
Industrial and public utilities | | | 119,735 | | | 3,490 | | | (18) | | | 123,207 |
Commercial mortgage-backed securities | | | 15,586 | | | 757 | | | (31) | | | 16,312 |
Residential mortgage-backed securities | | | 53,467 | | | 679 | | | (37) | | | 54,109 |
Other loan-backed securities | | | 35,849 | | | 281 | | | (119) | | | 36,011 |
Hybrid securities | | | 357 | | | 6 | | | — | | | 363 |
Total fixed maturities available for sale | | | $329,640 | | | $8,485 | | | $(260) | | | $337,865 |
| | | 2018 | ||||||||||
(in thousands) | | | Cost or Amortized Cost | | | Gross Unrealized Gains | | | Gross Unrealized Losses | | | Fair Value |
Fixed maturities: | | | | | | | | | ||||
U.S. government and government securities | | | $18,974 | | | $20 | | | $(171) | | | $18,823 |
Foreign governments | | | 299 | | | 1 | | | (1) | | | 299 |
States, territories and possessions | | | 5,118 | | | 42 | | | (26) | | | 5,134 |
Political subdivisions of states, territories and possessions | | | 25,679 | | | 182 | | | (215) | | | 25,646 |
Special revenue and special assessment obligations | | | 52,465 | | | 530 | | | (333) | | | 52,662 |
Industrial and public utilities | | | 119,952 | | | 155 | | | (1,767) | | | 118,340 |
Commercial mortgage-backed securities | | | 11,472 | | | 61 | | | (122) | | | 11,411 |
Residential mortgage-backed securities | | | 41,028 | | | 85 | | | (714) | | | 40,399 |
Other loan-backed securities | | | 34,526 | | | 17 | | | (265) | | | 34,278 |
Hybrid securities | | | 258 | | | — | | | (13) | | | 245 |
Total fixed maturities | | | 309,771 | | | 1,093 | | | (3,627) | | | 307,237 |
Equity securities: | | | | | | | | | ||||
Preferred stock | | | 325 | | | — | | | (4) | | | 321 |
Total securities available for sale | | | $310,096 | | | $1,093 | | | $(3,631) | | | $307,558 |
| | | 2019 | |||||||||||||||||||||||||
| | | Less Than 12 Months | | | 12 Months or More | | | Total | |||||||||||||||||||
(in thousands) | | | Number of Securities* | | | Fair Value | | | Unrealized Loss | | | Number of Securities* | | | Fair Value | | | Unrealized Loss | | | Number of Securities* | | | Fair Value | | | Unrealized Loss |
Fixed maturities: | | | | | | | | | | | | | | | | | | | |||||||||
U.S. government and government securities | | | 1 | | | $293 | | | $(2) | | | 3 | | | $1,349 | | | $(1) | | | 4 | | | $1,642 | | | $(3) |
Foreign governments | | | — | | | — | | | — | | | — | | | — | | | — | | | — | | | — | | | — |
States, territories and possessions | | | — | | | — | | | — | | | — | | | — | | | — | | | — | | | — | | | — |
Political subdivisions of states, territories and possessions | | | 6 | | | 1,500 | | | (9) | | | 5 | | | 690 | | | (1) | | | 11 | | | 2,190 | | | (10) |
Special revenue and special assessment obligations | | | 13 | | | 3,206 | | | (42) | | | 2 | | | 181 | | | — | | | 15 | | | 3,387 | | | (42) |
Industrial and public utilities | | | 14 | | | 5,939 | | | (16) | | | 4 | | | 1,094 | | | (2) | | | 18 | | | 7,033 | | | (18) |
Commercial mortgage-backed securities | | | 3 | | | 2,138 | | | (30) | | | 3 | | | 129 | | | (1) | | | 6 | | | 2,267 | | | (31) |
Residential mortgage-backed securities | | | 20 | | | 6,936 | | | (13) | | | 42 | | | 1,917 | | | (24) | | | 62 | | | 8,853 | | | (37) |
Other loan-backed securities | | | 3 | | | 2,189 | | | (11) | | | 16 | | | 13,885 | | | (108) | | | 19 | | | 16,074 | | | (119) |
Hybrid securities | | | — | | | — | | | — | | | — | | | — | | | — | | | — | | | — | | | — |
Total bonds | | | 60 | | | $22,201 | | | $(123) | | | 75 | | | $19,245 | | | $(137) | | | 135 | | | $41,446 | | | $(260) |
| | | 2018 | |||||||||||||||||||||||||
| | | Less Than 12 Months | | | 12 Months or More | | | Total | |||||||||||||||||||
(in thousands) | | | Number of Securities* | | | Fair Value | | | Unrealized Loss | | | Number of Securities* | | | Fair Value | | | Unrealized Loss | | | Number of Securities* | | | Fair Value | | | Unrealized Loss |
Fixed maturities: | | | | | | | | | | | | | | | | | | | |||||||||
U.S. government and government securities | | | 12 | | | $3,604 | | | $(16) | | | 39 | | | $9,789 | | | $(155) | | | 51 | | | $13,393 | | | $(171) |
Foreign governments | | | 1 | | | 198 | | | (1) | | | — | | | — | | | — | | | 1 | | | 198 | | | (1) |
States, territories and possessions | | | 8 | | | 1,708 | | | (14) | | | 5 | | | 902 | | | (12) | | | 13 | | | 2,610 | | | (26) |
Political subdivisions of states, territories and possessions | | | 16 | | | 3,955 | | | (43) | | | 51 | | | 9,726 | | | (172) | | | 67 | | | 13,681 | | | (215) |
Special revenue and special assessment obligations | | | 47 | | | 11,567 | | | (133) | | | 76 | | | 12,194 | | | (200) | | | 123 | | | 23,761 | | | (333) |
Industrial and public utilities | | | 171 | | | 54,431 | | | (808) | | | 136 | | | 38,464 | | | (959) | | | 307 | | | 92,895 | | | (1,767) |
Commercial mortgage-backed securities | | | 19 | | | 6,717 | | | (118) | | | 4 | | | 314 | | | (4) | | | 23 | | | 7,031 | | | (122) |
Residential mortgage-backed securities | | | 49 | | | 22,147 | | | (355) | | | 93 | | | 11,117 | | | (359) | | | 142 | | | 33,264 | | | (714) |
Other loan-backed securities | | | 54 | | | 28,185 | | | (249) | | | 10 | | | 1,810 | | | (16) | | | 64 | | | 29,995 | | | (265) |
Hybrid securities | | | 1 | | | 99 | | | (9) | | | 1 | | | 146 | | | (4) | | | 2 | | | 245 | | | (13) |
Total bonds | | | 378 | | | $132,611 | | | $(1,746) | | | 415 | | | $84,462 | | | $(1,881) | | | 793 | | | $217,073 | | | $(3,627) |
(in thousands) | | | Cost or Amortized Cost | | | Fair Value |
Available for sale: | | | | | ||
Due in one year or less | | | $17,822 | | | $17,872 |
Due after one year but before five years | | | 120,772 | | | 123,603 |
Due after five years but before ten years | | | 50,398 | | | 52,893 |
Due after ten years | | | 35,746 | | | 37,065 |
Commercial mortgage-backed securities | | | 15,586 | | | 16,312 |
Residential mortgage-backed securities | | | 53,467 | | | 54,109 |
Other loan-backed securities | | | 35,849 | | | 36,011 |
Total | | | $329,640 | | | $337,865 |
(in thousands) | | | 2019 | | | 2018 |
Fixed maturities: | | | | | ||
Gains | | | $91 | | | $111 |
Losses | | | (24) | | | (201) |
Total fixed maturities | | | 67 | | | (90) |
Equity securities: | | | | | ||
Preferred stocks: | | | | | ||
Losses | | | — | | | (6) |
Total equity securities | | | — | | | (6) |
Total net investment realized gains | | | $67 | | | $(96) |
(in thousands) | | | 2019 | | | 2018 |
Fixed maturities | | | $6,078 | | | $4,701 |
Preferred stock | | | 40 | | | 25 |
Interest earned on cash and short-term investments | | | 127 | | | 90 |
Net investment income | | | $6,245 | | | $4,816 |
Level 1: | Fair values primarily based on unadjusted quoted prices in active markets for identical assets or liabilities that the Company has the ability to access at the measurement date. |
Level 2: | Fair values primarily based on observable inputs, other than quoted prices included in Level 1, or based on prices for similar assets and liabilities. |
Level 3: | Fair values primarily based on valuations derived when one or more of the significant inputs are unobservable. With little or no observable market, the determination of fair value uses considerable judgement and represents the Company’s best estimate of an amount that could be realized in a market exchange for the asset or liability. The Company has no assets or liabilities measured at fair value in the Level 3 category. |
| | | 2019 | ||||||||||
(in thousands) | | | Level 1 | | | Level 2 | | | Level 3 | | | Total |
Fixed maturities: | | | | | | | | | ||||
U.S. government and government securities | | | $16,129 | | | $— | | | $— | | | $16,129 |
Foreign governments | | | — | | | 302 | | | — | | | 302 |
States, territories and possessions | | | — | | | 4,923 | | | — | | | 4,923 |
Political subdivisions of states territories and possessions | | | — | | | 25,104 | | | — | | | 25,104 |
Special revenue and special assessment obligations | | | — | | | 61,405 | | | — | | | 61,405 |
Industrial and public utilities | | | — | | | 123,207 | | | — | | | 123,207 |
Commercial mortgage-backed securities | | | — | | | 16,312 | | | — | | | 16,312 |
Residential mortgage-backed securities | | | — | | | 54,109 | | | — | | | 54,109 |
Other loan-backed securities | | | — | | | 36,011 | | | — | | | 36,011 |
Hybrid securities | | | — | | | 363 | | | — | | | 363 |
Total fixed maturities | | | 16,129 | | | 321,736 | | | — | | | 337,865 |
Equity securities: | | | | | | | | | ||||
Preferred stock | | | — | | | 343 | | | — | | | 343 |
Common stock | | | — | | | 492 | | | — | | | 492 |
Total equity securities | | | — | | | 835 | | | — | | | 835 |
Total investments | | | $16,129 | | | $322,571 | | | $— | | | $338,700 |
| | | | | | | | | |||||
Funds held under reinsurance agreements | | | — | | | 163,445 | | | — | | | 163,445 |
| | | | | | | | | |||||
Long-term debt: | | | | | | | | | ||||
Junior subordinated debt | | | — | | | 7,732 | | | — | | | 7,732 |
Secured credit facility | | | — | | | 21,637 | | | — | | | 21,637 |
Total long-term debt | | | $— | | | $29,369 | | | $ — | | | $29,369 |
| | | 2018 | ||||||||||
(in thousands) | | | Level 1 | | | Level 2 | | | Level 3 | | | Total |
Fixed maturities: | | | | | | | | | ||||
U.S. government and government securities | | | $18,823 | | | $— | | | $— | | | $18,823 |
Foreign governments | | | — | | | 298 | | | — | | | 298 |
States, territories and possessions | | | — | | | 5,134 | | | — | | | 5,134 |
Political subdivisions of states, territories and possessions | | | — | | | 25,646 | | | — | | | 25,646 |
Special revenue and special assessment obligations | | | — | | | 52,663 | | | — | | | 52,663 |
Industrial and public utilities | | | — | | | 118,340 | | | — | | | 118,340 |
Commercial mortgage-backed securities | | | — | | | 11,411 | | | — | | | 11,411 |
Residential mortgage-backed securities | | | — | | | 40,399 | | | — | | | 40,399 |
Other loan-backed securities | | | — | | | 34,278 | | | — | | | 34,278 |
Hybrid securities | | | — | | | 245 | | | — | | | 245 |
Total fixed maturities | | | 18,823 | | | 288,414 | | | — | | | 307,237 |
Equity securities: | | | | | | | | | ||||
Preferred stock | | | — | | | 321 | | | — | | | 321 |
Total investments | | | $18,823 | | | $288,735 | | | $— | | | $307,558 |
| | | | | | | | | |||||
Funds held under reinsurance agreements | | | — | | | 166,838 | | | — | | | 166,838 |
| | | | | | | | | |||||
Long-term debt: | | | | | | | | | ||||
Junior subordinated debt | | | — | | | 7,732 | | | — | | | 7,732 |
Secured credit facility | | | — | | | 26,469 | | | — | | | 26,469 |
Total long-term debt | | | $— | | | $34,201 | | | $ — | | | $34,201 |
Fair value of total consideration transferred | | | $5,314 |
Recognized amounts of identifiable assets acquired and liabilities assumed: | | | |
Cash | | | 973 |
Investments | | | 4,252 |
Accrued investment income | | | 40 |
Premiums and other receivables | | | 1,571 |
Deferred tax asset | | | 242 |
Other assets | | | 10 |
Unpaid loss and loss adjustment expenses | | | (6,426) |
Unearned premiums | | | (1,003) |
Funds held under reinsurance agreements | | | 7,980 |
Reinsurance premiums payable | | | (1,037) |
Accounts payable and accrued expenses | | | (316) |
Income taxes payable | | | (338) |
Net assets acquired | | | 5,948 |
Gain on bargain purchase | | | $634 |
Fair value of total consideration transferred | | | $2,450 |
Recognized amounts of identifiable assets acquired and liabilities assumed: | | | |
Cash | | | 1,003 |
Property and equipment | | | 194 |
Other assets | | | 1 |
Goodwill | | | 2,154 |
Accounts payable | | | (902) |
Net assets acquired | | | $2,450 |
Fair value of total consideration transferred | | | $ 50 |
Recognized amounts of identifiable assets acquired and liabilities assumed: | | | |
Equipment | | | 10 |
Non-compete agreement | | | 40 |
Net assets acquired | | | $50 |
(in thousands) | | | 2019 | | | 2018 |
Total assets | | | $58,657 | | | $60,202 |
Total liabilities | | | 42,980 | | | 44,476 |
Revenues | | | 24,010 | | | 24,267 |
Net income (loss) | | | 8,870 | | | (1,150) |
(in thousands) | | | 2019 | | | 2018 |
Land | | | $1,780 | | | $1,780 |
Building and building improvements | | | 5,150 | | | 4,754 |
Furniture and fixtures | | | 772 | | | 748 |
Office equipment | | | 2,193 | | | 1,487 |
Other property, plant and equipment | | | 72 | | | 652 |
Deposits on fixed assets not placed in service | | | 366 | | | 282 |
Total, at cost | | | 10,333 | | | 9,703 |
Less: Accumulated depreciation | | | (2,396) | | | (1,569) |
Property and equipment, net | | | $7,937 | | | $8,134 |
(in thousands) | | | 2019 | | | 2018 |
Balance at beginning of period | | | $2,822 | | | $668 |
Acquisitions | | | — | | | 2,154 |
Balance at end of period | | | $2,822 | | | $2,822 |
(in thousands) | | | Useful Life | | | 2019 | | | 2018 |
Non-compete agreement | | | 4 years | | | $44 | | | $44 |
Trade name | | | 6 years | | | 67 | | | 67 |
Customer lists and relationships | | | 10 years | | | 164 | | | 164 |
Totals | | | | | 275 | | | 275 | |
Less: Accumulated amortization | | | | | (121) | | | (74) | |
Balance at end of period | | | | | $154 | | | $201 |
(in thousands) | | | Trade name | | | Customer lists and relationships | | | Non-compete | | | Total |
2020 | | | $ 8 | | | $ 16 | | | $ 20 | | | $ 44 |
2021 | | | 8 | | | 16 | | | — | | | 24 |
2022 | | | 7 | | | 16 | | | — | | | 23 |
2023 | | | — | | | 16 | | | — | | | 16 |
2024 | | | — | | | 16 | | | — | | | 16 |
Thereafter | | | — | | | 31 | | | — | | | 31 |
| | | $23 | | | $111 | | | $20 | | | $154 |
(in thousands) | | | 2019 | | | 2018 |
Accrued commissions and third party administration fees | | | $2,713 | | | $3,378 |
Trade payables | | | 2,387 | | | 2,978 |
Accrued taxes, licenses and fees | | | 4,313 | | | 3,761 |
Accrued wages and employee benefits | | | 2,167 | | | 745 |
Amounts retained for the accounts of others | | | 2,467 | | | 3,067 |
Other liabilities | | | 948 | | | 1,075 |
Totals | | | $14,995 | | | $15,004 |
(in thousands) | | | 2019 | | | 2018 |
Balance at January 1 | | | $2,976 | | | $1,833 |
Policy acquisition costs deferred | | | 14,646 | | | 8,279 |
Amortization charged to expense | | | (15,507) | | | (7,136) |
Balance at December 31 | | | $2,115 | | | $2,976 |
| | | 2019 | ||||
(in thousands) | | | Benchmark | | | ALIC |
Statutory capital and surplus | | | $135,941 | | | $5,947 |
RBC authorized control level | | | 13,862 | | | 733 |
Statutory net income | | | 23,475 | | | 266 |
RBC % | | | 981% | | | 811% |
| | | 2018 | ||||
(in thousands) | | | Benchmark | | | ALIC |
Statutory capital and surplus | | | $112,752 | | | $4,673 |
RBC authorized control level | | | 12,454 | | | 1,095 |
Statutory net income | | | 13,087 | | | 786 |
RBC % | | | 905% | | | 427% |
(in thousands) | | | 2019 |
Brokerage | | | $5,828 |
Managing general agent fees | | | 858 |
Third-party administrator fees | | | 1,776 |
Consulting fees | | | 663 |
Total revenue from contracts with customers | | | $9,125 |
(in thousands) | | | December 31, 2019 | | | January 1, 2019 |
Contract assets | | | $1,103 | | | $903 |
(in thousands) | | | 2019 | | | 2018 |
Current tax expense | | | $8,642 | | | $5,618 |
Deferred tax expense | | | (1,568) | | | (72) |
Total income tax expense | | | $7,074 | | | $5,546 |
(in thousands) | | | 2019 | | | Effective Rate |
Income tax expense computed at statutory tax rate | | | $7,309 | | | 21% |
Tax-exempt municipal income, net of proration | | | (271) | | | (1)% |
Change in valuation allowance on deferred tax asset | | | (4) | | | —% |
Other | | | 40 | | | —% |
Total income tax expense | | | $7,074 | | | 20% |
(in thousands) | | | 2018 | | | Effective Rate |
Income tax expense computed at statutory tax rate | | | $5,492 | | | 21% |
Tax-exempt municipal income, net of proration | | | (328) | | | (1)% |
Change in valuation allowance on deferred tax asset | | | (13) | | | —% |
Other | | | 395 | | | 1% |
Total income tax expense | | | $5,546 | | | 21% |
(in thousands) | | | 2019 | | | 2018 |
Deferred tax assets: | | | | | ||
Unpaid losses and LAE | | | $2,671 | | | $2,240 |
Unearned premiums | | | 995 | | | 975 |
NOL carryforward | | | 352 | | | 42 |
Other | | | 366 | | | 204 |
Total deferred tax assets | | | 4,384 | | | 3,461 |
| | | | | |||
Deferred tax liabilities | | | | | ||
Deferred acquisition costs | | | (444) | | | (859) |
Loss reserve discounting TCJA transitional adjustment | | | (675) | | | (808) |
Unrealized gains/losses on investments | | | (1,281) | | | 533 |
Property and equipment | | | (296) | | | (363) |
Other | | | (321) | | | (141) |
Total deferred tax liabilities | | | (3,017) | | | (1,638) |
Net deferred tax assets | | | $1,367 | | | $1,823 |
(in thousands) | | | 2019 | | | 2018 |
Gross loss and loss adjustment expense reserves at January 1 | | | $340,415 | | | $277,671 |
Less losses ceded through reinsurance | | | (257,421) | | | (206,323) |
Net loss and loss adjustment expense reserves at January 1 | | | 82,994 | | | 71,348 |
| | | | | |||
Acquisition of First Choice Casualty Insurance Company | | | 6,366 | | | — |
| | | | | |||
Incurred loss and loss adjustment expense related to: | | | | | ||
Current period | | | 54,933 | | | 41,635 |
Prior period | | | (10,272) | | | (5,906) |
Total incurred | | | 44,661 | | | 35,729 |
| | | | | |||
Benefits and loss-related payments related to: | | | | | ||
Current period | | | 11,852 | | | 7,724 |
Prior period | | | 19,458 | | | 16,359 |
Total paid | | | 31,310 | | | 24,083 |
| | | | | |||
Net unpaid loss and loss adjustment expense at December 31 | | | 102,711 | | | 82,994 |
Plus losses ceded through reinsurance | | | 304,005 | | | 257,421 |
Gross loss and loss adjustment expense reserves at December 31 | | | $406,716 | | | $340,415 |
Workers’ Compensation | ||||||||||||||||||||||||||||||||||||
Incurred Claims and Allocated Claim Adjustment Expenses, Net of Reinsurance | | | As of December 31, 2019 | |||||||||||||||||||||||||||||||||
For the Years Ended December 31, | | | Total of IBNR Liabilities Plus Expected Development on Reported Claims | | | Cumulative Number of Reported Claims | ||||||||||||||||||||||||||||||
Accident Year | | | 2010* | | | 2011* | | | 2012* | | | 2013* | | | 2014* | | | 2015* | | | 2016* | | | 2017* | | | 2018* | | | 2019 | | | | | ||
2010 | | | 10,469 | | | 10,348 | | | 11,156 | | | 11,713 | | | 11,571 | | | 12,232 | | | 12,422 | | | 12,424 | | | 12,226 | | | 12,388 | | | 817 | | | 3,450 |
2011 | | | | | 13,271 | | | 13,825 | | | 15,426 | | | 16,280 | | | 16,004 | | | 16,197 | | | 16,738 | | | 17,090 | | | 17,078 | | | 302 | | | 2,967 | |
2012 | | | | | | | 20,397 | | | 20,948 | | | 19,699 | | | 20,176 | | | 19,235 | | | 18,778 | | | 18,898 | | | 18,967 | | | 343 | | | 3,184 | ||
2013 | | | | | | | | | 22,746 | | | 22,879 | | | 22,650 | | | 19,772 | | | 19,528 | | | 19,426 | | | 19,814 | | | 500 | | | 3,546 | |||
2014 | | | | | | | | | | | 22,357 | | | 20,686 | | | 19,781 | | | 19,394 | | | 17,967 | | | 18,025 | | | 1,024 | | | 3,554 | ||||
2015 | | | | | | | | | | | | | 22,539 | | | 23,787 | | | 23,422 | | | 21,768 | | | 22,198 | | | 3,852 | | | 4,758 | |||||
2016 | | | | | | | | | | | | | | | 28,470 | | | 27,221 | | | 25,866 | | | 23,881 | | | 5,472 | | | 9,583 | ||||||
2017 | | | | | | | | | | | | | | | | | 31,479 | | | 25,456 | | | 22,036 | | | 4,995 | | | 14,173 | |||||||
2018 | | | | | | | | | | | | | | | | | | | 35,208 | | | 29,586 | | | 8,019 | | | 11,979 | ||||||||
2019 | | | | | | | | | | | | | | | | | | | | | 43,796 | | | 21,115 | | | 10,001 | |||||||||
| | | | | | | | | | | | | | | | | | | Total | | | $ 227,769 | | | | | |||||||||||
| | | | | | | | | | | | | | | | | | | | | | | | | |||||||||||||
Cumulative Paid Claims and Allocated Claim Adjustment Expenses, Net of Reinsurance | | | | | ||||||||||||||||||||||||||||||||
For the Years Ended December 31, | | | | | ||||||||||||||||||||||||||||||||
Accident Year | | | 2010* | | | 2011* | | | 2012* | | | 2013* | | | 2014* | | | 2015* | | | 2016* | | | 2017* | | | 2018* | | | 2019 | | | | | ||
2010 | | | 3,564 | | | 6,832 | | | 8,112 | | | 9,393 | | | 10,107 | | | 10,457 | | | 10,640 | | | 10,925 | | | 11,148 | | | 11,277 | | | | | ||
2011 | | | | | 3,922 | | | 8,642 | | | 12,287 | | | 13,534 | | | 14,428 | | | 15,025 | | | 15,690 | | | 16,048 | | | 16,532 | | | | | |||
2012 | | | | | | | 6,100 | | | 11,854 | | | 14,292 | | | 15,902 | | | 16,683 | | | 17,426 | | | 17,951 | | | 18,164 | | | | | ||||
2013 | | | | | | | | | 6,734 | | | 12,407 | | | 15,703 | | | 17,135 | | | 18,448 | | | 18,664 | | | 18,976 | | | | | |||||
2014 | | | | | | | | | | | 5,958 | | | 11,672 | | | 14,393 | | | 16,011 | | | 16,177 | | | 16,535 | | | | | ||||||
2015 | | | | | | | | | | | | | 6,083 | | | 13,298 | | | 15,795 | | | 16,982 | | | 17,618 | | | | | |||||||
2016 | | | | | | | | | | | | | | | 6,659 | | | 14,054 | | | 16,409 | | | 17,234 | | | | | ||||||||
2017 | | | | | | | | | | | | | | | | | 6,381 | | | 12,721 | | | 15,247 | | | | | |||||||||
2018 | | | | | | | | | | | | | | | | | | | 6,965 | | | 16,437 | | | | | ||||||||||
2019 | | | | | | | | | | | | | | | | | | | | | 9,799 | | | | | |||||||||||
| | | | | | | | | | | | | | | | | | | | | 157,819 | | | | | ||||||||||||
| | | All outstanding liabilities before 2010, net of reinsurance | | | 4,772 | | | | | |||||||||||||||||||||||||||
| | | Liabilities for claims and claim adjustment expenses, net of reinsurance | | | $74,722 | | | | | |||||||||||||||||||||||||||
| | | | | | | | | | | | | | | | | | | | | | | | | |||||||||||||
| | | Average Annual Percentage Payout of Incurred Claims by Age, Net of Reinsurance* | | | | | ||||||||||||||||||||||||||||||
Years | | | 1 | | | 2 | | | 3 | | | 4 | | | 5 | | | 6 | | | 7 | | | 8 | | | 9 | | | 10 | | | | | ||
| | | 20.9% | | | 26.1% | | | 10.9% | | | 7.9% | | | 5.2% | | | 2.3% | | | 3.1% | | | 2.5% | | | 3.8% | | | 3.1% | | | | | |||
* | Presented as unaudited required supplementary information. |
Other Liability | ||||||||||||||||||||||||||||||||||||
Incurred Claims and Allocated Claim Adjustment Expenses, Net of Reinsurance | | | As of December 31, 2019 | |||||||||||||||||||||||||||||||||
For the Years Ended December 31, | | | Total of IBNR Liabilities Plus Expected Development on Reported Claims | | | Cumulative Number of Reported Claims | ||||||||||||||||||||||||||||||
Accident Year | | | 2010* | | | 2011* | | | 2012* | | | 2013* | | | 2014* | | | 2015* | | | 2016* | | | 2017* | | | 2018* | | | 2019 | | | | | ||
2010 | | | 1,141 | | | 1,149 | | | 1,130 | | | 1,053 | | | 1,094 | | | 1,269 | | | 1,488 | | | 1,515 | | | 1,506 | | | 1,316 | | | 47 | | | 239 |
2011 | | | | | 1,123 | | | 1,064 | | | 1,124 | | | 1,076 | | | 1,406 | | | 1,447 | | | 1,469 | | | 1,537 | | | 1,509 | | | 58 | | | 292 | |
2012 | | | | | | | 1,439 | | | 880 | | | 973 | | | 863 | | | 1,092 | | | 1,278 | | | 1,745 | | | 1,721 | | | 298 | | | 356 | ||
2013 | | | | | | | | | 1,914 | | | 1,876 | | | 1,617 | | | 1,580 | | | 1,804 | | | 2,068 | | | 1,651 | | | 402 | | | 245 | |||
2014 | | | | | | | | | | | 2,183 | | | 1,964 | | | 1,921 | | | 2,154 | | | 3,107 | | | 3,013 | | | 1,094 | | | 332 | ||||
2015 | | | | | | | | | | | | | 2,946 | | | 2,652 | | | 2,862 | | | 3,549 | | | 3,334 | | | 1,709 | | | 331 | |||||
2016 | | | | | | | | | | | | | | | 2,689 | | | 2,794 | | | 3,135 | | | 3,180 | | | 2,355 | | | 221 | ||||||
2017 | | | | | | | | | | | | | | | | | 4,964 | | | 3,089 | | | 4,555 | | | 3,341 | | | 194 | |||||||
2018 | | | | | | | | | | | | | | | | | | | 4,256 | | | 4,278 | | | 3,807 | | | 123 | ||||||||
2019 | | | | | | | | | | | | | | | | | | | | | 5,457 | | | 5,327 | | | 43 | |||||||||
| | | | | | | | | | | | | | | | | | | Total | | | $ 30,014 | | | | | |||||||||||
| | | | | | | | | | | | | | | | | | | | | | | | | |||||||||||||
Cumulative Paid Claims and Allocated Claim Adjustment Expenses, Net of Reinsurance | | | | | ||||||||||||||||||||||||||||||||
For the Years Ended December 31, | | | | | ||||||||||||||||||||||||||||||||
Accident Year | | | 2010* | | | 2011* | | | 2012* | | | 2013* | | | 2014* | | | 2015* | | | 2016* | | | 2017* | | | 2018* | | | 2019 | | | | | ||
2010 | | | 20 | | | 157 | | | 556 | | | 674 | | | 776 | | | 899 | | | 1,111 | | | 1,199 | | | 1,185 | | | 1,188 | | | | | ||
2011 | | | | | 31 | | | 171 | | | 338 | | | 369 | | | 771 | | | 1,116 | | | 1,189 | | | 1,261 | | | 1,353 | | | | | |||
2012 | | | | | | | 42 | | | 141 | | | 187 | | | 346 | | | 512 | | | 761 | | | 1,146 | | | 1,234 | | | | | ||||
2013 | | | | | | | | | 65 | | | 195 | | | 281 | | | 573 | | | 798 | | | 1,048 | | | 1,153 | | | | | |||||
2014 | | | | | | | | | | | 53 | | | 233 | | | 405 | | | 639 | | | 1,067 | | | 1,687 | | | | | ||||||
2015 | | | | | | | | | | | | | 123 | | | 374 | | | 600 | | | 945 | | | 1,187 | | | | | |||||||
2016 | | | | | | | | | | | | | | | 54 | | | 137 | | | 355 | | | 558 | | | | | ||||||||
2017 | | | | | | | | | | | | | | | | | 52 | | | 439 | | | 676 | | | | | |||||||||
2018 | | | | | | | | | | | | | | | | | | | 52 | | | 345 | | | | | ||||||||||
2019 | | | | | | | | | | | | | | | | | | | | | 111 | | | | | |||||||||||
| | | | | | | | | | | | | | | | | | | | | 9,492 | | | | | ||||||||||||
| | | All outstanding liabilities before 2010, net of reinsurance | | | 39 | | | | | |||||||||||||||||||||||||||
| | | Liabilities for claims and claim adjustment expenses, net of reinsurance | | | $20,561 | | | | | |||||||||||||||||||||||||||
| | | | | | | | | | | | | | | | | | | | | | | | | |||||||||||||
| | | Average Annual Percentage Payout of Incurred Claims by Age, Net of Reinsurance* | | | | | ||||||||||||||||||||||||||||||
Years | | | 1 | | | 2 | | | 3 | | | 4 | | | 5 | | | 6 | | | 7 | | | 8 | | | 9 | | | 10 | | | | | ||
| | | 1.2% | | | 6.5% | | | 7.0% | | | 7.0% | | | 9.1% | | | 12.7% | | | 8.7% | | | 4.7% | | | 4.5% | | | 2.4% | | | | | |||
* | Presented as unaudited required supplementary information. |
All Other Lines | ||||||||||||||||||||||||||||||||||||
Incurred Claims and Allocated Claim Adjustment Expenses, Net of Reinsurance | | | As of December 31, 2019 | |||||||||||||||||||||||||||||||||
For the Years Ended December 31, | | | Total of IBNR Liabilities Plus Expected Development on Reported Claims | | | Cumulative Number of Reported Claims | ||||||||||||||||||||||||||||||
Accident Year | | | 2010* | | | 2011* | | | 2012* | | | 2013* | | | 2014* | | | 2015* | | | 2016* | | | 2017* | | | 2018* | | | 2019 | | | | | ||
2010 | | | 190 | | | 83 | | | 110 | | | 40 | | | 65 | | | 56 | | | 62 | | | 37 | | | 45 | | | 50 | | | 10 | | | 182 |
2011 | | | | | 62 | | | 34 | | | 86 | | | 222 | | | 210 | | | 210 | | | 212 | | | 207 | | | 206 | | | — | | | 576 | |
2012 | | | | | | | 21 | | | 3 | | | 25 | | | 14 | | | 4 | | | 2 | | | 3 | | | 2 | | | 1 | | | 479 | ||
2013 | | | | | | | | | 1 | | | — | | | 13 | | | 9 | | | 10 | | | 12 | | | — | | | — | | | 573 | |||
2014 | | | | | | | | | | | 40 | | | 127 | | | 24 | | | 23 | | | 21 | | | 16 | | | — | | | 1,052 | ||||
2015 | | | | | | | | | | | | | 168 | | | 132 | | | 108 | | | 113 | | | 98 | | | — | | | 1,176 | |||||
2016 | | | | | | | | | | | | | | | 1,882 | | | 1,617 | | | 1,745 | | | 1,555 | | | 19 | | | 1,245 | ||||||
2017 | | | | | | | | | | | | | | | | | 2,852 | | | 2,917 | | | 2,417 | | | 74 | | | 2,029 | |||||||
2018 | | | | | | | | | | | | | | | | | | | 2,885 | | | 2,874 | | | 357 | | | 2,929 | ||||||||
2019 | | | | | | | | | | | | | | | | | | | | | 3,756 | | | 731 | | | 2,135 | |||||||||
| | | | | | | | | | | | | | | | | | | Total | | | $10,974 | | | | | |||||||||||
| | | | | | | | | | | | | | | | | | | | | | | | | |||||||||||||
Cumulative Paid Claims and Allocated Claim Adjustment Expenses, Net of Reinsurance | | | | | ||||||||||||||||||||||||||||||||
For the Years Ended December 31, | | | | | ||||||||||||||||||||||||||||||||
Accident Year | | | 2010* | | | 2011* | | | 2012* | | | 2013* | | | 2014* | | | 2015* | | | 2016* | | | 2017* | | | 2018* | | | 2019 | | | | | ||
2010 | | | 10 | | | 18 | | | 28 | | | 28 | | | 28 | | | 28 | | | 28 | | | 30 | | | 32 | | | 34 | | | | | ||
2011 | | | | | 1 | | | 2 | | | 6 | | | 204 | | | 206 | | | 206 | | | 206 | | | 206 | | | 206 | | | | | |||
2012 | | | | | | | 1 | | | 1 | | | 1 | | | 1 | | | 1 | | | 1 | | | 1 | | | 1 | | | | | ||||
2013 | | | | | | | | | — | | | — | | | — | | | — | | | — | | | — | | | — | | | | | |||||
2014 | | | | | | | | | | | — | | | 100 | | | 16 | | | 16 | | | 16 | | | 16 | | | | | ||||||
2015 | | | | | | | | | | | | | 63 | | | 98 | | | 98 | | | 99 | | | 98 | | | | | |||||||
2016 | | | | | | | | | | | | | | | 796 | | | 1,325 | | | 1,418 | | | 1,494 | | | | | ||||||||
2017 | | | | | | | | | | | | | | | | | 1,412 | | | 2,099 | | | 2,203 | | | | | |||||||||
2018 | | | | | | | | | | | | | | | | | | | 1,309 | | | 2,123 | | | | | ||||||||||
2019 | | | | | | | | | | | | | | | | | | | | | 1,903 | | | | | |||||||||||
| | | | | | | | | | | | | | | | | | | | | 8,078 | | | | | ||||||||||||
| | | All outstanding liabilities before 2010, net of reinsurance | | | — | | | | | |||||||||||||||||||||||||||
| | | Liabilities for claims and claim adjustment expenses, net of reinsurance | | | $2,896 | | | | | |||||||||||||||||||||||||||
| | | | | | | | | | | | | | | | | | | | | | | | | |||||||||||||
| | | Average Annual Percentage Payout of Incurred Claims by Age, Net of Reinsurance* | | | | | ||||||||||||||||||||||||||||||
Years | | | 1 | | | 2 | | | 3 | | | 4 | | | 5 | | | 6 | | | 7 | | | 8 | | | 9 | | | 10 | | | | | ||
| | | 45.0% | | | 28.3% | | | 3.4% | | | 14.0% | | | 0.2% | | | 0.0% | | | 0.0% | | | 0.7% | | | 0.7% | | | 2.0% | | | | | |||
* | Presented as unaudited required supplementary information. |
Total Lines | ||||||||||||||||||||||||||||||||||||
Incurred Claims and Allocated Claim Adjustment Expenses, Net of Reinsurance | | | As of December 31, 2019 | |||||||||||||||||||||||||||||||||
For the Years Ended December 31, | | | Total of IBNR Liabilities Plus Expected Development on Reported Claims | | | Cumulative Number of Reported Claims | ||||||||||||||||||||||||||||||
Accident Year | | | 2010* | | | 2011* | | | 2012* | | | 2013* | | | 2014* | | | 2015* | | | 2016* | | | 2017* | | | 2018* | | | 2019 | | | | | ||
2010 | | | 11,800 | | | 11,580 | | | 12,396 | | | 12,806 | | | 12,730 | | | 13,557 | | | 13,972 | | | 13,976 | | | 13,777 | | | 13,754 | | | 874 | | | 3,871 |
2011 | | | | | 14,456 | | | 14,923 | | | 16,636 | | | 17,578 | | | 17,620 | | | 17,854 | | | 18,419 | | | 18,834 | | | 18,793 | | | 360 | | | 3,835 | |
2012 | | | | | | | 21,857 | | | 21,831 | | | 20,697 | | | 21,053 | | | 20,331 | | | 20,058 | | | 20,646 | | | 20,690 | | | 642 | | | 4,019 | ||
2013 | | | | | | | | | 24,661 | | | 24,755 | | | 24,280 | | | 21,361 | | | 21,342 | | | 21,506 | | | 21,465 | | | 902 | | | 4,364 | |||
2014 | | | | | | | | | | | 24,580 | | | 22,777 | | | 21,726 | | | 21,571 | | | 21,095 | | | 21,054 | | | 2,118 | | | 4,938 | ||||
2015 | | | | | | | | | | | | | 25,653 | | | 26,571 | | | 26,392 | | | 25,430 | | | 25,630 | | | 5,561 | | | 6,265 | |||||
2016 | | | | | | | | | | | | | | | 33,041 | | | 31,632 | | | 30,746 | | | 28,616 | | | 7,846 | | | 11,049 | ||||||
2017 | | | | | | | | | | | | | | | | | 39,295 | | | 31,462 | | | 29,008 | | | 8,410 | | | 16,396 | |||||||
2018 | | | | | | | | | | | | | | | | | | | 42,349 | | | 36,738 | | | 12,183 | | | 15,031 | ||||||||
2019 | | | | | | | | | | | | | | | | | | | | | 53,009 | | | 27,173 | | | 12,179 | |||||||||
| | | | | | | | | | | | | | | | | | | Total | | | $268,757 | | | | | |||||||||||
| | | | | | | | | | | | | | | | | | | | | | | | | |||||||||||||
Cumulative Paid Claims and Allocated Claim Adjustment Expenses, Net of Reinsurance | | | | | ||||||||||||||||||||||||||||||||
For the Years Ended December 31, | | | | | ||||||||||||||||||||||||||||||||
Accident Year | | | 2010* | | | 2011* | | | 2012* | | | 2013* | | | 2014* | | | 2015* | | | 2016* | | | 2017* | | | 2018* | | | 2019 | | | | | ||
2010 | | | 3,594 | | | 7,007 | | | 8,696 | | | 10,095 | | | 10,911 | | | 11,384 | | | 11,779 | | | 12,154 | | | 12,365 | | | 12,499 | | | | | ||
2011 | | | | | 3,954 | | | 8,815 | | | 12,631 | | | 14,107 | | | 15,405 | | | 16,347 | | | 17,085 | | | 17,515 | | | 18,091 | | | | | |||
2012 | | | | | | | 6,143 | | | 11,996 | | | 14,480 | | | 16,249 | | | 17,196 | | | 18,188 | | | 19,098 | | | 19,399 | | | | | ||||
2013 | | | | | | | | | 6,799 | | | 12,602 | | | 15,984 | | | 17,708 | | | 19,246 | | | 19,712 | | | 20,129 | | | | | |||||
2014 | | | | | | | | | | | 6,011 | | | 12,005 | | | 14,814 | | | 16,666 | | | 17,260 | | | 18,238 | | | | | ||||||
2015 | | | | | | | | | | | | | 6,269 | | | 13,770 | | | 16,493 | | | 18,026 | | | 18,903 | | | | | |||||||
2016 | | | | | | | | | | | | | | | 7,509 | | | 15,516 | | | 18,182 | | | 19,286 | | | | | ||||||||
2017 | | | | | | | | | | | | | | | | | 7,845 | | | 15,259 | | | 18,126 | | | | | |||||||||
2018 | | | | | | | | | | | | | | | | | | | 8,326 | | | 18,905 | | | | | ||||||||||
2019 | | | | | | | | | | | | | | | | | | | | | 11,813 | | | | | |||||||||||
| | | | | | | | | | | | | | | | | | | | | 175,389 | | | | | ||||||||||||
| | | All outstanding liabilities before 2010, net of reinsurance | | | 4,811 | | | | | |||||||||||||||||||||||||||
| | | Liabilities for claims and claim adjustment expenses, net of reinsurance | | | $98,179 | | | | | |||||||||||||||||||||||||||
| | | | | | | | | | | | | | | | | | | | | | | | | |||||||||||||
| | | Average Annual Percentage Payout of Incurred Claims by Age, Net of Reinsurance* | | | | | ||||||||||||||||||||||||||||||
Years | | | 1 | | | 2 | | | 3 | | | 4 | | | 5 | | | 6 | | | 7 | | | 8 | | | 9 | | | 10 | | | | | ||
| | | 23.3% | | | 27.2% | | | 11.6% | | | 8.7% | | | 6.1% | | | 3.6% | | | 3.8% | | | 2.8% | | | 4.0% | | | 3.2% | | | | | |||
* | Presented as unaudited required supplementary information. |
(in thousands) | | | 2019 | | | 2018 |
Net outstanding liabilities | | | | | ||
Workers compensation | | | $74,722 | | | $61,073 |
Other liability | | | 20,561 | | | 16,287 |
All other lines of business | | | 2,896 | | | 2,788 |
Liabilities for unpaid loss and loss adjustment expenses, net of reinsurance | | | 98,179 | | | 80,148 |
| | | | | |||
Reinsurance recoverable on unpaid claims | | | | | ||
Workers compensation | | | 237,088 | | | 176,126 |
Other liability | | | 41,873 | | | 26,029 |
All other lines of business | | | 25,044 | | | 55,266 |
Total reinsurance recoverable on unpaid claims | | | 304,005 | | | 257,421 |
Unallocated loss adjustment expenses | | | 4,532 | | | 2,846 |
Total gross liability for unpaid claims and LAE | | | $406,716 | | | $340,415 |
(in thousands) | | | 2019 | | | 2018 |
Letters of Credit | | | $65,877 | | | $60,474 |
Trust | | | 32,207 | | | 29,657 |
Funds Held | | | 165,698 | | | 155,825 |
Total | | | $263,782 | | | $245,956 |
(in thousands) | | | Rating | | | 2019 |
Arch Reins Co | | | A | | | $36,551 |
Markel Global Reins Co | | | A+ | | | 65,211 |
Swiss Re | | | A+ | | | 5,378 |
(in thousands) | | | Rating | | | 2018 |
Arch Reins Co | | | A+ | | | $21,779 |
Markel Global Reins Co | | | A | | | 39,651 |
| | | 2019 | ||||||||||
(in thousands) | | | Gross | | | Assumed | | | Ceded | | | Net |
Losses and LAE liabilities | | | $392,233 | | | $14,483 | | | $(304,005) | | | $102,711 |
Unearned premiums | | | 101,225 | | | 2,564 | | | (80,088) | | | 23,701 |
Written premiums | | | 405,353 | | | 6,048 | | | (325,837) | | | 85,564 |
Earned premiums | | | 391,312 | | | 6,491 | | | (311,325) | | | 86,478 |
Losses and loss adjustment expenses | | | 208,560 | | | 1,871 | | | (165,770) | | | 44,661 |
| | | 2018 | ||||||||||
(in thousands) | | | Gross | | | Assumed | | | Ceded | | | Net |
Losses and LAE liabilities | | | $328,591 | | | $11,824 | | | $(257,421) | | | $82,994 |
Unearned premiums | | | 86,480 | | | 3,007 | | | (66,765) | | | 22,722 |
Written premiums | | | 346,870 | | | 10,137 | | | (284,451) | | | 72,556 |
Earned premiums | | | 330,980 | | | 9,165 | | | (273,569) | | | 66,576 |
Losses and loss adjustment expenses | | | 186,699 | | | 2,133 | | | (153,103) | | | 35,729 |
(in thousands) | | | 2019 | | | 2018 |
Junior subordinated debt | | | $7,732 | | | $7,732 |
Secured credit facility | | | 21,637 | | | 26,469 |
Long-term debt | | | 29,369 | | | 34,201 |
Less: unamortized deferred financing costs | | | (329) | | | (430) |
Net long-term debt | | | $29,040 | | | $33,771 |
2020 | | | $1,891 |
2021 | | | 2,578 |
2022 | | | 3,266 |
2023 | | | 13,902 |
2024 | | | — |
Thereafter | | | 7,732 |
Long-term debt | | | $29,369 |
(in thousands) | | | Rent Expense | | | Sublease Rental Income | | | Net Lease Payments |
2020 | | | $1,718 | | | $(30) | | | $1,688 |
2021 | | | 1,614 | | | (31) | | | 1,583 |
2022 | | | 1,594 | | | (32) | | | 1,562 |
2023 | | | 1,191 | | | (33) | | | 1,158 |
2024 | | | 669 | | | (34) | | | 635 |
Thereafter | | | 46 | | | (100) | | | (54) |
| | | $6,832 | | | $(260) | | | $6,572 |
1. | Upon demand by a majority of the shareholders having voting rights in the Company |
2. | Upon termination of the underlying stock purchase agreement between the Series A holders and Trean (only applicable to Series A shares) |
3. | Any refinancing, recapitalization, sale of assets or stock by Trean Corp or Benchmark Holding Company that results in a realization of gain by the shareholders, to the extent the same is distributed to shareholders, whether in a single or a series of distributions (only applicable to Series A shares) |
4. | Change in the majority control of the Company (only applicable to Series B shares) |
5. | The termination of the shareholder customer agreement (only applicable to Series B shares) |
6. | A qualified initial public offering of Trean Corp or Benchmark Holding Company |
| | | 2019 | |||||||
| | | Total Dividend | | | Dividend per Share | | | Weighted Average Shares | |
Dividends on preferred shares - Series A | | | $43 | | | 4,500.00 | | | 9.62 |
Dividends on preferred shares - Series B | | | 211 | | | 3,506.84 | | | 60.00 |
Total preferred share dividends | | | $254 | | | | | ||
| | | 2018 | |||||||
| | | Total Dividend | | | Dividend per Share | | | Weighted Average Shares | |
Dividends on preferred shares - Series A | | | $45 | | | 4,500.00 | | | 10.00 |
Dividends on preferred shares - Series B | | | 180 | | | 3,459.72 | | | 51.95 |
Total preferred share dividends | | | $225 | | | | | ||
1) | Class A Units: Receive an allocation of profits and losses incurred by the Company as well as maintain the right to receive distributions, along with Class B Units, on a pro rata basis prior to distributions made to other classes of ownership units. |
2) | Class B Units: Receive an allocation of profits and losses incurred by the Company as well as maintain the right to receive distributions, along with Class A Units, on a pro rata basis prior to distributions made to other classes of ownership units. Class B maintains both voting and non-voting units. Each Class B Voting Unit is entitled to one vote per Class B Voting Unit on each matter to which the members are entitled to vote. Class B Non-Voting Units maintain all rights, preferences and privileges allowed to Class B Voting Units with the exception of voting rights. |
3) | Class C Units: Receive an allocation of profits and losses incurred by the Company. Participating Class C Units maintain the right to receive distributions after any Class A or Class B units based on the unit holders’ pro rata share. |
(in thousands) | | | 2019 | | | 2018 |
Balance at beginning of period | | | $(2,003) | | | $951 |
Other comprehensive income (loss) before reclassifications, net of tax | | | 6,877 | | | (3,132) |
Less: amounts reclassified from accumulated other comprehensive income (loss), net of tax | | | 53 | | | (178) |
Net current period other comprehensive income (loss) | | | 6,824 | | | (2,954) |
Balance at end of period | | | $4,821 | | | $(2,003) |
| | | 2019 | |||||||
(in thousands) | | | Cost or Amortized Cost | | | Fair Value | | | Amount at which shown on Balance Sheet |
Fixed maturities: | | | | | | | |||
U.S. government and government securities | | | $15,965 | | | $16,129 | | | $16,129 |
Foreign governments | | | 299 | | | 302 | | | 302 |
States, territories and possessions | | | 4,789 | | | 4,923 | | | 4,923 |
Political subdivisions of states, territories and possessions | | | 24,444 | | | 25,104 | | | 25,104 |
Special revenue and special assessment obligations | | | 59,149 | | | 61,405 | | | 61,405 |
Industrial and public utilities | | | 119,735 | | | 123,207 | | | 123,207 |
Commercial mortgage-backed securities | | | 15,586 | | | 16,312 | | | 16,312 |
Residential mortgage-backed securities | | | 53,467 | | | 54,109 | | | 54,109 |
Other loan-backed securities | | | 35,849 | | | 36,011 | | | 36,011 |
Hybrid securities | | | 357 | | | 363 | | | 363 |
Total fixed maturities | | | 329,640 | | | 337,865 | | | 337,865 |
Equity securities: | | | | | | | |||
Preferred stock | | | 337 | | | 343 | | | 343 |
Common stock | | | 492 | | | 492 | | | 492 |
Total equity maturities | | | 829 | | | 835 | | | 835 |
Equity method investments | | | 12,173 | | | 12,173 | | | 12,173 |
Total Investments | | | $342,642 | | | $350,873 | | | $350,873 |
| | | 2018 | |||||||
(in thousands) | | | Cost or Amortized Cost | | | Fair Value | | | Amount at which shown on Balance Sheet |
Fixed maturities: | | | | | | | |||
U.S. government and government securities | | | $18,974 | | | $18,823 | | | $18,823 |
Foreign governments | | | 299 | | | 299 | | | 299 |
States, territories and possessions | | | 5,118 | | | 5,134 | | | 5,134 |
Political subdivisions of states, territories and possessions | | | 25,679 | | | 25,646 | | | 25,646 |
Special revenue and special assessment obligations | | | 52,465 | | | 52,662 | | | 52,662 |
Industrial and public utilities | | | 119,952 | | | 118,340 | | | 118,340 |
Commercial mortgage-backed securities | | | 11,472 | | | 11,411 | | | 11,411 |
Residential mortgage-backed securities | | | 41,028 | | | 40,399 | | | 40,399 |
Other loan-backed securities | | | 34,526 | | | 34,278 | | | 34,278 |
Hybrid securities | | | 258 | | | 245 | | | 245 |
Total fixed maturities | | | 309,771 | | | 307,237 | | | 307,237 |
Equity securities: | | | | | | | |||
Preferred stock | | | 325 | | | 321 | | | 321 |
Total equity maturities | | | 325 | | | 321 | | | 321 |
Equity method investments | | | 13,900 | | | 13,900 | | | 13,900 |
Total Investments | | | $323,996 | | | $321,458 | | | $321,458 |
(in thousands) | | | Deferred policy acquisition cost | | | Unpaid losses and loss adjustment expenses | | | Unearned premiums |
As of December 31, 2019 | | | | | | | |||
Property and casualty insurance | | | $2,115 | | | $406,716 | | | $103,789 |
As of December 31, 2018 | | | | | | | |||
Property and casualty insurance | | | $2,976 | | | $340,415 | | | $90,074 |
(in thousands) | | | Earned Premiums | | | Net investment income | | | Loss and loss adjustment expenses | | | Amortization of deferred policy acquisition costs | | | Other operating expenses | | | Net written premiums |
For the year ended December 31, 2019 | | | | | | | | | | | | | ||||||
Property and casualty insurance | | | $86,478 | | | $6,245 | | | $44,661 | | | $15,507 | | | $5,498 | | | $85,564 |
For the year ended December 31, 2018 | | | | | | | | | | | | | ||||||
Property and casualty insurance | | | $66,576 | | | $4,816 | | | $35,729 | | | $7,136 | | | $8,570 | | | $72,556 |
(in thousands) | | | Gross amount | | | Ceded to other companies | | | Assumed from other companies | | | Net amount | | | Percentage of amount assumed to net |
For the year ended December 31, 2019 | | | | | | | | | | | |||||
Premiums: | | | | | | | | | | | |||||
Property and casualty insurance | | | $405,353 | | | $325,837 | | | $6,048 | | | $85,564 | | | 7% |
Total premiums | | | $405,353 | | | $325,837 | | | $6,048 | | | $85,564 | | | 7% |
For the year ended December 31, 2018 | | | | | | | | | | | |||||
Premiums: | | | | | | | | | | | |||||
Property and casualty insurance | | | $346,870 | | | $284,451 | | | $10,137 | | | $72,556 | | | 14% |
Total premiums | | | $346,870 | | | $284,451 | | | $10,137 | | | $72,556 | | | 14% |
| | | | | Losses and Loss Adjustment Expenses Incurred Related to: | | | ||||||
(in thousands) | | | Discount Deductible from Liabilities | | | Current Year | | | Prior Year | | | Paid Losses and Loss Adjustment Expenses |
Years ended December 31, | | | | | | | | | ||||
2019 | | | $ — | | | $54,933 | | | $(10,272) | | | $31,310 |
2018 | | | $— | | | $41,635 | | | $(5,906) | | | $24,083 |
Joint Book-Running Managers | ||||||
J.P. Morgan | | | Evercore ISI | | | William Blair |
Co-Manager | |||
JMP Securities |
Item 13. | Other expenses of issuance and distribution |
| | | Amount to be paid | |
SEC registration fee | | | $23,990 |
FINRA filing fee | | | 28,223 |
Stock exchange listing fee | | | 250,000 |
Printing expenses | | | 185,000 |
Legal fees and expenses | | | 2,500,000 |
Accounting fees and expenses | | | 1,250,000 |
Miscellaneous expenses | | | 500,000 |
Total | | | $4,737,213 |
Item 14. | Indemnification of directors and officers |
Item 15. | Recent sales of unregistered securities |
• | shares of our common stock to each of Trean Holdings LLC (“Trean Holdings”) and BIC Holdings LLC (“BIC Holdings”) in exchange for their contribution of all of their respective assets and liabilities to Trean Insurance Group, Inc.; |
• | shares of our common stock to Blake Baker Enterprises I, Inc., Blake Baker Enterprises II, Inc. and Blake Baker Enterprises III, Inc. in exchange for their 55% equity interest in Compstar Holding Company LLC pursuant to an agreement, dated as of June 3, 2020, filed as Exhibit 10.5 hereto; and |
• | shares of our common stock to Randall D. Jones in exchange for his Class C units in Trean Holdings and BIC Holdings that will become fully vested in connection with the IPO. |
Item 16. | Exhibits and financial statement schedules |
Item 17. | Undertakings |
(a) | The undersigned registrant hereby undertakes to provide to the underwriters at the closing specified in the underwriting agreement, certificates in such denominations and registered in such names as required by the underwriters to permit prompt delivery to each purchaser. |
(b) | Insofar as indemnification for liabilities arising under the Securities Act of 1933 may be permitted to directors, officers and controlling persons of the registrant pursuant to the foregoing provisions, or otherwise, the registrant has been advised that in the opinion of the Securities and Exchange Commission such indemnification is against public policy as expressed in the Act and is, therefore, unenforceable. In the event that a claim for indemnification against such liabilities (other than the payment by the registrant of expenses incurred or paid by a director, officer or controlling person of the registrant in the successful defense of any action, suit or proceeding) is asserted by such director, officer or controlling person in connection with the securities being registered hereunder, the registrant will, unless in the opinion of its counsel the matter has been settled by controlling precedent, submit to a court of appropriate jurisdiction the question of whether such indemnification by it is against public policy as expressed in the Act and will be governed by the final adjudication of such issue. |
(c) | The undersigned registrant hereby undertakes that: |
(1) | For purposes of determining any liability under the Securities Act, the information omitted from the form of prospectus filed as part of this Registration Statement in reliance upon Rule 430A and contained in a form of prospectus filed by the registrant pursuant to Rule 424(b)(1) or (4) or 497(h) under the Securities Act shall be deemed to be part of this Registration Statement as of the time it was declared effective. |
(2) | For the purpose of determining any liability under the Securities Act, each post-effective amendment that contains a form of prospectus shall be deemed to be a new registration statement relating to the securities offered therein, and the offering of such securities at that time shall be deemed to be the initial bona fide offering thereof. |
Exhibit Number | | | Description |
| | | Form of Underwriting Agreement | |
| | | Form of Amended and Restated Certificate of Incorporation of Trean Insurance Group, Inc. | |
| | | Form of Amended and Restated By-Laws of Trean Insurance Group, Inc. | |
| | | Opinion of Skadden, Arps, Slate, Meagher & Flom LLP | |
| | | Form of Registration Rights Agreement among Trean Insurance Group, Inc. and the parties named therein | |
| | | Form of Reorganization Agreement among Trean Insurance Group, Inc. and the parties named therein | |
| | | Form of Contribution Agreement among Trean Insurance Group, Inc., BIC Holdings LLC and Trean Holdings LLC | |
| | | Form of Contribution Agreement between Trean Insurance Group, Inc. and Trean Compstar Holdings LLC | |
| | | Agreement, dated as of June 3, 2020, among Blake Baker Enterprises I, Inc., Blake Baker Enterprises II, Inc., Blake Baker Enterprises III, Inc., Blake Baker, Compstar Holding Company LLC, Trean Holdings LLC and Trean Compstar Holdings LLC |
Exhibit Number | | | Description |
| | | Amendment No. 1 to Agreement, dated as of July 6, 2020, among Blake Baker Enterprises I, Inc., Blake Baker Enterprises II, Inc., Blake Baker Enterprises III, Inc., Blake Baker, Compstar Holding Company LLC, Trean Holdings LLC and Trean Compstar Holdings LLC | |
| | | Form of Director Nomination Agreement among Trean Insurance Group, Inc. and the Altaris Funds | |
| | | Form of Trean Insurance Group, Inc. 2020 Omnibus Incentive Plan | |
| | | Form of Restricted Stock Unit Award Agreement | |
| | | Form of Non-Qualified Stock Option Award Agreement | |
| | | Form of Indemnification Agreement between Trean Insurance Group, Inc. and each of its directors and executive officers | |
| | | Form of Termination Agreement among Altaris Capital Partners, LLC, BIC Holdings LLC, Trean Holdings LLC and Trean Insurance Group, Inc. | |
| | | Amended and Restated Credit Agreement, dated as of May 26, 2020, among Trean Holdings LLC, Trean Corporation, Trean Compstar Holdings LLC, Benchmark Administrators, LLC and First Horizon Bank, N.A. | |
| | | Change in auditor letter from RSM US LLP | |
| | | List of subsidiaries of Trean Insurance Group, Inc. | |
| | | Consent of Deloitte & Touche LLP, independent registered public accounting firm | |
| | | Consent of Deloitte & Touche LLP, independent registered public accounting firm | |
| | | Consent of Skadden, Arps, Slate, Meagher & Flom LLP (included in Exhibit 5.1) | |
| | | Power of Attorney (included on signature page) | |
| | | Consent of Terry P. Mayotte, a director nominee |
* | Previously filed. |
† | Compensatory plan or arrangement. |
| | | TREAN INSURANCE GROUP, INC. | |||||||
| | | | | | | ||||
| | | By: | | | /s/ Andrew M. O’Brien | ||||
| | | | | Name: | | | Andrew M. O’Brien | ||
| | | | | Title: | | | President and Chief Executive Officer | ||
Signature and Name | | | Title | | | Date |
| | | | | |||
/s/ Andrew M. O’Brien | | | President, Chief Executive Officer and Director (principal executive officer) | | | July 13, 2020 |
Andrew M. O’Brien | | |||||
| | | | | |||
/s/ Julie A. Baron | | | Chief Financial Officer, Treasurer and Secretary (principal financial officer) | | | July 13, 2020 |
Julie A. Baron | | |||||
| | | | | |||
/s/ Nicholas J. Vassallo | | | Chief Accounting Officer (principal accounting officer) | | | July 13, 2020 |
Nicholas J. Vassallo | | |||||
| | | | | |||
* | | | Chairman of the Board | | | July 13, 2020 |
Daniel G. Tully | | |||||
| | | | | |||
* | | | Director | | | July 13, 2020 |
David G. Ellison | | |||||
| | | | | |||
* | | | Director | | | July 13, 2020 |
Randall D. Jones | | |||||
| | | | | |||
* | | | Director | | | July 13, 2020 |
Steven B. Lee | |
*By: | | | /s/ Andrew M. O’Brien | | | |
| | | Andrew M. O’Brien | | | ||
| | | Attorney-in-Fact | | |