Attached files
| file | filename |
|---|---|
| EX-99.1 - PRESS RELEASE - Simulations Plus, Inc. | simulations_ex9901.htm |
| 8-K - FORM 8-K - Simulations Plus, Inc. | simulations_8k-070720.htm |
Exhibit 99.2

Q3FY2020 Investor Conference Call Shawn O’Connor, CEO John Kneisel, CFO July 9, 2020 (NASDAQ:SLP)

2 With the exception of historical information, the matters discussed in this presentation are forward - looking statements that involve a number of risks and uncertainties . The actual results of the Company could differ significantly from those statements . Factors that could cause or contribute to such differences include but are not limited to : continuing demand for the Company’s products, competitive factors, the Company’s ability to finance future growth, the Company’s ability to produce and market new products in a timely fashion, the Company’s ability to continue to attract and retain skilled personnel, and the Company’s ability to sustain or improve current levels of productivity . Further information on the Company’s risk factors is contained in the Company’s quarterly and annual reports and filed with the Securities and Exchange Commission . Safe Harbor Statement

Steady and Consistent Revenue Growth 3 Organic Revenue Growth has accelerated to new 15 - 20% range $11.2 $12.0 $13.5 $14.7 $16.8 $4.8 $5.9 $9.4 $11.2 $15.2 $16.0 $17.9 $22.9 $25.9 $32.0 2016 2017 2018 2019 2020 9 Months Revenue $ in millions Software Consulting Key Highlights • Q3 FY2020 Financial Highlights – Revenue up 23.8% for Q3FY20 vs Q3FY19 – Gross profit 78.3% for Q3FY20 vs 76.6% Q3FY19 – Net income before taxes 39.7% Q3FY20 (excluding one - time acquisition expenses) vs 38.8% Q3FY19 – EPS $0.16 Q3FY20 ($0.20 excluding one - time acquisition expenses) vs $0.16 Q3FY19 – Cash generated from operations during the quarter of $6.1M with cash on hand at end of quarter of $7.4M • Operational Highlights – Software revenue: 56% of total revenue, 18% y/y growth – Service revenue: 44% of total revenue, 32% y/y growth – 133 Employees (including 97 with advanced degrees) up 23% y/y (60% of that growth is billable consulting staff) $4.5 $4.7 $5.5 $5.8 $6.8 $1.5 $2.0 $3.0 $4.1 $5.5 $6.0 $6.7 $8.5 $9.9 $12.3 16.3 17.3 18.3 19.3 20.3 Third Quarter Revenue $ in millions

COVID - 19 Impact • Operational Impact - Minimal – Operational transition achieved without disruption – Offices are re - opening on a voluntary basis but anticipate continued highly remote workforce into the future • Financial Impact – Minimal – Recurring revenues • 85% of software revenue this quarter sourced from renewals • 47% of total company revenues this quarter sourced from renewals – Service backlog • Ended quarter with more that $12 million in contract backlog representing more than 3 quarters of average service revenue • New Business Impact – Moderate but improving – Slowdown in new business closures both in terms of new software licenses and new service business – Software delays especially in our Asian market – Software and service sales cycles transitioned to lead generation, virtual meetings and presentations and our pipeline of business is growing – Recently introduced service offerings in regulatory guidance and Covid rapid response have generated new opportunities 4

Simulations Plus Division (Lancaster) 5 The genesis of the company… providing software, training and consulting services $11.1 $11.9 $12.8 $13.8 $15.5 $0.7 $0.8 $1.4 $1.6 $2.1 $11.8 $12.7 $14.2 $15.4 $17.6 2016 2017 2018 2019 2020 9 Months Revenue $ in millions Software Consulting Simulations Plus represented 55% of total revenue and 63% of EBITDA for Q3 FY2020 Key Highlights • Q3 FY2020 Financial Highlights – Revenue up 12% for the quarter – Q3 Revenue breakdown: 79% Renewal; 10% New; 11% Services – Software renewal: 88% (accounts), 94% (fees) – 11 new commercial companies added software licenses – 12 new non - profit research groups added software licenses – Projects with 28 companies and 7 funded collaborations • Operational Highlights – Continued progress on research initiatives: • GastroPlus® X (GPX) • ADMET Predictor® X (APX) – New FDA grant award to develop strategies for PBPK/PD model translation from animals to human for ocular products – New Regulatory Strategies resulted in >$250K in time/materials contracts this quarter $4.5 $4.7 $5.3 $5.5 $6.0 $0.2 $0.2 $0.4 $0.5 $0.7 $4.7 $4.9 $5.7 $6.0 $6.7 16.3 17.3 18.3 19.3 20.3 Third Quarter Revenue $ in millions

Key Highlights • Q3 FY2020 Financial Highlights – Revenue up 20% for the quarter – 64 active projects in 3QFY20 across 31 companies – 33 contracts signed in 3QFY20, including 18 new projects • Operational Highlights – 28 proposals across 24 different companies, outstanding at the start of 4QFY20 – Currently involved in discussions at various stages with several clients related to potential COVID - 19 projects – Hired Director, Quantitative Clinical Pharmacology, to focus on PBPK modeling services, popPK M&S, and related quantitative support for multiple programs as well as business development Cognigen Division (Buffalo) 6 A leading provider of population modeling and simulation services for the pharma and biotech industries $0.1 $0.1 $0.2 $0.2 $0.1 $4.2 $5.1 $5.6 $6.8 $8.1 $4.3 $5.2 $5.8 $7.0 $8.2 2016 2017 2018 2019 2020 9 Months Revenue $ in millions Software Consulting Cognigen represented 25% of total revenue and 15% of EBITDA for Q3 FY2020 $0.03 $0.04 $0.04 $0.09 $0.04 $1.3 $1.8 $1.9 $2.4 $3.0 $1.4 $1.8 $1.9 $2.5 $3.0 16.3 17.3 18.3 19.3 20.3 Third Quarter Revenue $ in millions

$0.6 $0.7 $0.6 $2.4 $2.9 $5.1 $3.0 $3.7 $5.7 2018 2019 2020 9 Months Revenue $ in millions Software Consulting DILIsym Division (RTP) 7 A leading provider of software products and services in QST and QSP Key Highlights • Q3 FY2020 Financial Highlights – Revenue up 39% for the quarter – Revenue breakdown: 55% DILIsym ® software and service projects; 5% RADAsym™ model services; 22% IPFsym™ model services; 10% RENAsym ® model services; 8% Heart Failure model services • Operational Highlights – 13 active DILIsym consulting projects – 7 active consortium contracts, which is one vehicle used for DILIsym licensing – 1 consulting project and software capability enhancements completed for NAFLDsym ® – Focused on adding new science and features to DILIsym including immunology, new simulated populations, and advance integration with GastroPlus ® DILIsym represented 16% of total revenue and 12% of EBITDA for Q3 FY2020 $0.2 $0.2 $0.2 $0.7 $1.1 $1.7 $0.9 $1.4 $1.9 18.3 19.3 20.3 Third Quarter Revenue $ in millions

Lixoft (Paris Division) 8 A leading provider of software products and services in QST and QSP Key Highlights • Q3 FY2020 Financial Highlights (Two months 4/1/20 - 5/31/20) • Revenue – Revenue growth 15% vs Q3FY19 – 98% of revenue is software related • Key highlights: – 52 customers – increase of 10 over Q3FY19 – Software renewal: 84% (fees), 98% (accounts) • Post acquisition efforts – Software sales and Marketing – Integrated software development plans – Monolix based consulting services – Organizational integration Lixoft represented 5% of total revenue and 9% of EBITDA for Q3 FY2020 $0.6 20.3 Third Quarter Revenue $ in millions Software

Financial Results

10 Income Statement: 3QFY20 Versus 3QFY19 (in millions) Note : Some numbers may not foot or crossfoot due to rounding . 3Q20 SG &A includes $1.1M of acquisition related costs. 3QFY20 3QFY19 Diff % chg Net sales $ 12.3 $ 9.9 $ 2.4 23.8% Gross profit 9.6 7.6 2.0 26.5% Gross profit margin 78.3% 76.6% 1.7% 2.2% SG&A $ 5.0 $ 3.1 $ 1.9 62.7% R&D 0.8 $ 0.6 0.1 17.0% Total operating expenses 5.8 $ 3.7 2.0 54.8% Income from operations 3.9 $ 3.9 (0.0) - 0.6% Other income (expense) (0.1) $ (0.0) (0.0) 160.7% Income from operations before income taxes 3.8 $ 3.9 (0.1) - 1.9% Net income $ 2.9 $ 2.9 $ 0.0 1.6% Diluted earnings per share (in dollars) $ 0.16 $ 0.16 $ (0.00) - 0.2% EBITDA $ 4.6 $ 4.6 $ 0.0 0.2%

11 Income Statement: 9MoFY20 Versus 9MoFY19 (in millions) 9MoFY20 9MoFY19 Diff % chg Net sales $ 32.0 $ 25.9 $ 6.1 23.5% Gross profit 24.1 19.2 4.9 25.3% Gross profit margin 75.1% 74.0% 1.1% 1.5% SG&A $ 12.6 8.6 $ 4.0 46.8% R&D 2.0 1.9 0.1 6.8% Total operating expenses 14.7 10.5 4.2 39.6% Income from operations 9.4 8.7 0.7 8.1% Other income (expense) (0.1) (0.1) 0.1 - 59.8% Income from operations before income taxes 9.3 8.6 0.8 9.1% Net income $ 7.1 $ 6.5 $ 0.6 9.5% Diluted earnings per share (in dollars) $ 0.39 $ 0.36 $ 0.03 7.6% EBITDA $ 11.5 $ 10.7 $ 0.7 6.8% Note : some numbers may not foot or crossfoot due to rounding . 9moFY20 SG &A includes $1.4M of acquisition related costs.

12 Consolidated Revenues: Fiscal Quarter ( in millions) $4.8 $5.2 $6.0 $4.0 $5.4 $5.7 $6.8 $6.3 $7.1 $7.4 $8.6 $6.7 $7.5 $8.5 $9.9 $8.0 $9.4 $10.3 $12.3 $0 $1 $2 $3 $4 $5 $6 $7 $8 $9 $10 $11 $12 $13 Q1 Q2 Q3 Q4 2016 2017 2018 2019 2020

13 Consolidated Income from Operations: Fiscal Quarter (in millions) $1.7 $1.7 $2.8 $1.0 $1.9 $1.8 $3.1 $1.4 $2.6 $2.4 $3.4 $1.9 $2.1 $2.7 $3.9 $2.0 $2.7 $2.8 $3.9 $0.0 $0.5 $1.0 $1.5 $2.0 $2.5 $3.0 $3.5 $4.0 $4.5 Q1 Q2 Q3 Q4 2016 2017 2018 2019 2020

$1.1 $1.2 $1.9 $0.8 $1.4 $1.2 $2.1 $1.2 $1.7 $3.5 $2.4 $1.3 $1.5 $2.1 $2.9 $2.1 $2.1 $2.2 $2.9 $0.0 $0.5 $1.0 $1.5 $2.0 $2.5 $3.0 $3.5 $4.0 Q1 Q2 Q3 Q4 2016 2017 2018 2019 2020 $2.0 14 Note: 2Q18 $1.5M tax benefit of deferred tax adjustment Consolidated Net Income: Fiscal Quarter (in millions)

15 Consolidated Diluted Earnings Per Share: Fiscal Quarter $0.06 $0.07 $0.11 $0.05 $0.08 $0.07 $0.12 $0.06 $0.10 $0.19 $0.13 $0.07 $0.09 $0.12 $0.16 $0.11 $0.11 $0.12 $0.16 $0.00 $0.02 $0.04 $0.06 $0.08 $0.10 $0.12 $0.14 $0.16 $0.18 $0.20 Q1 Q2 Q3 Q4 FY16 FY17 FY18 FY19 FY20 $0.11 Note: 2Q18 $0.08 tax benefit of deferred tax adjustment

16 Consolidated EBITDA: Fiscal Quarter (in millions) $2.2 $2.2 $3.3 $1.5 $2.5 $2.3 $3.6 $2.0 $3.2 $3.1 $4.1 $2.6 $2.8 $3.4 $4.6 $2.7 $3.4 $3.5 $4.6 $0 $1 $2 $3 $4 $5 Q1 Q2 Q3 Q4 2016 2017 2018 2019 2020

Revenue by Region – YTD 2020 Europe 16 % Americas 69 % Asia 15 % Japan = 50% China = 21% India = 16% Korea = 12% 17 A global and diversified base of revenue
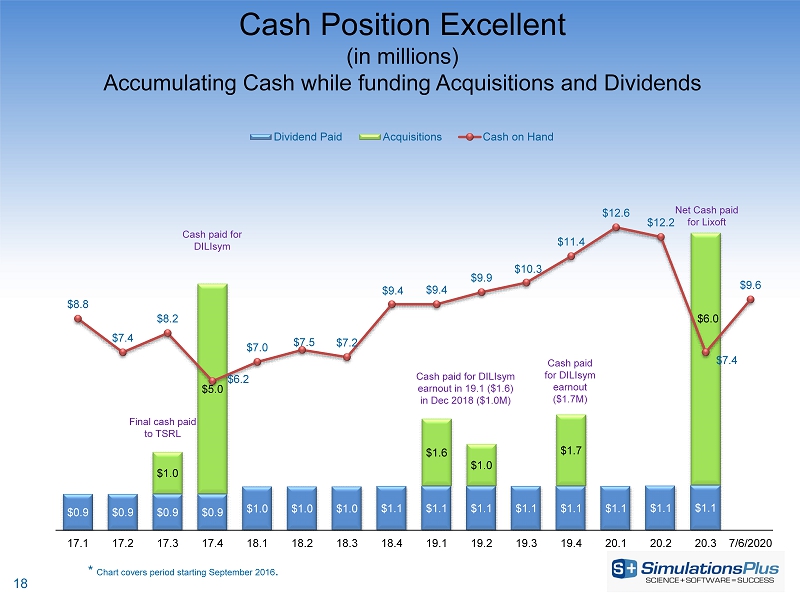
18 Cash Position Excellent (in millions) Accumulating Cash while funding Acquisitions and Dividends $0.9 $0.9 $0.9 $0.9 $1.0 $1.0 $1.0 $1.1 $1.1 $1.1 $1.1 $1.1 $1.1 $1.1 $1.1 $1.0 $5.0 $1.6 $1.0 $1.7 $6.0 $8.8 $7.4 $8.2 $6.2 $7.0 $7.5 $7.2 $9.4 $9.4 $9.9 $10.3 $11.4 $12.6 $12.2 $7.4 $9.6 17.1 17.2 17.3 17.4 18.1 18.2 18.3 18.4 19.1 19.2 19.3 19.4 20.1 20.2 20.3 7/6/2020 Dividend Paid Acquisitions Cash on Hand Cash paid for DILIsym earnout in 19.1 ($1.6) in Dec 2018 ($1.0M) Cash paid for DILIsym earnout ($1.7M) Cash paid for DILIsym Final cash paid to TSRL * Chart covers period starting September 2016 . Net Cash paid for Lixoft

19 Selected Consolidated Balance Sheet Items (in millions, except where indicated) May 31, 2020 August 31, 2019 Cash and cash equivalents $ 7.4* $ 11.4 Cash per share ( in Dollars ) $ 0.41 $ 0.65 Total current assets 22.2 21.2 Total assets 61.6 45.2 Total current liabilities 7.8 4.8 Total liabilities 15.0 7.5 Current ratio 2.85x 4.42x Shareholders’ equity 46.6 37.7 Total liabilities and shareholders’ equity 61.6 45.2 Shareholders’ equity per diluted share ( in Dollars ) $2.5 $2.1 * Cash as of July 6, 2020 ~$9.6 million.

1 Dividend ratio for FY2019; No assurances of future cash dividends can be made as the BOD makes its decision on a quarterly ba si s based on current financial condition and strategic plans. Products & Services Software Portfolio • Modeling & simulation platform for drug R&D • Predictive software for >140 properties of chemical formulations • Analytical software for certain biological or disease states • Cloud - based web app for drug development lifecycle management Consulting Services • Provide multi - disciplinary modeling and simulation support Operating Divisions • Simulations Plus, Inc. • Cognigen • DILIsym • Lixoft Consistent Financial Results • > 10 years of consistent revenue growth • > 10 years of profitability • Cash generated of $6.1M from operations during nine months ended 5/31/20 with cash on hand of $9.6 Million at 7/6/2020 • Dividend payout ratio of 49% 1 • Quarterly dividend of $0.06 per share 1 Customers and Market Pharmaceutical and biotech companies ranging from the largest in the world to a number of medium - sized and smaller companies in the U.S., Europe and Japan Corporate Information • The company was founded in 1996 and now has 133 employees* worldwide. • Primary offices located in Lancaster, CA; Buffalo, NY; Raleigh, NC; and Paris, France. * As of 5/31/2020 Simulations Plus Our mission is to improve the productivity of science - based research & development enterprises by delivering innovative modeling and simulation software and insightful consulting services 20

21 Thank you! https://www.linkedin.com/company/simulations - plus https://www.linkedin.com/company/cognigen https://www.linkedin.com/company/dilisym https://www.linkedin.com/company/lixoft/