Attached files
| file | filename |
|---|---|
| EX-99.2 - EX-99.2 - Haymaker Acquisition Corp. II | d98905dex992.htm |
| 8-K - 8-K - Haymaker Acquisition Corp. II | d98905d8k.htm |
Exhibit 99.1 I N V E S T O R P R E S E N TAT I O N J U LY 2 0 2 0 1 ARKO Holdings Ltd. IIExhibit 99.1 I N V E S T O R P R E S E N TAT I O N J U LY 2 0 2 0 1 ARKO Holdings Ltd. II
2 2 Disclaimer This investor presentation (“Investor Presentation”) is for informational purposes only and does not constitute an offer to sell, a solicitation of an offer to buy, or a recommendation to purchase any equity, debt or other financial instruments of Haymaker Acquisition Corp. II (“Haymaker” or “we”) or Arko Holdings Ltd. (“Arko”) or any of Arko’s or Haymaker’s affiliates’ (as such term is defined under the U.S. federal securities laws) securities. This Investor Presentation has been prepared to assist interested parties in making their own evaluation with respect to the proposed business combination of Arko and Haymaker (the “Business Combination”), and for no other purpose. The information contained herein does not purport to be all-inclusive. The data contained herein is derived from various internal and external sources. All information in relation to Arko and GPM Investments, LLC (“GPM”) set forth in this Investor Presentation has been provided by Arko and GPM. No representation is made as to the reasonableness of the assumptions made within or the accuracy or completeness of any projections, modeling or any other information contained herein. All levels, prices and spreads are historical and do not represent current market levels, prices or spreads, some or all of which may have changed since the issuance of this document. Any data on past performance, modeling contained herein is not an indication as to future performance. Arko and Haymaker assume no obligation to update the information in this Investor Presentation. Neither Arko nor Haymaker accepts any liability whatsoever for any losses arising from the use of this Investor Presentation or reliance on the information contained 2 herein. Nothing herein shall be deemed to constitute investment, legal, tax, financial, accounting or other advice. No representation or warranty (whether expressed or implied) has been made by Haymaker, Arko or any of their respective affiliates with respect to the matters set forth in this Investor Presentation, and the recipient disclaims any such representation or warranty. Use of Projections This Investor Presentation contains financial forecasts, including with respect to estimated revenues and EBITDA for GPM for fiscal years 2020 and 2021. Neither GPM’s nor Arko’s independent auditors, nor the independent registered public accounting firm of Haymaker, audited, reviewed, compiled, or performed any procedures with respect to the projections for the purpose of their inclusion in this Investor Presentation, and accordingly, neither of them expressed an opinion or provided any other form of assurance with respect thereto for the purpose of this Investor Presentation. These projections should not be relied upon as being necessarily indicative of future results. In this Investor Presentation, certain of the above-mentioned estimated information has been repeated (subject to the qualifications presented herein), for purposes of providing comparisons with historical data. The assumptions and estimates underlying the prospective financial information are inherently uncertain and are subject to a wide variety of significant business, economic and competitive risks and uncertainties that could cause actual results to differ materially from those contained in the prospective financial information. Accordingly, there can be no assurance that the prospective results are indicative of the future performance of Arko, GPM, Haymaker or the combined company or that actual results will not differ materially from those presented in the prospective financial information. Inclusion of the prospective financial information in this Investor Presentation should not be regarded as a representation by any person that the results contained in the prospective financial information will be achieved. Additional Information and Where to Find It If a definitive agreement is entered into in connection with the Business Combination, Haymaker will prepare a proxy statement/prospectus (the “Haymaker proxy statement/prospectus”) to be filed with the United States Securities and Exchange Commission (the “SEC”) and mailed to Haymaker’s stockholders. In addition, Arko will prepare a proxy statement (the “Arko proxy”), to be filed with the Israel Securities Authority (the “ISA”). Haymaker and Arko urge investors and other interested persons to read, when available, the Haymaker proxy statement/prospectus and the Arko proxy, as well as other documents filed with the SEC and the ISA, because these documents will contain important information about the Business Combination. Such persons can also read Haymaker’s Annual Report on Form 10-K for the fiscal year ended December 31, 2019 (the “Haymaker Annual Report”), for a description of the security holdings of its officers and directors and their respective interests as security holders in the consummation of the transactions described herein. The Haymaker proxy statement statement/prospectus, once available, and Haymaker Annual Report can be obtained, without charge, at the SEC’s web site (http://www.sec.gov). Participants in the Solicitation Haymaker, Arko and their respective directors, executive officers and other members of their management and employees, under SEC rules, may be deemed to be participants in the solicitation of proxies of Haymaker stockholders in connection with the Business Combination. Investors and securityholders may obtain more detailed information regarding the names, affiliations and interests of Haymaker’s directors and officers in its Annual Report on Form 10-K for the fiscal year ended December 31, 2019, which was filed with the SEC on March 19, 2020. Information regarding the persons who may, under SEC rules, be deemed participants in the solicitation of proxies to Haymaker’s stockholders in connection with the Business Combination will be set forth in the proxy statement/prospectus for the Business Combination when available. Information concerning the interests of Haymaker’s and Arko’s participants in the solicitation, which may, in some cases, be different than those of Haymaker’s and Arko’s equityholders generally, will be set forth in the proxy statement/prospectus relating to the Business Combination when it becomes available.2 2 Disclaimer This investor presentation (“Investor Presentation”) is for informational purposes only and does not constitute an offer to sell, a solicitation of an offer to buy, or a recommendation to purchase any equity, debt or other financial instruments of Haymaker Acquisition Corp. II (“Haymaker” or “we”) or Arko Holdings Ltd. (“Arko”) or any of Arko’s or Haymaker’s affiliates’ (as such term is defined under the U.S. federal securities laws) securities. This Investor Presentation has been prepared to assist interested parties in making their own evaluation with respect to the proposed business combination of Arko and Haymaker (the “Business Combination”), and for no other purpose. The information contained herein does not purport to be all-inclusive. The data contained herein is derived from various internal and external sources. All information in relation to Arko and GPM Investments, LLC (“GPM”) set forth in this Investor Presentation has been provided by Arko and GPM. No representation is made as to the reasonableness of the assumptions made within or the accuracy or completeness of any projections, modeling or any other information contained herein. All levels, prices and spreads are historical and do not represent current market levels, prices or spreads, some or all of which may have changed since the issuance of this document. Any data on past performance, modeling contained herein is not an indication as to future performance. Arko and Haymaker assume no obligation to update the information in this Investor Presentation. Neither Arko nor Haymaker accepts any liability whatsoever for any losses arising from the use of this Investor Presentation or reliance on the information contained 2 herein. Nothing herein shall be deemed to constitute investment, legal, tax, financial, accounting or other advice. No representation or warranty (whether expressed or implied) has been made by Haymaker, Arko or any of their respective affiliates with respect to the matters set forth in this Investor Presentation, and the recipient disclaims any such representation or warranty. Use of Projections This Investor Presentation contains financial forecasts, including with respect to estimated revenues and EBITDA for GPM for fiscal years 2020 and 2021. Neither GPM’s nor Arko’s independent auditors, nor the independent registered public accounting firm of Haymaker, audited, reviewed, compiled, or performed any procedures with respect to the projections for the purpose of their inclusion in this Investor Presentation, and accordingly, neither of them expressed an opinion or provided any other form of assurance with respect thereto for the purpose of this Investor Presentation. These projections should not be relied upon as being necessarily indicative of future results. In this Investor Presentation, certain of the above-mentioned estimated information has been repeated (subject to the qualifications presented herein), for purposes of providing comparisons with historical data. The assumptions and estimates underlying the prospective financial information are inherently uncertain and are subject to a wide variety of significant business, economic and competitive risks and uncertainties that could cause actual results to differ materially from those contained in the prospective financial information. Accordingly, there can be no assurance that the prospective results are indicative of the future performance of Arko, GPM, Haymaker or the combined company or that actual results will not differ materially from those presented in the prospective financial information. Inclusion of the prospective financial information in this Investor Presentation should not be regarded as a representation by any person that the results contained in the prospective financial information will be achieved. Additional Information and Where to Find It If a definitive agreement is entered into in connection with the Business Combination, Haymaker will prepare a proxy statement/prospectus (the “Haymaker proxy statement/prospectus”) to be filed with the United States Securities and Exchange Commission (the “SEC”) and mailed to Haymaker’s stockholders. In addition, Arko will prepare a proxy statement (the “Arko proxy”), to be filed with the Israel Securities Authority (the “ISA”). Haymaker and Arko urge investors and other interested persons to read, when available, the Haymaker proxy statement/prospectus and the Arko proxy, as well as other documents filed with the SEC and the ISA, because these documents will contain important information about the Business Combination. Such persons can also read Haymaker’s Annual Report on Form 10-K for the fiscal year ended December 31, 2019 (the “Haymaker Annual Report”), for a description of the security holdings of its officers and directors and their respective interests as security holders in the consummation of the transactions described herein. The Haymaker proxy statement statement/prospectus, once available, and Haymaker Annual Report can be obtained, without charge, at the SEC’s web site (http://www.sec.gov). Participants in the Solicitation Haymaker, Arko and their respective directors, executive officers and other members of their management and employees, under SEC rules, may be deemed to be participants in the solicitation of proxies of Haymaker stockholders in connection with the Business Combination. Investors and securityholders may obtain more detailed information regarding the names, affiliations and interests of Haymaker’s directors and officers in its Annual Report on Form 10-K for the fiscal year ended December 31, 2019, which was filed with the SEC on March 19, 2020. Information regarding the persons who may, under SEC rules, be deemed participants in the solicitation of proxies to Haymaker’s stockholders in connection with the Business Combination will be set forth in the proxy statement/prospectus for the Business Combination when available. Information concerning the interests of Haymaker’s and Arko’s participants in the solicitation, which may, in some cases, be different than those of Haymaker’s and Arko’s equityholders generally, will be set forth in the proxy statement/prospectus relating to the Business Combination when it becomes available.
3 Disclaimer (cont’d) Forward Looking Statements This Investor Presentation includes “forward-looking statements” within the meaning of the “safe harbor” provisions of the Private Securities Litigation Reform Act of 1995. The expectations, estimates, and projections of the businesses of Haymaker, Arko and GPM may differ from their actual results and consequently, you should not rely on these forward looking statements as predictions of future events. Words such as “expect,” “estimate,” “project,” “budget,” “forecast,” “anticipate,” “intend,” “plan,” “may,” “will,” “could,” “should,” “believes,” “predicts,” “potential,” “continue,” and similar expressions are intended to identify such forward- looking statements. These forward-looking statements include, without limitation, expectations with respect to future performance including projected financial information (which is not audited or reviewed by auditors) and anticipated financial impacts of the proposed transaction, the satisfaction of the closing conditions to the proposed transaction, and the timing of the completion of the proposed transaction. These forward-looking statements involve significant risks and uncertainties that could cause the actual results to differ materially from the expected results. Most of these factors are outside of the control of Haymaker, Arko 3 and GPM, and are difficult to predict. Factors that may cause such differences include, but are not limited to: (1) the occurrence of any event, change or other circumstances that could give rise to the termination of the negotiations and any subsequent definitive agreements with respect to the Business Combination, and the possibility that the terms and conditions set forth in any definitive agreements with respect to the Business Combination may differ materially from the terms and conditions set forth in the term sheet, (2) the outcome of any legal proceedings that may be instituted against the parties following the announcement of the Business Combination and any definitive agreements with respect thereto; (3) the inability to complete the proposed transaction, including due to failure to obtain approval of the stockholders of Haymaker and Arko or other conditions to closing; (4) the impact of the COVID-19 pandemic on (x) the parties' ability to negotiate and consummate the Business Combination and (y) the business of Arko, GPM, and the combined company; (5) the receipt of an unsolicited offer from another party for an alternative business transaction that could interfere with the proposed transaction; (6) the inability to obtain or maintain the listing of the post-acquisition company’s common stock on Nasdaq following the proposed transaction; (7) the risk that the proposed transaction disrupts current plans and operations as a result of the announcement and consummation of the proposed transaction; (8) the ability to recognize the anticipated benefits of the proposed transaction, which may be affected by, among other things, competition, the ability of the combined company to grow and manage growth profitably and retain its key employees; (9) costs related to the proposed transaction; (10) changes in applicable laws or regulations; (11) the demand for GPM’s and the combined company’s services together with the possibility that Arko, GPM or the combined company may be adversely affected by other economic, business, and/or competitive factors; (12) the failure of GPM to consummate any pending acquisitions; (13) risks and uncertainties related to Arko’s business, including, but not limited to, changes in petroleum prices, the impact of competition, environmental risks, restrictions on the sale of alcohol, cigarettes, vaping products, and other tobacco products and increases in their prices, dependency on suppliers, increases in fuel efficiency and demand for alternative fuels for electric vehicles, failure by independent outsider operators to meet their obligations, acquisition and integration risks, and currency exchange and interest rates risks; and (14) other risks and uncertainties included in (x) the “Risk Factors” sections of the most recent Annual Report on Form 10-K and Quarterly Report on Form 10-Q filed with the SEC by Haymaker and (y) other documents filed or to be filed with the SEC by Haymaker and the ISA by Arko. The foregoing list of factors is not exclusive. You should not place undue reliance upon any forward-looking statements, which speak only as of the date made. Haymaker, Arko, and GPM do not undertake or accept any obligation or undertaking to release publicly any updates or revisions to any forward-looking statements to reflect any change in their expectations or any change in events, conditions, or circumstances on which any such statement is based. Industry and Market Data In this Investor Presentation, Arko and GPM rely on and refer to information and statistics regarding market shares in the sectors in which GPM competes and other industry data. Arko and GPM obtained this information and statistics from third-party sources believed to be reliable, including reports by market research firms. Arko and GPM have supplemented this information where necessary with information from its vendors and its own internal estimates, taking into account publicly available information about other industry participants and its management’s best view as to information that is not publicly available. Neither Arko, GPM, nor Haymaker has independently verified the accuracy or completeness of any such third-party information. Use of Non-GAAP Financial Metrics This Investor Presentation includes non-GAAP financial metrics for GPM which do not conform to SEC Regulation S-X in that it includes financial information (such as EBITDA and Adjusted EBITDA) not derived in accordance with U.S. generally accepted accounting principles (“GAAP”). GPM believes that the presentation of non-GAAP metrics provides information that is useful to investors as it indicates more clearly the ability of GPM to meet capital expenditure and working capital requirements and provides an additional tool for investors to use in evaluating ongoing operating results and trends. You should review GPM’s audited and interim financial statements, which will be presented in the Haymaker proxy statement/prospectus (defined under Additional Information and Where to Find It), and not rely on any single financial measure to evaluate its business. Other companies may calculate EBITDA, Adjusted EBITDA and other non-GAAP metrics differently, and therefore GPM’s EBITDA, Adjusted EBITDA and other non-GAAP metrics may not be directly comparable to similarly titled measures of other companies. Adjusted EBITDA is calculated as EBITDA (i) plus acquisition costs, non-cash rent, state franchise taxes, losses on disposals of assets and other non-recurring items, and (ii) less gains on disposals of assets.3 Disclaimer (cont’d) Forward Looking Statements This Investor Presentation includes “forward-looking statements” within the meaning of the “safe harbor” provisions of the Private Securities Litigation Reform Act of 1995. The expectations, estimates, and projections of the businesses of Haymaker, Arko and GPM may differ from their actual results and consequently, you should not rely on these forward looking statements as predictions of future events. Words such as “expect,” “estimate,” “project,” “budget,” “forecast,” “anticipate,” “intend,” “plan,” “may,” “will,” “could,” “should,” “believes,” “predicts,” “potential,” “continue,” and similar expressions are intended to identify such forward- looking statements. These forward-looking statements include, without limitation, expectations with respect to future performance including projected financial information (which is not audited or reviewed by auditors) and anticipated financial impacts of the proposed transaction, the satisfaction of the closing conditions to the proposed transaction, and the timing of the completion of the proposed transaction. These forward-looking statements involve significant risks and uncertainties that could cause the actual results to differ materially from the expected results. Most of these factors are outside of the control of Haymaker, Arko 3 and GPM, and are difficult to predict. Factors that may cause such differences include, but are not limited to: (1) the occurrence of any event, change or other circumstances that could give rise to the termination of the negotiations and any subsequent definitive agreements with respect to the Business Combination, and the possibility that the terms and conditions set forth in any definitive agreements with respect to the Business Combination may differ materially from the terms and conditions set forth in the term sheet, (2) the outcome of any legal proceedings that may be instituted against the parties following the announcement of the Business Combination and any definitive agreements with respect thereto; (3) the inability to complete the proposed transaction, including due to failure to obtain approval of the stockholders of Haymaker and Arko or other conditions to closing; (4) the impact of the COVID-19 pandemic on (x) the parties' ability to negotiate and consummate the Business Combination and (y) the business of Arko, GPM, and the combined company; (5) the receipt of an unsolicited offer from another party for an alternative business transaction that could interfere with the proposed transaction; (6) the inability to obtain or maintain the listing of the post-acquisition company’s common stock on Nasdaq following the proposed transaction; (7) the risk that the proposed transaction disrupts current plans and operations as a result of the announcement and consummation of the proposed transaction; (8) the ability to recognize the anticipated benefits of the proposed transaction, which may be affected by, among other things, competition, the ability of the combined company to grow and manage growth profitably and retain its key employees; (9) costs related to the proposed transaction; (10) changes in applicable laws or regulations; (11) the demand for GPM’s and the combined company’s services together with the possibility that Arko, GPM or the combined company may be adversely affected by other economic, business, and/or competitive factors; (12) the failure of GPM to consummate any pending acquisitions; (13) risks and uncertainties related to Arko’s business, including, but not limited to, changes in petroleum prices, the impact of competition, environmental risks, restrictions on the sale of alcohol, cigarettes, vaping products, and other tobacco products and increases in their prices, dependency on suppliers, increases in fuel efficiency and demand for alternative fuels for electric vehicles, failure by independent outsider operators to meet their obligations, acquisition and integration risks, and currency exchange and interest rates risks; and (14) other risks and uncertainties included in (x) the “Risk Factors” sections of the most recent Annual Report on Form 10-K and Quarterly Report on Form 10-Q filed with the SEC by Haymaker and (y) other documents filed or to be filed with the SEC by Haymaker and the ISA by Arko. The foregoing list of factors is not exclusive. You should not place undue reliance upon any forward-looking statements, which speak only as of the date made. Haymaker, Arko, and GPM do not undertake or accept any obligation or undertaking to release publicly any updates or revisions to any forward-looking statements to reflect any change in their expectations or any change in events, conditions, or circumstances on which any such statement is based. Industry and Market Data In this Investor Presentation, Arko and GPM rely on and refer to information and statistics regarding market shares in the sectors in which GPM competes and other industry data. Arko and GPM obtained this information and statistics from third-party sources believed to be reliable, including reports by market research firms. Arko and GPM have supplemented this information where necessary with information from its vendors and its own internal estimates, taking into account publicly available information about other industry participants and its management’s best view as to information that is not publicly available. Neither Arko, GPM, nor Haymaker has independently verified the accuracy or completeness of any such third-party information. Use of Non-GAAP Financial Metrics This Investor Presentation includes non-GAAP financial metrics for GPM which do not conform to SEC Regulation S-X in that it includes financial information (such as EBITDA and Adjusted EBITDA) not derived in accordance with U.S. generally accepted accounting principles (“GAAP”). GPM believes that the presentation of non-GAAP metrics provides information that is useful to investors as it indicates more clearly the ability of GPM to meet capital expenditure and working capital requirements and provides an additional tool for investors to use in evaluating ongoing operating results and trends. You should review GPM’s audited and interim financial statements, which will be presented in the Haymaker proxy statement/prospectus (defined under Additional Information and Where to Find It), and not rely on any single financial measure to evaluate its business. Other companies may calculate EBITDA, Adjusted EBITDA and other non-GAAP metrics differently, and therefore GPM’s EBITDA, Adjusted EBITDA and other non-GAAP metrics may not be directly comparable to similarly titled measures of other companies. Adjusted EBITDA is calculated as EBITDA (i) plus acquisition costs, non-cash rent, state franchise taxes, losses on disposals of assets and other non-recurring items, and (ii) less gains on disposals of assets.
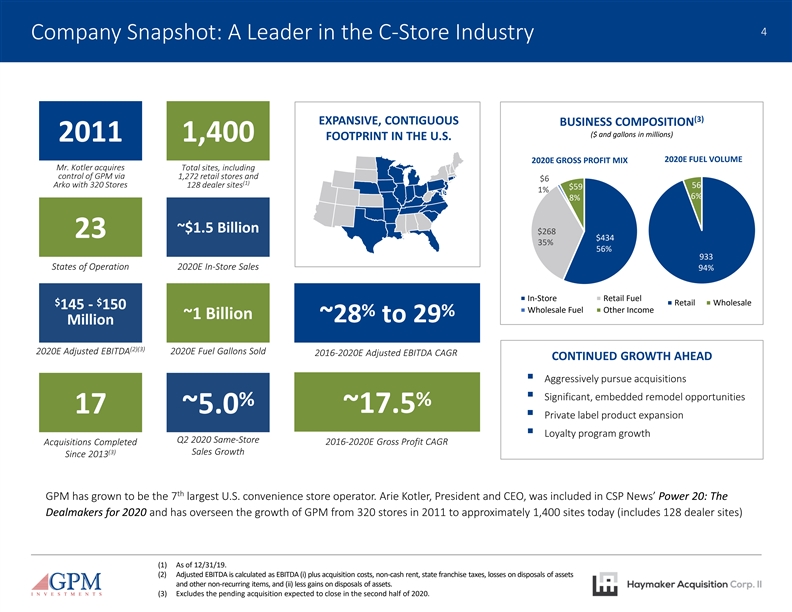
4 Company Snapshot: A Leader in the C-Store Industry (3) EXPANSIVE, CONTIGUOUS BUSINESS COMPOSITION ($ and gallons in millions) FOOTPRINT IN THE U.S. 2011 1,400 2020E FUEL VOLUME 2020E GROSS PROFIT MIX 4 Mr. Kotler acquires Total sites, including control of GPM via 1,272 retail stores and $6 (1) Arko with 320 Stores 128 dealer sites 56 $59 1% 6% 8% ~$1.5 Billion $268 23 $434 35% 56% 933 States of Operation 2020E In-Store Sales 94% In-Store Retail Fuel $ $ Retail Wholesale 145 - 150 Wholesale Fuel Other Income % % ~1 Billion ~28 to 29 Million (2)(3) 2020E Adjusted EBITDA 2020E Fuel Gallons Sold 2016-2020E Adjusted EBITDA CAGR CONTINUED GROWTH AHEAD § Aggressively pursue acquisitions § Significant, embedded remodel opportunities % % ~17.5 17 ~5.0 § Private label product expansion § Loyalty program growth Q2 2020 Same-Store Acquisitions Completed 2016-2020E Gross Profit CAGR (3) Sales Growth Since 2013 th GPM has grown to be the 7 largest U.S. convenience store operator. Arie Kotler, President and CEO, was included in CSP News’ Power 20: The Dealmakers for 2020 and has overseen the growth of GPM from 320 stores in 2011 to approximately 1,400 sites today (includes 128 dealer sites) (1) As of 12/31/19. (2) Adjusted EBITDA is calculated as EBITDA (i) plus acquisition costs, non-cash rent, state franchise taxes, losses on disposals of assets and other non-recurring items, and (ii) less gains on disposals of assets. (3) Excludes the pending acquisition expected to close in the second half of 2020.4 Company Snapshot: A Leader in the C-Store Industry (3) EXPANSIVE, CONTIGUOUS BUSINESS COMPOSITION ($ and gallons in millions) FOOTPRINT IN THE U.S. 2011 1,400 2020E FUEL VOLUME 2020E GROSS PROFIT MIX 4 Mr. Kotler acquires Total sites, including control of GPM via 1,272 retail stores and $6 (1) Arko with 320 Stores 128 dealer sites 56 $59 1% 6% 8% ~$1.5 Billion $268 23 $434 35% 56% 933 States of Operation 2020E In-Store Sales 94% In-Store Retail Fuel $ $ Retail Wholesale 145 - 150 Wholesale Fuel Other Income % % ~1 Billion ~28 to 29 Million (2)(3) 2020E Adjusted EBITDA 2020E Fuel Gallons Sold 2016-2020E Adjusted EBITDA CAGR CONTINUED GROWTH AHEAD § Aggressively pursue acquisitions § Significant, embedded remodel opportunities % % ~17.5 17 ~5.0 § Private label product expansion § Loyalty program growth Q2 2020 Same-Store Acquisitions Completed 2016-2020E Gross Profit CAGR (3) Sales Growth Since 2013 th GPM has grown to be the 7 largest U.S. convenience store operator. Arie Kotler, President and CEO, was included in CSP News’ Power 20: The Dealmakers for 2020 and has overseen the growth of GPM from 320 stores in 2011 to approximately 1,400 sites today (includes 128 dealer sites) (1) As of 12/31/19. (2) Adjusted EBITDA is calculated as EBITDA (i) plus acquisition costs, non-cash rent, state franchise taxes, losses on disposals of assets and other non-recurring items, and (ii) less gains on disposals of assets. (3) Excludes the pending acquisition expected to close in the second half of 2020.
5 Representative Site Photos 55 Representative Site Photos 5
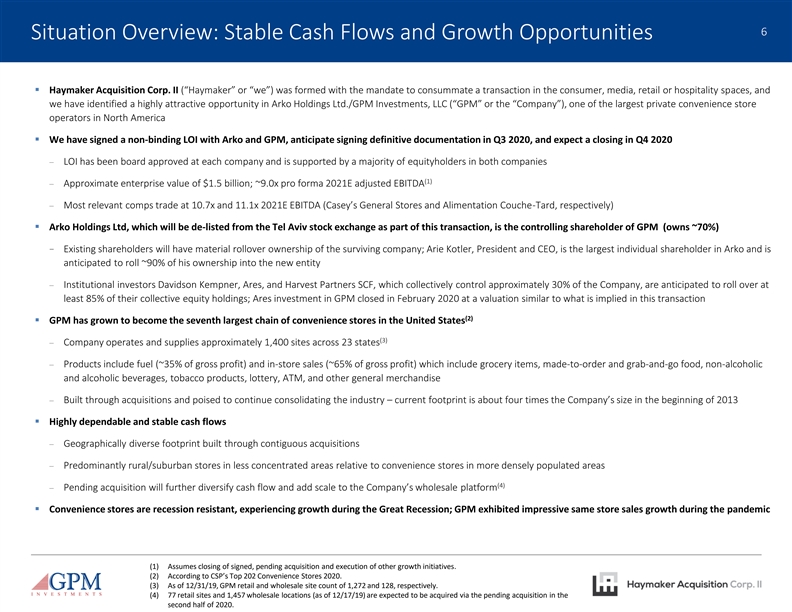
6 Situation Overview: Stable Cash Flows and Growth Opportunities § Haymaker Acquisition Corp. II (“Haymaker” or “we”) was formed with the mandate to consummate a transaction in the consumer, media, retail or hospitality spaces, and we have identified a highly attractive opportunity in Arko Holdings Ltd./GPM Investments, LLC (“GPM” or the “Company”), one of the largest private convenience store operators in North America § We have signed a non-binding LOI with Arko and GPM, anticipate signing definitive documentation in Q3 2020, and expect a closing in Q4 2020 - LOI has been board approved at each company and is supported by a majority of equityholders in both companies 6 (1) - Approximate enterprise value of $1.5 billion; ~9.0x pro forma 2021E adjusted EBITDA - Most relevant comps trade at 10.7x and 11.1x 2021E EBITDA (Casey’s General Stores and Alimentation Couche-Tard, respectively) § Arko Holdings Ltd, which will be de-listed from the Tel Aviv stock exchange as part of this transaction, is the controlling shareholder of GPM (owns ~70%) − Existing shareholders will have material rollover ownership of the surviving company; Arie Kotler, President and CEO, is the largest individual shareholder in Arko and is anticipated to roll ~90% of his ownership into the new entity - Institutional investors Davidson Kempner, Ares, and Harvest Partners SCF, which collectively control approximately 30% of the Company, are anticipated to roll over at least 85% of their collective equity holdings; Ares investment in GPM closed in February 2020 at a valuation similar to what is implied in this transaction (2) § GPM has grown to become the seventh largest chain of convenience stores in the United States (3) - Company operates and supplies approximately 1,400 sites across 23 states - Products include fuel (~35% of gross profit) and in-store sales (~65% of gross profit) which include grocery items, made-to-order and grab-and-go food, non-alcoholic and alcoholic beverages, tobacco products, lottery, ATM, and other general merchandise - Built through acquisitions and poised to continue consolidating the industry – current footprint is about four times the Company’s size in the beginning of 2013 § Highly dependable and stable cash flows - Geographically diverse footprint built through contiguous acquisitions - Predominantly rural/suburban stores in less concentrated areas relative to convenience stores in more densely populated areas (4) - Pending acquisition will further diversify cash flow and add scale to the Company’s wholesale platform § Convenience stores are recession resistant, experiencing growth during the Great Recession; GPM exhibited impressive same store sales growth during the pandemic (1) Assumes closing of signed, pending acquisition and execution of other growth initiatives. (2) According to CSP’s Top 202 Convenience Stores 2020. (3) As of 12/31/19, GPM retail and wholesale site count of 1,272 and 128, respectively. (4) 77 retail sites and 1,457 wholesale locations (as of 12/17/19) are expected to be acquired via the pending acquisition in the second half of 2020.6 Situation Overview: Stable Cash Flows and Growth Opportunities § Haymaker Acquisition Corp. II (“Haymaker” or “we”) was formed with the mandate to consummate a transaction in the consumer, media, retail or hospitality spaces, and we have identified a highly attractive opportunity in Arko Holdings Ltd./GPM Investments, LLC (“GPM” or the “Company”), one of the largest private convenience store operators in North America § We have signed a non-binding LOI with Arko and GPM, anticipate signing definitive documentation in Q3 2020, and expect a closing in Q4 2020 - LOI has been board approved at each company and is supported by a majority of equityholders in both companies 6 (1) - Approximate enterprise value of $1.5 billion; ~9.0x pro forma 2021E adjusted EBITDA - Most relevant comps trade at 10.7x and 11.1x 2021E EBITDA (Casey’s General Stores and Alimentation Couche-Tard, respectively) § Arko Holdings Ltd, which will be de-listed from the Tel Aviv stock exchange as part of this transaction, is the controlling shareholder of GPM (owns ~70%) − Existing shareholders will have material rollover ownership of the surviving company; Arie Kotler, President and CEO, is the largest individual shareholder in Arko and is anticipated to roll ~90% of his ownership into the new entity - Institutional investors Davidson Kempner, Ares, and Harvest Partners SCF, which collectively control approximately 30% of the Company, are anticipated to roll over at least 85% of their collective equity holdings; Ares investment in GPM closed in February 2020 at a valuation similar to what is implied in this transaction (2) § GPM has grown to become the seventh largest chain of convenience stores in the United States (3) - Company operates and supplies approximately 1,400 sites across 23 states - Products include fuel (~35% of gross profit) and in-store sales (~65% of gross profit) which include grocery items, made-to-order and grab-and-go food, non-alcoholic and alcoholic beverages, tobacco products, lottery, ATM, and other general merchandise - Built through acquisitions and poised to continue consolidating the industry – current footprint is about four times the Company’s size in the beginning of 2013 § Highly dependable and stable cash flows - Geographically diverse footprint built through contiguous acquisitions - Predominantly rural/suburban stores in less concentrated areas relative to convenience stores in more densely populated areas (4) - Pending acquisition will further diversify cash flow and add scale to the Company’s wholesale platform § Convenience stores are recession resistant, experiencing growth during the Great Recession; GPM exhibited impressive same store sales growth during the pandemic (1) Assumes closing of signed, pending acquisition and execution of other growth initiatives. (2) According to CSP’s Top 202 Convenience Stores 2020. (3) As of 12/31/19, GPM retail and wholesale site count of 1,272 and 128, respectively. (4) 77 retail sites and 1,457 wholesale locations (as of 12/17/19) are expected to be acquired via the pending acquisition in the second half of 2020.
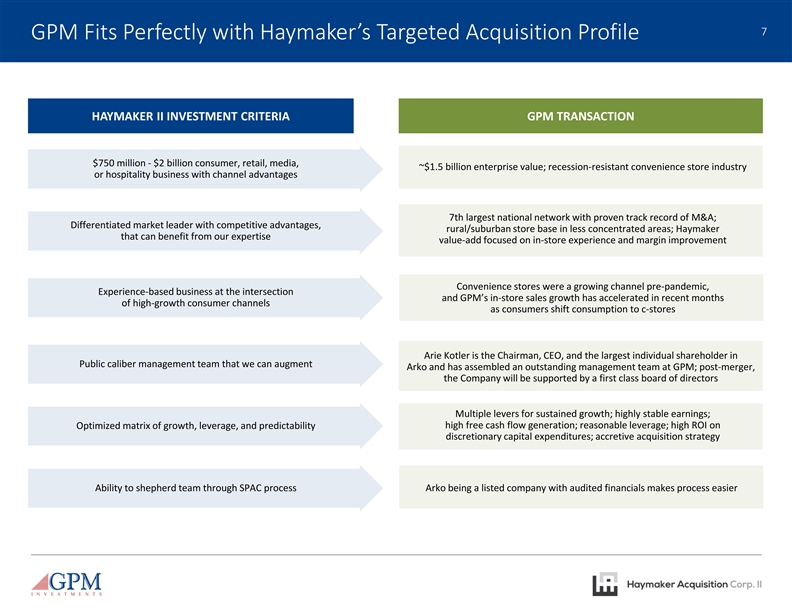
7 GPM Fits Perfectly with Haymaker’s Targeted Acquisition Profile HAYMAKER II INVESTMENT CRITERIA GPM TRANSACTION $750 million - $2 billion consumer, retail, media, 7 ~$1.5 billion enterprise value; recession-resistant convenience store industry or hospitality business with channel advantages 7th largest national network with proven track record of M&A; Differentiated market leader with competitive advantages, rural/suburban store base in less concentrated areas; Haymaker that can benefit from our expertise value-add focused on in-store experience and margin improvement Convenience stores were a growing channel pre-pandemic, Experience-based business at the intersection and GPM’s in-store sales growth has accelerated in recent months of high-growth consumer channels as consumers shift consumption to c-stores Arie Kotler is the Chairman, CEO, and the largest individual shareholder in Public caliber management team that we can augment Arko and has assembled an outstanding management team at GPM; post-merger, the Company will be supported by a first class board of directors Multiple levers for sustained growth; highly stable earnings; high free cash flow generation; reasonable leverage; high ROI on Optimized matrix of growth, leverage, and predictability discretionary capital expenditures; accretive acquisition strategy Ability to shepherd team through SPAC process Arko being a listed company with audited financials makes process easier7 GPM Fits Perfectly with Haymaker’s Targeted Acquisition Profile HAYMAKER II INVESTMENT CRITERIA GPM TRANSACTION $750 million - $2 billion consumer, retail, media, 7 ~$1.5 billion enterprise value; recession-resistant convenience store industry or hospitality business with channel advantages 7th largest national network with proven track record of M&A; Differentiated market leader with competitive advantages, rural/suburban store base in less concentrated areas; Haymaker that can benefit from our expertise value-add focused on in-store experience and margin improvement Convenience stores were a growing channel pre-pandemic, Experience-based business at the intersection and GPM’s in-store sales growth has accelerated in recent months of high-growth consumer channels as consumers shift consumption to c-stores Arie Kotler is the Chairman, CEO, and the largest individual shareholder in Public caliber management team that we can augment Arko and has assembled an outstanding management team at GPM; post-merger, the Company will be supported by a first class board of directors Multiple levers for sustained growth; highly stable earnings; high free cash flow generation; reasonable leverage; high ROI on Optimized matrix of growth, leverage, and predictability discretionary capital expenditures; accretive acquisition strategy Ability to shepherd team through SPAC process Arko being a listed company with audited financials makes process easier
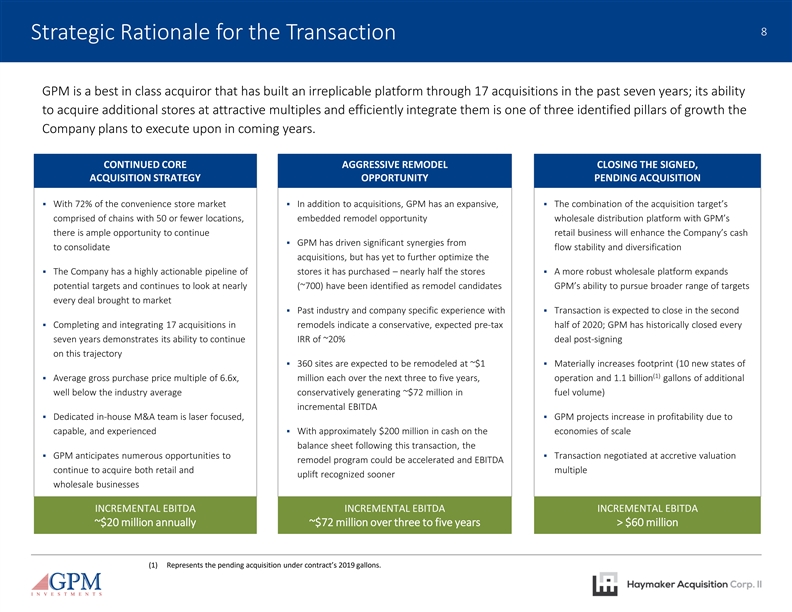
8 Strategic Rationale for the Transaction GPM is a best in class acquiror that has built an irreplicable platform through 17 acquisitions in the past seven years; its ability to acquire additional stores at attractive multiples and efficiently integrate them is one of three identified pillars of growth the Company plans to execute upon in coming years. 8 CONTINUED CORE AGGRESSIVE REMODEL CLOSING THE SIGNED, ACQUISITION STRATEGY OPPORTUNITY PENDING ACQUISITION § With 72% of the convenience store market § In addition to acquisitions, GPM has an expansive, § The combination of the acquisition target’s comprised of chains with 50 or fewer locations, embedded remodel opportunity wholesale distribution platform with GPM’s there is ample opportunity to continue retail business will enhance the Company’s cash § GPM has driven significant synergies from to consolidate flow stability and diversification acquisitions, but has yet to further optimize the § The Company has a highly actionable pipeline of stores it has purchased – nearly half the stores § A more robust wholesale platform expands potential targets and continues to look at nearly (~700) have been identified as remodel candidates GPM’s ability to pursue broader range of targets every deal brought to market § Past industry and company specific experience with § Transaction is expected to close in the second § Completing and integrating 17 acquisitions in remodels indicate a conservative, expected pre-tax half of 2020; GPM has historically closed every seven years demonstrates its ability to continue IRR of ~20% deal post-signing on this trajectory § 360 sites are expected to be remodeled at ~$1 § Materially increases footprint (10 new states of (1) § Average gross purchase price multiple of 6.6x, million each over the next three to five years, operation and 1.1 billion gallons of additional well below the industry average conservatively generating ~$72 million in fuel volume) incremental EBITDA § Dedicated in-house M&A team is laser focused, § GPM projects increase in profitability due to capable, and experienced§ With approximately $200 million in cash on the economies of scale balance sheet following this transaction, the § GPM anticipates numerous opportunities to § Transaction negotiated at accretive valuation remodel program could be accelerated and EBITDA continue to acquire both retail and multiple uplift recognized sooner wholesale businesses INCREMENTAL EBITDA INCREMENTAL EBITDA INCREMENTAL EBITDA ~$20 million annually ~$72 million over three to five years > $60 million (1) Represents the pending acquisition under contract’s 2019 gallons.8 Strategic Rationale for the Transaction GPM is a best in class acquiror that has built an irreplicable platform through 17 acquisitions in the past seven years; its ability to acquire additional stores at attractive multiples and efficiently integrate them is one of three identified pillars of growth the Company plans to execute upon in coming years. 8 CONTINUED CORE AGGRESSIVE REMODEL CLOSING THE SIGNED, ACQUISITION STRATEGY OPPORTUNITY PENDING ACQUISITION § With 72% of the convenience store market § In addition to acquisitions, GPM has an expansive, § The combination of the acquisition target’s comprised of chains with 50 or fewer locations, embedded remodel opportunity wholesale distribution platform with GPM’s there is ample opportunity to continue retail business will enhance the Company’s cash § GPM has driven significant synergies from to consolidate flow stability and diversification acquisitions, but has yet to further optimize the § The Company has a highly actionable pipeline of stores it has purchased – nearly half the stores § A more robust wholesale platform expands potential targets and continues to look at nearly (~700) have been identified as remodel candidates GPM’s ability to pursue broader range of targets every deal brought to market § Past industry and company specific experience with § Transaction is expected to close in the second § Completing and integrating 17 acquisitions in remodels indicate a conservative, expected pre-tax half of 2020; GPM has historically closed every seven years demonstrates its ability to continue IRR of ~20% deal post-signing on this trajectory § 360 sites are expected to be remodeled at ~$1 § Materially increases footprint (10 new states of (1) § Average gross purchase price multiple of 6.6x, million each over the next three to five years, operation and 1.1 billion gallons of additional well below the industry average conservatively generating ~$72 million in fuel volume) incremental EBITDA § Dedicated in-house M&A team is laser focused, § GPM projects increase in profitability due to capable, and experienced§ With approximately $200 million in cash on the economies of scale balance sheet following this transaction, the § GPM anticipates numerous opportunities to § Transaction negotiated at accretive valuation remodel program could be accelerated and EBITDA continue to acquire both retail and multiple uplift recognized sooner wholesale businesses INCREMENTAL EBITDA INCREMENTAL EBITDA INCREMENTAL EBITDA ~$20 million annually ~$72 million over three to five years > $60 million (1) Represents the pending acquisition under contract’s 2019 gallons.
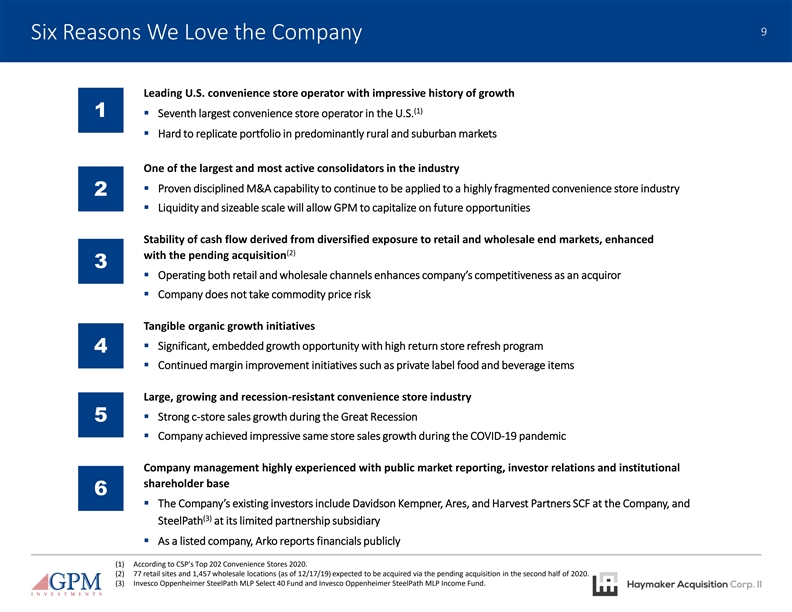
9 Six Reasons We Love the Company Leading U.S. convenience store operator with impressive history of growth (1) 1§ Seventh largest convenience store operator in the U.S. § Hard to replicate portfolio in predominantly rural and suburban markets 9 One of the largest and most active consolidators in the industry § Proven disciplined M&A capability to continue to be applied to a highly fragmented convenience store industry 2 § Liquidity and sizeable scale will allow GPM to capitalize on future opportunities Stability of cash flow derived from diversified exposure to retail and wholesale end markets, enhanced (2) with the pending acquisition 3 § Operating both retail and wholesale channels enhances company’s competitiveness as an acquiror § Company does not take commodity price risk Tangible organic growth initiatives § Significant, embedded growth opportunity with high return store refresh program 4 § Continued margin improvement initiatives such as private label food and beverage items Large, growing and recession-resistant convenience store industry § Strong c-store sales growth during the Great Recession 5 § Company achieved impressive same store sales growth during the COVID-19 pandemic Company management highly experienced with public market reporting, investor relations and institutional shareholder base 6 § The Company’s existing investors include Davidson Kempner, Ares, and Harvest Partners SCF at the Company, and (3) SteelPath at its limited partnership subsidiary § As a listed company, Arko reports financials publicly (1) According to CSP’s Top 202 Convenience Stores 2020. (2) 77 retail sites and 1,457 wholesale locations (as of 12/17/19) expected to be acquired via the pending acquisition in the second half of 2020. (3) Invesco Oppenheimer SteelPath MLP Select 40 Fund and Invesco Oppenheimer SteelPath MLP Income Fund.9 Six Reasons We Love the Company Leading U.S. convenience store operator with impressive history of growth (1) 1§ Seventh largest convenience store operator in the U.S. § Hard to replicate portfolio in predominantly rural and suburban markets 9 One of the largest and most active consolidators in the industry § Proven disciplined M&A capability to continue to be applied to a highly fragmented convenience store industry 2 § Liquidity and sizeable scale will allow GPM to capitalize on future opportunities Stability of cash flow derived from diversified exposure to retail and wholesale end markets, enhanced (2) with the pending acquisition 3 § Operating both retail and wholesale channels enhances company’s competitiveness as an acquiror § Company does not take commodity price risk Tangible organic growth initiatives § Significant, embedded growth opportunity with high return store refresh program 4 § Continued margin improvement initiatives such as private label food and beverage items Large, growing and recession-resistant convenience store industry § Strong c-store sales growth during the Great Recession 5 § Company achieved impressive same store sales growth during the COVID-19 pandemic Company management highly experienced with public market reporting, investor relations and institutional shareholder base 6 § The Company’s existing investors include Davidson Kempner, Ares, and Harvest Partners SCF at the Company, and (3) SteelPath at its limited partnership subsidiary § As a listed company, Arko reports financials publicly (1) According to CSP’s Top 202 Convenience Stores 2020. (2) 77 retail sites and 1,457 wholesale locations (as of 12/17/19) expected to be acquired via the pending acquisition in the second half of 2020. (3) Invesco Oppenheimer SteelPath MLP Select 40 Fund and Invesco Oppenheimer SteelPath MLP Income Fund.
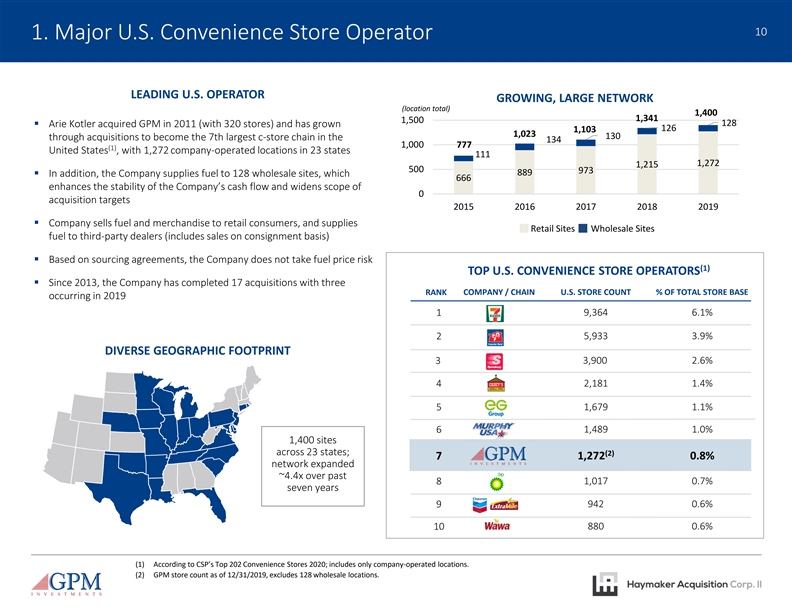
10 1. Major U.S. Convenience Store Operator LEADING U.S. OPERATOR GROWING, LARGE NETWORK (location total) 1,400 1,341 1,500 128 § Arie Kotler acquired GPM in 2011 (with 320 stores) and has grown 126 1,103 1,023 130 through acquisitions to become the 7th largest c-store chain in the 134 1,000 777 (1) United States , with 1,272 company-operated locations in 23 states 111 10 1,272 1,215 500 973 889 § In addition, the Company supplies fuel to 128 wholesale sites, which 666 enhances the stability of the Company’s cash flow and widens scope of 0 acquisition targets 2015 2016 2017 2018 2019 § Company sells fuel and merchandise to retail consumers, and supplies Retail Sites Wholesale Sites fuel to third-party dealers (includes sales on consignment basis) § Based on sourcing agreements, the Company does not take fuel price risk (1) TOP U.S. CONVENIENCE STORE OPERATORS § Since 2013, the Company has completed 17 acquisitions with three RANK COMPANY / CHAIN U.S. STORE COUNT % OF TOTAL STORE BASE occurring in 2019 1 9,364 6.1% 2 5,933 3.9% DIVERSE GEOGRAPHIC FOOTPRINT 3 3,900 2.6% 4 2,181 1.4% 5 1,679 1.1% 6 1,489 1.0% 1,400 sites across 23 states; (2) 1,272 0.8% 7 network expanded ~4.4x over past 1,017 0.7% 8 seven years 9 942 0.6% 10 880 0.6% (1) According to CSP’s Top 202 Convenience Stores 2020; includes only company-operated locations. (2) GPM store count as of 12/31/2019, excludes 128 wholesale locations.10 1. Major U.S. Convenience Store Operator LEADING U.S. OPERATOR GROWING, LARGE NETWORK (location total) 1,400 1,341 1,500 128 § Arie Kotler acquired GPM in 2011 (with 320 stores) and has grown 126 1,103 1,023 130 through acquisitions to become the 7th largest c-store chain in the 134 1,000 777 (1) United States , with 1,272 company-operated locations in 23 states 111 10 1,272 1,215 500 973 889 § In addition, the Company supplies fuel to 128 wholesale sites, which 666 enhances the stability of the Company’s cash flow and widens scope of 0 acquisition targets 2015 2016 2017 2018 2019 § Company sells fuel and merchandise to retail consumers, and supplies Retail Sites Wholesale Sites fuel to third-party dealers (includes sales on consignment basis) § Based on sourcing agreements, the Company does not take fuel price risk (1) TOP U.S. CONVENIENCE STORE OPERATORS § Since 2013, the Company has completed 17 acquisitions with three RANK COMPANY / CHAIN U.S. STORE COUNT % OF TOTAL STORE BASE occurring in 2019 1 9,364 6.1% 2 5,933 3.9% DIVERSE GEOGRAPHIC FOOTPRINT 3 3,900 2.6% 4 2,181 1.4% 5 1,679 1.1% 6 1,489 1.0% 1,400 sites across 23 states; (2) 1,272 0.8% 7 network expanded ~4.4x over past 1,017 0.7% 8 seven years 9 942 0.6% 10 880 0.6% (1) According to CSP’s Top 202 Convenience Stores 2020; includes only company-operated locations. (2) GPM store count as of 12/31/2019, excludes 128 wholesale locations.
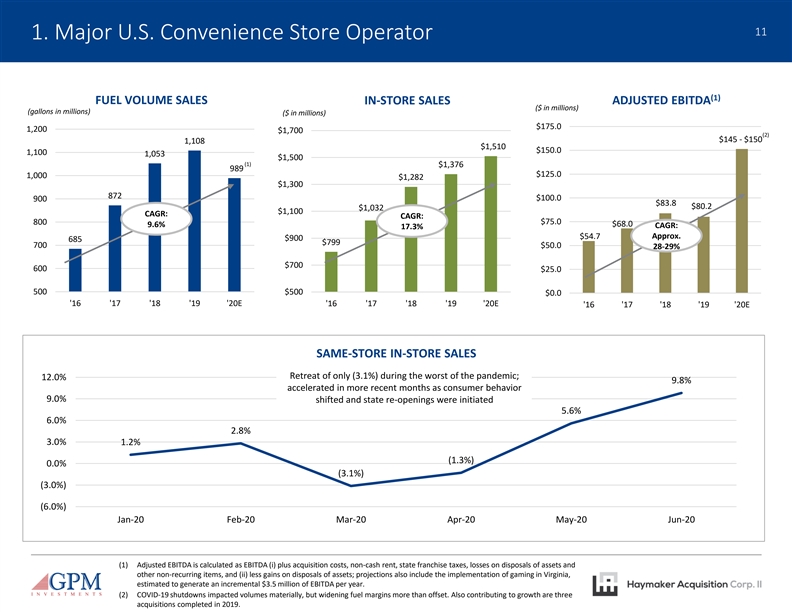
11 1. Major U.S. Convenience Store Operator (1) FUEL VOLUME SALES IN-STORE SALES ADJUSTED EBITDA ($ in millions) (gallons in millions) ($ in millions) $175.0 1,200 $1,700 (2) $145 - $150 1,108 $1,510 $150.0 1,100 1,053 $1,500 (1) 11 $1,376 989 $125.0 1,000 $1,282 $1,300 872 $100.0 900 $83.8 $80.2 $1,032 $1,100 CAGR: CAGR: $75.0 800 9.6% $68.0 CAGR: 17.3% $54.7 Approx. $900 685 $799 700 $50.0 28-29% $700 600 $25.0 500 $500 $0.0 '16 '17 '18 '19 '20E '16 '17 '18 '19 '20E '16 '17 '18 '19 '20E SAME-STORE IN-STORE SALES Retreat of only (3.1%) during the worst of the pandemic; 12.0% 9.8% accelerated in more recent months as consumer behavior 9.0% shifted and state re-openings were initiated 5.6% 6.0% 2.8% 3.0% 1.2% (1.3%) 0.0% (3.1%) (3.0%) (6.0%) Jan-20 Feb-20 Mar-20 Apr-20 May-20 Jun-20 (1) Adjusted EBITDA is calculated as EBITDA (i) plus acquisition costs, non-cash rent, state franchise taxes, losses on disposals of assets and other non-recurring items, and (ii) less gains on disposals of assets; projections also include the implementation of gaming in Virginia, estimated to generate an incremental $3.5 million of EBITDA per year. (2) COVID-19 shutdowns impacted volumes materially, but widening fuel margins more than offset. Also contributing to growth are three acquisitions completed in 2019.11 1. Major U.S. Convenience Store Operator (1) FUEL VOLUME SALES IN-STORE SALES ADJUSTED EBITDA ($ in millions) (gallons in millions) ($ in millions) $175.0 1,200 $1,700 (2) $145 - $150 1,108 $1,510 $150.0 1,100 1,053 $1,500 (1) 11 $1,376 989 $125.0 1,000 $1,282 $1,300 872 $100.0 900 $83.8 $80.2 $1,032 $1,100 CAGR: CAGR: $75.0 800 9.6% $68.0 CAGR: 17.3% $54.7 Approx. $900 685 $799 700 $50.0 28-29% $700 600 $25.0 500 $500 $0.0 '16 '17 '18 '19 '20E '16 '17 '18 '19 '20E '16 '17 '18 '19 '20E SAME-STORE IN-STORE SALES Retreat of only (3.1%) during the worst of the pandemic; 12.0% 9.8% accelerated in more recent months as consumer behavior 9.0% shifted and state re-openings were initiated 5.6% 6.0% 2.8% 3.0% 1.2% (1.3%) 0.0% (3.1%) (3.0%) (6.0%) Jan-20 Feb-20 Mar-20 Apr-20 May-20 Jun-20 (1) Adjusted EBITDA is calculated as EBITDA (i) plus acquisition costs, non-cash rent, state franchise taxes, losses on disposals of assets and other non-recurring items, and (ii) less gains on disposals of assets; projections also include the implementation of gaming in Virginia, estimated to generate an incremental $3.5 million of EBITDA per year. (2) COVID-19 shutdowns impacted volumes materially, but widening fuel margins more than offset. Also contributing to growth are three acquisitions completed in 2019.
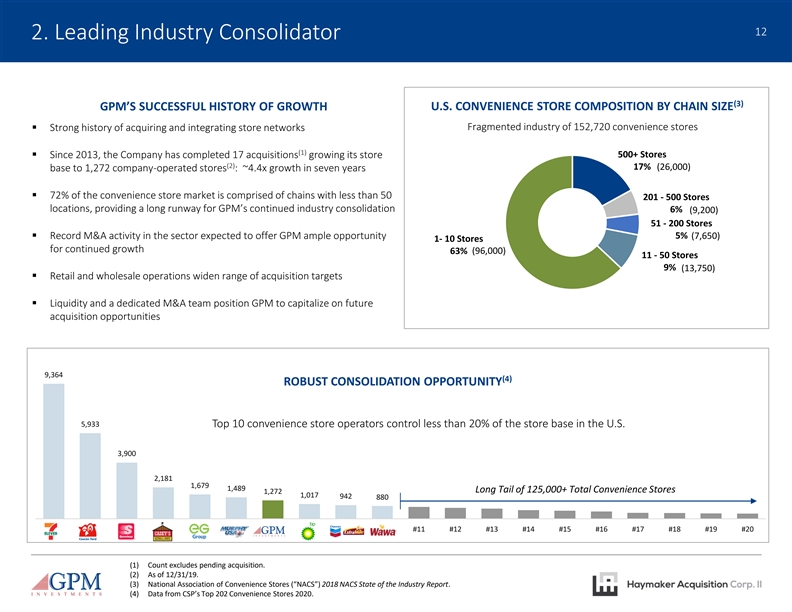
12 2. Leading Industry Consolidator (3) U.S. CONVENIENCE STORE COMPOSITION BY CHAIN SIZE GPM’S SUCCESSFUL HISTORY OF GROWTH Fragmented industry of 152,720 convenience stores § Strong history of acquiring and integrating store networks (1) § Since 2013, the Company has completed 17 acquisitions growing its store 500+ Stores 12 (2) 17% (26,000) base to 1,272 company-operated stores : ~4.4x growth in seven years § 72% of the convenience store market is comprised of chains with less than 50 201 - 500 Stores locations, providing a long runway for GPM’s continued industry consolidation 6% (9,200) 51 - 200 Stores § Record M&A activity in the sector expected to offer GPM ample opportunity 5% (7,650) 1- 10 Stores for continued growth 63% (96,000) 11 - 50 Stores 9% (13,750) § Retail and wholesale operations widen range of acquisition targets § Liquidity and a dedicated M&A team position GPM to capitalize on future acquisition opportunities 9,364 (4) ROBUST CONSOLIDATION OPPORTUNITY 5,933 Top 10 convenience store operators control less than 20% of the store base in the U.S. 3,900 2,181 1,679 1,489 Long Tail of 125,000+ Total Convenience Stores 1,272 1,017 942 880 #11 #12 #13 #14 #15 #16 #17 #18 #19 #20 (1) Count excludes pending acquisition. (2) As of 12/31/19. (3) National Association of Convenience Stores (“NACS”) 2018 NACS State of the Industry Report. (4) Data from CSP’s Top 202 Convenience Stores 2020.12 2. Leading Industry Consolidator (3) U.S. CONVENIENCE STORE COMPOSITION BY CHAIN SIZE GPM’S SUCCESSFUL HISTORY OF GROWTH Fragmented industry of 152,720 convenience stores § Strong history of acquiring and integrating store networks (1) § Since 2013, the Company has completed 17 acquisitions growing its store 500+ Stores 12 (2) 17% (26,000) base to 1,272 company-operated stores : ~4.4x growth in seven years § 72% of the convenience store market is comprised of chains with less than 50 201 - 500 Stores locations, providing a long runway for GPM’s continued industry consolidation 6% (9,200) 51 - 200 Stores § Record M&A activity in the sector expected to offer GPM ample opportunity 5% (7,650) 1- 10 Stores for continued growth 63% (96,000) 11 - 50 Stores 9% (13,750) § Retail and wholesale operations widen range of acquisition targets § Liquidity and a dedicated M&A team position GPM to capitalize on future acquisition opportunities 9,364 (4) ROBUST CONSOLIDATION OPPORTUNITY 5,933 Top 10 convenience store operators control less than 20% of the store base in the U.S. 3,900 2,181 1,679 1,489 Long Tail of 125,000+ Total Convenience Stores 1,272 1,017 942 880 #11 #12 #13 #14 #15 #16 #17 #18 #19 #20 (1) Count excludes pending acquisition. (2) As of 12/31/19. (3) National Association of Convenience Stores (“NACS”) 2018 NACS State of the Industry Report. (4) Data from CSP’s Top 202 Convenience Stores 2020.
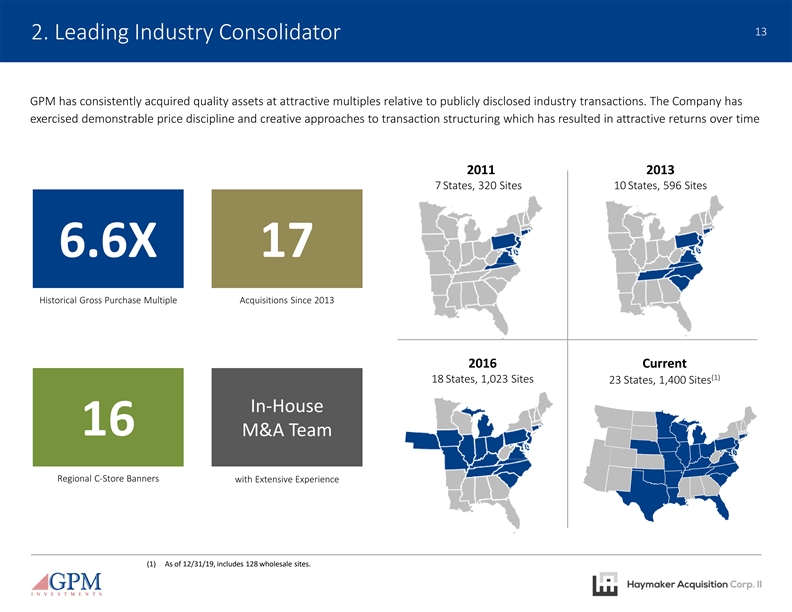
13 2. Leading Industry Consolidator GPM has consistently acquired quality assets at attractive multiples relative to publicly disclosed industry transactions. The Company has exercised demonstrable price discipline and creative approaches to transaction structuring which has resulted in attractive returns over time 13 2011 2013 7 States, 320 Sites 10 States, 596 Sites 6.6X 17 Historical Gross Purchase Multiple Acquisitions Since 2013 2016 Current (1) 18 States, 1,023 Sites 23 States, 1,400 Sites In-House 16 M&A Team Regional C-Store Banners with Extensive Experience (1) As of 12/31/19, includes 128 wholesale sites.13 2. Leading Industry Consolidator GPM has consistently acquired quality assets at attractive multiples relative to publicly disclosed industry transactions. The Company has exercised demonstrable price discipline and creative approaches to transaction structuring which has resulted in attractive returns over time 13 2011 2013 7 States, 320 Sites 10 States, 596 Sites 6.6X 17 Historical Gross Purchase Multiple Acquisitions Since 2013 2016 Current (1) 18 States, 1,023 Sites 23 States, 1,400 Sites In-House 16 M&A Team Regional C-Store Banners with Extensive Experience (1) As of 12/31/19, includes 128 wholesale sites.
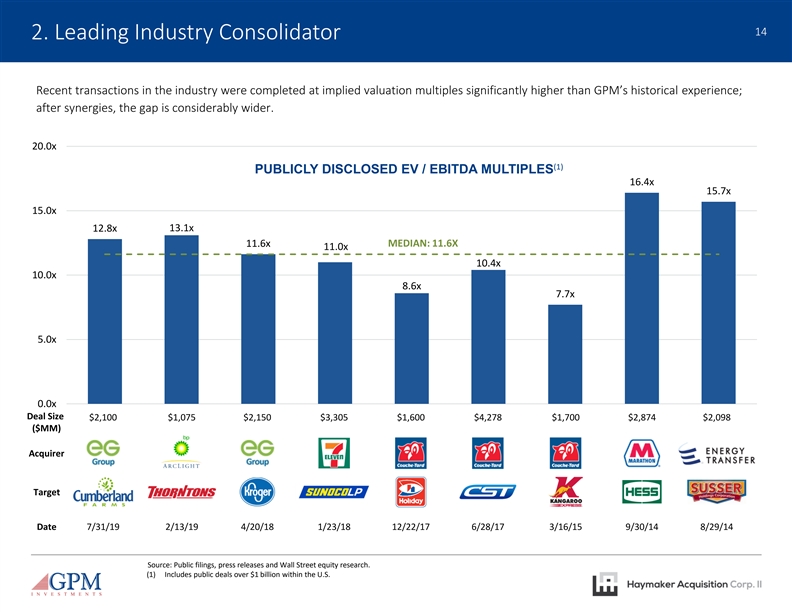
14 2. Leading Industry Consolidator Recent transactions in the industry were completed at implied valuation multiples significantly higher than GPM’s historical experience; after synergies, the gap is considerably wider. 20.0x 14 (1) PUBLICLY DISCLOSED EV / EBITDA MULTIPLES 16.4x 15.7x 15.0x 13.1x 12.8x 11.6x MEDIAN: 11.6X 11.0x 10.4x 10.0x 8.6x 7.7x 5.0x 0.0x Deal Size $2,100 $1,075 $2,150 $3,305 $1,600 $4,278 $1,700 $2,874 $2,098 ($MM) Acquirer Target Date 7/31/19 2/13/19 4/20/18 1/23/18 12/22/17 6/28/17 3/16/15 9/30/14 8/29/14 Source: Public filings, press releases and Wall Street equity research. (1) Includes public deals over $1 billion within the U.S.14 2. Leading Industry Consolidator Recent transactions in the industry were completed at implied valuation multiples significantly higher than GPM’s historical experience; after synergies, the gap is considerably wider. 20.0x 14 (1) PUBLICLY DISCLOSED EV / EBITDA MULTIPLES 16.4x 15.7x 15.0x 13.1x 12.8x 11.6x MEDIAN: 11.6X 11.0x 10.4x 10.0x 8.6x 7.7x 5.0x 0.0x Deal Size $2,100 $1,075 $2,150 $3,305 $1,600 $4,278 $1,700 $2,874 $2,098 ($MM) Acquirer Target Date 7/31/19 2/13/19 4/20/18 1/23/18 12/22/17 6/28/17 3/16/15 9/30/14 8/29/14 Source: Public filings, press releases and Wall Street equity research. (1) Includes public deals over $1 billion within the U.S.
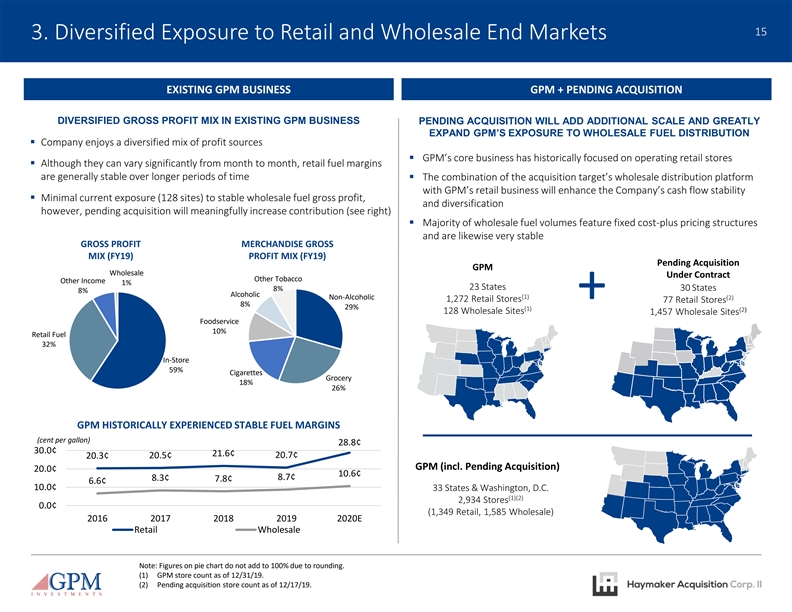
15 3. Diversified Exposure to Retail and Wholesale End Markets EXISTING GPM BUSINESS GPM + PENDING ACQUISITION DIVERSIFIED GROSS PROFIT MIX IN EXISTING GPM BUSINESS PENDING ACQUISITION WILL ADD ADDITIONAL SCALE AND GREATLY EXPAND GPM’S EXPOSURE TO WHOLESALE FUEL DISTRIBUTION § Company enjoys a diversified mix of profit sources § GPM’s core business has historically focused on operating retail stores 15 § Although they can vary significantly from month to month, retail fuel margins are generally stable over longer periods of time § The combination of the acquisition target’s wholesale distribution platform with GPM’s retail business will enhance the Company’s cash flow stability § Minimal current exposure (128 sites) to stable wholesale fuel gross profit, and diversification however, pending acquisition will meaningfully increase contribution (see right) § Majority of wholesale fuel volumes feature fixed cost-plus pricing structures and are likewise very stable GROSS PROFIT MERCHANDISE GROSS MIX (FY19) PROFIT MIX (FY19) Pending Acquisition GPM Wholesale Under Contract Other Tobacco Other Income 1% 23 States 8% 30 States 8% Alcoholic (1) Non-Alcoholic (2) 1,272 Retail Stores + 77 Retail Stores 8% 29% (1) (2) 128 Wholesale Sites 1,457 Wholesale Sites Foodservice 10% Retail Fuel 32% In-Store 59% Cigarettes Grocery 18% 26% GPM HISTORICALLY EXPERIENCED STABLE FUEL MARGINS (cent per gallon) 28.8¢ 30.0¢ 21.6¢ 20.5¢ 20.7¢ 20.3¢ GPM (incl. Pending Acquisition) 20.0¢ 10.6¢ 8.7¢ 8.3¢ 7.8¢ 6.6¢ 10.0¢ 33 States & Washington, D.C. (1)(2) 2,934 Stores 0.0¢ (1,349 Retail, 1,585 Wholesale) 2016 2017 2018 2019 2020E Retail Wholesale Note: Figures on pie chart do not add to 100% due to rounding. (1) GPM store count as of 12/31/19. (2) Pending acquisition store count as of 12/17/19.15 3. Diversified Exposure to Retail and Wholesale End Markets EXISTING GPM BUSINESS GPM + PENDING ACQUISITION DIVERSIFIED GROSS PROFIT MIX IN EXISTING GPM BUSINESS PENDING ACQUISITION WILL ADD ADDITIONAL SCALE AND GREATLY EXPAND GPM’S EXPOSURE TO WHOLESALE FUEL DISTRIBUTION § Company enjoys a diversified mix of profit sources § GPM’s core business has historically focused on operating retail stores 15 § Although they can vary significantly from month to month, retail fuel margins are generally stable over longer periods of time § The combination of the acquisition target’s wholesale distribution platform with GPM’s retail business will enhance the Company’s cash flow stability § Minimal current exposure (128 sites) to stable wholesale fuel gross profit, and diversification however, pending acquisition will meaningfully increase contribution (see right) § Majority of wholesale fuel volumes feature fixed cost-plus pricing structures and are likewise very stable GROSS PROFIT MERCHANDISE GROSS MIX (FY19) PROFIT MIX (FY19) Pending Acquisition GPM Wholesale Under Contract Other Tobacco Other Income 1% 23 States 8% 30 States 8% Alcoholic (1) Non-Alcoholic (2) 1,272 Retail Stores + 77 Retail Stores 8% 29% (1) (2) 128 Wholesale Sites 1,457 Wholesale Sites Foodservice 10% Retail Fuel 32% In-Store 59% Cigarettes Grocery 18% 26% GPM HISTORICALLY EXPERIENCED STABLE FUEL MARGINS (cent per gallon) 28.8¢ 30.0¢ 21.6¢ 20.5¢ 20.7¢ 20.3¢ GPM (incl. Pending Acquisition) 20.0¢ 10.6¢ 8.7¢ 8.3¢ 7.8¢ 6.6¢ 10.0¢ 33 States & Washington, D.C. (1)(2) 2,934 Stores 0.0¢ (1,349 Retail, 1,585 Wholesale) 2016 2017 2018 2019 2020E Retail Wholesale Note: Figures on pie chart do not add to 100% due to rounding. (1) GPM store count as of 12/31/19. (2) Pending acquisition store count as of 12/17/19.
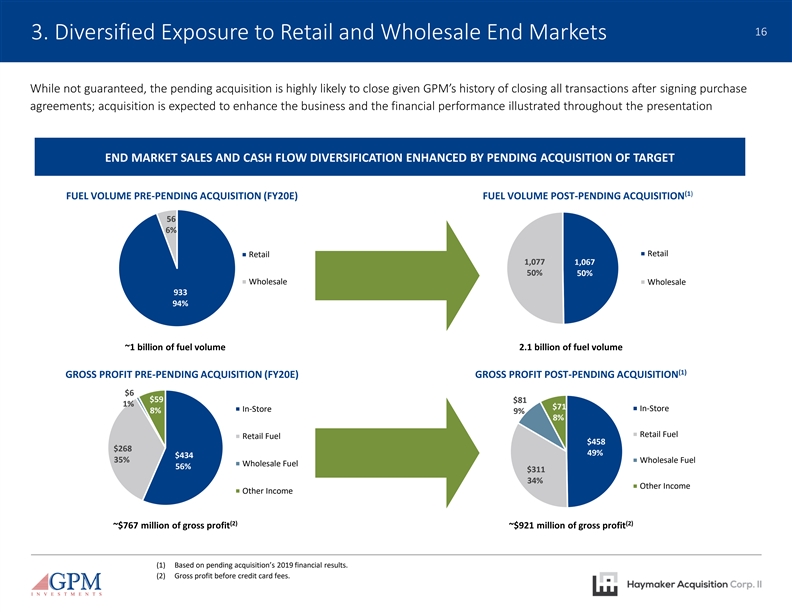
16 3. Diversified Exposure to Retail and Wholesale End Markets While not guaranteed, the pending acquisition is highly likely to close given GPM’s history of closing all transactions after signing purchase agreements; acquisition is expected to enhance the business and the financial performance illustrated throughout the presentation END MARKET SALES AND CASH FLOW DIVERSIFICATION ENHANCED BY PENDING ACQUISITION OF TARGET 16 (1) FUEL VOLUME PRE-PENDING ACQUISITION (FY20E) FUEL VOLUME POST-PENDING ACQUISITION 56 6% Retail Retail 1,077 1,067 50% 50% Wholesale Wholesale 933 94% ~1 billion of fuel volume 2.1 billion of fuel volume (1) GROSS PROFIT PRE-PENDING ACQUISITION (FY20E) GROSS PROFIT POST-PENDING ACQUISITION $6 $59 $81 1% $71 In-Store In-Store 8% 9% 8% Retail Fuel Retail Fuel $458 $268 49% $434 35% Wholesale Fuel Wholesale Fuel 56% $311 34% Other Income Other Income (2) (2) ~$767 million of gross profit ~$921 million of gross profit (1) Based on pending acquisition’s 2019 financial results. (2) Gross profit before credit card fees.16 3. Diversified Exposure to Retail and Wholesale End Markets While not guaranteed, the pending acquisition is highly likely to close given GPM’s history of closing all transactions after signing purchase agreements; acquisition is expected to enhance the business and the financial performance illustrated throughout the presentation END MARKET SALES AND CASH FLOW DIVERSIFICATION ENHANCED BY PENDING ACQUISITION OF TARGET 16 (1) FUEL VOLUME PRE-PENDING ACQUISITION (FY20E) FUEL VOLUME POST-PENDING ACQUISITION 56 6% Retail Retail 1,077 1,067 50% 50% Wholesale Wholesale 933 94% ~1 billion of fuel volume 2.1 billion of fuel volume (1) GROSS PROFIT PRE-PENDING ACQUISITION (FY20E) GROSS PROFIT POST-PENDING ACQUISITION $6 $59 $81 1% $71 In-Store In-Store 8% 9% 8% Retail Fuel Retail Fuel $458 $268 49% $434 35% Wholesale Fuel Wholesale Fuel 56% $311 34% Other Income Other Income (2) (2) ~$767 million of gross profit ~$921 million of gross profit (1) Based on pending acquisition’s 2019 financial results. (2) Gross profit before credit card fees.
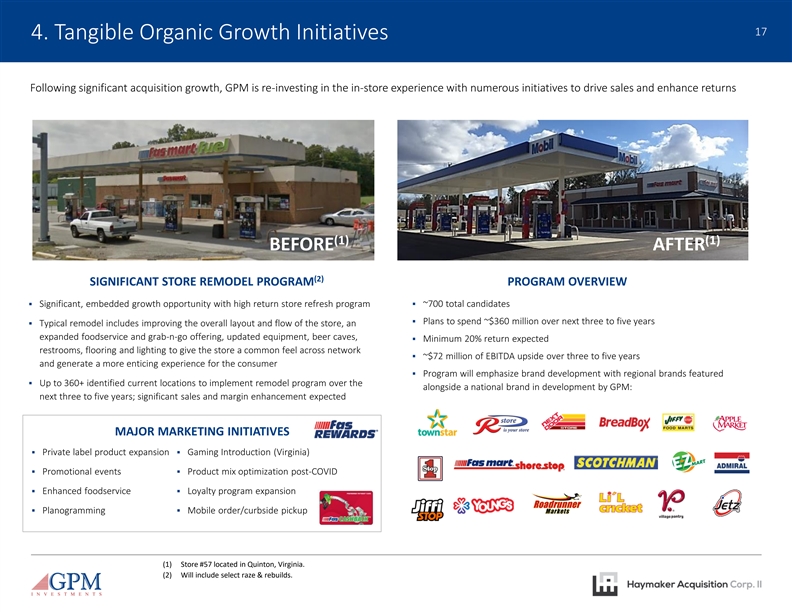
17 4. Tangible Organic Growth Initiatives Following significant acquisition growth, GPM is re-investing in the in-store experience with numerous initiatives to drive sales and enhance returns 17 (1) (1) BEFORE AFTER (2) SIGNIFICANT STORE REMODEL PROGRAM PROGRAM OVERVIEW § Significant, embedded growth opportunity with high return store refresh program § ~700 total candidates § Plans to spend ~$360 million over next three to five years § Typical remodel includes improving the overall layout and flow of the store, an expanded foodservice and grab-n-go offering, updated equipment, beer caves, § Minimum 20% return expected restrooms, flooring and lighting to give the store a common feel across network § ~$72 million of EBITDA upside over three to five years and generate a more enticing experience for the consumer § Program will emphasize brand development with regional brands featured § Up to 360+ identified current locations to implement remodel program over the alongside a national brand in development by GPM: next three to five years; significant sales and margin enhancement expected MAJOR MARKETING INITIATIVES § Private label product expansion§ Gaming Introduction (Virginia) § Promotional events§ Product mix optimization post-COVID § Enhanced foodservice§ Loyalty program expansion § Planogramming§ Mobile order/curbside pickup (1) Store #57 located in Quinton, Virginia. (2) Will include select raze & rebuilds.17 4. Tangible Organic Growth Initiatives Following significant acquisition growth, GPM is re-investing in the in-store experience with numerous initiatives to drive sales and enhance returns 17 (1) (1) BEFORE AFTER (2) SIGNIFICANT STORE REMODEL PROGRAM PROGRAM OVERVIEW § Significant, embedded growth opportunity with high return store refresh program § ~700 total candidates § Plans to spend ~$360 million over next three to five years § Typical remodel includes improving the overall layout and flow of the store, an expanded foodservice and grab-n-go offering, updated equipment, beer caves, § Minimum 20% return expected restrooms, flooring and lighting to give the store a common feel across network § ~$72 million of EBITDA upside over three to five years and generate a more enticing experience for the consumer § Program will emphasize brand development with regional brands featured § Up to 360+ identified current locations to implement remodel program over the alongside a national brand in development by GPM: next three to five years; significant sales and margin enhancement expected MAJOR MARKETING INITIATIVES § Private label product expansion§ Gaming Introduction (Virginia) § Promotional events§ Product mix optimization post-COVID § Enhanced foodservice§ Loyalty program expansion § Planogramming§ Mobile order/curbside pickup (1) Store #57 located in Quinton, Virginia. (2) Will include select raze & rebuilds.
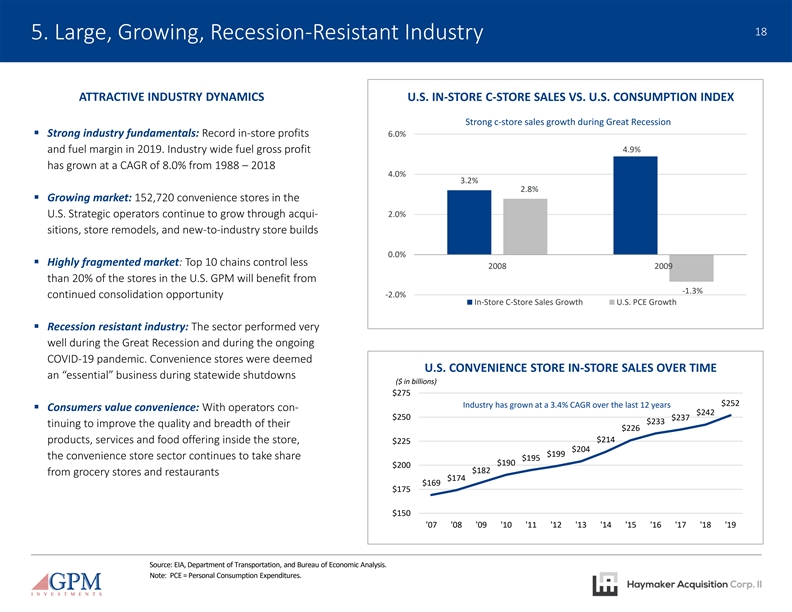
18 5. Large, Growing, Recession-Resistant Industry ATTRACTIVE INDUSTRY DYNAMICS U.S. IN-STORE C-STORE SALES VS. U.S. CONSUMPTION INDEX Strong c-store sales growth during Great Recession § Strong industry fundamentals: Record in-store profits 6.0% 4.9% and fuel margin in 2019. Industry wide fuel gross profit 18 has grown at a CAGR of 8.0% from 1988 – 2018 4.0% 3.2% 2.8% § Growing market: 152,720 convenience stores in the U.S. Strategic operators continue to grow through acqui- 2.0% sitions, store remodels, and new-to-industry store builds 0.0% § Highly fragmented market: Top 10 chains control less 2008 2009 than 20% of the stores in the U.S. GPM will benefit from -1.3% continued consolidation opportunity -2.0% In-Store C-Store Sales Growth U.S. PCE Growth § Recession resistant industry: The sector performed very well during the Great Recession and during the ongoing COVID-19 pandemic. Convenience stores were deemed U.S. CONVENIENCE STORE IN-STORE SALES OVER TIME an “essential” business during statewide shutdowns ($ in billions) $275 $252 Industry has grown at a 3.4% CAGR over the last 12 years § Consumers value convenience: With operators con- $242 $250 $237 $233 tinuing to improve the quality and breadth of their $226 $214 products, services and food offering inside the store, $225 $204 $199 the convenience store sector continues to take share $195 $190 $200 $182 from grocery stores and restaurants $174 $169 $175 $150 '07 '08 '09 '10 '11 '12 '13 '14 '15 '16 '17 '18 '19 Source: EIA, Department of Transportation, and Bureau of Economic Analysis. Note: PCE = Personal Consumption Expenditures.18 5. Large, Growing, Recession-Resistant Industry ATTRACTIVE INDUSTRY DYNAMICS U.S. IN-STORE C-STORE SALES VS. U.S. CONSUMPTION INDEX Strong c-store sales growth during Great Recession § Strong industry fundamentals: Record in-store profits 6.0% 4.9% and fuel margin in 2019. Industry wide fuel gross profit 18 has grown at a CAGR of 8.0% from 1988 – 2018 4.0% 3.2% 2.8% § Growing market: 152,720 convenience stores in the U.S. Strategic operators continue to grow through acqui- 2.0% sitions, store remodels, and new-to-industry store builds 0.0% § Highly fragmented market: Top 10 chains control less 2008 2009 than 20% of the stores in the U.S. GPM will benefit from -1.3% continued consolidation opportunity -2.0% In-Store C-Store Sales Growth U.S. PCE Growth § Recession resistant industry: The sector performed very well during the Great Recession and during the ongoing COVID-19 pandemic. Convenience stores were deemed U.S. CONVENIENCE STORE IN-STORE SALES OVER TIME an “essential” business during statewide shutdowns ($ in billions) $275 $252 Industry has grown at a 3.4% CAGR over the last 12 years § Consumers value convenience: With operators con- $242 $250 $237 $233 tinuing to improve the quality and breadth of their $226 $214 products, services and food offering inside the store, $225 $204 $199 the convenience store sector continues to take share $195 $190 $200 $182 from grocery stores and restaurants $174 $169 $175 $150 '07 '08 '09 '10 '11 '12 '13 '14 '15 '16 '17 '18 '19 Source: EIA, Department of Transportation, and Bureau of Economic Analysis. Note: PCE = Personal Consumption Expenditures.
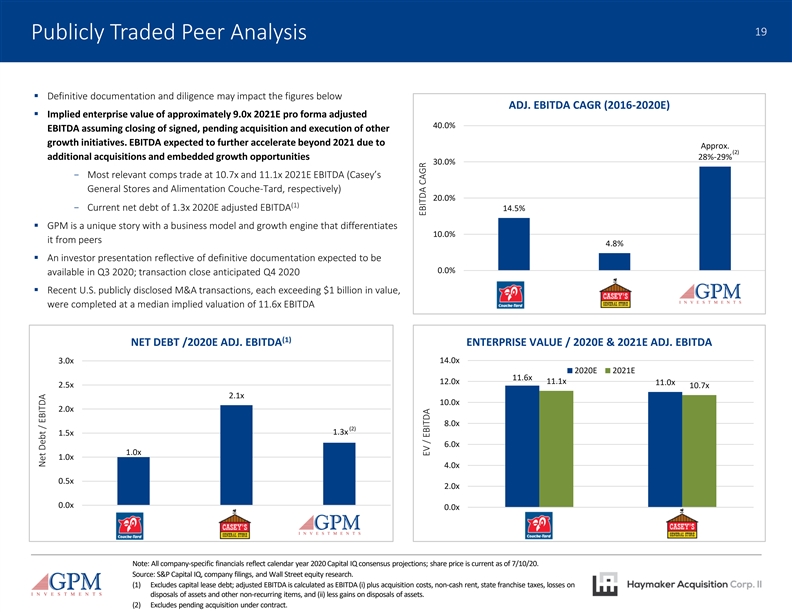
19 Publicly Traded Peer Analysis § Definitive documentation and diligence may impact the figures below ADJ. EBITDA CAGR (2016-2020E) § Implied enterprise value of approximately 9.0x 2021E pro forma adjusted 40.0% EBITDA assuming closing of signed, pending acquisition and execution of other growth initiatives. EBITDA expected to further accelerate beyond 2021 due to Approx. (2) additional acquisitions and embedded growth opportunities 28%-29% 30.0% 19 − Most relevant comps trade at 10.7x and 11.1x 2021E EBITDA (Casey’s General Stores and Alimentation Couche-Tard, respectively) 20.0% (1) − Current net debt of 1.3x 2020E adjusted EBITDA 14.5% § GPM is a unique story with a business model and growth engine that differentiates 10.0% it from peers 4.8% § An investor presentation reflective of definitive documentation expected to be 0.0% available in Q3 2020; transaction close anticipated Q4 2020 ATD.B CASY GPM § Recent U.S. publicly disclosed M&A transactions, each exceeding $1 billion in value, were completed at a median implied valuation of 11.6x EBITDA (1) NET DEBT /2020E ADJ. EBITDA ENTERPRISE VALUE / 2020E & 2021E ADJ. EBITDA 14.0x 3.0x 2020E 2021E 11.6x 12.0x 11.1x 11.0x 2.5x 10.7x 2.1x 10.0x 2.0x 8.0x (2) 1.3x 1.5x 6.0x 1.0x 1.0x 4.0x 0.5x 2.0x 0.0x 0.0x ATD.B CASY GPM ATD.B CASY Note: All company-specific financials reflect calendar year 2020 Capital IQ consensus projections; share price is current as of 7/10/20. Source: S&P Capital IQ, company filings, and Wall Street equity research. (1) Excludes capital lease debt; adjusted EBITDA is calculated as EBITDA (i) plus acquisition costs, non-cash rent, state franchise taxes, losses on disposals of assets and other non-recurring items, and (ii) less gains on disposals of assets. (2) Excludes pending acquisition under contract. Net Debt / EBITDA EBITDA CAGR EV / EBITDA19 Publicly Traded Peer Analysis § Definitive documentation and diligence may impact the figures below ADJ. EBITDA CAGR (2016-2020E) § Implied enterprise value of approximately 9.0x 2021E pro forma adjusted 40.0% EBITDA assuming closing of signed, pending acquisition and execution of other growth initiatives. EBITDA expected to further accelerate beyond 2021 due to Approx. (2) additional acquisitions and embedded growth opportunities 28%-29% 30.0% 19 − Most relevant comps trade at 10.7x and 11.1x 2021E EBITDA (Casey’s General Stores and Alimentation Couche-Tard, respectively) 20.0% (1) − Current net debt of 1.3x 2020E adjusted EBITDA 14.5% § GPM is a unique story with a business model and growth engine that differentiates 10.0% it from peers 4.8% § An investor presentation reflective of definitive documentation expected to be 0.0% available in Q3 2020; transaction close anticipated Q4 2020 ATD.B CASY GPM § Recent U.S. publicly disclosed M&A transactions, each exceeding $1 billion in value, were completed at a median implied valuation of 11.6x EBITDA (1) NET DEBT /2020E ADJ. EBITDA ENTERPRISE VALUE / 2020E & 2021E ADJ. EBITDA 14.0x 3.0x 2020E 2021E 11.6x 12.0x 11.1x 11.0x 2.5x 10.7x 2.1x 10.0x 2.0x 8.0x (2) 1.3x 1.5x 6.0x 1.0x 1.0x 4.0x 0.5x 2.0x 0.0x 0.0x ATD.B CASY GPM ATD.B CASY Note: All company-specific financials reflect calendar year 2020 Capital IQ consensus projections; share price is current as of 7/10/20. Source: S&P Capital IQ, company filings, and Wall Street equity research. (1) Excludes capital lease debt; adjusted EBITDA is calculated as EBITDA (i) plus acquisition costs, non-cash rent, state franchise taxes, losses on disposals of assets and other non-recurring items, and (ii) less gains on disposals of assets. (2) Excludes pending acquisition under contract. Net Debt / EBITDA EBITDA CAGR EV / EBITDA
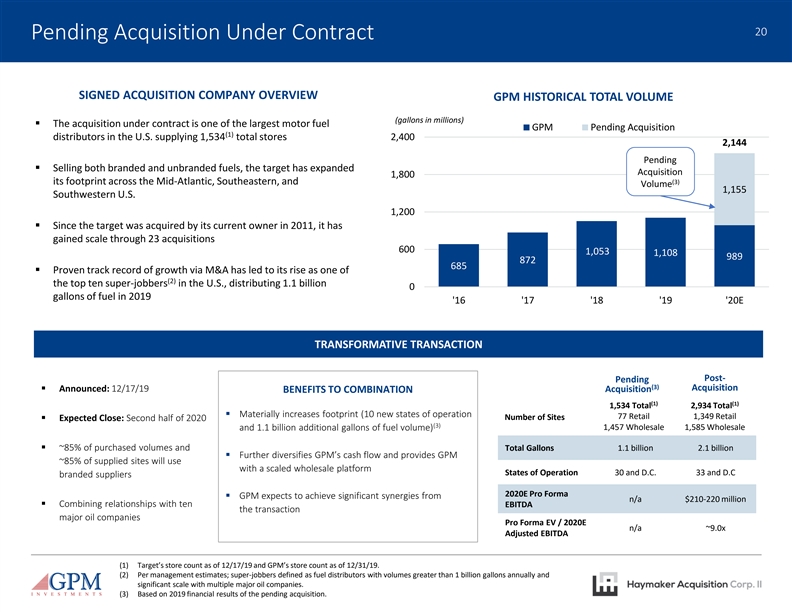
20 Pending Acquisition Under Contract SIGNED ACQUISITION COMPANY OVERVIEW GPM HISTORICAL TOTAL VOLUME (gallons in millions) § The acquisition under contract is one of the largest motor fuel GPM Pending Acquisition (1) distributors in the U.S. supplying 1,534 total stores 2,400 2,144 Pending 20 § Selling both branded and unbranded fuels, the target has expanded Acquisition 1,800 (3) its footprint across the Mid-Atlantic, Southeastern, and Volume 1,155 Southwestern U.S. 1,200 § Since the target was acquired by its current owner in 2011, it has gained scale through 23 acquisitions 600 1,053 1,108 989 872 685 § Proven track record of growth via M&A has led to its rise as one of (2) the top ten super-jobbers in the U.S., distributing 1.1 billion 0 gallons of fuel in 2019 '16 '17 '18 '19 '20E TRANSFORMATIVE TRANSACTION Post- Pending (3) Acquisition § Announced: 12/17/19 Acquisition BENEFITS TO COMBINATION (1) (1) 1,534 Total 2,934 Total § Materially increases footprint (10 new states of operation 77 Retail 1,349 Retail Number of Sites § Expected Close: Second half of 2020 (3) 1,457 Wholesale 1,585 Wholesale and 1.1 billion additional gallons of fuel volume) § ~85% of purchased volumes and Total Gallons 1.1 billion 2.1 billion § Further diversifies GPM’s cash flow and provides GPM ~85% of supplied sites will use with a scaled wholesale platform States of Operation 30 and D.C. 33 and D.C branded suppliers 2020E Pro Forma § GPM expects to achieve significant synergies from n/a $210-220 million § Combining relationships with ten EBITDA the transaction major oil companies Pro Forma EV / 2020E n/a ~9.0x Adjusted EBITDA (1) Target’s store count as of 12/17/19 and GPM’s store count as of 12/31/19. (2) Per management estimates; super-jobbers defined as fuel distributors with volumes greater than 1 billion gallons annually and significant scale with multiple major oil companies. (3) Based on 2019 financial results of the pending acquisition.20 Pending Acquisition Under Contract SIGNED ACQUISITION COMPANY OVERVIEW GPM HISTORICAL TOTAL VOLUME (gallons in millions) § The acquisition under contract is one of the largest motor fuel GPM Pending Acquisition (1) distributors in the U.S. supplying 1,534 total stores 2,400 2,144 Pending 20 § Selling both branded and unbranded fuels, the target has expanded Acquisition 1,800 (3) its footprint across the Mid-Atlantic, Southeastern, and Volume 1,155 Southwestern U.S. 1,200 § Since the target was acquired by its current owner in 2011, it has gained scale through 23 acquisitions 600 1,053 1,108 989 872 685 § Proven track record of growth via M&A has led to its rise as one of (2) the top ten super-jobbers in the U.S., distributing 1.1 billion 0 gallons of fuel in 2019 '16 '17 '18 '19 '20E TRANSFORMATIVE TRANSACTION Post- Pending (3) Acquisition § Announced: 12/17/19 Acquisition BENEFITS TO COMBINATION (1) (1) 1,534 Total 2,934 Total § Materially increases footprint (10 new states of operation 77 Retail 1,349 Retail Number of Sites § Expected Close: Second half of 2020 (3) 1,457 Wholesale 1,585 Wholesale and 1.1 billion additional gallons of fuel volume) § ~85% of purchased volumes and Total Gallons 1.1 billion 2.1 billion § Further diversifies GPM’s cash flow and provides GPM ~85% of supplied sites will use with a scaled wholesale platform States of Operation 30 and D.C. 33 and D.C branded suppliers 2020E Pro Forma § GPM expects to achieve significant synergies from n/a $210-220 million § Combining relationships with ten EBITDA the transaction major oil companies Pro Forma EV / 2020E n/a ~9.0x Adjusted EBITDA (1) Target’s store count as of 12/17/19 and GPM’s store count as of 12/31/19. (2) Per management estimates; super-jobbers defined as fuel distributors with volumes greater than 1 billion gallons annually and significant scale with multiple major oil companies. (3) Based on 2019 financial results of the pending acquisition.
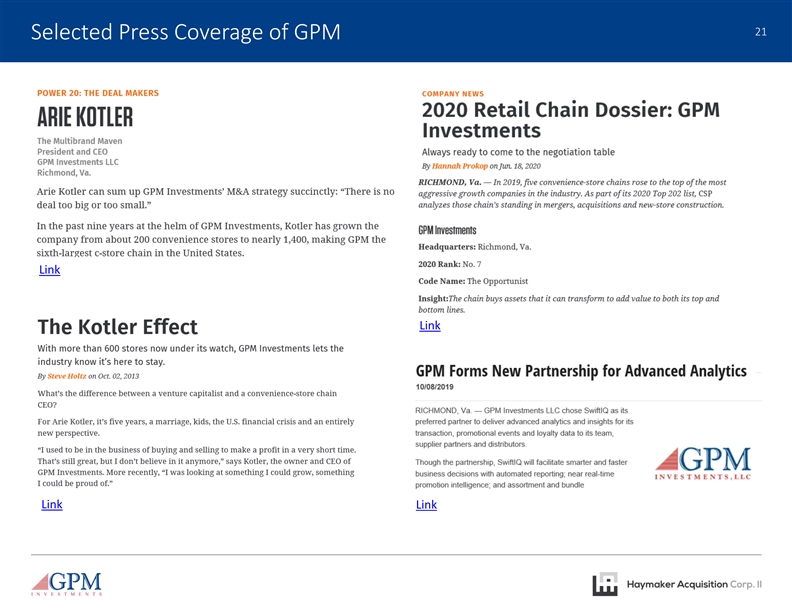
21 Selected Press Coverage of GPM 21 Link Link Link Link21 Selected Press Coverage of GPM 21 Link Link Link Link