Attached files
| file | filename |
|---|---|
| EX-31.2 - EXHIBIT 31.2 - AMERICAN SOFTWARE INC | amswa-20200131ex312.htm |
| EX-32.1 - EXHIBIT 32.1 - AMERICAN SOFTWARE INC | amswa-20180430ex321.htm |
| EX-31.1 - EXHIBIT 31.1 - AMERICAN SOFTWARE INC | amswa-20200131ex311.htm |
| EX-23.1 - EXHIBIT 23.1 - AMERICAN SOFTWARE INC | amswa-20200430ex231.htm |
| EX-21.1 - EXHIBIT 21.1 - AMERICAN SOFTWARE INC | amswa-20200430ex211.htm |
UNITED STATES
SECURITIES AND EXCHANGE COMMISSION
Washington, D.C. 20549
_________________________
FORM 10-K
_________________________
(Mark One)
☒ | ANNUAL REPORT PURSUANT TO SECTION 13 OR 15(d) OF THE SECURITIES EXCHANGE ACT OF 1934 |
For the fiscal year ended April 30, 2020
OR
☐ | TRANSITION REPORT PURSUANT TO SECTION 13 OR 15(d) OF THE SECURITIES EXCHANGE ACT OF 1934 |
For the transition period from to
Commission File Number 0-12456
_________________________
AMERICAN SOFTWARE, INC.
(Exact name of registrant as specified in its charter)
_________________________
Georgia | 58-1098795 | |
(State or other jurisdiction of incorporation or organization) | (IRS Employer Identification No.) | |
470 East Paces Ferry Road, N.E. Atlanta, Georgia | 30305 | |
(Address of principal executive offices) | (Zip Code) | |
(404) 261-4381
Registrant’s telephone number, including area code
Securities registered pursuant to Section 12(b) of the Act:
Title of each class | Trading Symbol | Name of each exchange on which registered |
None | None | |
Securities registered pursuant to Section 12(g) of the Act:
Class A Common Shares, $0.10 Par Value
(Title of class)
_________________________
Indicate by check mark if the registrant is a well-known seasoned issuer, as defined in Rule 405 of the Securities Act. Yes ☐ No ☒
Indicate by check mark if the registrant is not required to file reports pursuant to Section 13 or Section 15(d) of the Act. Yes ☐ No ☒
Indicate by check mark whether the registrant (1) has filed all reports required to be filed by Section 13 or 15(d) of the Securities Exchange Act of 1934 during the preceding 12 months (or for such shorter period that the registrant was required to file such reports), and (2) has been subject to such filing requirements for the past 90 days. Yes ☒ No ☐
Indicate by check mark whether the registrant has submitted electronically every Interactive Data File required to be submitted pursuant to Rule 405 of Regulation S-T during the preceding 12 months (or for such shorter period that the registrant was required to submit such files). Yes ☒ No ☐
Indicate by check mark whether the Registrant is a large accelerated filer, an accelerated filer, a non-accelerated filer, an emerging growth company or a smaller reporting company. See the definitions of “large accelerated filer,” “accelerated filer,” “emerging growth company” and “smaller reporting company” in Rule 12b-2 of the Exchange Act.
Large accelerated filer | ☐ | Accelerated filer | ☒ | |||
Non-accelerated filer | ☐ | Smaller reporting company | ☐ | |||
Emerging growth company | ☐ | |||||
If an emerging growth company, indicate by check mark if the registrant has elected not to use the extended transition period for complying with any new or revised financial accounting standards provided pursuant to Section 13(a) of the Exchange Act. ☐
Indicate by check mark whether the registrant has filed a report on and attestation to its management’s assessment of the effectiveness of its internal control over financial reporting under Section 404(b) of the Sarbanes-Oxley Act (15 U.S.C. 7262(b)) by the registered public accounting firm that prepared or issued its audit report. ☒
Indicate by check mark whether the registrant is a shell company (as defined in Rule 12b-2 of the Exchange Act). Yes ☐ No ☒
As of October 31, 2019, the last business day of the registrant’s most recently completed second fiscal quarter, 30,042,050 Class A Common Shares and 1,821,587 Class B Common Shares of the registrant were outstanding. The aggregate market value (based upon the closing price of Class A Common Shares as quoted on the NASDAQ National Market System on October 31, 2019) of the Class A Common Shares held by non-affiliates on that date was approximately $516.5 million. As of July 2, 2020, 30,620,541 Class A Common Shares and 1,821,587 Class B Common Shares of the registrant were outstanding.
DOCUMENTS INCORPORATED BY REFERENCE; LOCATION IN FORM 10-K
Portions of the Company’s Proxy Statement for its 2020 Annual Meeting of Shareholders are incorporated by reference into Part III.
American Software Inc.
ANNUAL REPORT ON FORM 10-K
For the Fiscal Year Ended April 30, 2020
TABLE OF CONTENTS
PART I
Item 1. BUSINESS
Special Cautionary Notice Regarding Forward-Looking Statements
We believe that it is important to communicate our future expectations to our shareholders and to the public. This report contains forward-looking statements, including, in particular, statements about our goals, plans, objectives, beliefs, expectations and prospects, under the headings “Item 1. Business” and “Item 7. Management’s Discussion and Analysis of Financial Condition and Results of Operations” in this report. You can identify these statements by forward-looking words such as “anticipate,” “intend,” “plan,” “continue,” “could,” “grow,” “may,” “potential,” “predict,” “strive,” “will,” “seek,” “estimate,” “believe,” “expect,” and similar expressions that convey uncertainty of future events or outcomes. Any forward-looking statements herein are made pursuant to the safe harbor provisions of the Private Securities Litigation Reform Act of 1995. Forward-looking statements include statements concerning future:
• | results of operations; |
• | liquidity, cash flow and capital expenditures; |
• | demand for and pricing of our products and services; |
• | viability and effectiveness of strategic alliances; |
• | industry conditions and market conditions; |
• | acquisition activities and the effect of completed acquisitions; and |
• | general economic conditions. |
Although we believe that the goals, plans, expectations, and prospects reflected by our forward-looking statements are reasonable in view of the information currently available to us, those statements are not guarantees of performance. There are many factors that could cause our actual results to differ materially from those anticipated by forward-looking statements made herein. These factors include, but are not limited to, continuing U.S. and global economic uncertainty, the effects of the global pandemic, the timing and degree of business recovery, unpredictability and the irregular pattern of future revenues, dependence on particular market segments or customers, competitive pressures, delays, product liability and warranty claims and other risks associated with new product development, undetected software errors, market acceptance of our products, technological complexity, the challenges and risks associated with integration of acquired product lines, companies and services, as well as a number of other risk factors that could affect our future performance. Factors that could cause or contribute to such differences include, but are not limited to, those we discuss under the section captioned “Risk Factors” in Item 1A. of this Form 10-K as well as the cautionary statements and other factors that we discuss in other sections of this Form 10-K.
Company Overview
American Software, Inc. ("American Software" or the "Company") was incorporated in Georgia in 1970. The Company is headquartered in Atlanta, Georgia with U.S. offices in Boston, Chicago, Dallas, Indianapolis, New York, St. Louis, Miami, Pittsburgh and San Diego; and international offices in the United Kingdom, Sweden, Germany, India, New Zealand and Australia.
We provide our software and services solutions through three major operating segments; (1) Supply Chain Management (“SCM”), (2) Information Technology Consulting ("IT Consulting") and (3) Other. The SCM software business is our core market,
1
however we also offer technology staffing and consulting services through our wholly-owned subsidiary, The Proven Method, Inc., in the IT Consulting segment, and we continue to provide limited services to our legacy enterprise resource planning ("ERP") customers included in the Other segment.
Our primary operating units or brands under our SCM segment include Logility, Inc., New Generation Computing, Inc. ("NGC"), and Demand Management, Inc. ("DMI"). Logility and New Generation Computing are each a wholly-owned subsidiary of the Company, and Demand Management, Inc. is a wholly-owned subsidiary of Logility, Inc. Each operating unit focuses on a segment of the marketplace where their expertise lies.
American Software enables enterprises to accelerate their operations from product concept to customer availability. Our three brands leverage a single platform spanning eight supply chain process areas, including demand optimization, inventory optimization, supply optimization, retail optimization, quality and compliance, product lifecycle management ("PLM"), sourcing management and integrated business planning. Our platform includes advanced analytics and is fueled by supply chain master data, allowing for the automation of critical business processes through the application of artificial intelligence ("AI") and machine learning algorithms to a variety of internal and external data streams.
We believe enterprises are facing unprecedented rates of change and disruption across their operations. Increasing consumer expectations for convenience and personalization, fast and free delivery and product freshness are forcing enterprises to adapt or be left behind. Given constraints arising from a shortage of skilled supply chain talent and a desire to keep costs at a minimum, we expect enterprises to embrace digital transformation initiatives to meet these challenges. Our solution reduces the business cycle time required from product concept to customer availability. Our platform provides to our customers a digital twin of their physical supply chain networks which improves the speed and agility of their operations by implementing automated planning processes that evaluate multiple business scenarios. These processes continuously analyze business and market signals to better inform product design and development, increase forecast accuracy, optimize inventory across the supply chain and in retail locations, and ensure high customer satisfaction.
Our platform is highly regarded by customers and industry analysts alike. We are named a leader in multiple IDC MarketScape reports including; the January 2020 report IDC MarketScape: Worldwide Supply Chain Demand Planning 2019 Vendor Assessment, the December 2019 report IDC MarketScape: Worldwide Supply Chain Inventory Optimization 2019 Vendor Assessment, and the November 2019 report IDC MarketScape: Worldwide Supply Chain Sales and Operations Planning 2019 Vendor Assessment.
We have been positioned in the Leaders quadrant in Gartner, Inc.’s (“Gartner”) May 7, 2019 report, Magic Quadrant for Sales and Operations Planning Systems of Differentiation, and August 21, 2018 report, Magic Quadrant for Supply Chain Planning System of Record. We believe our platform is rated highly due to our flexible advanced analytics, underlying Software as a Service ("SaaS") architecture, ease of integration with third-party systems, lower total cost of ownership relative to competitors and the broad scope of supply chain planning functions supported.
We serve approximately 1,100 customers located in more than 80 countries and largely concentrated within key vertical markets, including apparel and other soft goods, food and beverage, chemical and process, consumer packaged goods, durable goods, life sciences and retail. Our solutions are marketed and sold through a direct sales team as well as an indirect global value-
2
added reseller ("VAR") distribution network. While our solutions may be deployed in the cloud or on-premise, customers are increasingly opting for our cloud-based SaaS deployments. We further support our customers with an array of consulting, implementation, operational and training services as well as technical support and hosting.
We derive revenues from four sources: subscriptions, software licenses, maintenance and services. We generally determine SaaS subscription and software license fees based on the breadth of functionality, users and/or divisions subscribed. Services and other revenues consist primarily of fees from software implementation, training, consulting services, hosting and managed services. We bill for services primarily under time and materials arrangements and recognize revenues as we perform services. Subscription and maintenance agreements typically are for a three- to five-year term, commencing at the time of the software delivery. We generally bill these fees annually in advance and then recognize the resulting revenues ratably over the term of the agreement. Deferred revenues represent advance payments or fees for subscriptions, software licenses, services and maintenance billed in advance of the time we recognize the related revenues.
Market Opportunity
Today’s manufacturers, distributors and retailers must respond to rising consumer expectations to buy anywhere, deliver anywhere and return anywhere, even as global economic conditions and competitive pressures force businesses to reduce costs, decrease order cycle times and improve operating efficiencies. To meet these demands, we believe businesses must dramatically improve the performance of their supply chains, which can only be achieved through automation, artificial intelligence and advanced analytics. We leverage artificial intelligence and machine learning algorithms throughout our supply chain management software platform, enabling enterprises to accelerate the cycle time from product concept to customer availability.
Supply chain management refers to the process of managing the complex global network of relationships that organizations maintain with external trading partners (customers and suppliers) to design products, forecast demand, source supply, manufacture products, distribute and allocate inventory and deliver goods and services to the end customer. Supply chain management involves the activities related to sourcing and supplying and merchandising products or services as well as the sales and marketing activities that influence the demand for goods and services, such as new product introductions, promotions, pricing and forecasting. Additional aspects of supply chain management include comprehensive sales and operations planning ("S&OP") as well as product lifecycle management (“PLM”), product sourcing quality and vendor compliance, to ensure the right products are brought to market on time and in good condition. Companies that effectively communicate, collaborate and integrate with their trading partners across the multi-enterprise network or supply chain can realize significant competitive advantages in the form of lower costs, greater customer loyalty, reduced stock-outs, more efficient sourcing, reduced inventory levels, synchronized supply and demand and increased revenue.
Gartner’s April, 2020 report, Forecast: Enterprise Application Software, Worldwide, 2018-2024, 1Q20 Update, predicts spending on Supply Chain Management software solutions will exceed $14 billion in 2020 and reach $22 billion by 2024. This represents a compounded annual growth rate ("CAGR") of 9.25% through 2024. Within the Supply Chain Management software market, Gartner includes solutions for supply chain planning, supply chain execution and procurement. We focus primarily on supply chain and retail planning processes and certain execution functions, which we estimate account for approximately one-third of the Supply Chain Management software market as defined by Gartner. Our platform includes more than thirty components spanning eight key supply chain planning processes that customers may adopt independently or as a comprehensive solution platform. We believe our opportunity to cross-sell and up-sell existing customers is significant given the potential for customers to adopt additional components over time.
3
Our supply chain optimization and retail planning functions use information and analysis to facilitate the on-time delivery of the right products to the right place at the right time and at the optimal total cost. The planning process includes demand forecasting and sensing, inventory and supply optimization, distribution, manufacturing planning and scheduling, sales and operations planning, retail financial planning, assortment and allocation, PLM, global sourcing and vendor compliance. Planning software is designed to increase revenues, improve forecast accuracy, optimize manufacturing scheduling, better leverage inventory investments, decrease order cycle times, reduce transportation costs and improve customer service. Customers are increasingly adopting planning, sourcing and optimization software that is implemented and accessed in the cloud.
Our supply chain execution functions address sourcing, manufacturing, distributing and delivering products to customers throughout the global network. Within the supply chain execution function, organizations are increasing their focus on vendor compliance and sourcing linked with supply chain planning and other enterprise applications, in order to increase the efficient and effective fulfillment of customer orders in both the business-to-business and the business-to-consumer sectors. These multi-enterprise supply chains have heightened the need for robust supply chain master data management ("MDM") to provide an accurate digital twin of the supply chain network, allowing enterprises to quickly plan strategically and accurately respond to dynamic market conditions to take advantage of business opportunities and mitigate risk.
In order to effectively manage and coordinate supply chain activities, companies require integrated business planning, S&OP, supply chain planning, allocation, sourcing, supply chain execution, and supply chain analytics software that enables integrated communication, optimization and collaboration among the various constituents throughout the supply chain network. Our advanced cognitive platform helps ensure that each stakeholder is aligned with the corporate strategy to minimize costs, increase service levels and deliver exceptional customer service.
Company Strategy
Our cloud-based digital platform provides customers with decision support capabilities to achieve an agile, resilient and higher velocity supply chain. Our goal is to become a leading provider of collaborative supply chain optimization, advanced retail planning and supply chain management solutions to enable midsize, large and Fortune 500 companies to optimize their operations associated with the planning, sourcing, manufacturing, storage, distribution and allocation of products. Our strategy includes the following key elements:
Leverage Cloud Strategy. Our cloud computing capability accelerates customers’ deployment of our industry leading supply chain, advanced retail planning, PLM, product sourcing and vendor compliance solutions. Our cloud strategy includes SaaS subscriptions and licensing and services designed to enable the optimization of our customers’ supply chains to reflect their global business needs.
Leverage and Expand Installed Base of Customers. We primarily target businesses in the consumer goods, food and beverage, retail, apparel and soft goods, durable and hard lines, life sciences, chemicals, and wholesale distribution industries. We intend to continue to leverage our installed base of approximately 1,100 customers to introduce additional functionality, product upgrades, and complementary components. In addition, we intend to expand sales to new customers in our existing vertical markets and to target additional vertical markets over time. We will continue our focus on offering a best-in-class cloud solution and expect the growth trends we have experienced in this area to continue because many new and existing customers are pursuing cloud strategies for their business applications.
4
Continue to Expand Sales and Marketing. We intend to continue to pursue an increased share of the market for supply chain software solutions by expanding our sales and marketing activities. We believe our competitive advantages include providing rapid implementation, easy-to-maintain configuration, and quick time-to-benefit across the full spectrum of customer operations. We intend to continue building a direct sales force that is focused on selected vertical markets, such as consumer goods, retail, life sciences, wholesale distribution and manufacturing supply chains.
Expand Indirect Channels to Increase Market Penetration. We believe that key relationships with VARs will increase sales and expand market penetration of our products and services. DMI will leverage network of global VARs to reach its markets. This experienced global VARs distribution network significantly expands the Company's reach and provides sales, implementation and support resources serving customers around the world.
Maintain Technology Leadership. We believe we are a technology leader in collaborative supply chain optimization solutions and advanced business analytics and we intend to continue to provide innovative, advanced solutions and services. We believe we were one of the earliest providers to introduce a collaborative supply chain planning solution to support multi-enterprise supply chain network planning. We intend to continue to keep pace with technological developments and emerging industry standards while developing and introducing new and enhanced products.
Invest Aggressively to Build Market Share. We intend to continue investing to expand our sales channels, research and development efforts, and consulting infrastructure, balanced with our goal of increasing profitability. We believe these investments are necessary to increase our market share and to capitalize on the growth opportunities in the market.
Acquire or Invest in Complementary Businesses, Products and Technologies. We believe that selective acquisitions or investments may offer opportunities to broaden our product offering to provide more advanced solutions for our target markets. We will evaluate acquisitions or investments that will provide us with complementary products and technologies, expand our geographic presence and distribution channels, penetrate additional vertical markets with challenges and requirements similar to those we currently meet, and further solidify our leadership position within the SCM market. In fiscal 2015, we acquired MID Retail, Inc., to extend our reach into retail operations and expand our ability to help customers improve their omni-channel performance. In fiscal 2017, we acquired AdapChain to provide supply chain MDM and streamlined integration of our portfolio of planning and optimization solutions with third-party software applications. In fiscal 2018, we acquired certain assets of privately held Innovare Holding Co., Incorporated ("Halo BI") and its subsidiaries. Halo BI was a supplier of advanced analytics and business intelligence solutions for the supply chain market. These enriched analytics leverage interactive visualization, machine learning algorithms, and AI to transform both structured and unstructured data to accelerate business planning performance and proactively identify new business opportunities or mitigate risks.
Focus on Integrated Supply Chain Planning and Supply Chain Execution Platform. We believe we are one of the few providers of truly innovative SCM platform solutions addressing demand, supply and advanced retail planning as well as quality and compliance, PLM and sourcing management. We intend to continue focusing our development initiatives on enhancing our product concept to customer availability platform, expanding its embedded performance management architecture and introducing additional capabilities that complement our integrated solution suite.
Increase Penetration of International Markets. In the fiscal year ended April 30, 2020, we generated 19% of our total revenues from international sales, resulting from marketing relationships with a number of international distributors. Logility and its subsidiary DMI have over 23 VARs in the indirect channel, most of which are international. This experienced global distribution network expands our reach and provides sales, implementation and support resources, serving customers in more than 80 countries.
5
We intend to further expand our international presence by creating additional relationships with distributors in Africa, Asia, Australia, Europe, North America and South America.
Expand Strategic Relationships. We intend to develop strategic relationships with leading enterprise software and service providers and systems integrators to combine our software solutions with their services and products and create joint marketing opportunities. We have developed a network of international partners who assist in the sale and support of our solution platform. We intend to utilize these and future relationships with software and service organizations to enhance our sales and marketing position.
Continue to Focus on Providing High Quality Customer Service. Our mission is to help our customers become more successful. We intend to continue investing in technology and personnel to accommodate the needs of our growing customer base. We will continue to seek new ways to improve service to our customers.
Serve Large and Midsize Business Markets with Complex Supply Chains. Our broad product portfolio allows us to address the unique business needs and complexity of a wide range of enterprises with large and midsize global operations.
However, there can be no assurance that we will be successful in implementing the strategies outlined above.
Products and Services
We provide a comprehensive, cloud-architected supply chain management platform that helps customers manage eight critical planning processes, including demand optimization, inventory optimization, supply optimization, retail optimization, quality and compliance, PLM, sourcing management and integrated business planning. Within each of these process areas, we offer one or more components that customers may leverage independently, in combination, or as a comprehensive solution platform, either in the cloud or on-premise. Our supply chain MDM platform and advanced analytics capabilities enable customers to derive new insights and automate planning processes that continuously analyze demand, production, supply and distribution signals to inform product design and development, increase forecast accuracy, optimize inventory across the global supply chain and in-store, and ensure high customer satisfaction.
Our platform encompasses the following planning processes and associated components:
Advanced Analytics leverage artificial intelligence, machine learning, algorithmic optimization, simulations, scenarios, and other forms of advanced analytics to provide new insights, automate planning and remove time, inventory and risk from the supply chain.
Integrated Business Planning combines volumetric and financial analysis and collaborative workflow to streamline the entire S&OP process and provide a guide for allocating business resources to meet revenue, profitability, and customer service goals.
• | Integrated Business Planning visualizes, elevates and optimizes strategic and tactical plans for products, channels, resources and investment to achieve business goals, drive shareholder value and increase operational efficiencies. |
• | S&OP aligns financial, sales, production, procurement and marketing information into a single plan rooted in supply chain reality. Strategic, tactical and operational plans can be produced through a single platform. |
6
Demand Optimization focuses on improving forecast accuracy to drive better downstream supply chain plans that boost profitability, satisfy customers and synchronize supply chain partners.
• | Demand Sensing evaluates multiple data streams to recognize complex patterns and identify actionable demand signals. It captures and analyzes demand signals from internal and external sources, including point of sale, demand signal repositories, and syndicated data, to identify near-term demand trends and enable fast, intelligent and cost effective market responses. |
• | Demand Planning helps reconcile differences between high-level business planning and detailed product forecasting. Aligning inventory with customer demand, this solution makes it easier to boost service levels, shorten cycle times and reduce inventory obsolescence. |
• | Lifecycle Planning provides control to model each phase over a product’s entire lifecycle, including introduction, maturity, replacement, substitution and retirement. Using attribute-based modeling, this solution can improve the accuracy of new product introductions, lifecycles and phase-outs, resulting in reduced stock-outs and lower obsolescence costs. |
• | Proportional Profile Planning automates the process of detailed SKU-level forecasting using attributes such as style, color and size for large numbers of stock-keeping units (SKUs). Time-phased profiles meet the market goals for product categories while increasing forecast accuracy at the granular level. |
• | Causal Forecasting uses artificial intelligence to correlate multiple external factors (i.e. weather, market trend, commodity prices, etc.) to enhance the demand forecast. |
Inventory Optimization establishes optimal inventory targets at each node of multi-echelon manufacturing, distribution, and retail networks to match strategic inventory goals and service levels.
• | Inventory Optimization optimizes strategic and tactical inventory investments across multi-echelon manufacturing, distribution, and retail networks to meet business and service level objectives for complex supply chains with multiple stages of inventory. |
• | Inventory Planning allows enterprises to effectively measure the tradeoff between finished goods inventory investments and desired customer service levels. This solution dynamically sets time-phased inventory targets based on specific safety stock and order quantity rules. |
Supply Optimization enables constraint-based continuous and periodic planning to identify orders that are unprofitable or cannot be met based on current constraints and analyze the impact of changing factors in production, distribution and storage on costs and customer service.
• | Supply Planning optimizes complex sourcing and production decisions to balance supply, manufacturing and distribution constraints based on corporate goals of maximizing profit or minimizing costs. |
7
• | Replenishment Planning provides visibility into future customer demand, corresponding product and material requirements, and the actions needed to satisfy those demands. |
• | Manufacturing Planning and Scheduling optimizes constraint-based manufacturing schedules and evaluates multiple scenarios to determine the optimal trade-off between manufacturing efficiencies, inventory investments and greenhouse gas emissions, providing lower costs and increased product availability. These optimized schedules consider machine, personnel, tooling and inventory constraints to drive shorter lead times and reliable product availability. |
Retail Optimization synchronizes sourcing from manufacturing to store merchandising and supports the creation of plans to boost sales, increase margins and cut inventory costs.
• | Merchandise and Assortment Planning creates financial merchandise plans for a company and its individual store locations to increase visibility and maintain “open to buy” plans, margin planning and unit ladder plans at various levels in the merchandise hierarchy. Our Innovative Inspiration Board features provide a Pinterest-like workspace where traditional text-based assortment plans become vibrant visual representations of collections, merging the art and science of buyer and planner roles to gain greater visibility throughout the planning process and ensure each store location is able to meet its plan. |
• | Allocation optimizes short-term unit sales and stock projections by store and facilitates automatic replenishment based on daily sales data. Capabilities also include pre-pack optimization to accelerate the receipt and shipment of inventory to specific store locations. |
Quality & Compliance allows quality problems to be identified and remediated faster and ensures proper documentation for each participant in the supply chain to prevent disruptions in moving products around the globe.
• | Quality Management & Audits identifies quality problems faster to reduce chargebacks and rework; enables inspections and audits to be performed at manufacturing facilities via tablets; requests in-line, final, measurement and packing accuracy audits during the production process and provides notification if audits fail; and aids in the analysis of sourcing and factory improvement decisions. |
• | Regulatory Document Management reduces the risk of non-compliance and avoids costly litigation by enforcing control and accountability for all suppliers, vendors and other third parties involved in the design, manufacturing and delivery of products. |
• | Global Logistics Management creates barcode carton labels, inbound paperwork and autonomous system numbers (ASNs) using a web browser; produces a manifest, commercial invoice, bill of lading and packing list once barcoded cartons are placed on a shipment; and tracks each shipment while providing notification of any delays as they occur. |
Product Lifecycle Management provides a common platform for planning, merchandising, design, costing, sampling, quality and sourcing, ensuring complete visibility from product concept to delivery.
8
• | Line Plans provide the roadmap for development and specify SKU counts by division, category and product, and are used to manage seasons, departments, collections and even specific styles to meet performance targets. |
• | Tech Packs & Data Management replace spreadsheets and emails with a single source of product data; manage images, extended attributes and media copy for all distribution channels; and share product information with other systems. |
• | Product Design leverages trend and competitive analysis when defining the direction of products and materials, supports the design and management of product concepts, ensures requirements and cost targets are met, and enables product developers to efficiently develop and re-use designs, materials and product specification data. |
• | Costing allows for collaborative decision making with vendors to break down and compare costs by line item to optimize price points and margins, creates multiple cost sheets per product, and performs “what-if” scenarios to determine which items achieve financial targets. |
• | Sample Management reduces sampling costs by establishing product viability prior to issuing sample requests, tracks the status and enters the results of requested samples, and automatically notifies responsible parties of any rejections. Additional sample requests with corrections also may be created. |
Sourcing Management gathers all requisite information in one place to make optimal sourcing decisions, protecting brand equity and reducing risk while increasing product speed to market.
• | Strategic Sourcing identifies and compares global suppliers, issues request for quotes and evaluates quotes from each participant. Vendors are notified of new requests and have complete visibility into the quoting, sampling and final selection process. |
• | Supply Base Management evaluates, manages, and reports on various factors, including social and regulatory compliance, manufacturing capabilities and capacity, to simplify the complexities of vendor management in one centralized system. |
• | Supply Profiles and Score Cards creates comprehensive, searchable vendor profiles and utilizes digital asset management technology to store and share pictures, videos and other digital media files. |
• | Vendor Onboarding optimizes the onboarding process to help organize, assess and manage vendors and factories to ensure overall compliance and mitigate risks; tracks performance; and creates, issues and manages corrective action plans if needed. |
• | CSR and GMP Audits manage the complexities of Corporate Social Responsibility ("CSR") and ensure products are consistently produced to the quality standards through Good Manufacturing Practices ("GMP") audits. |
9
• | Compliance Packets maintain critical vendor information for transparency, accountability, responsible sourcing and worker non-retaliation. This solution also stores and manages all signed compliance documents and makes them accessible throughout the supply chain. |
Supply Chain Master Data Management provides seamless integration with third-party ERP systems, big data and other Internet of Things (IoT) sources without the cost and effort associated with custom development.
• | Our platform delivers tailored supply chain and enterprise integration, leveraging predefined templates and incorporating artificial intelligence to validate and harmonize planning and related supply chain MDM and transactional data with ERP systems from suppliers such as SAP, Oracle, Microsoft and Infor. |
We also provide a range of cloud services, technical support and professional services to support the adoption, implementation and optimization of our supply chain management platform by customers. Our platform may be deployed as SaaS, a hosted solution or on-premise. Professional services include consulting, implementation, training and other managed services related to our platform.
Through our wholly-owned subsidiary, The Proven Method, Inc., we provide technology staffing and services to a diverse customer base to solve business issues. These services include professional services, product management, and project management outsourcing; staff augmentation for cloud, collaboration, network and security; and social media and analytic marketing.
We also continue to provide software, support and services related to our legacy American Software ERP products, which include our e-Intelliprise solution and e-applications for various integrated business functions.
See Note 8 to the Consolidated Financial Statements for further business segment information.
Customers
We primarily target businesses in the retail, apparel and footwear, consumer packaged goods, chemicals, oil and gas, life sciences, consumer electronics, industrial products and other manufacturing industries. A sample of companies that have purchased one or more of our products or services during the past two fiscal years is as follows:
Consumer Goods | Trident Seafoods Corporation | Canada Goose | Starbucks | Interlock USA, Inc. |
3M Australia | Verizon Wireless | Converse, Inc | Stony Apparel | Intertape Polymer Group |
AdvancePierre Foods | Woolworth's Group Ltd | Delta Apparel | Summit Resource International | Irish Breeze Unlimited Company |
Antartico Comercializadora SA de CV | Zagg Inc. | Dynasty Apparel | Techstyle | It Works Marketing Inc. |
Ashley Furniture | Elan International | The Aldo Group | Johnson Controls - UPG | |
Avery Dennison Corporation | Process & Chemical | Fam Brands | The Collected Group | Johnson Controls Hitachi AC Europe SAS |
Bed Bath & Beyond Inc. | Allnex | Fanatics Apparel, Inc. | The Echo Design Group | KALE HAVACILIK Sanayi AS |
Blue Buffalo | BERICAP Holding GMBH | Fashion Avenue Knits | The Foschini Group Pty | Lifetech Resources, LLC |
BodyBuilding.com | Berry Global | Finish Line | The Home Depot | M&G DuraVent |
Boise Paper Holdings, LLC | Birchwood Laboratories LLC | Follett Corporation | Topson Downs | Monin, Inc. |
Bridgestone Australia Ltd | BP Singapore Pte. Limited | Foot Locker, Inc. | Town & Country Living | Nokia |
Caribou Coffee Company | Bracco Imagining S.p.A. | Godiva Chocolatier | Tristan & America | Henley Enterprises, Inc. |
10
Carrie Francis | Chamberlain Group | Goodwill Industries | T-Shirt International | Hilco |
ClearGage, LLC | CooperVision | GTM Sportswear | Summit Resource International | Nuplex Industries |
Cott Beverages Limited | Croda Europe Limited | Hansells Food Australia | Techstyle | OFS Fitel, LLC |
Dometic Group AB | Dow Chemical Company | Destination XL | Unifirst Corp | ORBIS Corporation |
Electrolux S.E.A. Pte Ltd | EGO Pharmaceuticals, PTY LTD | Urban Outfitters | Parker Hannifin Corporation | |
FoodScience Corporation | Genzyme Diagnostics | Retail & Apparel (cont.) | Valley Apparel LLC | Pattonair Ltd. |
Founders Brewing Company | HollyFrontier Corporation | Hunkemoller International BV | Vesi Sportswear | Quality Steel Corporation |
Freddy Hirsch | Infineum | Hunter Boot Ltd | VF Corporation | Ready Pac Foods, Inc. |
Glen Raven, Inc. | Insmed Incorporated | Hybrid Promotions | Watters Design | Reliable Automatic Sprinkler |
Griffith Laboratories Worldwide | Kremers Urban Pharmaceuticals | INA International | Weissman Theatrical Supplies | Rocky Mountain Cultures, Inc. |
Hamilton Beach | Millipore Sigma | Janouras Custom Design, Ltd. | Williamson-Dickie Manufacturing | Scott Specialties, Inc. |
Hancocks Wine, Spirits and Beer | Norbrook Laboratories | Jantzen Brands Corp. | Winebow Inc. | Smithfield Foods |
Helzberg Diamonds | Norgine | Jaya Apparel, LLC | Wohali Outdoors | Sonoco Products |
Hostess Brands | Novartis Pharma Services | Jenny Yoo Collections | Wolverine Worldwide | Southwire |
Huhtamaki | Nutracom, LLC | Jerry Leigh Entertainment | Xcel Brands | T.M. Cobb Company |
J. R. Simplot Company | Omega Pharma International NV | Jockey International | The Ames Companies, Inc | |
Jackson Family Wines | OPC Cultivation, LLC dba Firelands | John Paul Richard | Durable and Discrete Manufacturing | The Starco Group |
Jeneil Biotech, Inc. | Sandoz | Joseph Ribkoff | A.O. Smith | Thermos LLC |
Kelly Moore Paint Company, Inc | Smith & Nephew | Jump Design Group, Inc. | Actron Air | Tillamook |
Kingston Technology Company | Societe Philadelphia | Kontoor Brands, Inc | Amcor Rigid Plastics USA, LLC | Timken |
Le Creuset Group AG | Specialty Pharmaceutical/ Cardinal | La La Land Creative Company LLC | American Bath Group | Universal Fiber Systems |
Leatherman Tool Group, Inc. | Sunovion Pharmaceuticals, Inc. | Lacoste | Ancestry.com Inc. | Walzcraft |
Levolor | Thermo Fisher Scientific | Lacrosse Footwear | Avent, Inc | |
Marlow Foods Ltd | Land 'n Sea | Bell International Labs, Inc. | Wholesale Distribution | |
Marquez Brothers International | Retail & Apparel | Landau Uniform | Berlin Packaging LLC | American Hotel Register Company |
Mazoon Dairy Company SAOC | 5.11 Tactical | Legendary Whitetails | Bio-Medical Devices International | Balkamp, Inc. |
Melissa and Doug | A+ School Apparel | Liz Claiborne | Briggs & Stratton | ChemPoint |
Mercy Health Care | Accent Décor | Lord Daniel Sportswear | Busch-Transou, L.C. | CHF Industries |
MGA Entertainment | Aeropostale | Lucky Zone | BWAY Corporation | Dealer Tire |
Mizuno USA | AGS Sports, Inc. | Manhattan Beachwear, LLC | Charter Manufacturing Company, Inc | Fastenal Company |
Moen | Aktieselskabet AF | Men's Wearhouse | Cintas Corporation | Fintyre S.p.A. |
Mondelez International | Alberto Makali | Mix Limited | Clarios | Groupe Seb Holdings |
Neatfreak | American Textile | New Era Cap Co., Inc. | Conduit Del Ecaudor | Johnstone Supply |
Nestle | Americo Group, Inc | Orchard Brands | Cooper Lighting, LLC | Mayoreo Ferreteria y Acabados S.A |
Peet's Coffee, Inc. | Asics | Orvis | Cycles Lambert, Inc. | Screwfix |
Polaris Industries | BBC International | Patagonia | Dassault Falcon Jet | Southern Eagle Distributing, LLC |
Procter & Gamble | Bernard Cap Co., Inc. | Peds Legwear | Dole Fresh Vegetables, Inc. | Standard Motor Products |
Ranir, LLC | Big Lots! | PVH Corp. | Ficosota Ltd., Ital Food S.A. | The Gem Group, Inc. |
Reckitt Benckisen | Billabong International Unlimited | Quality Worldwide | FillTech USA | Trelleborg Wheel Systems |
Rockline Industries | Bioworld Merchandising | Randa Accessories | Freedom Foods Group Ltd | US Autoforce |
Sargent and Greenleaf, Inc. | Bluestem, Inc. | Rawlings Sporting Goods | Gardner-White Furniture | |
Sazerac Company | Bobs Discount Furniture | Red Wing Shoe Company | Groupo Herdez | |
Stanley Black & Decker | Boots UK, Ltd. | Renfro | Heli Biotech, LLC | |
11
Sunny Delight Beverages Company | Broder Brothers | Rhone Apparel, Inc | Hooker Furniture | |
Taylor Fresh Foods | Brooks Brothers Group, Inc. | Rocky Brands | Husqvarna AB | |
Tillamook County Creamery Association | C&A Mexico | Siemens Medical Solutions Diagnostics | Hy-Ko Products | |
We do not have a customer who accounted for more than 10% of fiscal 2020 revenues. We typically experience a slight degree of seasonality, reflected in a slowing of services revenues during the annual winter holiday season, which occurs in the third quarter of our fiscal year. We are not reliant on government-sector customers.
Integrated System Design
While customers can use our software applications individually, we have designed them to be combined as integrated systems to meet unique customer requirements. Customers may select virtually any combination of components to form an integrated solution for a particular business problem. The license or subscription for this solution could range from one single module to a multi-module, multiple-user solution incorporating our full range of products.
Customers frequently require services beyond those provided by our standard support/maintenance agreement. To meet those customers’ needs, our separate professional services team provides specialized business and software implementation consulting, development and configuration, system-to-system interfacing and extensive training and certification. We offer these services, frequently referred to as “systems integration services,” for an additional fee, normally under a separate contract based upon time and materials utilized.
Sales and Marketing
We market our products globally through direct and indirect sales channels. We conduct our principal sales and marketing activities from our corporate headquarters in Atlanta, Georgia, and have North American sales and/or support offices in Boston, Chicago, Dallas, Indianapolis, New York, St. Louis, Miami, Pittsburgh and San Diego. We manage sales and/or support outside of North America from our international offices in the United Kingdom, Sweden, Germany, India, New Zealand and Australia.
In addition to our direct sales force, we have developed a network of VARs who assist in selling our products globally. We will continue to utilize these and future relationships with software and service organizations to enhance our sales and marketing position. Currently located in North America, South America, Mexico, Europe, South Africa, and the Asia/Pacific region, these independent distributors and resellers distribute our product lines domestically and in foreign countries. These vendors typically sell their own consulting and systems integration services in conjunction with contracts for our products. Our global distribution channel consists of approximately 23 organizations with sales, implementation and support resources serving customers in more than 80 countries.
We support our sales activities with a variety of marketing efforts, including public relations, direct marketing, advertising, trade shows, product seminars, industry speakers, user conferences and ongoing customer communication and industry analyst programs. We also participate in industry conferences such as those organized by the Association for Supply Chain Management, the Council of Supply Chain Management Professionals, and the Institute of Business Forecasting.
12
Subscriptions and Licenses
Like many other business application software companies, our software revenue has consisted principally of fees generated from licensing our software products. In exchange for the payment of license fees, we typically grant non-exclusive, nontransferable, perpetual licenses, which typically are specific to particular business segments and users and geographically restricted. However, a growing portion of our product revenue is now coming from SaaS subscription contracts. Our typical initial subscription is three to five years.
Our standard agreements contain provisions designed to prevent disclosure and unauthorized use of our software. In these agreements, we warrant that our products will function in accordance with the specifications set forth in our product documentation.
The prices for our products are typically based on the depth of functionality, number of business processes, users and sites for which the solution is deployed.
Customer Service and Support
We provide the following services and support to our customers:
Cloud and Managed Services. We offer our customers the option to deploy our solutions in a SaaS, hosted or on-premise model. Our Cloud Services offer companies a choice of deployment methodology and services that best suit their individual needs and allow them to evolve as their business changes, moving between SaaS, on-premise, and managed services as their IT strategies transform. Managed Services leverage our resources to assist and augment the customer’s technical and operational needs on a day-to-day basis. Furthermore, we provide operations services to a subset of customers for which we operate the solution on a daily basis in support of their supply chain operations.
Implementation Support. We offer our customers a professional and proven program that facilitates rapid implementation of our software products. Our consultants help customers define the nature of their project and proceed through the implementation process. We offer training for all users and managers. We first establish measurable financial and logistical performance indicators and then evaluate them for conformance during and after implementation. Additional services beyond implementation may include post-implementation reviews and benchmarks to further enhance the benefits to customers.
Implementation; General Training Services and Certification. We offer our customers post-delivery professional services consisting primarily of implementation and training services, for which we typically charge on a daily basis. Customers that invest in implementation services receive assistance in integrating our solution with existing enterprise software applications and databases. Implementation of our products typically requires three to nine months, depending on factors such as the complexity of a customer’s existing systems, breadth of functionality, number of business units and team of users. Additional training and user certification services can help our customers gain even greater benefits from our robust planning platform.
Product Maintenance and Updates; Support Services. We provide our customers with ongoing product support services. Typically, these services are included in subscription fees. For licenses, we enter into support or maintenance contracts with customers for an initial one- to three-year term, billed annually in advance, at the time of the product license, with renewal for additional periods thereafter. Under these contracts, we provide telephone consulting, product updates and releases of new versions of products previously purchased by the customer, as well as error reporting and correction services. We provide ongoing support
13
and maintenance services on a seven-days-a-week, 24-hours-a-day basis through telephone, email and web-based support, using a call logging and tracking system for quality assurance.
Research and Development
Our future success depends in part upon our ability to continue to enhance existing products, respond to changing customer requirements, develop and introduce new products, and keep pace with technological developments and emerging industry standards. We focus our development efforts on several areas, including, but not limited to, enriching artificial intelligence, machine learning and advance analytics platforms, in-memory computing, and adding functionality to existing products. These development efforts will continue to focus on deploying applications within a complex global supply chain landscape. Our cloud-architected solutions designed for SaaS deployment with MDM built in will be increasingly important for our long-term growth. As of April 30, 2020, we employed 167 persons (employees and full-time contractors) in product research, development and enhancement activities.
Competition
Our competitors are diverse and offer a variety of solutions targeted at various aspects of the supply chain, retail and general enterprise application markets. Our existing competitors include, but are not limited to:
• | Large ERP application software vendors such as SAP, Oracle and Infor, each of which offers sophisticated ERP solutions that currently, or may in the future, incorporate supply chain management, advanced planning and scheduling, warehouse management, transportation, collaboration or sales and operations planning software components; |
• | Vendors focusing on the supply chain application software market, including, but not limited to, Blue Yonder (formerly JDA), o9 Solutions, Kinaxis and OM Partners; |
• | Other business application software vendors that may broaden their product offerings by internally developing, acquiring or partnering with independent developers of supply chain management software; and |
• | Internal development efforts by corporate information technology departments. |
We also expect to face additional competition as other established and emerging companies enter the market for advanced retail planning and supply chain management software and/or introduce new products and technologies. In addition, current and potential competitors have made and may continue to make strategic acquisitions or establish cooperative relationships among themselves or with third parties, thereby increasing the ability of their products to address the needs of our prospective customers. Accordingly, it is possible that new competitors or alliances may emerge and rapidly gain significant market share. Increased competition could result in fewer customer orders, reduced gross margins and loss of market share.
The principal competitive factors in the target markets in which we compete include product functionality and quality, domain expertise, integration technologies, product suite integration, breadth of products, and related services such as customer support, training and implementation. Other factors important to customers and prospects include:
• | customer service and satisfaction; |
• | ability to provide relevant customer references; |
• | compliance with industry-specific requirements and standards; |
• | flexibility to adapt to changing business requirements; |
• | ability to generate business benefits; |
• | rapid payback and measurable return on investment; |
• | vendor financial stability and company and product reputation; and |
14
• | initial price, cost to implement and long term total cost of ownership. |
Many of our competitors and potential competitors have a broader worldwide presence, significantly greater financial, technical, marketing and other resources, greater name recognition, and a larger installed base of customers than we have. Some competitors have become more aggressive with their prices, payment terms and contractual implementation terms or guarantees. In order to be successful in the future, we must continue to develop innovative software solutions and respond promptly and effectively to technological change and competitors’ innovations. We also may be forced to lower prices or offer other more favorable terms. Our competitors may be able to respond more quickly to new or emerging technologies and changes in customer requirements or devote greater resources to the development, promotion and sale of their products.
We believe that our principal competitive advantages are our comprehensive solution platform, our list of referenceable customers, the ability of our solutions to quickly generate business benefits for our customers, our substantial investment in product development, our deep domain expertise, the ease of use of our software products, our customer support and implementation services, our ability to deploy quickly, and our ability to deliver rapid return on investment for our customers.
Proprietary Rights and Licenses
Our success and ability to compete are dependent in part upon our proprietary technology. To protect this proprietary technology, we rely on a combination of copyright and trade secret laws, confidentiality obligations and other contractual provisions. However, these may afford only limited protection. In addition, effective copyright and trade secret protection may be unavailable or limited in certain foreign countries. Although we take advantage of the protection available through confidentiality and other contractual provisions and intellectual property laws, we also believe that factors such as the knowledge, ability, and experience of our personnel, new product developments, frequent product enhancements, reliable maintenance and timeliness and quality of support services are essential to establishing and maintaining a technology leadership position. The source code for our proprietary software is protected as a trade secret and as a copyrighted work. Generally, copyrights expire 95 years after the year of first publication. We enter into confidentiality or similar agreements with our employees, consultants and customers, control access to and distribution of our software, documentation and other proprietary information, and deliver only object code (compiled source code) to our licensed customers. In addition, we have registered a number of trademarks in the U.S. and internationally and have registration applications pending for others.
As is customary in the software industry, in order to protect our intellectual property rights, we do not sell or transfer title to our products to our customers. Although our license and subscription agreements place restrictions on the customer’s use of our products, unauthorized use nevertheless may occur.
Despite measures we have taken to protect our proprietary rights, unauthorized parties may attempt to reverse engineer or copy aspects of our products or obtain and use information that we regard as proprietary. Monitoring unauthorized use of our products is difficult and expensive. In addition, litigation may be necessary in the future to enforce our intellectual property rights, to protect our trade secrets, to determine the validity and scope of the proprietary rights of others, or to defend against claims of infringement or invalidity. Such litigation could result in substantial costs and diversion of resources and could have a material adverse effect on our business, operating results and financial condition.
15
In the future, we may increasingly be subject to claims of intellectual property infringement as the number of products and competitors in our industry segment grows and the functionality of products in different industry segments overlaps. Although we are not aware that any of our products infringe upon the proprietary rights of third parties, there can be no assurance that third parties will not claim infringement by us with respect to current or future products. In addition, we may initiate claims or litigation against third parties for infringement of our proprietary rights or to establish the validity of our proprietary rights. Any such claims against us, with or without merit, as well as claims initiated by us against third parties, can be time consuming and expensive to defend, prosecute or resolve. Moreover, an adverse outcome in litigation or similar adversarial proceedings could subject us to significant liabilities to third parties, require the expenditure of significant resources to develop non-infringing technology, require a substantial amount of attention from management, require disputed rights to be licensed from others, require us to enter into royalty arrangements or require us to cease the marketing or use of certain products, any of which would have a material adverse effect on our business, operating results and financial condition. To the extent that we desire or are required to obtain licenses to patents or proprietary rights of others, there can be no assurance that any such licenses will be made available on terms acceptable to us, if at all.
We have re-licensed, and expect in the future to re-license, certain software from third parties for use in connection with our products. There can be no assurance that these third-party software vendors will not change their product offerings or that these software licenses will continue to be available to us on commercially reasonable terms, if at all. The termination of any such licenses or product offerings, or the failure of the third-party licensor's to adequately maintain or update their products, could result in delays in our ability to deliver certain of our products while we seek to implement technology offered by alternative sources. Any required replacement licenses could prove costly. Further, any such delay, if it becomes extended, could result in a material adverse effect on our results of operations.
Employees
As of April 30, 2020, we had 428 full-time employees, including 97 in product research, development and enhancement, 37 in customer support, 164 in professional services, 89 in marketing, sales and sales support, and 41 in accounting, facilities and administration. We believe that our continued success will depend in part on our ability to continue to attract and retain highly skilled technical, marketing and management personnel, who may be in great demand. We believe our employee relations are good. We have never had a work stoppage and no employees are represented under collective bargaining arrangements. We do not tolerate harassment or bullying of or discrimination against any of our employees by other employees (whether supervisors or colleagues) or non–employees. Any form of harassment or discrimination, including, but not limited to, that which is related to an individual’s race, color, religion, sex, gender identity, sexual orientation, national origin, genetics, citizenship status, pregnancy, age, disability, veteran status, or political opinions, and any form of bullying, is a violation of our policy and is treated as a disciplinary matter.
We support and encourage continuous learning and training for all employees. Employees are trained on job–specific requirements, as well as topics such as cybersecurity, data privacy, harassment and bullying.
Data Privacy
Regulatory and legislative activity in the areas of data protection and privacy continues to increase worldwide. We have established and continue to maintain policies to comply with applicable privacy and data protection laws. We also ensure that third parties processing personal data on our behalf are contractually obligated to follow or are otherwise compliant with such laws.
16
We are subject to certain privacy and data protection laws in other countries in which we operate, many of which are stricter than those in the United States. Some countries also have instituted laws requiring in–country data processing and/or in-country storage of data. Most notably, in the European Union (“EU”), the General Data Protection Regulation (“GDPR”) creates legal and compliance obligations for companies that process personal data of individuals in the EU, regardless of the geographical location of the company, and imposes significant fines for non-compliance. We process a limited amount of personal data (as defined under the GDPR) for our customers and act as a data controller with respect to the personal data of our employees and job applicants. Therefore, we have made changes to our privacy policies to comply with the GDPR. In addition, we have self-certified to the EU-U.S. and Swiss-U.S. Privacy Shield Frameworks as the primary method for transferring personal data from Europe to the United States.
In the United States, the California Consumer Privacy Act (“CCPA”) now requires us to offer certain specific data privacy rights to California residents. Other states have adopted or are considering similar requirements that may be more stringent and/or expansive than federal requirements. Our privacy policies are compliant with the CCPA and other existing state laws.
Data Security
Information Security Management. Our Software Security Program is managed by our Cybersecurity Manager, who reports to the Chief Information Officer. We conduct vendor and internal risk assessments at least annually. Our Security Incident Response Team, consisting of personnel from Legal, Human Resources, Marketing, and IT across our business units, is responsible for implementing our Incident Response Policy and Procedure, which includes processes for detection, analysis, containment, eradication, and recovery, as well as an annual tabletop exercise.
Our employees are regularly trained on appropriate security measures. We provide security awareness training for new hires, and for all employees at least quarterly. We conduct user testing through “phishing” campaigns and require remedial training based on results. Our Cybersecurity Manager produces a monthly security awareness newsletter and periodic updates on recent malicious information security trends and scams.
The Service Organization Control (SOC) 2 Type II examination demonstrates that an independent accounting and auditing firm has reviewed and examined an organization’s control objectives and activities, and tested those controls to ensure that they are operating effectively. The Company obtains a SOC 2 Type II report annually from an independent third party audit. The third party examines the suitability of the design and operating effectiveness as of ASI's controls to provide reasonable assurance that ASI's service commitments and system requirements were achieved based on the applicable trust services criteria for security, availability, processing integrity and confidentiality.
Customer Data Security. We have web application firewalls and data encryption (both in transit and at rest) to ensure that our customer data is adequately protected. Our software applications undergo manual code reviews, static code analysis to test for vulnerabilities, and annual third-party penetration testing, with a formal change control process in place to correct any deficiencies. Our SaaS environments are safeguarded by vulnerability management software that detects OS and third-party application vulnerabilities; applies vulnerability patching on a monthly basis; and ensures emergency patching of critical vulnerabilities. Data security is monitored with fully-integrated SIEM (Security Information and Event Management) software, and we provide 24/7 security monitoring and alerting for all SaaS customer environments. Only approved users may access our SaaS environments, and such access is further controlled through two-factor authentication and quarterly access reviews.
17
Data in our cloud based solutions is hosted in a Microsoft Azure environment. Microsoft provides numerous security measures, including geo-redundant storage (GRS) with cross-regional replication for storage of backup data, and site recovery that replicates VMs in real-time to a different Azure region.
Business Continuity and Disaster Recovery. We have a documented Disaster Recovery Procedure and Business Continuity Plan. Key actions and responsibilities are handled by a designated Disaster Recovery Team and Emergency Management Team, respectively. The policies and procedures are reviewed, updated, and approved by executive management annually, and a Business Impact Analysis performed as part of our Business Continuity Plan.
Sustainability in Data Operations
We are continuing to expand our use of Microsoft Azure for hosting customer SaaS environments as well as some internal operations. Microsoft engaged WSP, a global consultancy with expertise in environmental and sustainability issues, to model the environmental impact of using Microsoft Cloud services instead of on-premise deployments. WSP found that Microsoft Cloud services are up to 93 percent more energy efficient and up to 98 percent more carbon efficient than traditional enterprise data centers.
Our Data Destruction & Sanitation Policy ensures proper disposal of media and data. Third parties perform secure destruction of media and we receive a certificate of secure destruction from such parties. Items for destruction or recycling are processed using an environmentally friendly waste-to-energy incineration process or e-Stewards® certified recycling process so that the information cannot be reconstructed.
Available Information
We make our annual reports on Form 10-K, quarterly reports on Form 10-Q, current reports on Form 8-K, and all amendments to these reports available free of charge on or through our website, located at http://www.amsoftware.com, as soon as reasonably practicable after they are filed with or furnished to the Securities and Exchange Commission ("SEC"). Reference to our website does not constitute incorporation by reference of the information contained on the site and should not be considered part of this document.
ITEM 1A. RISK FACTORS
A variety of factors may affect our future results and the market price of our stock.
We have included certain forward-looking statements in Management’s Discussion and Analysis of Financial Condition and Results of Operations and elsewhere in this Form 10-K. We may also make oral and written forward-looking statements from time to time, in reports filed with the SEC and otherwise. We undertake no obligation to revise or publicly release the results of any revisions to these forward-looking statements based on circumstances or events which occur in the future, unless otherwise required by law. Actual results may differ materially from those projected in any such forward-looking statements due to a number of factors, including those set forth below and elsewhere in this Form 10-K.
We operate in a dynamic and rapidly changing environment that involves numerous risks and uncertainties. New risk factors emerge from time to time, and it is not possible for management to predict all such risk factors, nor can it assess the potential impact of all such risk factors on our business or the extent to which any factor, or combination of factors, may cause actual results to differ materially from those in any forward-looking statements. The following section lists some, but not all, of the risks and uncertainties that we believe may have a material adverse effect on our business, financial condition, cash flow or results of operations. In that case, the trading price of our securities could decline and you may lose all or part of your investment in our Company. This section should be read in conjunction with the audited Consolidated Financial Statements and Notes thereto, and Management’s Discussion and Analysis of Financial Condition and Results of Operations included in this Form 10-K.
18
We cannot predict every event and circumstance that may affect our business, and therefore the risks and uncertainties discussed below may not be the only ones you should consider.
The risks and uncertainties discussed below are in addition to those that apply to most businesses generally. Furthermore, as we continue to operate our business, we may encounter risks of which we are not aware at this time. These additional risks may cause serious damage to our business in the future, the impact of which we cannot estimate at this time.
RISK FACTORS RELATED TO THE ECONOMY
The effects of the COVID-19 pandemic have materially affected how we and our customers are operating our businesses, and the duration and extent to which this will impact our future results of operations and overall financial performance remains uncertain.
In December 2019, a novel coronavirus disease, or COVID-19, was reported and in January 2020, the World Health Organization (“WHO”), declared it a Public Health Emergency of International Concern. On February 28, 2020, the WHO raised its assessment of the COVID-19 threat from high to very high at a global level due to the continued increase in the number of cases and affected countries, and on March 11, 2020, the WHO characterized COVID-19 as a pandemic. The COVID-19 pandemic, which has continued to spread, and the related adverse public health developments, including orders to shelter-in-place, travel restrictions, and mandated business closures, have adversely affected workforces, organizations, customers, economies, and financial markets globally, leading to an economic downturn and increased market volatility. It also has disrupted the normal operations of many businesses, including ours.
As a result of the COVID-19 pandemic, we have temporarily suspended all company-related travel unless absolutely necessary, and substantially all Company employees globally are encouraged to work from home for the foreseeable future. We have either canceled or changed employee, customer and industry events to dial-in experiences. We may deem it advisable to similarly alter, postpone or cancel entirely additional customer, employee or industry events in the future. All of these changes may disrupt the way we operate our business.
Moreover, the conditions caused by the COVID-19 pandemic may affect the rate of spending on our products and services, and could adversely affect our customers’ ability or willingness to purchase our offerings or the timing of our current or prospective customers’ purchasing decisions; require pricing discounts or extended payment terms; or increase customer attrition rates, all of which could adversely affect our future sales, operating results and overall financial performance.
Our operations also have begun to be affected by a range of external factors related to the COVID-19 pandemic that are not within our control. For example, many cities, counties, states, and even countries have imposed or may impose a wide range of restrictions on the physical movement of our employees, partners and customers to limit the spread of COVID-19. If the COVID-19 pandemic starts to have a substantial impact on the productivity of our employees, and partners or a continued and substantial impact on the attendance of our employees, or a continued and substantial impact on the ability of our customers to purchase our products and services, our results of operations and overall financial performance may be harmed.
The duration and extent of the impact of the COVID-19 pandemic depends on future developments that cannot be accurately predicted at this time, such as the severity and transmission rate of the virus, the extent and effectiveness of containment actions, the disruption caused by such actions, and the impact of these and other factors on our employees, customers, partners, vendors and the global economy. If we are not able to effectively respond to and manage the impact of such events, our business will be harmed.
To the extent that the COVID-19 pandemic adversely affects our business and financial results, it may also have the effect of heightening many of the other risks described in this “Risk Factors” section.
Disruptions in the financial and credit markets, international trade disputes, the COVID-19 pandemic and other external influences in the U.S. and global markets may reduce demand for our software and related services, which may negatively affect our revenues and operating results.
Our revenues and profitability depend on the overall demand for our software, professional services and maintenance services. Regional and global changes in the economy and financial markets, such as the severe global economic downturn in 2008, which was followed by a slow and relatively weak recovery, have resulted in companies generally reducing their spending for technology projects and therefore delaying or reconsidering potential purchases of our products and related services. Adverse conditions in credit markets, lagging consumer confidence and spending, the fluctuating cost of fuel and commodities and their effects on the U.S. and global economies and markets are examples of negative factors that have delayed or canceled certain potential customer purchases. Furthermore, the uncertainty posed by the long-term effects of conflicts in the Middle East, terrorist activities, the COVID-19 pandemic, related uncertainties and risks, and other geopolitical and trade issues may also adversely affect the purchasing decisions of current or potential customers. Weakness in European economies may adversely affect demand for our products and services, both directly and by affecting U.S. customers that rely heavily on European sales. There can be no assurance that government responses to the disruptions in the financial markets, international
19
trade disputes, the COVID-19 pandemic or weakened economies will sufficiently restore confidence, stabilize markets or increase liquidity and the availability of credit.
We are a technology company selling technology-based solutions with total pricing, including software and services, in many cases exceeding $500,000. Reductions in the capital budgets of our customers and prospective customers could have an adverse impact on our ability to sell our solutions. These economic, trade, public health and political conditions may reduce the willingness or ability of our customers and prospective customers to commit funds to purchase our products and services or renew existing post-contract support agreements, or their ability to pay for our products and services after purchase. Future declines in demand for our products or services, or a broadening or protracted extension of these conditions, would have a significant negative impact on our revenues and operating results.
There may be an increase in customer bankruptcies due to weak economic conditions.
We have been in the past, and may be in the future, affected by customer bankruptcies that occur in periods subsequent to the software license sale. During weak economic conditions there is an increased risk that some of our customers will file a petition for bankruptcy. When our customers file a petition for bankruptcy, we may be required to forego collection of pre-petition amounts owed and to repay amounts remitted to us during the 90-day preference period preceding the filing. Accounts receivable balances related to pre-petition amounts may in some of these instances be large, due to extended payment terms for software license fees and significant billings for consulting and implementation services on large projects. The bankruptcy laws, as well as the specific circumstances of each bankruptcy, may severely limit our ability to collect pre-petition amounts, and may force us to disgorge payments made during the 90-day preference period. We also face risk from international customers that file for bankruptcy protection in foreign jurisdictions, as the application of foreign bankruptcy laws may be more difficult to predict. Although we believe that we have sufficient reserves to cover anticipated customer bankruptcies, there can be no assurance that such reserves will be adequate, and if they are not adequate, our business, operating results and financial condition would be adversely affected. We anticipate the COVID-19 pandemic will increase the likelihood of these risks.
Changes in the value of the U.S. dollar, as compared to the currencies of foreign countries where we transact business, could harm our operating results.
Our international revenues and the majority of our international expenses, including the wages of some of our employees, are denominated primarily in currencies other than the U.S. dollar. Therefore, changes in the value of the U.S. dollar as compared to these other currencies may adversely affect our operating results. We do not hedge our exposure to currency fluctuations affecting future international revenues and expenses and other commitments. For the foregoing reasons, currency exchange rate fluctuations have caused, and likely will continue to cause, variability in our foreign currency denominated revenue streams and our cost to settle foreign currency denominated liabilities.
RISK FACTORS RELATED TO COMPETITION
Our markets are very competitive, and we may not be able to compete effectively.
The markets for our solutions are very competitive. The intensity of competition in our markets has significantly increased, in part as a result of the slow growth in investment in IT software. We expect this intensity of competition to increase in the future. Our current and potential competitors have made and may continue to make acquisitions of other competitors and may establish cooperative relationships among themselves or with third parties. Any significant consolidation among supply chain software companies could adversely affect our competitive position. Increased competition has resulted and, in the future, could result in price reductions, lower gross margins, longer sales cycles and loss of market share. Each of these developments could have a material adverse effect on our operating performance and financial condition.
Many of our current and potential competitors have significantly greater resources than we do, and therefore we may be at a disadvantage in competing with them.
We directly compete with other supply chain software vendors, including SAP SE, Oracle Corporation, Blue Yonder, o9 Solutions, Kinaxis, Inc., Infor, Inc. and others. Some of our current and potential competitors have significantly greater financial, marketing, technical and other competitive resources than we do, as well as greater name recognition and a larger installed base of clients. The software market has experienced significant consolidation, including numerous mergers and acquisitions. It is difficult to estimate what long-term effect these acquisitions will have on our competitive environment. We have encountered competitive situations where we suspect that large competitors, in order to encourage customers to purchase licenses of non-retail applications and gain retail market share, also have offered to license at no charge certain retail software applications that compete with our solutions. If competitors such as Oracle and SAP SE and other large private companies are willing to license their retail and/or other applications at no charge, this may result in a more difficult competitive environment for our products. In addition, we could face competition from large, multi-industry technology companies that historically have not offered an enterprise solution set to the retail supply chain market. We cannot guarantee that we will be able to compete successfully for customers against our current or future competitors, or that such competition will not have a material adverse effect on our business, operating results and financial condition. Also, some prospective buyers are reluctant to purchase
20
applications that could have a short lifespan, as an acquisition could result in the application’s life being abruptly cut short. In addition, increased competition and consolidation in these markets is likely to result in price reductions, reduced operating margins and changes in market share, any one of which could adversely affect us. If customers or prospects want fewer software vendors, they may elect to purchase competing products from a larger vendor than us since those larger vendors offer a wider range of products. Furthermore, some of these larger vendors, such as Oracle, may be able to bundle their software with their database applications, which underlie a significant portion of our installed applications. When we compete with these larger vendors for new customers, we believe that these larger businesses often attempt to use their size as a competitive advantage against us.
Many of our competitors have well-established relationships with our current and potential clients and have extensive knowledge of our industry. As a result, they may be able to adapt more quickly to new or emerging technologies and changes in client requirements or devote greater resources to the development, promotion and sale of their products than we can. Some competitors have become more aggressive with their prices and payment terms and issuance of contractual implementation terms or guarantees. In addition, third parties may offer competing maintenance and implementation services to our customers and thereby reduce our opportunities to provide those services. We may be unable to continue to compete successfully with new and existing competitors without lowering prices or offering other favorable terms. Furthermore, potential customers may consider outsourcing options, including application service providers, data center outsourcing and service bureaus, as alternatives to licensing our software products. Any of these factors could materially impair our ability to compete and have a material adverse effect on our operating performance and financial condition.
We also face competition from the corporate IT departments of current or potential customers capable of internally developing solutions and we compete with a variety of more specialized software and services vendors, including:
• | Internet (on demand) software vendors; |
• | single-industry software vendors; |
• | enterprise resource optimization software vendors; |
• | human resource management software vendors; |
• | financial management software vendors; |
• | merchandising software vendors; |
• | services automation software vendors; and |
• | outsourced services providers. |
As a result, the market for enterprise software applications has been and continues to be intensely competitive. We expect competition to persist and continue to intensify, which could negatively affect our operating results and market share.
Due to competition, we may change our pricing practices, which could adversely affect operating margins or customer ordering patterns.
The intensely competitive markets in which we compete can put pressure on us to reduce our prices. If our competitors offer deep discounts on certain products or services in an effort to recapture or gain market share or to sell other products or services, we may need to lower prices or offer other favorable terms in order to compete successfully. For these and other reasons, in the future we may choose to make changes to our pricing practices. For example, we may offer additional discounts to customers; increase (or decrease) the use of pricing that involves periodic fees based on the number of users of a product; or change maintenance pricing. Such changes could materially and adversely affect our margins, and our revenues may be negatively affected if our competitors are able to recapture or gain market share.
RISK FACTORS RELATED TO OUR OPERATIONS
Our growth is dependent upon the successful further development of our direct and indirect sales channels.
We believe that our future growth will depend on developing and maintaining successful strategic relationships with systems integrators and other technology companies. Our strategy is to continue to increase the proportion of customers served through these indirect channels, so we are currently investing, and plan to continue to invest, significant resources to develop them. This investment could adversely affect our operating results if these efforts do not generate sufficient license, subscription and service revenue to offset our investment. Also, our inability to partner with other technology companies and qualified systems integrators could adversely affect our results of operations. Because lower unit prices are typically charged on sales made through indirect channels, increased indirect sales could reduce our average selling prices and result in lower gross margins. In addition, sales of our products through indirect channels will likely reduce our consulting service revenues, as third-party systems integrators generally provide these services. As indirect sales increase, our direct contact with our customer base will decrease, and we may have more difficulty accurately forecasting sales, evaluating customer satisfaction and recognizing emerging customer requirements. In addition, these systems integrators and third-party software providers may develop, acquire or market products competitive with our products. Our strategy of marketing our products directly to customers and indirectly
21
through systems integrators and other technology companies may result in distribution channel conflicts. Our direct sales efforts may compete with those of our indirect channels and, to the extent that different systems integrators target the same customers, systems integrators also may come into conflict with each other. Any channel conflicts that develop may have a material adverse effect on our relationships with systems integrators or harm our ability to attract new systems integrators.
We are dependent upon the retail industry for a significant portion of our revenues.
Historically, we have derived a significant percentage of our revenues from the sale of software products and collaborative applications that address vertical market opportunities with manufacturers and wholesalers that supply retail customers. The success of our customers is directly linked to economic conditions in the retail industry, which in turn are subject to intense competitive pressures and are affected by overall economic conditions. In addition, we believe that the acquisition of certain of our software products involves a large capital expenditure, which is often accompanied by large-scale hardware purchases or other capital commitments. As a result, demand for our products and services could decline in the event of instability or potential downturns in our customers’ industries.
Due to the COVID-19 pandemic, among other factors, we expect the retail industry to remain relatively cautious in its level of investment in IT when compared to other industries. We are concerned about weak and uncertain economic conditions, consolidations and the disappointing results of retailers in certain markets, especially if such weak economic conditions persist for an extended period of time. Weak and uncertain economic conditions have negatively affected our revenues in the past and may do so in the future, particularly due to the impact of the COVID-19 pandemic, including potential deterioration of our maintenance revenue base as customers look to reduce their costs, elongation of our selling cycles, and reduction in the demand for our products. As a result, it is difficult in the current economic environment to predict exactly when specific sales will close. In addition, weak and uncertain economic conditions could impair our customers’ ability to pay for our products or services. We also believe the retail business transformation from retail brick-and-mortar to technology-enabled omni-channel commerce models will be a multi-year trend. Consequently, we cannot predict when the disruption from the COVID-19 pandemic or the transformation to new commerce models may moderate or end. Any of these factors could adversely affect our business, our quarterly or annual operating results and our financial condition.
We have observed that as the retail industry consolidates it is experiencing increased competition in certain geographic regions that could negatively affect the industry and our customers’ ability to pay for our products and services. Such consolidation has negatively impacted our revenues in the past and may continue to do so in the future, which may reduce the demand for our products, and may adversely affect our business, operating results and financial condition.
We may derive a significant portion of our revenues in any quarter from a limited number of large, non-recurring sales.
From time to time, we expect to continue to experience large, individual customer sales, which may cause significant variations in quarterly fees. We also believe that purchasing our products is relatively discretionary and generally involves a significant commitment of a customer’s capital resources. Therefore, a downturn in any customer’s business, including due to the COVID-19 pandemic, could result in order cancellations that could have a significant adverse impact on our revenues and quarterly results. Additionally, our customers may request flexibility in payment terms as a result of the impact of COVID-19 on their businesses, which would also have a significant adverse impact on our revenues and quarterly results. Moreover, continued uncertainty about general economic conditions could precipitate significant reductions in corporate spending for IT, which could result in delays or cancellations of orders for our products.
Our lengthy sales cycle makes it difficult to predict quarterly revenue levels and operating results.
Because fees for our software products are substantial and the decision to purchase our products typically involves members of our customers’ senior management, the sales process for our solutions is lengthy. Accordingly, the timing of our revenues is difficult to predict, and the delay of an order could cause our quarterly revenues to fall substantially below our expectations and those of public market analysts and investors. Moreover, to the extent that we succeed in shifting customer purchases away from individual software products and toward more costly integrated suites of software and services, our sales cycle may lengthen further, which could increase the likelihood of delays and cause the effect of a delay to become more pronounced. Delays in sales could cause significant shortfalls in our revenues and operating results for any particular period. Also, it is difficult for us to forecast the timing and recognition of revenues from sales of our products because our existing and prospective customers often take significant time evaluating our products before purchasing them. The period between initial customer contact and a purchase by a customer could be nine months or longer. During the evaluation period, prospective customers may decide not to purchase or may scale down proposed orders of our products for various reasons, including:
• | reduced demand for enterprise software solutions; |
• | introduction of products by our competitors; |
• | lower prices offered by our competitors; |
• | changes in budgets and purchasing priorities; |
22
• | increased time to obtain purchasing approval; and |
• | reduced need to upgrade existing systems. |
In addition, as a result of the COVID-19 pandemic, many local governments as well as our existing and prospective customers have limited travel, frozen discretionary spending and furloughed staff. As a result, the sales process is likely to become more lengthy and difficult.
Furthermore, our existing and prospective customers routinely require education regarding the use and benefits of our products. This may also lead to delays in receiving customers’ orders.
We derive a significant portion of our services revenues from a small number of customers. If these customers were to discontinue the usage of our services or delay their implementation our total revenues would be adversely affected.
We derive a significant portion of our services revenues from a small number of customers using our services for product enhancement and other optional services. If these customers were to discontinue or delay the usage of these services, or obtain these services from a competitor, our services revenues and total revenues would be adversely affected. Customers may delay or terminate implementation of our services due to budgetary constraints related to economic uncertainty, dissatisfaction with product quality, the difficulty of prioritizing numerous IT projects, changes in business strategy, personnel or priorities, or for other reasons. Customers may be less likely to invest in additional software in the future or continue to pay for software maintenance. Since our business relies to a large extent upon sales to existing customers and since maintenance and services revenues are key elements of our revenue base, any reduction in these sales or these maintenance and services payments could have a material adverse effect on our business, results of operations, cash flows and financial condition.
Services revenues carry lower gross margins than license revenues and an overall increase in services revenues as a percentage of total revenues could have an adverse impact on our business.
Because our service revenues have lower gross margins than do our license or subscription revenues, an increase in the percentage of total revenues represented by service revenues or a change in the mix between services that are provided by our employees versus services provided by third-party consultants could have a detrimental impact on our overall gross margins and could adversely affect operating results.
If our customers elect not to renew maintenance contracts after the initial maintenance period and the loss of those customers is not offset by new maintenance customers, our maintenance revenues and total revenues would be adversely affected.
Upon the purchase of a software license, our customers typically enter into a maintenance contract with a term from approximately one to three years. If, after this initial maintenance period, customers elect not to renew their maintenance contracts and we do not offset the loss of those customers with new maintenance customers as a result of new license fees, our maintenance revenues and total revenues would be adversely affected.
If accounting interpretations relating to revenue recognition change or companies we acquire have applied such standards differently than we do or have not applied them at all, our reported revenues could decline or we could be forced to make changes in our business practices or we may incur the expense and risks associated with an audit or restatement of the acquired company’s financial statements.
There are several accounting standards and interpretations covering revenue recognition for the software industry. These standards address software revenue recognition matters primarily from a conceptual level and do not include specific implementation guidance. We believe that we currently comply with these standards.
The accounting profession and regulatory agencies continue to discuss various provisions of these pronouncements with the objective of providing additional guidance on their application and potential interpretations. These discussions and the issuance of new interpretations could lead to unanticipated changes in our current revenue accounting practices, which could change the timing of recognized revenue. They also could drive significant adjustments to our business practices, which could result in increased administrative costs, lengthened sales cycles and other changes that could adversely affect our reported revenues and results of operations. In addition, companies we acquire historically may have interpreted software revenue recognition rules differently than we do or may not have been subject to U.S. GAAP as a result of reporting in a foreign country. If we discover that companies we have acquired have interpreted and applied software revenue recognition rules differently than prescribed by U.S. GAAP, we could be required to devote significant management resources, and incur the expense associated with an audit, restatement or other examination of the acquired companies’ financial statements.
Our future growth depends upon our ability to develop and sustain relationships with complementary vendors to market and implement our software products, and a failure to develop and sustain these relationships could have a material adverse effect on our operating performance and financial condition.
23
We are developing, maintaining and enhancing significant working relationships with complementary vendors, such as software companies, consulting firms, resellers and others that we believe can play important roles in marketing our products and solutions. We are currently investing, and intend to continue to invest, significant resources to develop and enhance these relationships, which could adversely affect our operating margins. We may be unable to develop relationships with organizations that will be able to market our products effectively. Our arrangements with these organizations are not exclusive, and in many cases may be terminated by either party without cause. Many of the organizations with which we are developing or maintaining marketing relationships have commercial relationships with our competitors. There can be no assurance that any organization will continue its involvement with us. The loss of relationships with such organizations could materially and adversely affect our operating performance and financial condition.
Failure to maintain our margins and service rates for implementation services could have a material adverse effect on our operating performance and financial condition.
A significant portion of our revenues is derived from implementation services. If we fail to scope our implementation projects correctly, our services margins may suffer. We bill for implementation services predominately on an hourly or daily basis (time and materials) and sometimes under fixed price contracts, and we generally recognize revenue from those services as we perform the work. If we are not able to maintain the current service rates for our time and materials implementation services and cannot make corresponding cost reductions, or if the percentage of fixed price contracts increases and we underestimate the costs of our fixed price contracts, our operating performance may suffer. The rates we charge for our implementation services depend on a number of factors, including:
• | perceptions of our ability to add value through our implementation services; |
• | complexity of services performed; |
• | competition; |
• | pricing policies of our competitors and of systems integrators; |
• | use of globally sourced, lower-cost service delivery capabilities within our industry; and |
• | economic, political and market conditions. |
Our past and future acquisitions may not be successful and we may have difficulty integrating acquisitions.
We continually evaluate potential acquisitions of complementary businesses, products and technologies. We have in the past acquired and invested, and may continue to acquire or invest, in complementary companies, products and technologies, and enter into joint ventures and strategic alliances with other companies. Acquisitions, joint ventures, strategic alliances, and investments present many risks, and we may not realize the financial and strategic goals that were contemplated at the time of any transaction. Risks commonly encountered in such transactions include:
• | risk that an acquired company or assets may not further our business strategy or that we paid more than the company or assets were worth; |
• | difficulty of assimilating the operations and retaining and motivating personnel of an acquired company; |
• | risk that we may not be able to integrate acquired technologies or products with our current products and technologies; |
• | potential disruption of our ongoing business and the diversion of our management’s attention from other business concerns; |
• | inability of management to maximize our financial and strategic position through the successful integration of an acquired company; |
• | adverse impact on our annual effective tax rate; |
• | dilution of existing equity holders caused by capital stock issuance to the shareholders of an acquired company or stock option grants to retain employees of an acquired company; |
• | difficulty in maintaining controls, procedures and policies; |
• | potential adverse impact on our relationships with partner companies or third-party providers of technology or products; |
• | impairment of relationships with employees and customers; |
• | potential assumption of liabilities of our acquisition targets; |
• | significant exit or impairment charges if products acquired in business combinations are unsuccessful; and |
• | issues with product quality, product architecture, legal contingencies, product development issues, or other significant issues that may not be detected through our due diligence process. |
Accounting rules require the use of the purchase method of accounting in all new business acquisitions. Many acquisition candidates have significant intangible assets, so an acquisition of these businesses would likely result in significant amounts of goodwill and other intangible assets. The purchase method of accounting for business combinations may require large write-offs of any in-process research and development costs related to companies being acquired, as well as ongoing amortization costs for other intangible assets. Goodwill and certain other intangible assets are not amortized to income, but are
24
subject to impairment reviews at least annually. If the acquisitions do not perform as planned, future write-offs and charges to income arising from such impairment reviews could be significant. In addition, these acquisitions could involve acquisition-related charges, such as one-time acquired research and development charges. Such write-offs and ongoing amortization charges may have a significant negative impact on operating margins and net earnings in the quarter of the combination and for several subsequent years. We may not be successful in overcoming these risks or any other problems encountered in connection with such transactions.
Fully integrating an acquired company or business into our operations may take a significant amount of time. In addition, we may be able to conduct only limited due diligence on an acquired company’s operations. Following an acquisition, we may be subject to liabilities arising from an acquired company’s past or present operations, including liabilities related to data security, encryption and privacy of customer data, and these liabilities may not be covered by the warranty and indemnity provisions that we negotiate. We cannot assure you that we will be successful in overcoming these risks or any other problems encountered with acquisitions. To the extent we do not successfully avoid or overcome the risks or problems related to any acquisitions, our results of operations and financial condition could be adversely affected. Future acquisitions also could impact our financial position and capital needs, and could cause substantial fluctuations in our quarterly and yearly results of operations.
Our business may require additional capital.
We may require additional capital to finance our growth or to fund acquisitions or investments in complementary businesses, technologies or product lines. Our capital requirements may be influenced by many factors, including:
• | demand for our products; |
• | timing and extent of our investment in new technology; |
• | timing and extent of our acquisition of other companies; |
• | level and timing of revenue; |
• | expenses of sales and marketing and new product development; |
• | success and related expense of increasing our brand awareness; |
• | cost of facilities to accommodate a growing workforce; |
• | extent to which competitors are successful in developing new products and increasing their market shares; and |
• | costs involved in maintaining and enforcing intellectual property rights. |
To the extent that our resources are insufficient to fund our future activities, we may need to raise additional funds through public or private financing. However, additional funding, if needed, may not be available on terms attractive to us, or at all. Our inability to raise capital when needed could have a material adverse effect on our business, operating results and financial condition. If additional funds are raised through the issuance of equity securities, the percentage ownership of our company by our current shareholders would be diluted.
Business disruptions could affect our operating results.
A significant portion of our research and development activities and certain other critical business operations are concentrated in a few geographic areas. We are a highly automated business and a disruption or failure of our systems could cause delays in completing sales and providing services. A natural disaster, public health crisis such as the COVID-19 pandemic, or other catastrophic event such as fire, power loss, telecommunications failure, cyber-attack, war, or terrorist attack that results in the destruction or disruption of any of our critical business or IT systems could severely affect our ability to conduct normal business operations and, as a result, our future operating results could be materially and adversely affected.
To effectively mitigate this risk, we must continue to improve our operational, financial and management controls, and our reporting systems and procedures by, among other things, improving our key processes and IT infrastructure to support our business needs, and enhancing information and communication systems to ensure that our employees and offices around the world are well-connected, can effectively communicate with each other and our customers and employees can work remotely as appropriate.
Although we maintain crisis management and disaster response plans, in the event of a natural disaster, public health crisis or other catastrophic event, or if we fail to implement the improvements described above, we may be unable to continue our operations and may endure system interruptions, reputational harm, delays in our product development, lengthy interruptions in service, breaches of data security, and loss of critical data, all of which could have an adverse effect on our future operating results.
Our international operations and sales subject us to risks associated with unexpected activities outside of the United States.
The global reach of our business could cause us to be subject to unexpected, uncontrollable and rapidly changing events and circumstances in addition to those experienced within the United States. As we grow our international operations,
25
we may need to recruit and hire new consulting, product development, sales and marketing and support personnel in the countries in which we have or will establish offices or otherwise have a significant presence. Entry into new international markets typically requires the establishment of new marketing and distribution channels, and may involve the development and subsequent support of localized versions of our software. International introductions of our products often require a significant investment in advance of anticipated future revenues. In addition, the opening of a new office typically results in initial recruiting and training expenses and reduced labor efficiencies associated with the introduction of products to a new market. If we are less successful in a new market than we expect, we may not be able to realize an adequate return on our initial investment and our operating results could suffer. We cannot guarantee that the countries in which we operate will have a sufficient pool of qualified personnel from which to hire, that we will be successful at hiring, training or retaining such personnel or that we can expand or contract our international operations in a timely, cost-effective manner. If we have to downsize certain international operations, the costs to do so are typically much higher than downsizing costs in the United States. The following factors, among others, could have an adverse impact on our business and earnings:
• | failure to properly comply with foreign laws and regulations applicable to our foreign activities including, without limitation, software localization requirements; |
• | failure to properly comply with U.S. laws and regulations relating to the export of our products and services; |
• | compliance with multiple and potentially conflicting regulations in Europe, Asia and North America, including export requirements, tariffs, import duties and other trade barriers, as well as health and safety requirements; |
• | difficulties in managing foreign operations and appropriate levels of staffing; |
• | longer collection cycles; |
• | tariffs and other trade barriers, including the economic burden and uncertainty placed on our customers by the imposition and threatened imposition of tariffs by the U.S., China and perhaps other countries; |
• | seasonal reductions in business activities, particularly throughout Europe; |
• | reduced protection for intellectual property rights in some countries; |
• | proper compliance with local tax laws which can be complex and may result in unintended adverse tax consequences; |
• | anti-American sentiment due to conflicts in the Middle East and other American policies that may be unpopular in certain countries; |
• | localized spread of infection resulting from the COVID-19 pandemic, including any economic downturns and other adverse impacts. |
• | increasing political instability, adverse economic conditions and the potential for war or other hostilities in many of these countries; |
• | difficulties in enforcing agreements through foreign legal systems; |
• | fluctuations in exchange rates that may affect product demand and may adversely affect the profitability in U.S. dollars of products and services provided by us in foreign markets where payment for our products and services is made in the local currency, including any fluctuations caused by uncertainties relating to the United Kingdom’s exit from the European Union (“Brexit”); |
• | impact of Brexit on the United Kingdom’s access to the European Union Single Market, the related regulatory environment, the global economy and the resulting impact on our business, including the delay of execution of contracts by our customers; |
• | changes in general economic, health and political conditions in countries where we operate; |
• | potential labor strikes, lockouts, work slowdowns and work stoppages; and |
• | restrictions on downsizing operations in Europe and expenses and delays associated with any such activities. |
It may become increasingly expensive to obtain and maintain liability insurance.
Our products are often critical to the operations of our customers’ businesses and provide benefits that may be difficult to quantify. If our products fail to function as required, we may be subject to claims for substantial damages. Courts may not enforce provisions in our contracts that would limit our liability or otherwise protect us from liability for damages. Although we maintain general liability insurance coverage, including coverage for errors or omissions and cybersecurity risks, this coverage may not continue to be available on reasonable terms or in sufficient amounts to cover claims against us. In addition, our insurers may disclaim coverage as to any future claim. If claims exceeding the available insurance coverage are successfully asserted against us, or our insurers impose premium increases, large deductibles or co-insurance requirements on us, our business and results of operations could be adversely affected.
We contract for insurance to cover a variety of potential risks and liabilities, including those relating to the unexpected failure of our products. In the current market, insurance coverage for all types of risk is becoming more restrictive, and when insurance coverage is offered, the amount for which we are responsible is larger. In light of these circumstances, it may become more difficult to maintain insurance coverage at historical levels or, if such coverage is available, the cost to obtain or maintain it may increase substantially. This may result in our being forced to bear the burden of an increased portion of risks for which we have traditionally been covered by insurance, which could negatively impact our results of operations.
26
Adverse litigation results could affect our business.
We may be subject to various legal proceedings and claims involving customer, shareholder, employee, competitor and other issues. Litigation or other dispute resolution can be lengthy, expensive and disruptive to our operations, and results cannot be predicted with certainty. An adverse decision could result in monetary damages or injunctive relief that could affect our business, operating results or financial condition.
Growth in our operations could increase demands on our managerial and operational resources.
If the scope of our operating and financial systems and the geographic distribution of our operations and customers increase dramatically, this may increase demands on our management and operations. Our officers and other key employees will need to implement and improve our operational, customer support and financial control systems and effectively expand, train and manage our employee base.
Further, we may be required to manage an increasing number of relationships with various customers and other third parties. We may not be able to manage future expansion successfully, and our inability to do so could harm our business, operating results and financial condition.
Unanticipated changes in tax laws and effective tax rates, or adverse outcomes resulting from examination of our income or other tax returns could adversely affect our operating results and financial condition.
We are subject to income taxes in the U.S. and various foreign jurisdictions, and our domestic and international tax liabilities are subject to the allocation of expenses in differing jurisdictions. Changes to applicable tax laws (which may have retroactive application) could adversely affect us or holders of our common stock. In recent years, many changes have been made to applicable tax laws and changes are likely to continue to occur in the future. Our future effective tax rates could be subject to volatility or adversely affected by a number of factors, including:
• | changes in the valuation of our deferred tax assets and liabilities; |
• | expected timing and amount of the release of tax valuation allowances; |
• | expiration of, or detrimental changes in, research and development tax credit laws; |
• | tax effects of stock-based compensation; |
• | costs related to intercompany restructurings; |
• | changes in tax laws, regulations, accounting principles or interpretations thereof; and |
• | future earnings being lower than anticipated in countries where we have lower statutory tax rates and higher than anticipated earnings in countries where we have higher statutory tax rates. |
In addition, we may be subject to audits of our income and sales taxes by the Internal Revenue Service and foreign and state tax authorities. Outcomes from these audits could have an adverse effect on our operating results and financial condition.
RISK FACTORS RELATED TO OUR PRODUCTS
We may not be successful in convincing customers to migrate to current or future releases of our products, which may lead to reduced services and maintenance revenues and less future business from existing customers.
Our customers may not be willing to incur the costs or invest the resources necessary to complete upgrades to current or future releases of our products. This may lead to a loss of services and maintenance revenues and future business from customers that continue to operate prior versions of our products or choose to no longer use our products.
We depend on third-party technology which could result in increased costs or delays in the production and improvement of our products if it should become unavailable or if it contains defects.
We license critical third-party software that we incorporate into our own software products. We are likely to incorporate and include additional third-party software in our products and solutions as we expand our product offerings. The operation of our products would be impaired if errors occur in the third-party software that we utilize. It may be difficult for us to correct any defects in third-party software because the software is not within our control. Accordingly, our business could be adversely affected in the event of any errors in this software. There can be no assurance that these third parties will continue to make their software available to us on acceptable terms, invest the appropriate levels of resources in their products and services to maintain and enhance the capabilities of their software, or even remain in business. Further, due to the limited number of vendors of certain types of third-party software, it may be difficult for us to replace such third-party software if a vendor terminates our license of the software or our ability to license the software to customers. If our relations with any of these third-party software providers are impaired, and if we are unable to obtain or develop a replacement for the software, our business could be harmed. In addition, if the cost of licensing any of these third-party software products significantly increases, our gross margin levels could significantly decrease.
The use of open source software in our products may expose us to additional risks and harm our intellectual property.
27
Some of our products use or incorporate software that is subject to one or more open source licenses. Open source software is typically freely accessible, usable and modifiable. Certain open source software licenses require a user who intends to distribute the open source software as a component of the user’s software to disclose publicly part or all of the source code to the user’s software. In addition, certain open source software licenses require the user of such software to make any derivative works of the open source code available to others on unfavorable terms or at no cost. This can subject previously proprietary software to open source license terms.
While we monitor the use of all open source software in our products, processes and technology and try to ensure that no open source software is used in such a way as to require us to disclose the source code to the related product or solution, such use could inadvertently occur. Additionally, if a third-party software provider has incorporated certain types of open source software in software we license from such third party for our products and solutions, under certain circumstances we could be required to disclose the source code to our products and solutions. This could harm our intellectual property position and have a material adverse effect on our business, results of operations, cash flow and financial condition.
We may be unable to retain or attract customers if we do not develop new products and enhance our current products in response to technological changes and competing products.
As a software company, we have been required to migrate our products and services from mainframe to customer server to web-based environments. In addition, we have been required to adapt our products to emerging standards for operating systems, databases and other technologies. We will be unable to compete effectively if we are unable to:
• | maintain and enhance our technological capabilities to correspond to these emerging environments and standards; |
• | develop and market products and services that meet changing customer needs; or |
• | anticipate or respond to technological changes on a cost-effective and timely basis. |
A substantial portion of our research and development resources is devoted to product upgrades that address regulatory and support requirements. Only the remainder of our research and development resources is available for new products. New products require significant development investment. That investment is further constrained because of the added costs of developing new products that work with multiple operating systems or databases. We face uncertainty when we develop or acquire new products because there is no assurance that a sufficient market will develop for those products. If we do not attract sufficient customer interest in those products, we will not realize a return on our investment and our operating results will be adversely affected.
Our core products face competition from new or modified technologies that may render our existing technology less competitive or obsolete, reducing the demand for our products. As a result, we must continually redesign our products to incorporate these new technologies and to adapt our software products to operate on, and comply with evolving industry standards for, hardware and software platforms. Maintaining and upgrading our products to operate on multiple hardware and database platforms reduces our resources for developing new products. Because of the increased costs of developing and supporting software products across multiple platforms, we may need to reduce the number of those platforms. In addition, conflicting new technologies present us with difficult choices of which new technologies to adopt. If we fail to anticipate the most popular platforms, fail to respond adequately to technological developments, or experience significant delays in product development or introduction, our business and operating results will be negatively impacted.
In addition, to the extent we determine that new technologies and equipment are required to remain competitive, the development, acquisition and implementation of such technologies may require us to make significant capital investments. We may not have sufficient capital for these purposes and investments in new technologies may not result in commercially viable products. The loss of revenue and increased costs to us from such changing technologies would adversely affect our business and operating results.
If our products are not able to deliver quick, demonstrable value to our customers, our business could be seriously harmed.
Enterprises are requiring their application software vendors to provide faster returns on their technology investments. We must continue to improve our speed of implementation and the pace at which our products deliver value or our competitors may gain important strategic advantages over us. If we cannot successfully respond to these market demands, or if our competitors respond more successfully than we do, our business, results of operations and financial condition could be materially and adversely affected.
If we do not maintain software performance across accepted platforms and operating environments, our license, subscription and services revenue could be adversely affected.
The markets for our software products are characterized by rapid technological change, evolving industry standards, changes in customer requirements and frequent new product introductions and enhancements. We continuously evaluate new
28
technologies and implement advanced technology into our products. However, if in our product development efforts we fail to accurately address, in a timely manner, evolving industry standards, new technology advancements or important third-party interfaces or product architectures, sales of our products and services will suffer.
Market acceptance of new platforms and operating environments may require us to undergo the expense of developing and maintaining compatible product lines. We can license our software products for use with a variety of popular industry standard relational database management system platforms using different programming languages and underlying databases and architectures. There may be future or existing relational database platforms that achieve popularity in the marketplace and that may or may not be architecturally compatible with our software product design. In addition, the effort and expense of developing, testing, and maintaining software product lines will increase as more hardware platforms and operating systems achieve market acceptance within our target markets. Moreover, future or existing user interfaces that achieve popularity within the business application marketplace may or may not be architecturally compatible with our software product design. If we do not achieve market acceptance of new user interfaces that we support, or adapt to popular new user interfaces that we do not support, our sales and revenue may be adversely affected. Developing and maintaining consistent software product performance characteristics across all of these combinations could place a significant strain on our resources and software product release schedules, which could adversely affect revenues and results of operations.
Our software products and product development are complex, which makes it increasingly difficult to innovate, extend our product offerings, and avoid costs related to correction of program errors.
The market for our software products is characterized by rapid technological change, evolving industry standards, changes in customer requirements and frequent new product introductions and enhancements. For instance, existing products can become obsolete and unmarketable when vendors introduce products utilizing new technologies or new industry standards emerge. As a result, it is difficult for us to estimate the life cycles of our software products. There can be no assurance that we will successfully identify new product opportunities or develop and bring new products to the market in a timely and cost-effective manner, or that products, capabilities or technologies developed by our competitors will not render our products obsolete. Our future success will depend in part upon our ability to:
• | continue to enhance and expand our core applications; |
• | continue to sell our products; |
• | continue to successfully integrate third-party products; |
• | enter new markets and achieve market acceptance; and |
• | develop and introduce new products that keep pace with technological developments, satisfy increasingly sophisticated customer requirements and achieve market acceptance. |
Despite our testing, our software programs, like all software programs generally, may contain a number of undetected errors or “bugs” when we first introduce them or as new versions are released. We do not discover some errors until we have installed the product and our customers have used it. Errors may result in the delay or loss of revenues, diversion of software engineering resources, material non-monetary concessions, negative media attention, or increased service or warranty costs as a result of performance or warranty claims that could lead to customer dissatisfaction, resulting in litigation, damage to our reputation, and impaired demand for our products. Correcting bugs may result in increased costs and reduced acceptance of our software products in the marketplace. Further, such errors could subject us to claims from our customers for significant damages, and we cannot assure you that courts would enforce the provisions in our customer agreements that limit our liability for damages. The effort and expense of developing, testing and maintaining software product lines will increase with the increasing number of possible combinations of:
• | vendor hardware platforms; |
• | operating systems and updated versions; |
• | application software products and updated versions; and |
• | database management system platforms and updated versions. |
Developing consistent software product performance characteristics across all of these combinations could place a significant strain on our development resources and software product release schedules.
If the open source community expands into enterprise application and supply chain software, our revenues may decline.
The open source community is comprised of many different formal and informal groups of software developers and individuals who have created a wide variety of software and have made that software available for use, distribution and modification, often free of charge. Open source software, such as the Linux operating system, has been gaining in popularity among business users. If developers contribute enterprise and supply chain application software to the open source community, and that software has competitive features and scale to support business users in our markets, we will need to change our product pricing and distribution strategy to compete successfully.
29
Implementation of our products can be complex, time-consuming and expensive, customers may be unable to implement our products successfully, and we may become subject to warranty or product liability claims, which could be costly to resolve and result in negative publicity.
Our products must integrate with the many existing computer systems and software programs of our customers. This can be complex, time-consuming and expensive, and may cause delays in the deployment of our products. Our customers may be unable to implement our products successfully or otherwise achieve the benefits attributable to our products. Although we test each of our new products and releases and evaluate and test the products we obtain through acquisitions before introducing them to the market, there may still be significant errors in existing or future releases of our software products, with the possible result that we may be required to expend significant resources in order to correct such errors or otherwise satisfy customer demands. In addition, defects in our products or difficulty integrating our products with our customers’ systems could result in delayed or lost revenues, warranty or other claims against us by customers or third parties, adverse customer reactions and negative publicity about us or our products and services or reduced acceptance of our products and services in the marketplace, any of which could have a material adverse effect on our reputation, business, results of operations and financial condition.
An increase in sales of software products that require customization would result in revenue being recognized over the term of the contract for those products and could have a material adverse effect on our operating performance and financial condition.
Historically, we generally have been able to recognize software revenue upon delivery of our solutions and contract execution. Customers and prospects could ask for unique capabilities in addition to our core capabilities to give them a competitive edge in the market place. These instances could cause us to recognize more of our software revenue on a contract accounting basis over the course of the delivery of the solution rather than upon delivery and contract execution. The period between the initial contract and the completion of the implementation of our products can be lengthy and is subject to a number of factors (over many of which we have little or no control) that may cause significant delays, including the size and complexity of the overall project. As a result, a shift toward a higher proportion of software contracts requiring contract accounting would have a material adverse effect on our operating performance and financial condition and cause our operating results to vary significantly from quarter to quarter.
We sometimes experience delays in product releases, which can adversely affect our business.
Historically, we have issued significant new releases of our software products periodically, with minor interim releases issued more frequently. As a result of the complexities inherent in our software, major new product enhancements and new products often require long development and testing periods before they are released. On occasion, we have experienced delays in the scheduled release dates of new or enhanced products, and we cannot provide any assurance that we will achieve future scheduled release dates. The delay of product releases or enhancements, or the failure of such products or enhancements to achieve market acceptance, could materially affect our business and reputation.
We may not receive significant revenues from our current research and development efforts for several years.
Developing and localizing software is expensive, and the investment in product development may involve a long payback cycle. Our future plans include significant investments in software research and development and related product opportunities. We believe that we must continue to dedicate a significant amount of resources to our research and development efforts to maintain our competitive position. However, we do not expect to receive significant revenues from these investments for several years, if at all.
We have limited protection of our intellectual property and proprietary rights and may potentially infringe third-party intellectual property rights.
We consider certain aspects of our internal operations, software and documentation to be proprietary, and rely on a combination of copyright, trademark and trade secret laws; confidentiality agreements with employees and third parties; and protective contractual provisions (such as those contained in our agreements with consultants, vendors, partners and customers) and other measures to protect this information. Existing copyright laws afford only limited protection. We believe that the rapid pace of technological change in the computer software industry has made trade secret and copyright protection less significant than factors such as:
• | knowledge, ability and experience of our employees; |
• | frequent software product enhancements; |
• | customer education; and |
• | timeliness and quality of support services. |
Our competitors may independently develop technologies that are substantially equivalent or superior to our technology. The laws of some countries in which our software products are or may be sold do not protect our software products and intellectual property rights to the same extent as do the laws of the United States.
30
We generally enter into confidentiality or similar agreements with our employees, customers, consultants, and vendors. These agreements control access to and distribution of our software, documentation, and other proprietary information. Despite our efforts to protect our proprietary rights, unauthorized parties may copy aspects of our products, obtain and use information that we regard as proprietary, or develop similar technology through reverse engineering or other means. Preventing or detecting unauthorized use of our products is difficult. There can be no assurance that the steps we take will prevent misappropriation of our technology or that such agreements will be enforceable. In addition, we may need to resort to litigation to enforce our intellectual property rights, protect our trade secrets, determine the validity and scope of others’ proprietary rights, or defend against claims of infringement or invalidity in the future. Such litigation could result in significant costs and the diversion of resources. This could materially and adversely affect our business, operating results and financial condition.
Third parties may assert infringement claims against us. Although we do not believe that our products infringe on the proprietary rights of third parties, we cannot guarantee that third parties will not assert or prosecute infringement or invalidity claims against us. These assertions could distract management, require us to enter into royalty arrangements, and result in costly and time-consuming litigation, including damage awards. Such assertions or the defense of such claims may materially and adversely affect our business, operating results, or financial condition. In addition, such assertions could result in injunctions against us. Injunctions that prevent us from distributing our products would have a material adverse effect on our business, operating results, and financial condition. If third parties assert such claims against us, we may seek to obtain a license to use such intellectual property rights. There can be no assurance that such a license would be available on commercially reasonable terms or at all. If a patent claim against us were successful and we could not obtain a license on acceptable terms or license a substitute technology or redesign to avoid infringement, we may be prevented from distributing our software or required to incur significant expense and delay in developing non-infringing software.
We may experience liability claims arising out of the sale of our software and provision of services.
Our agreements normally contain provisions designed to limit our exposure to potential liability claims and generally exclude consequential and other forms of extraordinary damages. However, these provisions could be rendered ineffective, invalid or unenforceable by unfavorable judicial decisions or by federal, state, local or foreign laws or ordinances. For example, we may not be able to avoid or limit liability for disputes relating to product performance or the provision of services. If a claim against us were to be successful, we may be required to incur significant expense and pay substantial damages, including consequential or punitive damages, which could have a material adverse effect on our business, operating results and financial condition. Even if we prevail in contesting such a claim, the accompanying publicity could adversely affect the demand for our products and services.
We also rely on certain technology that we license from third parties, including software that is integrated with our internally developed software. Although these third parties generally indemnify us against claims that their technology infringes on the proprietary rights of others, such indemnification is not always available for all types of intellectual property. Often such third-party indemnifiers are not well capitalized and may not be able to indemnify us in the event that their technology infringes on the proprietary rights of others. As a result, we may face substantial exposure if technology we license from a third party infringes on another party’s proprietary rights. Defending such infringement claims, regardless of their validity, could result in significant cost and diversion of resources.
Concerns that our products do not adequately protect the privacy of consumers could inhibit sales of our products.
One of the features of our software applications is the ability to develop and maintain profiles of customers for use by businesses. Typically, these products capture profile information when customers and employees visit an Internet web site and volunteer information in response to survey questions concerning their backgrounds, interests and preferences. Our products augment these profiles over time by collecting usage data. Although we have designed our products to operate with applications that protect user privacy, privacy concerns may nevertheless cause visitors to resist providing the personal data necessary to support this profiling capability. If we cannot adequately address customers’ privacy concerns, these concerns could materially and adversely harm our business, financial condition and operating results.
We face risks associated with the security of our products, and if our data protection or other security measures are compromised and as a result our data, our customers’ data or our IT systems are accessed improperly, made unavailable, or improperly modified, our products and services may be perceived as vulnerable, our reputation could be damaged, the IT services we provide to our customers could be disrupted, and customers may stop using our products and services, all of which could reduce our revenue and earnings, increase our expenses and expose us to legal claims and regulatory actions.
Maintaining the security of computers and computer networks is an issue of critical importance for our customers. Attempts by experienced computer programmers, or hackers, to penetrate client network security or the security of web sites to misappropriate confidential information have become an industry-wide phenomenon that affects computers and networks across all platforms. We have included security features in certain of our Internet browser-enabled products that are intended to protect the privacy and integrity of customer data. In addition, some of our software applications use encryption technology to provide the security necessary to permit the secure exchange of valuable and confidential information. Despite these security
31
features, our products may be vulnerable to break-ins and similar problems caused by hackers, which could jeopardize the security of information stored in and transmitted through the computer systems of our customers. Actual or perceived security vulnerabilities in our products (or the Internet in general) could lead some customers to seek to reduce or delay future purchases or to purchase competitors’ products which are not Internet-based applications. Customers may also increase their spending to protect their computer networks from attack, which could delay adoption of new technologies. Any of these actions by customers and the cost of addressing such security problems may have a material adverse effect on our business.
Although our agreements with our customers contain provisions designed to limit our exposure as a result of the situations listed above, such provisions may not be effective. Existing or future federal, state, or local laws or ordinances or unfavorable judicial decisions could affect their enforceability. To date, we have not experienced any such product liability claims, but there can be no assurance that this will not occur in the future. Because our products are used in essential business applications, a successful product liability claim could have a material adverse effect on our business, operating results, and financial condition. Additionally, defending such a suit, regardless of its merits, could entail substantial expense and require the time and attention of key management.
Any interruptions or delays in services from third parties, including data center hosting facilities and cloud computing platform providers, or our inability to adequately plan for and manage service interruptions or infrastructure capacity requirements, could impair the delivery of our services and harm our business.
We currently serve our customers from third-party data center hosting facilities and cloud computing platform providers located in the United States and other countries. Any damage to or failure of our systems generally, including the systems of our third-party platform providers, could result in interruptions in our services. From time to time we have experienced interruptions in our services and such interruptions may occur in the future. As we increase our reliance on these third-party systems, the risk of service interruptions may increase. Interruptions in our services may cause customers to make warranty or other claims against us or terminate their agreements and adversely affect our ability to attract new customers, all of which would reduce our revenues. Our business also would be harmed if customers and potential customers believe our services are unreliable.
These data and cloud computing platforms may not continue to be available at reasonable prices, on commercially reasonable terms or at all. Any loss of the right to use any of these cloud computing platforms could significantly increase our expenses and otherwise result in delays in providing our services until equivalent technology is either developed by us or, if available, is identified, purchased or licensed and integrated into our services.
If we do not accurately plan for our infrastructure capacity requirements and we experience significant strain on our data center capacity, our customers could experience performance degradation or service outages that may subject us to financial liability, result in customer losses and harm our business. As we add data centers and capacity and continue to move to a cloud computing platform, we may move or transfer our data and our customers’ data. Despite precautions taken during this process, any unsuccessful data transfers may impair the delivery of our services, which may adversely impact our business.
Privacy and security concerns, including evolving government regulation in the area of data privacy, could adversely affect our business and operating results.
Governments in some jurisdictions have enacted or are considering enacting consumer data privacy legislation, including laws and regulations applying to the solicitation, collection, processing and use of consumer data. For example, in 2016, the European Union adopted a new law governing data practices and privacy called the General Data Protection Regulation (“GDPR”), which became effective in May 2018. The law establishes new requirements regarding the handling of personal data. Non-compliance with the GDPR may result in monetary penalties of up to 4% of worldwide revenue. The GDPR and other changes in laws or regulations associated with the enhanced protection of certain types of sensitive data could greatly increase our cost of providing our products and services or even prevent us from offering certain services in jurisdictions that we operate. In the U.S., California enacted the California Consumer Privacy Act of 2018 (“CCPA”), which took effect on January 1, 2020, and which broadly defines personal information, gives California residents expanded privacy rights and protections and provides for civil penalties for violations.
Additionally, public perception and standards related to the privacy of personal information can shift rapidly, in ways that may affect our reputation or influence regulators to enact regulations and laws that may limit our ability to provide certain products. U.S. federal, state, or foreign laws and regulations, including laws and regulations regulating privacy, data security, or consumer protection, or other policies, public perception, standards, self-regulatory requirements or legal obligations could reduce the demand for our software products if we fail to design or enhance our products to enable our customers to comply with the privacy and security measures dictated by these requirements. Moreover, we may be exposed to liability under existing or new data privacy legislation. Even technical violations of these laws can result in penalties that are assessed for each non-compliant transaction. If we or our customers were found to be subject to and in violation of any of these laws or other data privacy laws or regulations, our business could suffer and we and/or our customers would likely have to change our business practices.
32
We might experience significant errors or security flaws in our software products and services.
Despite testing prior to their release, software products frequently contain errors or security flaws, especially when first introduced or when new versions are released. The detection and correction of any security flaws can be time-consuming and costly. Errors in our software products could affect the ability of our products to work with other hardware or software products, delay the development or release of new products or new versions of products and adversely affect market acceptance of our products. If we experience errors or delays in releasing new software products or new versions of software products, we could lose revenues. In addition, we could encounter security issues with our products and networks and any security flaws, if exploited, could affect our ability to conduct internal business operations. End users who rely on our software products and services for applications that are critical to their businesses may have a greater sensitivity to product errors and security vulnerabilities than do customers for software products generally. Software product errors and security flaws in our products or services could expose us to product liability, performance and/or warranty claims, as well as harm our reputation, which could impact our future sales of products and services. In addition, we may be legally required to publicly report security breaches, which could adversely impact future business prospects for our products and services.
RISK FACTORS RELATED TO OUR PERSONNEL
We are dependent upon key personnel, and need to attract and retain highly qualified personnel in all areas.
Our future operating results depend significantly upon the continued service of a relatively small number of key senior management and technical personnel, including our Chief Executive Officer and President, H. Allan Dow. None of our key personnel are bound by long-term employment agreements. We do not have in place “key person” life insurance policies on any of our employees. If we fail to retain senior management or other key personnel, or fail to attract key personnel, our succession planning and operations could be materially and adversely affected and could jeopardize our ability to meet our business goals.
Our future success also depends on our continuing ability to attract, train, retain and motivate other highly qualified managerial and technical personnel. Competition for these personnel is intense, and at times we have experienced difficulty in recruiting and retaining qualified personnel, including sales and marketing representatives, qualified software engineers involved in ongoing product development, and personnel who assist in the implementation of our products and provide other services. The market for such individuals is competitive. For example, it has been particularly difficult to attract and retain product development personnel experienced in object oriented development technologies. Given the critical roles of our sales, product development and consulting staffs, our inability to recruit successfully or any significant loss of key personnel would adversely affect us. The software industry is characterized by a high level of employee mobility and aggressive recruiting of skilled personnel. It may be particularly difficult to retain or compete for skilled personnel against larger, better-known software companies. We cannot guarantee that we will be able to retain our current personnel, attract and retain other highly qualified technical and managerial personnel in the future, or assimilate the employees from any acquired businesses. We will continue to adjust the size and composition of our workforce to match the relevant product and geographic demand cycles. If we are unable to attract and retain the necessary technical and managerial personnel, or assimilate the employees from any acquired businesses, our business, operating results and financial condition would be adversely affected.
The failure to attract, train, retain and effectively manage employees could negatively impact our development and sales efforts and cause a degradation of our customer service. In particular, the loss of sales personnel could lead to lost sales opportunities because it can take several months to hire and train replacement sales personnel. If our competitors increase their use of non-compete agreements, the pool of available sales and technical personnel may further shrink, even if the non-compete agreements ultimately prove to be unenforceable. We may grant large numbers of stock options to attract and retain personnel, which could be highly dilutive to our shareholders. The volatility or lack of positive performance of our stock price may adversely affect our ability to retain or attract employees. The loss of key management and technical personnel or the inability to attract and retain additional qualified personnel could have an adverse effect on us.
We periodically have restructured our sales force, which can be disruptive.
We continue to rely heavily on our direct sales force. Periodically, we have restructured or made other adjustments to our sales force in response to factors such as product changes, geographical coverage and other internal considerations. Change in the structures of the sales force and sales force management can cause us to terminate and then hire new sales personnel, and/or result in temporary lack of focus and reduced productivity, which may affect revenues in one or more quarters. Future restructuring of our sales force could occur, and if so we may again experience the adverse transition issues associated with such restructuring.
Our technical personnel have unique access to customer data, and may abuse that privilege.
In order to properly render the services we provide, our technical personnel have the ability to access data on the systems run by our customers or hosted by us for our customers, including data about the operations of our customers and even about the customers of our customers. Although we have never had such an occurrence in the entire history of our Company, it is conceivable that such access could be abused in order to improperly utilize that data to the detriment of such customers.
33
RISK FACTORS RELATED TO OUR CORPORATE STRUCTURE AND GOVERNANCE
Our business is subject to changing regulation of corporate governance and public disclosure that has increased both our costs and the risk of non-compliance.
Because our common stock is publicly traded, we are subject to certain rules and regulations of federal, state and financial market exchange entities charged with the protection of investors and the oversight of companies whose securities are publicly traded. These entities, including the Public Company Accounting Oversight Board, the SEC and NASDAQ, have issued requirements and regulations and continue to develop additional regulations and requirements in response to laws enacted by Congress. Our efforts to comply with these regulations have resulted in, and are likely to continue to result in, increased general and administrative expenses and a diversion of management time and attention from revenue-generating activities to compliance activities.
In particular, our efforts to comply with Section 404 of the Sarbanes-Oxley Act of 2002 and the related regulations regarding our required assessment of our internal control over financial reporting and our independent public accounting firm’s audit of that assessment have required, and continue to require, the commitment of significant financial and managerial resources. Moreover, because these laws, regulations and standards are subject to varying interpretations, their application in practice may evolve over time as new guidance becomes available. This evolution may result in continuing uncertainty regarding compliance matters and additional costs necessitated by ongoing revisions to our disclosure and governance practices. Over time, we have made significant changes in, and may consider making additional changes to, our internal controls, our disclosure controls and procedures, and our corporate governance policies and procedures. Any system of controls, however well-designed and -operated, is based in part on certain assumptions and can provide only reasonable, and not absolute, assurances that the objectives of the system are met. Any failure of our controls, policies and procedures could have a material adverse effect on our business, results of operations, cash flow and financial condition.
If in the future we are unable to assert that our internal control over financial reporting is effective as of the end of the then current fiscal year (or if our independent registered public accounting firm is unable to express an opinion on the effectiveness of our internal control over financial reporting), we could lose investor confidence in the accuracy and completeness of our financial reports, which would have a negative market reaction.
One shareholder beneficially owns a substantial portion of our stock, and as a result exerts substantial control over us.
As of June 30, 2020, James C. Edenfield, Executive Chairman, Treasurer and a Director of the Company, beneficially owned 1,821,587 shares, or 100%, of our Class B common stock, and 78,000 shares, or 0.25%, of our Class A common stock. If all of Mr. Edenfield’s Class B shares were converted into Class A shares, Mr. Edenfield would beneficially own 1,899,587 Class A shares, which would represent approximately 5.85% of all outstanding Class A shares after giving effect to such conversion. As a result of Mr. Edenfield’s ownership of Class B common stock, he has the right to elect a majority of our Board of Directors. Such control and concentration of ownership may discourage a potential acquirer from making a purchase offer that other shareholders might find favorable, which in turn could adversely affect the market price of our common stock.
Our articles of incorporation and bylaws and Georgia law may inhibit a takeover of our company.
Our basic corporate documents and Georgia law contain provisions that might enable our management to resist a takeover. These provisions might discourage, delay or prevent a change in the control or a change in our management. These provisions could also discourage proxy contests and make it more difficult for you and other shareholders to elect directors and take other corporate actions. The existence of these provisions could also limit the price that investors might be willing to pay in the future for shares of our common stock.
We are a “controlled company” within the meaning of NASDAQ rules and, as a result, qualify for, and rely on, exemptions from certain corporate governance requirements.
Because Mr. Edenfield has the ability to elect more than half of the members of our Board of Directors, we are a “controlled company” within the meaning of the rules governing companies with stock quoted on the NASDAQ Global Select Market. Under these rules, a “controlled company” is a company of which more than 50% of the voting power for the election of directors is held by an individual, a group or another company. As a controlled company, we are exempt from certain corporate governance requirements, including requirements that: (1) a majority of the board of directors consist of independent directors; (2) compensation of officers be determined or recommended to the board of directors by a majority of its independent directors or by a compensation committee that is composed entirely of independent directors; and (3) director nominees be selected or recommended for selection by a majority of the independent directors or by a nominating committee composed solely of independent directors. Our Board of Directors does not have a majority of independent directors, and our compensation committee is not required to consist entirely of independent directors. We are not required to have, and have not chosen to establish, a nominating committee. Accordingly, our procedures for approving significant corporate decisions are not
34
subject to the same corporate governance requirements as non-controlled companies with stock quoted on the NASDAQ Global Select Market.
RISK FACTORS RELATED TO OUR STOCK PRICE
We could experience fluctuations in quarterly operating results that could adversely affect our stock price.
We have difficulty predicting our actual quarterly operating results, which have varied widely in the past and which we expect to continue to vary significantly from quarter to quarter due to a number of factors, many of which are outside our control. We base our expense levels, operating costs and hiring plans on projections of future revenues, and it is difficult for us to rapidly adjust when actual results do not match our projections. If our quarterly revenue or operating results fall below the expectations of investors or public market analysts, the price of our common stock could fall substantially. Revenues in any quarter depend substantially on the combined sales activity of the American Software group of companies and our ability to recognize revenues in that quarter in accordance with our revenue recognition policies. Our sales activity is difficult to forecast for a variety of reasons, including the following:
• | we complete a significant portion of our customer agreements within the last few weeks of each quarter; |
• | if an agreement includes cloud services such as managing the application and hosting the server that are performed over the term of the contract, this requires all the revenue to be spread over the term of the contract; |
• | our sales cycle for products and services, including multiple levels of authorization required by some customers, is relatively long and variable because of the complex and mission-critical nature of our products; |
• | the demand for our products and services can vary significantly; |
• | the size of our transactions can vary significantly; |
• | the possibility of adverse global political or health conditions and economic downturns, both domestic and international, characterized by decreased product demand, price erosion, technological shifts, work slowdowns and layoffs, may substantially reduce customer demand and contracting activity; |
• | customers may unexpectedly postpone or cancel anticipated system replacement or new system evaluation and implementation due to changes in their strategic priorities, project objectives, budgetary constraints, internal purchasing processes or company management; |
• | customer evaluation and purchasing processes vary from company to company, and a customer’s internal approval and expenditure authorization process can be difficult and time-consuming, even after selection of a vendor; and |
• | the number, timing and significance of software product enhancements and new software product announcements by us and by our competitors may affect purchase decisions. |
Variances or slowdowns in our contracting activity in prior quarters may affect current and future consulting, training and maintenance revenues, since these revenues typically follow license or subscription fee revenues. Our ability to maintain or increase services revenues primarily depends on our ability to increase the number and size of our customer agreements. In addition, we base our budgeted operating costs and hiring plans primarily on our projections of future revenues. Because most of our expense levels are relatively fixed, including employee compensation and rent in the near term, if our actual revenues fall below projections in any particular quarter, our business, operating results, and financial condition could be materially and adversely affected. In addition, our expense levels are based, in part, on our expectations regarding future revenue increases. As a result, any shortfall in revenue in relation to our expectations could cause significant changes in our operating results from quarter to quarter and could result in quarterly losses. As a result of these factors, we believe that period-to-period comparisons of our revenue levels and operating results are not necessarily meaningful. As a result, predictions of our future performance should not be based solely on our historical quarterly revenue and operating results.
Our stock price is volatile and there is a risk of litigation.
The trading price of our common stock has been in the past and may in the future be subject to wide fluctuations in response to factors such as the following:
• | general market conditions; |
• | revenue or results of operations in any quarter failing to meet the expectations, published or otherwise, of the investment community; |
• | customer order deferrals resulting from the anticipation of new products, economic uncertainty, disappointing operating results by the customer, management changes, corporate reorganizations or otherwise; |
• | reduced investor confidence in equity markets, due in part to corporate collapses in recent years; |
• | speculation in the press or analyst community; |
• | wide fluctuations in stock prices, particularly in relation to the stock prices for other technology companies; |
• | announcements of technological innovations by us or our competitors; |
• | new products or the acquisition or loss of significant customers by us or our competitors; |
• | developments with respect to our copyrights or other proprietary rights or those of our competitors; |
35
• | changes in interest rates; |
• | changes in investors’ beliefs as to the appropriate price-earnings ratios for us and our competitors; |
• | changes in recommendations or financial estimates by securities analysts who track our common stock or the stock of other software companies; |
• | changes in management; |
• | sales of common stock by our controlling shareholders, directors and executive officers; |
• | rumors or dissemination of false or misleading information, particularly through Internet chat rooms, instant messaging, and other rapid-dissemination methods; |
• | conditions and trends in the software industry generally; |
• | the announcement of acquisitions or other significant transactions by us or our competitors; |
• | adoption of new accounting standards affecting the software industry; |
• | domestic or international terrorism, public health crises including the COVID-19 pandemic and other factors; and |
• | the other factors described in these “Risk Factors.” |
Fluctuations in the price of our common stock may expose us to the risk of securities class action lawsuits. Although no such lawsuits are currently pending against us and we are not aware that any such lawsuit is threatened to be filed in the future, there is no assurance that we will not be sued based on fluctuations in the price of our common stock. Defending against such lawsuits could result in substantial cost and divert management’s attention and resources. In addition, any settlement or adverse determination of these lawsuits could subject us to significant liabilities.
Our dividend policy is subject to change.
On May 20, 2020, our Board of Directors declared quarterly dividends of $0.11 per share, payable to our Class A and Class B common shareholders. We currently expect to declare and pay cash dividends at this level on a quarterly basis in the future. However, our dividend policy may be affected by, among other things, our views on business conditions, our financial position, earnings, earnings outlook, capital spending plans and other factors that our Board of Directors considers relevant at that time. Our dividend policy has changed in the past and may change from time to time, and we cannot provide assurance that we will continue to declare dividends in any particular amounts or at all. A change in our dividend policy could have a negative effect on the market price of our common stock.
The price of our common stock may decline due to shares eligible for future sale or actual future sales of substantial amounts of our common stock.
Sales of substantial amounts of our common stock in the public market, or the perception that such sales may occur, could cause the market price of our common stock to decline. As of June 30, 2020, if all of our outstanding Class B common shares were converted into Class A common shares, our current directors and executive officers of the Company as a group would beneficially own approximately 9.32% of all outstanding Class A common shares after giving effect to such conversion. Sales of substantial amounts of our common stock in the public market by these persons, or the perception that such sales may occur, could cause the market price of our common stock to decline and could impair our ability to raise capital through the sale of additional equity securities.
ITEM 1B. UNRESOLVED STAFF COMMENTS
None.
ITEM 2. | PROPERTIES |
Our corporate headquarters are located in an approximately 100,000 square foot office building that we own at 470 East Paces Ferry Road, N.E., Atlanta, Georgia.
We have entered into leases for sales and technology development offices located in various cities in the United States and overseas. We believe our existing facilities are adequate for our current needs and that suitable additional or substitute space will be available as needed on commercially reasonable terms.
Each of our three segments makes use of the property at 470 East Paces Ferry Road and our SCM segment occupies office space that we lease in the United Kingdom, Sweden, Germany, India, New Zealand and Australia.
ITEM 3. | LEGAL PROCEEDINGS |
36
(a) | Many of our installations involve products that are critical to the operations of our customers’ businesses. Any failure in our products could result in a claim for substantial damages against us, regardless of our responsibility for such failure. Although we attempt to contractually limit our liability for damages arising from product failures or negligent acts or omissions, there can be no assurance that the limitations of liability contained in our contracts will be enforceable in all instances. We are not currently a party to any material legal proceedings that would require disclosure under this Item. |
(b) | None. |
ITEM 4. | MINE SAFETY DISCLOSURES |
Not applicable.
37
PART II
ITEM 5. | MARKET FOR REGISTRANT’S COMMON EQUITY, RELATED STOCKHOLDER MATTERS, AND ISSUER PURCHASES OF EQUITY SECURITIES |
Trading Market
Our Class A Common Shares are listed on the NASDAQ Global Select Market under the symbol “AMSWA”. As of July 2, 2020, there were 12,432 holders of Class A shares who held their stock either individually or in nominee or “street” names through various brokerage firms, and one holder of Class B Common Shares.
Equity Compensation Plans
The following table discloses information regarding the Company’s equity compensation plans as of April 30, 2020:
Plan Category | Number of securities to be issued upon exercise of outstanding options, warrants and rights | Weighted-average exercise price of outstanding options, warrants and rights | Number of securities remaining available for future issuance under equity compensation plans (excluding securities reflected in the first column) | ||||
Equity compensation plans approved by security holders | 3,745,650 | 12.21 | 1,848,786 | ||||
Dividend Policy
Since the third quarter of fiscal 2013, our Board of Directors had declared quarterly dividends of $0.10 per share. On May 11, 2016, our Board increased the quarterly dividends to $0.11 per share, payable to our Class A and Class B common stockholders. We currently expect to declare and pay cash dividends at this level on a quarterly basis in the future. The continuation of this policy, and payment of future cash dividends, will be at the sole discretion of the Board of Directors. In exercising this discretion, the Board will consider our profitability, financial condition, cash requirements, future prospects and other relevant factors. Our dividend policy has changed in the past and may change from time to time, and we cannot provide assurance that we will continue to declare dividends in any particular amounts or at all.
38
Stock Price Performance Graph
The graph below reflects the cumulative stockholder return on the Company’s shares compared to the return of the NASDAQ Stock Market – US Companies ("NASDAQ Composite Index") and a peer group index on a quarterly basis. The graph reflects the investment of $100 on April 30, 2015 in the Company’s stock, the NASDAQ Composite Index and the NASDAQ Computer Index, a published industry peer group index. The NASDAQ Computer Index consists of approximately 334 NASDAQ-listed companies, including computer hardware and software companies that furnish computer programming and data processing services and firms that produce computers, office equipment, and electronic component/accessories. The total cumulative dollar returns shown below represent the value that such investments would have had on April 30, 2020.
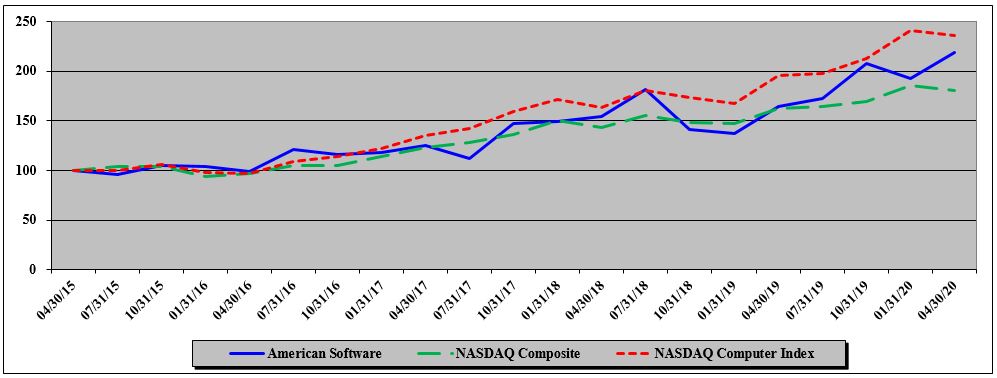
FY 2015 | FY 2016 | FY 2017 | FY 2018 | FY 2019 | FY 2020 | ||||||||||||||||||
American Software(a) | $ | 100 | $ | 99 | $ | 126 | $ | 154 | $ | 165 | $ | 219 | |||||||||||
NASDAQ Composite | 100 | 97 | 123 | 143 | 163 | 180 | |||||||||||||||||
NASDAQ Computer Index | 100 | 97 | 136 | 164 | 196 | 236 | |||||||||||||||||
_______________
(a) | This series includes dividends paid over the disclosed period. |
Purchases of Equity Securities by the Company
The following table summarizes repurchases of our stock in the quarter ended April 30, 2020:
Fiscal Period | Total Number of Shares Purchased | Average Price Paid Per Share | Total Number of Shares Purchased as Part of Publicly Announced Plans or Programs | Maximum Number of Shares that May Yet Be Purchased Under the Plans or Programs* | ||||||||
February 1, 2020 through February 29, 2020 | — | $ | — | — | 946,321 | |||||||
March 1, 2020 through March 31, 2020 | — | $ | — | — | 946,321 | |||||||
April 1, 2020 through April 30, 2020 | — | $ | — | — | 946,321 | |||||||
Total Fiscal 2020 Fourth Quarter | — | $ | — | — | 946,321 | |||||||
_____________
* | The above share purchase authority was approved by the Board of Directors on August 19, 2002, when the Board approved a resolution authorizing the Company to repurchase up to 2.0 million shares of Class A common stock. This action was announced on August 22, 2002. The authorization has no expiration date. |
39
Transfer Agent
American Stock Transfer & Trust Company LLC
6201 15th Ave.
Brooklyn, NY 11219
Toll free: (800) 937-5449
Local & international: (718) 921-8124
http://www.astfinancial.com
Inquiries regarding stock transfers, lost certificates or address changes should be directed to the above address.
40
Market Makers
The following firms make a market in the Class A common shares of American Software, Inc.
Archipelago Stock Exchange | Latour Trading LLC | |
B. Riley FBR, INC. | Maxim Group LLC | |
Barclays Capital Inc./Le | Morgan Stanley & Co. LLC | |
Bofa Securities, Inc. | NASDAQ Execution Services LLC | |
Canaccord Genuity Inc. | NASDAQ OMX PHLX LLC | |
Cantor, Fitzgerald & Co. | Needham & Company, LLC | |
CBOE TRADING, INC. | Raymond, James & Associates | |
Chicago Stock Exchange | RBC Capital Markets, LLC | |
Citadel Derivatives Group LLC | SG Americas Securities LLC | |
Citadel Securities LLC | Stifel Nicolaus & Co. | |
Cowen and Company, LLC | SunTrust Capital Markets, Inc. | |
Direct Edge ECN LLC | Susquehanna Financial Group, | |
G1 Execution Services, LLC | Susquehanna Securities | |
Goldman Sachs & Co. LLC | Two Sigma Securities, LLC | |
GTS Securities LLC | UBS Securities LLC | |
IMC Financial Markets | VIRTU Americas LLC | |
Jefferies LLC | Wells Fargo Advisors, LLC | |
Keybanc Capital Markets, Inc. | William Blair | |
Wolverine Securities, LLC | ||
41
ITEM 6. | SELECTED CONSOLIDATED FINANCIAL DATA |
The selected consolidated financial data presented below as of and for the years ended April 30, 2020, 2019, 2018, 2017, and 2016 is derived from our audited consolidated financial statements.
Consolidated Statements of Operations Data:
Years Ended April 30, | |||||||||||||||||||
2020 | 2019 | 2018 | 2017 | 2016 | |||||||||||||||
(in thousands, except per share data) | |||||||||||||||||||
Revenues: | |||||||||||||||||||
Subscription fees | $ | 22,033 | $ | 14,026 | $ | 8,855 | $ | 4,381 | $ | 3,273 | |||||||||
License fees | 7,582 | 7,126 | 15,344 | 15,584 | 22,043 | ||||||||||||||
Professional services and other | 42,774 | 42,154 | 44,663 | 43,932 | 47,826 | ||||||||||||||
Maintenance | 43,077 | 45,400 | 43,841 | 42,389 | 40,747 | ||||||||||||||
Total revenues | 115,466 | 108,706 | 112,703 | 106,286 | 113,889 | ||||||||||||||
Cost of revenues: | |||||||||||||||||||
Subscription fees | 9,491 | 5,759 | 3,817 | 3,290 | 1,528 | ||||||||||||||
License fees | 4,798 | 6,430 | 6,261 | 6,713 | 7,552 | ||||||||||||||
Professional services and other | 30,695 | 31,421 | 30,596 | 31,374 | 35,708 | ||||||||||||||
Maintenance | 7,324 | 8,356 | 9,326 | 9,707 | 9,441 | ||||||||||||||
Total cost of revenues | 52,308 | 51,966 | 50,000 | 51,084 | 54,229 | ||||||||||||||
Gross margin | 63,158 | 56,740 | 62,703 | 55,202 | 59,660 | ||||||||||||||
Operating expenses: | |||||||||||||||||||
Research and development costs | 15,348 | 13,078 | 11,877 | 11,889 | 11,248 | ||||||||||||||
Sales and marketing expense | 21,958 | 20,992 | 20,658 | 20,287 | 22,164 | ||||||||||||||
General and administrative expenses | 19,519 | 17,006 | 16,057 | 14,219 | 12,449 | ||||||||||||||
Amortization of acquisition-related intangibles | 285 | 388 | 580 | 1,041 | 272 | ||||||||||||||
Total operating expenses | 57,110 | 51,464 | 49,172 | 47,436 | 46,133 | ||||||||||||||
Operating income | 6,048 | 5,276 | 13,531 | 7,766 | 13,527 | ||||||||||||||
Other income, net | 750 | 2,365 | 2,184 | 13,849 | 1,173 | ||||||||||||||
Earnings before income taxes | 6,798 | 7,641 | 15,715 | 21,615 | 14,700 | ||||||||||||||
Income tax expense | 56 | 838 | 3,662 | 6,994 | 4,458 | ||||||||||||||
Net earnings | $ | 6,742 | $ | 6,803 | $ | 12,053 | $ | 14,621 | $ | 10,242 | |||||||||
Earnings per common share(a): | |||||||||||||||||||
Basic | $ | 0.21 | $ | 0.22 | $ | 0.40 | $ | 0.50 | $ | 0.36 | |||||||||
Diluted | $ | 0.21 | $ | 0.22 | $ | 0.40 | $ | 0.49 | $ | 0.35 | |||||||||
Weighted average common shares—Basic | 31,747 | 30,950 | 30,080 | 29,232 | 28,727 | ||||||||||||||
Diluted | 32,367 | 31,378 | 30,472 | 29,567 | 29,005 | ||||||||||||||
Cash dividends declared | $ | 0.44 | $ | 0.44 | $ | 0.44 | $ | 0.44 | $ | 0.40 | |||||||||
Consolidated Balance Sheet Data: | |||||||||||||||||||
Cash and cash equivalents | $ | 79,814 | $ | 61,288 | $ | 52,794 | $ | 66,001 | $ | 49,004 | |||||||||
Investments—short and long term | $ | 14,862 | $ | 27,194 | $ | 35,014 | $ | 23,787 | $ | 28,881 | |||||||||
Working capital | $ | 78,208 | $ | 69,401 | $ | 61,402 | $ | 66,789 | $ | 54,801 | |||||||||
Total assets | $ | 171,293 | $ | 161,310 | $ | 162,965 | $ | 148,774 | $ | 136,724 | |||||||||
American Software, Inc. shareholders’ equity | $ | 119,422 | $ | 114,607 | $ | 112,584 | $ | 103,750 | $ | 94,894 | |||||||||
_______________
(a) | Diluted per share amounts for Class A shares are shown above. Diluted per share for Class B shares under the two-class method are $0.21, $0.22, $0.39, $0.49, and $0.35 for the years ended April 30, 2020, 2019, 2018, 2017, and 2016, respectively. See Note 1(s) to the Consolidated Financial Statements. |
42
ITEM 7. | MANAGEMENT’S DISCUSSION AND ANALYSIS OF FINANCIAL CONDITION AND RESULTS OF OPERATIONS |
The following discussion and analysis should be read in conjunction with “Item 6. Selected Financial Data” and “Item 8. Financial Statements and Supplementary Data”. This discussion contains forward-looking statements relating to our future financial performance, business strategy, financing plans and other future events that involve uncertainties and risks. You can identify these statements by forward-looking words such as “anticipate,” “intend,” “plan,” “continue,” “could,” “grow,” “may,” “potential,” “predict,” “strive,” “estimate,” “believe,” “expect” and similar expressions that convey uncertainty of future events or outcomes. Any forward-looking statements herein are made pursuant to the safe harbor provision of the Private Securities Litigation Reform Act of 1995. Our actual results could differ materially from the results anticipated by these forward-looking statements as a result of many known and unknown factors that are beyond our ability to control or predict, including but not limited to those discussed above in “Risk Factors” and elsewhere in this report. See also “Special Cautionary Notice Regarding Forward-Looking Statements” at the beginning of “Item 1. Business.”
CRITICAL ACCOUNTING POLICIES AND ESTIMATES
We have based the following discussion and analysis of financial condition and results of operations on our consolidated financial statements, which we have prepared in accordance with U.S. GAAP. The preparation of these consolidated financial statements requires management to make estimates and assumptions that affect the reported amounts of assets and liabilities, disclosures of contingent assets and liabilities at the date of the consolidated financial statements and the reported amounts of revenues and expenses during the reporting period. Note 1 to the Consolidated Financial Statements for the fiscal year ended April 30, 2020, describes the significant accounting policies that we have used in preparing our consolidated financial statements. On an ongoing basis, we evaluate our estimates, including, but not limited to, those related to revenue/collectability. We base our estimates on historical experience and on various other assumptions that we believe to be reasonable under the circumstances, the results of which form the basis for making judgments about the carrying values of assets and liabilities that are not readily apparent from other sources. Our actual results could differ materially from these estimates under different assumptions or conditions.
We believe the critical accounting policies listed below affect significant judgments and estimates used in the preparation of the financial statements.
Revenue Recognition. The most critical judgements required in applying Topic 606 and our revenue recognition policy relate to the evaluation of the standalone selling price (SSP) for each performance obligation.
We use historical sales transaction data and judgments, among other factors, in determining the SSP for products and services. For substantially all performance obligations except on-premise licenses, we are able to establish the SSP based on the observable prices of products or services sold separately in comparable circumstances to similar customers. We typically establish an SSP range for our products and services, which is reassessed on a periodic basis or when facts and circumstances change. SSP for our products and services can evolve over time due to changes in our pricing practices that are influenced by competition, changes in demand for our products and services, and economic factors, among others. Our on-premise licenses historically have not been sold on a standalone basis, as substantially all customers elect to purchase support contracts at the time of a on-premise license purchase. Support contracts are generally priced as a percentage of the net fees paid by the customer to access the on-premise license. We are unable to establish the SSP for our on-premise licenses based on observable prices given the same products are sold for a broad range of amounts (that is, the selling price is highly variable) and a representative SSP is not discernible from past transactions or other observable evidence. As a result, the SSP for a on-premise license included in a contract with multiple performance obligations is determined by applying a residual approach whereby all other performance obligations within a contract are first allocated a portion of the transaction price based upon their respective SSPs, with any residual amount of transaction price allocated to on-premise license revenues.
43
RESULTS OF OPERATIONS
The following table sets forth certain revenue and expense items as a percentage of total revenues for the three years ended April 30, 2020, 2019, and 2018 and the percentage increases and decreases in those items for the years ended April 30, 2020 and 2019:
Percentage of Total Revenues | Pct. Change in Dollars | Pct. Change in Dollars | ||||||||||||
2020 | 2019 | 2018 | 2020 vs. 2019 | 2019 vs. 2018 | ||||||||||
Revenues: | ||||||||||||||
Subscription fees | 19 | % | 13 | % | 8 | % | 57 | % | 58 | % | ||||
License fees | 7 | 6 | 13 | 6 | (54 | ) | ||||||||
Professional services and other | 37 | 39 | 40 | 1 | (6 | ) | ||||||||
Maintenance | 37 | 42 | 39 | (5 | ) | 4 | ||||||||
Total revenues | 100 | 100 | 100 | 6 | (4 | ) | ||||||||
Cost of revenues: | ||||||||||||||
Subscription fees | 8 | 5 | 3 | 65 | 34 | |||||||||
License fees | 4 | 6 | 6 | (25 | ) | 13 | ||||||||
Professional services and other | 27 | 29 | 27 | (2 | ) | 3 | ||||||||
Maintenance | 6 | 8 | 8 | (12 | ) | (10 | ) | |||||||
Total cost of revenues | 45 | 48 | 44 | 1 | 4 | |||||||||
Gross margin | 55 | 52 | 56 | 11 | 14 | |||||||||
Research and development | 13 | 12 | 11 | 17 | 10 | |||||||||
Sales and marketing | 19 | 19 | 18 | 5 | 2 | |||||||||
General and administrative | 17 | 16 | 14 | 15 | 6 | |||||||||
Amortization of acquisition-related intangibles | — | — | 1 | (27 | ) | (33 | ) | |||||||
Total operating expenses | 49 | 47 | 44 | 11 | 4 | |||||||||
Operating income | 6 | 5 | 12 | 15 | (61 | ) | ||||||||
Other income: | ||||||||||||||
Interest income | 1 | 2 | 1 | (27 | ) | 33 | ||||||||
Other, net | (1 | ) | — | 1 | nm | (55 | ) | |||||||
Earnings before income taxes | 6 | 7 | 14 | (11 | ) | (51 | ) | |||||||
Income tax expense | — | 1 | 3 | (93 | ) | (77 | ) | |||||||
Net earnings | 6 | % | 6 | % | 11 | % | (1 | )% | (44 | )% | ||||
nm - not meaningful
Economic Overview and Significant Trends in Our Business
Corporate capital spending trends and commitments are the primary determinants of the size of the market for business software. Corporate capital spending is, in turn, a function of general economic conditions in the U.S. and abroad and in particular may be affected by conditions in U.S. and global credit markets. In recent years, the weakness in the overall global economy and the U.S. economy has resulted in reduced expenditures in the business software market.
In April 2020, the International Monetary Fund (“IMF”) provided an update to the World Economic Outlook for the 2020 and 2021 world economic growth forecast. The update noted that, “As a result of the pandemic, the global economy is projected to contract sharply by –3 percent in 2020, much worse than during the 2008–09 financial crisis. In a baseline scenario, which assumes that the pandemic fades in the second half of 2020 and containment efforts can be gradually unwound, the global economy is projected to grow by 5.8 percent in 2021 as economic activity normalizes, helped by policy support.
There is extreme uncertainty around the global growth forecast. The economic fallout depends on factors that interact in ways that are hard to predict, including the pathway of the pandemic, the intensity and efficacy of containment efforts, the extent of supply disruptions, the repercussions of the dramatic tightening in global financial market conditions, shifts in spending patterns, behavioral changes (such as people avoiding shopping malls and public transportation), confidence effects, and volatile commodity prices.”
For fiscal 2021, we expect the global economy to be slow in the first half of the year and then pick up activity as the economy recovers from the coronavirus disease ("COVID-19"). We believe information technology spending will incrementally improve over
44
the long term as increased global competition and disruptions in supply chains from COVID-19 force companies to improve productivity by upgrading their technology systems. Although this improvement could slow or regress at any time, due in part to concerns in global capital markets and general economic conditions, we believe that our organizational and financial structure will enable us to take advantage of any sustained economic rebound. Customers continue to take long periods to evaluate discretionary software purchases.
As the economy improves from the COVID-19 decline, we believe that the recovery may drive some businesses to invest in achieving more process and efficiency enhancements in their operations and to invest in solutions that improve operating margins, rather than make large infrastructure-type technology purchases. If this trend continues, we believe it may tend to favor our supply chain solutions, which are designed to provide a more rapid return on investment and are targeted at some of the largest profit drivers in a customer’s business. While the recent difficult economic environment has had a particularly adverse impact on the weaker companies in our target markets, we believe a large percentage of our customers are seeking to make investments to strengthen their operations, and some are taking advantage of current economic conditions to gain market share. We have taken steps to best ensure the health and safety of our employees globally. Our daily execution has evolved into a largely virtual model, and we continue to find innovative ways to engage with customers and prospects, ensuring that they are supported as they navigate through this unprecedented period.
Business Opportunities and Risks
We currently view the following factors as the primary opportunities and risks associated with our business:
• | Dependence on Capital Spending Patterns. There is risk associated with our dependence on the capital spending patterns of U.S. and international businesses, which in turn are functions of economic trends and conditions over which we have no control. |
• | Acquisition Opportunities. There are opportunities for selective acquisitions or investments to expand our sales distribution channels and/or broaden our product offering by providing additional solutions for our target markets. |
• | Acquisition Risks. There are risks associated with acquisitions of complementary companies, products and technologies, including the risks that we will not achieve the financial and strategic goals that we contemplate at the time of the transaction. More specifically, in any acquisition we will face risks and challenges associated with the uncertain value of the acquired business or assets, the difficulty of assimilating operations and personnel, integrating acquired technologies and products and maintaining the loyalty of the customers of the acquired business. |
• | Competitive Technologies. There is a risk that our competitors may develop technologies that are substantially equivalent or superior to our technology. |
• | Competition in General. There are risks inherent in the market for business application software and related services, which has been and continues to be intensely competitive; for example, some of our competitors may become more aggressive with their prices and/or payment terms, which may adversely affect our profit margins. |
For more information, please see “Risk Factors” in Item 1A. above.
Recent Accounting Pronouncements
For information with respect to recent accounting pronouncements, if any, and the impact of these pronouncements on our consolidated financial statements, if any, see Note 1(n) of Notes to Consolidated Financial Statements included elsewhere in this Form 10-K.
Market Conditions by Operating Segment
We operate and manage our business in three segments based on software and services provided in three key product markets: (1) SCM, which provides collaborative supply chain solutions to streamline and optimize the production, distribution and management of products between trading partners; (2) IT Consulting, which consists of IT staffing and consulting services; and (3) Other, which consists of (i) American Software ERP, a provider of purchasing and materials management, customer order processing, financial, human resources, and manufacturing solutions, and (ii) unallocated corporate overhead expenses. The SCM segment includes the businesses of Logility, DMI and NGC.
Our SCM segment experienced a 10% increase in revenues during fiscal 2020 when compared to fiscal 2019, primarily due to a 57% increase in subscription fees, a 12% increase in professional services and other revenues and a 5% increase in license fees partially offset by a 5% decrease in maintenance revenue. Our SCM segment experienced a 6% decrease in revenues during fiscal
45
2019 when compared to fiscal 2018, primarily due to a 54% decrease in license fees and a 16% decrease in professional services and other revenues partially offset by a 58% increase in subscription fees and a 4% increase in maintenance revenues.
Our IT Consulting segment experienced an approximately 10% decrease in revenues in fiscal 2020 when compared to fiscal 2019 and an increase in revenues of approximately 8% in fiscal 2019 when compared to fiscal 2018, due primarily to fluctuations in IT staffing work at our largest customer. As companies have moved to cut costs and limit IT budgets, they have utilized more outsourcing services, which tend to be more cost effective for them. In the past, this trend has resulted in increased business for this segment. However, there is a countervailing trend to outsource IT to international markets that historically have been more price competitive than domestic sources like us. Our largest consulting customer comprised 33% of our IT Consulting revenues in fiscal 2020, 47% in fiscal 2019 and 45% in fiscal 2018. The loss of this customer would negatively and materially affect our IT Consulting business.
The Other segment revenues increased 2% in fiscal 2020 when compared to fiscal 2019, primarily due to a 70% increase in license fees and a 4% increase in professional services and other revenues, partially offset by a 6% decrease in maintenance revenues. The Other segment revenues decreased 9% in fiscal 2019 when compared to fiscal 2018, primarily due to a 19% decrease in license fees and a 14% decrease in maintenance revenues, partially offset by a 3% increase in professional services and other revenues.
REVENUES
Years Ended April 30, | ||||||||||||||||||||||||||
2020 | 2019 | 2018 | % Change | % of Total Revenues | ||||||||||||||||||||||
2020 to 2019 | 2019 to 2018 | 2020 | 2019 | 2018 | ||||||||||||||||||||||
(in thousands) | ||||||||||||||||||||||||||
Subscription fees | $ | 22,033 | $ | 14,026 | $ | 8,855 | 57 | % | 58 | % | 19 | % | 13 | % | 8 | % | ||||||||||
License fees | 7,582 | 7,126 | 15,344 | 6 | % | (54 | )% | 7 | % | 6 | % | 13 | % | |||||||||||||
Professional service and other | 42,774 | 42,154 | 44,663 | 1 | % | (6 | )% | 37 | % | 39 | % | 40 | % | |||||||||||||
Maintenance | 43,077 | 45,400 | 43,841 | (5 | )% | 4 | % | 37 | % | 42 | % | 39 | % | |||||||||||||
Total revenues | $ | 115,466 | $ | 108,706 | $ | 112,703 | 6 | % | (4 | )% | 100 | % | 100 | % | 100 | % | ||||||||||
For the year ended April 30, 2020, the 6% increase in total revenues was attributable primarily to a 57% increase in subscription fees revenues, a 6% increase in license revenues and a 1% increase in professional services and other revenues, partially offset by a 5% decrease in maintenance revenues.
For the year ended April 30, 2019, the 4% decrease in total revenues was attributable primarily to a 54% decrease in license fees and a 6% decrease in professional services and other revenues, partially offset by a 58% increase in subscription fees revenues and a 4% increase in maintenance revenues.
Due to intensely competitive markets, we discount license fees from our published list price due to pricing pressure in our industry. Numerous factors contribute to the amount of the discounts provided, such as previous customer purchases, the number of customer sites utilizing the software, the number of modules purchased and the number of users, the type of platform deployment, as well as the overall size of the contract. While all these factors affect the discount amount of a particular contract, the overall percentage discount has not materially changed in the recent reported fiscal periods.
The change in our revenues from period to period is primarily due to the volume of products and related services sold in any period and the amounts of products or modules purchased with each sale.
International revenues represented approximately 19% of total revenues for the year ended April 30, 2020, 20% of total revenues for the year ended April 30, 2019, and 19% for the year ended April 30, 2018. Our international revenues may fluctuate substantially from period to period primarily because we derive these revenues from a relatively small number of customers.
46
Subscription Fees Revenues
Years Ended April 30, | |||||||||||||||||
2020 | 2019 | 2018 | % Change | ||||||||||||||
2020 to 2019 | 2019 to 2018 | ||||||||||||||||
(in thousands) | |||||||||||||||||
Supply Chain Management | $ | 22,033 | $ | 14,026 | $ | 8,855 | 57 | % | 58 | % | |||||||
Total subscription fees revenue | $ | 22,033 | $ | 14,026 | $ | 8,855 | 57 | % | 58 | % | |||||||
For the year ended April 30, 2020, Cloud Services Annual Contract Value ("ACV") increased approximately 53% to $26.4 million compared to $17.3 million in the same period of the prior year due to an increase in the number of contracts, contracts with a higher cloud services ACV, as well as an increase in multi–year contracts (typically three to five years). This is evidence of our successful transition to the cloud subscription model. ACV is a forward-looking operating measure used by management to better understand Cloud Services (SaaS and other related cloud services) revenue trends within our business, as it reflects our current estimate of revenue to be generated under existing client contracts in the forward 12-month period.
License Fees Revenues
Years Ended April 30, | |||||||||||||||||
2020 | 2019 | 2018 | % Change | ||||||||||||||
2020 to 2019 | 2019 to 2018 | ||||||||||||||||
(in thousands) | |||||||||||||||||
Supply Chain Management | $ | 7,354 | $ | 6,992 | $ | 15,177 | 5 | % | (54 | )% | |||||||
Other | 228 | 134 | 167 | 70 | % | (20 | )% | ||||||||||
Total license fees revenues | $ | 7,582 | $ | 7,126 | $ | 15,344 | 6 | % | (54 | )% | |||||||
For the year ended April 30, 2020, license fee revenues increased by 6% when compared to the previous year. Our Other business segment experienced a 70% increase in license fees for the year ended April 30, 2020 when compared to the same period in the prior year due to the timing of selling into the installed customer base. SCM experienced a 5% increase in license fees primarily due to a few new customers choosing to deploy our software on-premise this year. However, the majority of our current year license fee revenue is generated from additional users and expanded scope from our existing customers. SCM constituted 97%, 98% and 99% of our total license fee revenues for the years ended April 30, 2020, 2019 and 2018, respectively.
For the year ended April 30, 2019, license fee revenues decreased by 54% when compared to the previous year due primarily to lower overall business information technology spending. SCM experienced a 54% decrease in license fees primarily due to the increased sales of our products on our Cloud Services platform that require revenue to be deferred over the life of the contracted period, which is typically three to five years. Our Other business segment experienced a 20% decrease in license fees for the year ended April 30, 2019 when compared to the same period in the prior year due to the timing of selling into the installed customer base.
The direct sales channel provided approximately 92% of license fee revenues for the year ended April 30, 2020, compared to approximately 84% in fiscal 2019 and 85% in fiscal 2018. The increase in direct license fees from fiscal 2019 to fiscal 2020 was largely due to our indirect channel selling proportionately more SaaS than license contracts compared to our direct channel. The decrease in indirect license fees from fiscal 2018 to fiscal 2019 was largely due to lower overall business information technology spending.
For the year ended April 30, 2020, our margins after commissions on direct sales were approximately 88%, and our margins after commissions on indirect sales were approximately 53%. For the year ended April 30, 2019, our margins after commissions on direct sales were approximately 87%, and our margins after commissions on indirect sales were approximately 55%. For the year ended April 30, 2018, our margins after commissions on direct sales were approximately 84%, and our margins after commissions on indirect sales were approximately 36%. The margins after commissions for direct were relatively consistent in a range of 84% to 88%, while the range for indirect sales had a wider spread of 36% to 55%. The indirect channel margins for the fiscal year ended April 30, 2020 decreased when compared to the same periods in the prior year due to the mix of value-added reseller (“VAR”) commission rates. DMI is the source of the bulk of our indirect sales and the commission percentage varies based on whether the sale is domestic or international.
47
Professional Services and Other Revenues
Years Ended April 30, | |||||||||||||||||
2020 | 2019 | 2018 | % Change | ||||||||||||||
2020 to 2019 | 2019 to 2018 | ||||||||||||||||
(in thousands) | |||||||||||||||||
Supply Chain Management | $ | 23,782 | $ | 21,190 | $ | 25,272 | 12 | % | (16 | )% | |||||||
IT Consulting | 17,997 | 20,007 | 18,460 | (10 | )% | 8 | % | ||||||||||
Other | 995 | 957 | 931 | 4 | % | 3 | % | ||||||||||
Total professional services and other revenues | $ | 42,774 | $ | 42,154 | $ | 44,663 | 1 | % | (6 | )% | |||||||
The 1% increase in total professional services and other revenues for the year ended April 30, 2020 was due to a 12% increase from our SCM segment due primarily due to a ramp up of implementation project work resulting from increased subscription and license fee sales in recent periods, combined with a 4% increase in our Other segment due to utilization from project implementation services and services revenues. This increase was partially offset by an 10% decrease in our IT consulting segment due to the timing of project work.
The 6% decrease in total professional services and other revenues for the year ended April 30, 2019 was due to a 16% decrease in professional services and other revenues from our SCM segment due primarily to the timing of implementation project work. This decrease was partially offset by an 8% increase in our IT consulting segment and a 3% increase in our Other segment due to utilization from project implementation services and services revenues.
In our software segments, we have observed that there is a tendency for professional services and other revenues to lag changes in license revenues by one to three quarters, as new licenses in one quarter often involve implementation and consulting services in subsequent quarters, for which we recognize revenues only as we perform those services.
Maintenance Revenues
Years Ended April 30, | |||||||||||||||||
2020 | 2019 | 2018 | % Change | ||||||||||||||
2020 to 2019 | 2019 to 2018 | ||||||||||||||||
(in thousands) | |||||||||||||||||
Supply Chain Management | $ | 41,848 | $ | 44,088 | $ | 42,309 | (5 | )% | 4 | % | |||||||
Other | 1,229 | 1,312 | 1,532 | (6 | )% | (14 | )% | ||||||||||
Total maintenance revenues | $ | 43,077 | $ | 45,400 | $ | 43,841 | (5 | )% | 4 | % | |||||||
The 5% decrease in total maintenance revenues for the year ended April 30, 2020 was due to a 6% decrease in our Other segment due to fewer customer renewals and a 5% decrease in maintenance revenues from our SCM segment due to normal customer attrition.
The 4% increase in total maintenance revenues for the year ended April 30, 2019 was due to a 4% increase in maintenance revenues from our SCM segment and increased revenue from additional license sales. This increase was partially offset by a 14% decrease in our Other segment due to fewer customer renewals and lower software license sales.
The SCM segment’s maintenance revenues constituted 97% of total maintenance revenues for the years ended April 30, 2020, 2019 and 2018. Typically, our maintenance revenues have had a direct relationship to current and historic license fee revenues, since new licenses are the potential source of new maintenance customers.
48
GROSS MARGIN
The following table provides both dollar amounts and percentage measures of gross margin:
Years Ended April 30, | ||||||||||||||||||||
2020 | 2019 | 2018 | ||||||||||||||||||
(in thousands) | ||||||||||||||||||||
Gross margin on subscriptions fees | $ | 12,542 | 57 | % | $ | 8,267 | 59 | % | $ | 5,038 | 57 | % | ||||||||
Gross margin on license fees | 2,784 | 37 | % | 696 | 10 | % | 9,083 | 59 | % | |||||||||||
Gross margin on professional services and other | 12,079 | 28 | % | 10,733 | 25 | % | 14,067 | 31 | % | |||||||||||
Gross margin on maintenance | 35,753 | 83 | % | 37,044 | 82 | % | 34,515 | 79 | % | |||||||||||
Total gross margin | $ | 63,158 | 55 | % | $ | 56,740 | 52 | % | $ | 62,703 | 56 | % | ||||||||
The total gross margin percentage for the year ended April 30, 2020 increased to 55% when compared to the same period in the prior year due to increases in gross margin percentage for license fees, professional services and other gross margins and maintenance gross margins, partially offset by a decrease in subscription fees margins. The total gross margin percentage for the year ended April 30, 2019 decreased to 52% when compared to the same period in the prior year, due to the decrease in gross margin percentage for license fees and professional services and other gross margins, partially offset by an increase in subscription fees and maintenance gross margins.
Gross Margin on Subscription Fees
For the year ended April 30, 2020, our gross margin percentage on subscription fees decreased from 59% in fiscal 2019 to 57% primarily due to an increase in capitalized software amortization expense.
For the year ended April 30, 2019, our gross margin percentage on subscription fees increased from 57% in fiscal 2019 to 59% primarily due to higher gross margins in our SCM segment services gross margin primarily due to an increase in our subscription services revenue which has higher margins.
Gross Margin on License Fees
The increase in license fee gross margin percentage for the year ended April 30, 2020 when compared to fiscal 2019 was primarily due to lower agent commission and amortization of intangibles expense and to a lesser extent higher license fee revenue.
The decrease in license fee gross margin percentage for the year ended April 30, 2019 when compared to fiscal 2018 was primarily due to lower license fee revenue and higher amortization of intangibles expense. This was partially offset by lower capitalized software amortization expense and agent commission expense.
License fee gross margin percentage tends to be directly related to the level of license fee revenues due to the relatively fixed cost of computer software amortization expense, amortization of acquired software and the sales mix between our direct and indirect channels.
Gross Margin on Professional Services and Other
For the year ended April 30, 2020, our gross margin percentage on professional services and other increased from 25% in fiscal 2019 to 28% due to increased gross margins in our SCM segment which increased from 28% in fiscal 2019 to 35% in fiscal 2020 due to increased revenues and higher billing utilization. Our IT Consulting segment professional services and other revenue gross margin decreased from 22% in fiscal 2019 to 18% in fiscal 2020 due to a decrease in project related billing. Our other segment increased from 47% in fiscal 2019 to 53% in fiscal 2020 due to improved billing utilization rates.
For the year ended April 30, 2019, our gross margin percentage on professional services and other decreased from 31% in fiscal 2018 to 25% primarily due to lower gross margins in our SCM segment, which decreased from 39% in fiscal 2018 to 28% due to lower revenues and lower billing utilization. Our IT Consulting segment professional services and other revenue gross margin increased from 21% in fiscal 2018 to 22% in fiscal 2019 due to an increase in project related billing. Our other segment increased from 44% in fiscal 2018 to 47% in fiscal 2019 due to improved billing utilization rates.
49
As discussed above, our IT Consulting segment typically has lower margins when compared to the Other segments that have higher margin implementation service revenue. The IT Consulting segment was 42%, 47% and 41% of the Company’s professional services and other revenues in fiscal 2020, 2019 and 2018, respectively. Our SCM segment was 56%, 50% and 57% of the Company’s professional services and other revenues in fiscal 2020, 2019 and 2018, respectively. Our Other segment was 2%, 3% and 2% of the Company’s professional services and other revenues in fiscal 2020, 2019 and 2018, respectively.
Gross Margin on Maintenance
Maintenance gross margin increased to 83% in fiscal 2020 from 82% in fiscal 2019 due to cost containment efforts. The primary cost component is maintenance staffing, which is relatively inelastic in the short term.
EXPENSES
Years Ended April 30, | ||||||||||||||||||||
2020 | 2019 | 2018 | % of Revenues | |||||||||||||||||
2020 | 2019 | 2018 | ||||||||||||||||||
(in thousands) | ||||||||||||||||||||
Research and development | $ | 15,348 | $ | 13,078 | $ | 11,877 | 13 | % | 12 | % | 11 | % | ||||||||
Sales and marketing | 21,958 | 20,992 | 20,658 | 19 | % | 19 | % | 18 | % | |||||||||||
General and administrative | 19,519 | 17,006 | 16,057 | 17 | % | 16 | % | 14 | % | |||||||||||
Amortization of acquisition-related intangible assets | 285 | 388 | 580 | — | % | — | % | 1 | % | |||||||||||
Other income, net | 750 | 2,365 | 2,184 | — | % | 2 | % | 2 | % | |||||||||||
Income tax expense | 56 | 838 | 3,662 | — | % | 1 | % | 3 | % | |||||||||||
Research and Development
Gross product research and development costs include all non-capitalized and capitalized software development costs.
A breakdown of the research and development costs is as follows:
Years Ended April 30, | |||||||||||||||||
2020 | Percent Change | 2019 | Percent Change | 2018 | |||||||||||||
Total capitalized computer software development costs | $ | 3,170 | (47 | )% | $ | 5,961 | 24 | % | $ | 4,804 | |||||||
Percentage of gross product research and development costs | 17 | % | 31 | % | 29 | % | |||||||||||
Total research and development expense | 15,348 | 17 | % | 13,078 | 10 | % | 11,877 | ||||||||||
Percentage of total revenues | 13 | % | 12 | % | 11 | % | |||||||||||
Total research and development expense and capitalized computer software development costs | $ | 18,518 | (3 | )% | $ | 19,039 | 14 | % | $ | 16,681 | |||||||
Percentage of total revenues | 16 | % | 18 | % | 15 | % | |||||||||||
Total amortization of capitalized computer software development costs* | $ | 5,871 | 27 | % | $ | 4,627 | 25 | % | $ | 3,690 | |||||||
______________
* | Included in cost of license fees and cost of subscription fees. |
For the year ended April 30, 2020, gross product research and development costs and capitalized software development costs decreased by 3% primarily due to a decrease in headcount from third-party contractors compared to fiscal 2019. Capitalized software development costs decreased in fiscal 2020 compared to fiscal 2019 due to the timing of project work. Amortization of capitalized software development increased 27% in fiscal 2020 when compared to fiscal 2019 due to the timing of project releases.
For the year ended April 30, 2019, gross product research and development costs and capitalized software development costs increased by 14% primarily due to increased headcount from third-party contractors and the Halo acquisition. Capitalized software development costs increased in fiscal 2019 compared to fiscal 2018 due to the timing of project work. Amortization of capitalized software development increased 25% in fiscal 2019 when compared to fiscal 2018 due to the timing of project releases.
50
Sales and Marketing
In the year ended April 30, 2020, the increase in sales and marketing expenses compared to fiscal 2019 was due primarily to an increase in headcount, higher variable compensation, higher sales commissions, an increase in contractor costs and an increase in recruiting fees, which was partially offset by lower marketing spend and lower travel costs due to COVID-19. In the year ended April 30, 2019, the slight uptick in sales and marketing expenses compared to fiscal 2018 was due primarily to an increase in costs related to the Halo acquisition and an increase in marketing spend which was partially offset by lower sales commissions.
General and Administrative
For the year ended April 30, 2020, the increase in general and administrative expenses compared to fiscal 2019 was primarily due to higher variable compensation and higher overhead costs and, to a lesser extent, higher legal, stock option and insurance costs.
For the year ended April 30, 2019, the increase in general and administrative expenses compared to fiscal 2018 was primarily due to overhead costs related to the Halo acquisition and an increase in depreciation from office improvements, partially offset by lower variable compensation.
The total number of employees was 428 on April 30, 2020, 424 on April 30, 2019 and 462 on April 30, 2018.
Amortization of Acquisition-related Intangible Assets
For the year ended April 30, 2020, we recorded $1.6 million in intangible amortization expense, of which $0.3 million is included in operating expenses and $1.3 million is included in cost of license fees.
For the year ended April 30, 2019, we recorded $2.4 million in intangible amortization expense, of which $0.4 million is included in operating expenses and $2.0 million is included in cost of license fees.
Operating Income/(Loss)
Years Ended April 30, | |||||||||||||||||
% Change | |||||||||||||||||
2020 | 2019 | 2018 | 2020 to 2019 | 2019 to 2018 | |||||||||||||
(in thousands) | |||||||||||||||||
Supply Chain Management | $ | 19,612 | $ | 15,967 | $ | 19,580 | 23 | % | (18 | )% | |||||||
IT Consulting | 332 | 964 | 985 | (66 | )% | (2 | )% | ||||||||||
Other* | (13,896 | ) | (11,655 | ) | (7,034 | ) | 19 | % | 66 | % | |||||||
Total Operating Income | $ | 6,048 | $ | 5,276 | $ | 13,531 | 15 | % | (61 | )% | |||||||
______________
* | Includes certain unallocated expenses. |
Our SCM segment operating income increased by 23% in fiscal 2020 compared to fiscal 2019 primarily due to a 10% increase in revenues. Our SCM segment operating income decreased by 18% in fiscal 2019 compared to fiscal 2018 primarily due to a 6% decrease in revenues.
Our IT Consulting segment operating income decreased 66% in fiscal 2020 compared to fiscal 2019 primarily due to a decrease in revenues and lower gross margins due to the type of project billing. Our IT Consulting segment operating income decreased 2% in fiscal 2019 compared to fiscal 2018 primarily due to an increase in sales and marketing costs.
The increase in the Other segment operating loss in fiscal 2020 when compared to fiscal 2019 was due primarily to an increase in variable compensation and overhead costs, partially offset by a 2% increase in revenues in fiscal 2020. The increase in the Other segment operating loss in fiscal 2019 when compared to fiscal 2018 was due primarily to the 9% decrease in revenues in fiscal 2019.
Other Income
Other income is comprised of net interest and dividend income, rental income net of related depreciation expenses, exchange rate gains and losses, realized and unrealized gains and losses from investments. Other income was approximately $0.8 million in the year ended April 30, 2020 compared to $2.4 million in fiscal 2019. The decrease was primarily due to unrealized losses of $0.1 million in fiscal 2020 compared to unrealized gains of $1.0 million for the same period last year, lower interest income of $1.5 million in
51
fiscal 2020 compared to $2.1 million in fiscal 2019 and higher exchange rate losses of approximately $605,000 compared to $486,000 for the same period last year.
Other income was approximately $2.4 million in the year ended April 30, 2019 compared to $2.2 million in fiscal 2018. The increase was primarily due higher interest income of $1.8 million in fiscal 2019 compared to $1.3 million in fiscal 2018. This increase was partially offset by higher exchange rate losses of approximately $486,000 compared to $16,000 for the same period last year.
For the years ended April 30, 2020 and 2019, our investments generated an annualized yield of approximately 1.4% and 1.3%, respectively.
Income Taxes
During the year ended April 30, 2020, we recorded income tax expense of $56,000 compared to $838,000 in fiscal 2019 and $3.7 million in fiscal 2018. Our effective income tax rate takes into account the source of taxable income by state, and available income tax credits. Our effective tax rate was 1%, 11%, and 23% in fiscal 2020, 2019 and 2018, respectively. The effective tax rate for fiscal 2020 is lower compared to fiscal 2019 due to an increase in the amount of excess tax benefits from stock option deductions.
On December 22, 2017, the U.S. enacted the Tax Cuts and Jobs Act (the “Act”), which significantly changed U.S. tax law. The Act lowered our U.S. statutory federal income tax rate from 35% to 21% effective January 1, 2018. For fiscal 2018, our blended U.S. federal statutory tax rate was 30.3%. This is the result of using the tax rate of 35% for the first eight months of fiscal 2018 and the reduced tax rate of 21% for the final four months of fiscal 2018. During the year ended April 30, 2018, we recorded a $1.2 million benefit from the impact of changes in the tax rate, primarily on deferred tax assets and liabilities, which was included in income tax expense on our consolidated statement of operations and deferred income taxes on our consolidated balance sheet. We remeasured our deferred taxes to reflect the reduced rate that will apply when these deferred taxes are settled or realized in future periods. To calculate the remeasurement of deferred taxes, we estimated when the existing deferred taxes will be settled or realized.
Operating Pattern
We experience an irregular pattern of quarterly and annual operating results, caused primarily by fluctuations in both the number and size of software contracts received and delivered from quarter to quarter and our ability to recognize revenues in that quarter and annually in accordance with our revenue recognition policies. We expect this pattern to continue.
LIQUIDITY AND CAPITAL RESOURCES
Sources and Uses of Cash
We have historically funded, and continue to fund, our operations and capital expenditures primarily with cash generated from operating activities. The changes in net cash that our operating activities provide generally reflect the changes in net earnings and non-cash operating items plus the effect of changes in operating assets and liabilities, such as investment trading securities, trade accounts receivable, trade accounts payable, accrued expenses and deferred revenue. We have no debt obligations or off-balance sheet financing arrangements, and therefore we used no cash for debt service purposes.
The following tables provide information about our cash flows and liquidity positions as of and for the fiscal years ended April 30, 2020, 2019 and 2018. You should read these tables and the discussion that follows in conjunction with our consolidated statements of cash flows contained in Item 8 of this report.
Years ended April 30, | |||||||||||
2020 | 2019 | 2018 | |||||||||
(in thousands) | |||||||||||
Net cash provided by operating activities | $ | 25,982 | $ | 23,930 | $ | 6,754 | |||||
Net cash used in investing activities | (3,590 | ) | (7,213 | ) | (15,382 | ) | |||||
Net cash used in financing activities | (3,866 | ) | (8,223 | ) | (4,579 | ) | |||||
Net change in cash and cash equivalents | $ | 18,526 | $ | 8,494 | $ | (13,207 | ) | ||||
The increase in cash provided by operating activities in fiscal 2020 compared to fiscal 2019 was due primarily to: (1) an increase in the net proceeds from sales and maturities of trading securities due to timing of purchases and maturity dates, (2) an increase in accounts payable and other liabilities in fiscal 2020 when compared to a decrease in fiscal 2019 due primarily to timing and the amount of sales commissions and bonuses, (3) unrealized losses on investments due to timing of sales of investments, (4) an increase in deferred revenues in fiscal 2020 when compared to fiscal 2019 primarily due to the timing of cloud and maintenance revenue recognition, (5) higher depreciation and amortization expense due to timing of closing capitalized software projects and office
52
renovations, (6) a higher stock-based compensation expense in fiscal 2020 due to an increase in options granted and (7) a lower gain on sale of fixed assets in fiscal 2020 when compared to fiscal 2019.
These factors were partially offset by: (1) an increase in the purchases of trading securities due to timing, (2) an increase in accounts receivable in fiscal 2020 when compared to an decrease in fiscal 2019 due to timing of sales and billing, (3) an increase in prepaid expenses and other assets in fiscal 2020 compared to the decrease in fiscal 2019 due to timing of purchases, (4) a decrease in deferred income taxes in fiscal 2020 compared to fiscal 2019 due to timing and (5) a decrease in net earnings.
The decrease in cash used in investing activities in fiscal 2020 compared to cash used in investing activities in fiscal 2019 was due to: a decrease in capitalized software development costs due to the timing of R&D efforts and lower purchases of equipment.
The decrease in cash used in financing activities in fiscal 2020 when compared to fiscal 2019 was due primarily to: an increase in proceeds from exercise of stock options, partially offset by an increase in cash dividends paid on common stock in fiscal 2020 due to an increase in the shares outstanding.
The following table provides information regarding the changes in our total cash and investments position:
As of April 30, | |||||||
2020 | 2019 | ||||||
(in thousands) | |||||||
Cash and cash equivalents | $ | 79,814 | $ | 61,288 | |||
Investments | 14,862 | 27,194 | |||||
Total cash and investments | $ | 94,676 | $ | 88,482 | |||
Net increase in total cash and investments | $ | 6,194 | $ | 674 | |||
The following table provides information regarding our known contractual obligations as of April 30, 2020 (in thousands): (See Notes to Consolidated Financial Statements—Note 7)
Payments due by Period | ||||||||||||||||||||
Contractual Obligations | Total | 1 year | 1-3 years | 3-5 years | More than 5 years | |||||||||||||||
Operating Leases | $ | 2,313 | $ | 775 | $ | 1,172 | $ | 366 | $ | — | ||||||||||
As a result of the positive cash flows from operations our business has generated in recent periods, and because as of April 30, 2020, we had $94.7 million in cash and cash equivalents and investments with no debt, we believe that our sources of liquidity and capital resources will be sufficient to satisfy our presently anticipated requirements for working capital, capital expenditures and other corporate needs during at least the next twelve months. However, at some future date we may need to seek additional sources of capital to meet our requirements. If such need arises, we may be required to raise additional funds through equity or debt financing. We currently do not have a bank line of credit. We can provide no assurance that bank lines of credit or other financing will be available on terms acceptable to us. If available, such financing may result in dilution to our shareholders or higher interest expense.
Days Sales Outstanding ("DSO") in accounts receivable were 78 and 70 days as of April 30, 2020 and April 30, 2019, respectively. Our current ratio on April 30, 2020 was 2.9 to 1, compared to 2.6 to 1 on April 30, 2019. DSO can fluctuate significantly on a quarterly basis due to a number of factors including the percentage of total revenues that comes from software license sales (which typically have installment payment terms), seasonality, shifts in customer buying patterns, the timing of customer payments and annual SaaS and maintenance renewals, lengthened contractual payment terms in response to competitive pressures, the underlying mix of products and services, and the geographic concentration of revenues.
On August 19, 2002, our Board of Directors approved a resolution authorizing the repurchase of up to 2.0 million shares of our Class A common stock. These repurchases have been and will be made through open market purchases at prevailing market prices. The timing of any repurchases will depend upon market conditions, the market price of our common stock and management’s assessment of our liquidity and cash flow needs. For this repurchase plan, through April 30, 2020, we have repurchased 1,053,679 shares of common stock at a cost of approximately $6.2 million. Under all repurchase plans as of April 30, 2020, we have repurchased 4,588,632 shares of common stock at a cost of approximately $25.6 million.
Off-Balance Sheet Arrangements
53
We are not a party to any off-balance sheet arrangements that have, or are reasonably likely to have, a material current or future effect on our financial condition, revenues or expenses, results of operations, liquidity, capital expenditures or capital resources.
See Item 5 of this report, under the caption “Market for Registrant’s Common Equity, Related Stockholder Matters, and Issuer Purchases of Equity Securities.”
ITEM 7A. | QUANTITATIVE AND QUALITATIVE DISCLOSURES ABOUT MARKET RISK |
Foreign Currency. For the fiscal years ended April 30, 2020 and 2019, we generated 19% and 20%, respectively, of our revenues outside of the United States. We typically denominate our international sales in U.S. dollars, euros or British pounds sterling. Our consolidated financial statements are presented in U.S. dollars, which is also the functional currency for our foreign operations. Where transactions may be denominated in foreign currencies, we are subject to market risk with respect to fluctuations in the relative value of currencies. We recorded exchange rate losses of approximately $605,000 and $486,000 in fiscal 2020 and 2019, respectively. We estimate that a 10% movement in foreign currency rates would have the effect of creating an exchange gain or loss of approximately $652,000 for fiscal 2020.
Interest Rates and Other Market Risks. We manage our interest rate risk by maintaining an investment portfolio of trading investments with high credit quality and relatively short average maturities. These instruments include, but are not limited to, money-market instruments, bank time deposits, and taxable and tax-advantaged variable rate and fixed rate obligations of corporations, municipalities, and national, state, and local government agencies. These instruments are denominated in U.S. dollars. The fair market value of our cash equivalents and investments increased 8% to approximately $90.1 million in fiscal 2020 from $83.8 million in the prior year.
We also hold cash balances in accounts with commercial banks in the United States and foreign countries. These cash balances represent operating balances only and are invested in short-term time deposits of the local bank. Such operating cash balances held at banks outside the United States are denominated in the local currency and are nominal.
Many of our investments carry a degree of interest rate risk. When interest rates fall, our income from investments in variable-rate securities declines. When interest rates rise, the fair market value of our investments in fixed-rate securities declines. In addition, our investments in equity securities are subject to stock market volatility. Due in part to these factors, our future investment income may fall short of expectations or we may suffer losses in principal if forced to sell securities, which have seen a decline in market value due to changes in interest rates. We attempt to mitigate risk by holding fixed-rate securities to maturity, but if our liquidity needs force us to sell fixed-rate securities prior to maturity, we may experience a loss of principal. We believe that a 10% fluctuation in interest rates would not have a material effect on our financial condition or results of operations.
Inflation. Although we cannot accurately determine the amounts attributable thereto, we have been affected by inflation through increased costs of employee compensation and other operational expenses. To the extent permitted by the marketplace for our products and services, we attempt to recover increases in costs by periodically increasing prices.
54
ITEM 8. | CONSOLIDATED FINANCIAL STATEMENTS AND SUPPLEMENTARY DATA |
INDEX TO CONSOLIDATED FINANCIAL STATEMENTS
Page | |
55
(a) Management’s Report on Internal Control Over Financial Reporting
Our management is responsible for establishing and maintaining adequate internal control over financial reporting. Internal control over financial reporting is a process designed by or under the supervision of our CEO and CFO, and used by our Board of Directors, management and other personnel to provide reasonable assurance regarding the reliability of financial reporting and the preparation of financial statements for external purposes in accordance with U.S. GAAP and includes those policies and procedures that:
• | Pertain to the maintenance of records that, in reasonable detail, accurately and fairly reflect our transactions and dispositions of our assets; |
• | Provide reasonable assurance that transactions are recorded as necessary to permit preparation of financial statements in accordance with U.S. GAAP, and that receipts and expenditures are being made only in accordance with authorizations from our management and directors; and |
• | Provide reasonable assurance regarding prevention or timely detection of unauthorized acquisition, use or disposition of our assets that could have a material effect on the financial statements. |
Because of its inherent limitations, there is a risk that material misstatements may not be prevented or detected on a timely basis by internal control over financial reporting. Also, projections of any evaluation of effectiveness to future periods are subject to the risk that controls may become inadequate because of changes in conditions, or that the degree of compliance with the policies or procedures may deteriorate.
Our management, including our Chief Executive Officer, and President, as our Principal Executive Officer (“PEO”), assessed the effectiveness of our internal control over financial reporting as of April 30, 2020. In making this assessment, our management used the criteria set forth in Internal Control—Integrated Framework (2013) published by the Committee of Sponsoring Organizations of the Treadway Commission (COSO). Based on this assessment, our management, including our PEO, has concluded that our internal control over financial reporting was effective as of April 30, 2020.
KPMG LLP, our independent registered public accounting firm, has issued an attestation report on the effectiveness of our internal control over financial reporting as of April 30, 2020, and this attestation report follows immediately below.
56
(b) Report of Independent Registered Public Accounting Firm
To the Shareholders and Board of Directors
American Software, Inc.:
Opinion on Internal Control Over Financial Reporting
We have audited American Software, Inc. and subsidiaries (the Company) internal control over financial reporting as of April 30, 2020, based on criteria established in Internal Control - Integrated Framework (2013) issued by the Committee of Sponsoring Organizations of the Treadway Commission. In our opinion, the Company maintained, in all material respects, effective internal control over financial reporting as of April 30, 2020, based on criteria established in Internal Control - Integrated Framework (2013) issued by the Committee of Sponsoring Organizations of the Treadway Commission.
We also have audited, in accordance with the standards of the Public Company Accounting Oversight Board (United States) (PCAOB), the consolidated balance sheets of the Company as of April 30, 2020 and 2019, the related consolidated statements of operations, shareholders’ equity, and cash flows for each of the years in the three-year period ended April 30, 2020, and the related notes and financial statement schedule II (collectively, the consolidated financial statements), and our report dated July 10, 2020 expressed unqualified opinion on those consolidated financial statements.
Basis for Opinion
The Company’s management is responsible for maintaining effective internal control over financial reporting and for its assessment of the effectiveness of internal control over financial reporting, included in the accompanying Management’s Report on Internal Control over Financial Reporting. Our responsibility is to express an opinion on the Company’s internal control over financial reporting based on our audit. We are a public accounting firm registered with the PCAOB and are required to be independent with respect to the Company in accordance with the U.S. federal securities laws and the applicable rules and regulations of the Securities and Exchange Commission and the PCAOB.
We conducted our audit in accordance with the standards of the PCAOB. Those standards require that we plan and perform the audit to obtain reasonable assurance about whether effective internal control over financial reporting was maintained in all material respects. Our audit of internal control over financial reporting included obtaining an understanding of internal control over financial reporting, assessing the risk that a material weakness exists, and testing and evaluating the design and operating effectiveness of internal control based on the assessed risk. Our audit also included performing such other procedures as we considered necessary in the circumstances. We believe that our audit provides a reasonable basis for our opinion.
Definition and Limitations of Internal Control Over Financial Reporting
A company’s internal control over financial reporting is a process designed to provide reasonable assurance regarding the reliability of financial reporting and the preparation of financial statements for external purposes in accordance with generally accepted accounting principles. A company’s internal control over financial reporting includes those policies and procedures that (1) pertain to the maintenance of records that, in reasonable detail, accurately and fairly reflect the transactions and dispositions of the assets of the company; (2) provide reasonable assurance that transactions are recorded as necessary to permit preparation of financial statements in accordance with generally accepted accounting principles, and that receipts and expenditures of the company are being made only in accordance with authorizations of management and directors of the company; and (3) provide reasonable assurance regarding prevention or timely detection of unauthorized acquisition, use, or disposition of the company’s assets that could have a material effect on the financial statements.
Because of its inherent limitations, internal control over financial reporting may not prevent or detect misstatements. Also, projections of any evaluation of effectiveness to future periods are subject to the risk that controls may become inadequate because of changes in conditions, or that the degree of compliance with the policies or procedures may deteriorate.
/s/ KPMG LLP
Atlanta, Georgia
July 10, 2020
57
(c) Report of Independent Registered Public Accounting Firm
To the Shareholders and Board of Directors
American Software, Inc.:
Opinion on the Consolidated Financial Statements
We have audited the accompanying consolidated balance sheets of American Software, Inc. and subsidiaries (the Company) as of April 30, 2020 and 2019, the related consolidated statements of operations, shareholders’ equity, and cash flows for each of the years in the three‑year period ended April 30, 2020, and the related notes and financial statement schedule II (collectively, the consolidated financial statements). In our opinion, the consolidated financial statements present fairly, in all material respects, the financial position of the Company as of April 30, 2020 and 2019, and the results of its operations and its cash flows for each of the years in the three‑year period ended April 30, 2020, in conformity with U.S. generally accepted accounting principles.
We also have audited, in accordance with the standards of the Public Company Accounting Oversight Board (United States) (PCAOB), the Company’s internal control over financial reporting as of April 30, 2020, based on criteria established in Internal Control - Integrated Framework (2013) issued by the Committee of Sponsoring Organizations of the Treadway Commission, and our report dated July 10, 2020 expressed an unqualified opinion on the effectiveness of the Company’s internal control over financial reporting.
Change in Accounting Principle
As discussed in Note 1(n) to the consolidated financial statements, the Company has changed its method of accounting for revenue recognition in 2019 due to the adoption of ASU 2014-09, Revenue from Contracts with Customers and the related amendments.
As discussed in Note 1(n) to the consolidated financial statements, the Company has changed its method of accounting for leases in 2020 due to the adoption of ASU 2016-02, Leases and the related amendments.
Basis for Opinion
These consolidated financial statements are the responsibility of the Company’s management. Our responsibility is to express an opinion on these consolidated financial statements based on our audits. We are a public accounting firm registered with the PCAOB and are required to be independent with respect to the Company in accordance with the U.S. federal securities laws and the applicable rules and regulations of the Securities and Exchange Commission and the PCAOB.
We conducted our audits in accordance with the standards of the PCAOB. Those standards require that we plan and perform the audit to obtain reasonable assurance about whether the consolidated financial statements are free of material misstatement, whether due to error or fraud. Our audits included performing procedures to assess the risks of material misstatement of the consolidated financial statements, whether due to error or fraud, and performing procedures that respond to those risks. Such procedures included examining, on a test basis, evidence regarding the amounts and disclosures in the consolidated financial statements. Our audits also included evaluating the accounting principles used and significant estimates made by management, as well as evaluating the overall presentation of the consolidated financial statements. We believe that our audits provide a reasonable basis for our opinion.
/s/ KPMG LLP
We have served as the Company’s auditor since 1982.
Atlanta, Georgia
July 10, 2020
58
American Software, Inc. and Subsidiaries
Consolidated Balance Sheets
April 30, 2020 and 2019
(in thousands, except share data)
2020 | 2019 | ||||||
ASSETS | |||||||
Current assets: | |||||||
Cash and cash equivalents | $ | 79,814 | $ | 61,288 | |||
Investments | 14,161 | 24,710 | |||||
Trade accounts receivable, less allowance for doubtful accounts of $264 at April 30, 2020 and $153 at April 30, 2019: | |||||||
Billed | 22,582 | 18,819 | |||||
Unbilled | 2,425 | 1,475 | |||||
Prepaid expenses and other current assets | 6,684 | 6,210 | |||||
Total current assets | 125,666 | 112,502 | |||||
Investments-noncurrent | 701 | 2,484 | |||||
Property and equipment, net | 3,373 | 3,585 | |||||
Capitalized software, net | 8,362 | 11,063 | |||||
Goodwill | 25,888 | 25,888 | |||||
Other intangibles, net | 1,132 | 2,732 | |||||
Deferred sales commissions - non-current | 2,177 | 1,546 | |||||
Lease right of use assets | 2,053 | — | |||||
Other assets | 1,941 | 1,510 | |||||
Total assets | $ | 171,293 | $ | 161,310 | |||
LIABILITIES AND SHAREHOLDERS’ EQUITY | |||||||
Current liabilities: | |||||||
Accounts payable | $ | 1,643 | $ | 2,448 | |||
Accrued compensation and related costs | 6,635 | 2,561 | |||||
Dividends payable | 3,547 | 3,434 | |||||
Operating lease obligation | 763 | — | |||||
Other current liabilities | 643 | 1,375 | |||||
Deferred revenue | 34,227 | 33,283 | |||||
Total current liabilities | 47,458 | 43,101 | |||||
Deferred income taxes | 2,897 | 3,514 | |||||
Long-term operating lease obligations | 1,424 | — | |||||
Other long-term liabilities | 92 | 88 | |||||
Total liabilities | 51,871 | 46,703 | |||||
Shareholders’ equity: | |||||||
Common stock: | |||||||
Class A, $0.10 par value. Authorized 50,000,000 shares: Issued and outstanding 35,000,649 (30,412,017, net) shares at April 30, 2020 and 33,979,739 (29,391,107, net) shares at April 30, 2019 | 3,500 | 3,398 | |||||
Class B, $0.10 par value. Authorized 10,000,000 shares: Issued and outstanding 1,821,587 shares at April 30, 2020 and 1,821,587 shares at April 30, 2019; convertible into Class A shares on a one-for-one basis | 182 | 182 | |||||
Additional paid-in capital | 150,312 | 138,315 | |||||
Retained deficit | (9,013 | ) | (1,729 | ) | |||
Class A treasury stock, 4,588,632 shares at April 30, 2020 and 4,588,632 shares at April 30, 2019, at cost | (25,559 | ) | (25,559 | ) | |||
Total shareholders’ equity | 119,422 | 114,607 | |||||
Commitments and contingencies | |||||||
Total liabilities and shareholders’ equity | $ | 171,293 | $ | 161,310 | |||
See accompanying notes to consolidated financial statements.
59
American Software, Inc. and Subsidiaries
Consolidated Statements of Operations
Years ended April 30, 2020, 2019, and 2018
(in thousands, except per share data)
2020 | 2019 | 2018 | |||||||||
Revenues: | |||||||||||
Subscriptions fees | $ | 22,033 | $ | 14,026 | $ | 8,855 | |||||
License | 7,582 | $ | 7,126 | 15,344 | |||||||
Professional services and other | 42,774 | 42,154 | 44,663 | ||||||||
Maintenance | 43,077 | 45,400 | 43,841 | ||||||||
Total revenues | 115,466 | 108,706 | 112,703 | ||||||||
Cost of revenues: | |||||||||||
Subscriptions fees | 9,491 | 5,759 | 3,817 | ||||||||
License | 4,798 | $ | 6,430 | 6,261 | |||||||
Professional services and other | 30,695 | 31,421 | 30,596 | ||||||||
Maintenance | 7,324 | 8,356 | 9,326 | ||||||||
Total cost of revenues | 52,308 | 51,966 | 50,000 | ||||||||
Gross margin | 63,158 | 56,740 | 62,703 | ||||||||
Research and development | 15,348 | 13,078 | 11,877 | ||||||||
Sales and marketing | 21,958 | 20,992 | 20,658 | ||||||||
General and administrative | 19,519 | 17,006 | 16,057 | ||||||||
Amortization of acquisition-related intangibles | 285 | 388 | 580 | ||||||||
Total operating expenses | 57,110 | 51,464 | 49,172 | ||||||||
Operating income | 6,048 | 5,276 | 13,531 | ||||||||
Other income: | |||||||||||
Interest income | 1,524 | 2,092 | 1,575 | ||||||||
Other, net | (774 | ) | 273 | 609 | |||||||
Earnings before income taxes | 6,798 | 7,641 | 15,715 | ||||||||
Income tax expense | 56 | 838 | 3,662 | ||||||||
Net earnings | $ | 6,742 | $ | 6,803 | $ | 12,053 | |||||
Earnings per common share:(a) | |||||||||||
Basic | $ | 0.21 | $ | 0.22 | $ | 0.40 | |||||
Diluted | $ | 0.21 | $ | 0.22 | $ | 0.40 | |||||
Shares used in the calculation of earnings per common share: | |||||||||||
Basic | 31,747 | 30,950 | 30,080 | ||||||||
Diluted | 32,367 | 31,378 | 30,472 | ||||||||
(a) | Diluted per share amounts for Class A shares are shown above. Diluted per share for Class B shares under the two-class method are $0.22, $0.22 and $0.39 for the years ended April 30, 2020, 2019 and 2018, respectively. See Note 1 to the Consolidated Financial Statements. |
See accompanying notes to consolidated financial statements.
60
American Software, Inc. and Subsidiaries
Consolidated Statements of Shareholders’ Equity
Years ended April 30, 2020, 2019, and 2018
(in thousands, except share data)
Common stock | Additional paid-in capital | Retained earnings/deficit | Treasury stock | Total shareholders’ equity | |||||||||||||||||||||||||
Class A | Class B | ||||||||||||||||||||||||||||
Shares | Amount | Shares | Amount | ||||||||||||||||||||||||||
Balance at April 30, 2017 | 31,821,508 | $ | 3,182 | 2,393,336 | $ | 239 | $ | 121,280 | $ | 4,608 | $ | (25,559 | ) | $ | 103,750 | ||||||||||||||
Proceeds from stock options exercised | 984,310 | 98 | — | — | 8,511 | — | — | 8,609 | |||||||||||||||||||||
Conversion of Class B shares into Class A shares | 335,946 | 34 | (335,946 | ) | (34 | ) | — | — | — | — | |||||||||||||||||||
Stock-based compensation | — | — | — | — | 1,467 | — | — | 1,467 | |||||||||||||||||||||
Net earnings | — | — | — | — | — | 12,053 | — | 12,053 | |||||||||||||||||||||
Dividends declared | — | — | — | — | — | (13,295 | ) | — | (13,295 | ) | |||||||||||||||||||
Balance at April 30, 2018 | 33,141,764 | 3,314 | 2,057,390 | 205 | 131,258 | 3,366 | (25,559 | ) | 112,584 | ||||||||||||||||||||
Balance at Cumulative effect of the adoption of Topic 606 | — | — | — | — | — | 1,753 | — | 1,753 | |||||||||||||||||||||
Proceeds from stock options exercised | 602,176 | 61 | — | — | 5,306 | — | — | 5,367 | |||||||||||||||||||||
Conversion of Class B shares into Class A shares | 235,799 | 23 | (235,803 | ) | (23 | ) | — | — | — | — | |||||||||||||||||||
Stock-based compensation | — | — | — | — | 1,751 | — | — | 1,751 | |||||||||||||||||||||
Net earnings | — | — | — | — | — | 6,803 | — | 6,803 | |||||||||||||||||||||
Dividends declared | — | — | — | — | — | (13,651 | ) | — | (13,651 | ) | |||||||||||||||||||
Balance at April 30, 2019 | 33,979,739 | 3,398 | 1,821,587 | 182 | 138,315 | (1,729 | ) | (25,559 | ) | 114,607 | |||||||||||||||||||
Proceeds from stock options exercised | 1,020,910 | 102 | — | — | 9,970 | — | — | 10,072 | |||||||||||||||||||||
Stock-based compensation | — | — | — | — | 2,027 | — | — | 2,027 | |||||||||||||||||||||
Net earnings | — | — | — | — | — | 6,742 | — | 6,742 | |||||||||||||||||||||
Dividends declared | — | — | — | — | — | (14,026 | ) | — | (14,026 | ) | |||||||||||||||||||
Balance at April 30, 2020 | 35,000,649 | $ | 3,500 | 1,821,587 | $ | 182 | $ | 150,312 | $ | (9,013 | ) | $ | (25,559 | ) | $ | 119,422 | |||||||||||||
See accompanying notes to consolidated financial statements.
61
American Software, Inc. and Subsidiaries
Consolidated Statements of Cash Flows
Years ended April 30, 2020, 2019, and 2018
(in thousands)
2020 | 2019 | 2018 | |||||||||
Cash flows from operating activities: | |||||||||||
Net earnings | $ | 6,742 | $ | 6,803 | $ | 12,053 | |||||
Adjustments to reconcile net earnings to net cash provided by operating activities: | |||||||||||
Depreciation and amortization | 8,103 | 7,719 | 6,030 | ||||||||
Stock-based compensation expense | 2,027 | 1,751 | 1,467 | ||||||||
Net loss (gain) on investments | 563 | (373 | ) | (254 | ) | ||||||
Net gain on sale of fixed assets | — | (4 | ) | — | |||||||
Deferred income tax (benefit) expense | (609 | ) | 320 | 621 | |||||||
Changes in operating assets and liabilities, net of effects of acquisition: | |||||||||||
Purchases of trading securities | (22,433 | ) | (10,254 | ) | (24,541 | ) | |||||
Proceeds from sales and maturities of trading securities | 34,202 | 18,447 | 13,568 | ||||||||
Accounts receivable, net | (4,712 | ) | 2,165 | (1,774 | ) | ||||||
Prepaid expenses and other assets | (1,537 | ) | 536 | (1,983 | ) | ||||||
Accounts payable and other liabilities | 2,692 | (3,611 | ) | (1,807 | ) | ||||||
Deferred revenue | 944 | 431 | 3,374 | ||||||||
Net cash provided by operating activities | 25,982 | 23,930 | 6,754 | ||||||||
Cash flows from investing activities: | |||||||||||
Capitalized computer software development costs | (3,170 | ) | (5,961 | ) | (4,804 | ) | |||||
Purchases of property and equipment, net of disposals | (420 | ) | (1,252 | ) | (1,428 | ) | |||||
Purchase of business, net of cash acquired | — | — | (9,150 | ) | |||||||
Net cash used in provided by investing activities | (3,590 | ) | (7,213 | ) | (15,382 | ) | |||||
Cash flows from financing activities: | |||||||||||
Proceeds from exercise of stock options | 10,072 | 5,367 | 8,609 | ||||||||
Dividends paid | (13,938 | ) | (13,590 | ) | (13,188 | ) | |||||
Net cash used in financing activities | (3,866 | ) | (8,223 | ) | (4,579 | ) | |||||
Net change in cash and cash equivalents | 18,526 | 8,494 | (13,207 | ) | |||||||
Cash and cash equivalents at beginning of year | 61,288 | 52,794 | 66,001 | ||||||||
Cash and cash equivalents at end of year | $ | 79,814 | $ | 61,288 | $ | 52,794 | |||||
Supplemental disclosures of cash paid during the year for: | |||||||||||
Income taxes | $ | 544 | $ | 516 | $ | 7,892 | |||||
Supplemental disclosures of noncash operating, investing and financing activities: | |||||||||||
Accrual of dividends payable | $ | 3,547 | $ | 3,434 | $ | 3,367 | |||||
See accompanying notes to consolidated financial statements.
62
American Software, Inc. and Subsidiaries
Notes to Consolidated Financial Statements
April 30, 2020, 2019, and 2018
(1) Presentation and Summary of Significant Accounting Policies
(a) Basis of Presentation
Founded in 1970 and headquartered in Atlanta, Georgia, American Software, Inc. and its subsidiaries (collectively, the “Company”) are engaged in the development, marketing, and support activities of a broad range of computer business application software products. The Company’s operations are principally in the computer software industry, and its products and services are used by customers within the United States and certain international markets. We provide our software solutions through three major business segments, which are further broken down into a total of six major product and service groups. The three operating segments are: (1) Supply Chain Management (“SCM”), (2) Information Technology Consulting (“IT Consulting”) and (3) Other.
• | The SCM segment consists of Logility, Inc. (see Note 8), which provides collaborative supply chain solutions to streamline and optimize the production, distribution and management of products between trading partners, as well as Demand Management, Inc. and New Generation Computing, Inc., wholly-owned subsidiaries of Logility and American Software, Inc., respectively. |
• | The IT Consulting segment consists of The Proven Method, Inc., an IT staffing and consulting services firm. |
• | The Other segment consists of (i) American Software ERP, which provides purchasing and materials management, customer order processing, financial, e-commerce and traditional manufacturing solutions, and (ii) unallocated corporate overhead expenses. |
(b) Principles of Consolidation
The consolidated financial statements include the accounts of American Software, Inc. and its wholly-owned subsidiaries. All significant intercompany balances and transactions have been eliminated in consolidation.
(c) Revenue Recognition
In accordance with the FASB issued Accounting Standards Update (“ASU”) No. 2014-09, Revenue from Contracts with Customers (Topic 606), we recognize revenue when we transfer control of the promised goods or services to our customers, in an amount that reflects the consideration we expect to receive in exchange for those goods or services. We derive our revenue from software licenses, maintenance services, consulting, implementation and training services, and Software-as-a-Service (“SaaS”), which includes a subscription to our software as well as support, hosting and managed services.
The Company determines revenue recognition through the following steps:
Step 1 - Identification of the Contract with the Customer
Step 2 - Identification of Promised Goods and Services and Evaluation of Whether the Promised Goods and Services are Distinct Performance Obligations
Step 3 - Determination of the Transaction Price
Step 4 - Allocation of the Transaction Price to Distinct Performance Obligations
Step 5 - Attribution of Revenue for Each Distinct Performance Obligation
Nature of Products and Services.
License. Our perpetual software licenses provide the customer with a right to use the software as it exists at the time of purchase. We recognize revenue for distinct software licenses once the license period has begun and we have made the software available to the customer.
63
Our perpetual software licenses are sold with maintenance under which we provide customers with telephone consulting, product updates on a when and if available basis, and releases of new versions of products previously purchased by the customer, as well as error reporting and correction services.
Subscription. Subscription fees include Software-as-a-Service ("SaaS") revenues for the right to use the software for a limited period of time in an environment hosted by the Company or by a third party. The customer accesses and uses the software on an as needed basis over the Internet or via a dedicated line; however, the customer has no right to take delivery of the software. The underlying arrangements typically include a single fee for the service that is billed monthly, quarterly or annually. The Company’s SaaS solutions represent a series of distinct services that are substantially the same and have the same pattern of transfer to the customer. Revenue from a SaaS solution is generally recognized ratably over the term of the arrangement.
Professional Services and Other. Our professional services revenue consists of fees generated from consulting, implementation and training services, including reimbursements of out-pocket expenses in connection with our services. These services are typically optional to our customers, and are distinct from our software. Fees for our professional services are separately priced and are generally billed on an hourly basis, and revenue is recognized over time as the services are performed. We believe the output method of hours worked provides the best depiction of the transfer of our services since the customer is receiving the benefit from our services as the work is performed. Reimbursements received from customers for out-of-pocket expenses were recorded in revenues and totaled approximately $1.5 million, $1.4 million, and $1.9 million for 2020, 2019 and 2018, respectively.
Maintenance and Support. Revenue is derived from maintenance and support services, under which we provide customers with telephone consulting, product updates on a when and if available basis, and releases of new versions of products previously purchased by the customer, as well as error reporting and correction services. Maintenance for perpetual licenses is renewable, generally on an annual basis, at the option of the customer. Maintenance terms typically range from one to three years. Revenue related to maintenance is generally paid in advance and recognized ratably over the term of the agreement since the Company is standing ready to provide a series of maintenance services that are substantially the same each period over the term; therefore, time is the best measure of progress. Support services for subscriptions are included in the subscription fees and are recognized as a component of such fees.
Indirect Channel Revenue. We record revenues from sales made through the indirect sales channels on a gross basis, because we control the goods or services and act as the principal in the transaction. In reaching this determination, we evaluate sales through our indirect channel on a case-by-case basis and consider a number of factors including indicators of control such as the party having the primary responsibility to provide specified goods or services, and the party having discretion in establishing prices.
Sales Taxes. We account for sales taxes collected from customers on a net basis.
Significant Judgments. Many of our contracts include multiple performance obligations. Our products and services generally do not require a significant amount of integration or interdependency; therefore, our products and services are generally not combined. We allocate the transaction price for each contract to each performance obligation based on the relative standalone selling price (SSP) for each performance obligation within each contract.
We use judgment in determining the SSP for products and services. For substantially all performance obligations except on-premise licenses, we are able to establish SSP based on the observable prices of products or services sold separately in comparable circumstances to similar customers. We typically establish an SSP range for our products and services which is reassessed on a periodic basis or when facts and circumstances change. Our on-premise licenses have not historically been sold on a standalone basis, as the vast majority of all customers elect to purchase on-premise license support contracts at the time of a on-premise license purchase. Support contracts are generally priced as a percentage of the net fees paid by the customer to access the on-premise license. We are unable to establish the SSP for our on-premise licenses based on observable prices given the same products are sold for a broad range of amounts (that is, the selling price is highly variable) and a representative SSP is not discernible from past transactions or other observable evidence. As a result, the SSP for a on-premise license included in a contract with multiple performance obligations is determined by applying a residual approach whereby all other performance obligations within a contract are first allocated a portion of the transaction price based upon their respective SSPs, with any residual amount of transaction price allocated to on-premise license revenues
Contract Balances. Timing of invoicing to customers may differ from timing of revenue recognition and these timing differences result in unbilled accounts receivables or contract liabilities (deferred revenue) on the Company’s consolidated balance sheets. Fees for our software licenses are generally due within 30 days of contract execution. We have an established history of collecting under the terms of our software license contracts without providing refunds or concessions to our customers. SaaS solutions and maintenance are typically billed in advance on a monthly, quarterly, or annual basis. Services are typically billed as performed. In instances where the timing of revenue recognition differs from the timing of invoicing, we have determined that our contracts generally do not include a significant financing component. The primary purpose of our invoicing terms is to provide customers with predictable ways to purchase our software and services, not to provide or receive financing. Additionally, we are applying the practical expedient to exclude
64
any financing component from consideration for any contracts with payment terms of one year or less since we rarely offer terms extending beyond one year. The consideration in our customer contracts is fixed.
We have an unconditional right to consideration for all goods and services transferred to our customers. That unconditional right to consideration is reflected in billed and unbilled accounts receivable in the accompanying consolidated balance sheets in accordance with ASC Topic 606.
Deferred revenue consists of amounts collected prior to having completed the performance of maintenance, SaaS, hosting, and managed services. We typically invoice customers for cloud subscription and support fees in advance on a monthly, quarterly or annual basis, with payment due at the start of the cloud subscription or support term. During the twelve months ended April 30, 2020, the Company recognized $31.0 million of revenue that was included in the deferred revenue balance as of April 30, 2019.
Years ended April 30, | |||||||
2020 | 2019 | ||||||
in thousands | |||||||
Deferred revenue, current | $ | 34,227 | $ | 33,283 | |||
Deferred revenue, long-term | — | — | |||||
Total deferred revenue | $ | 34,227 | $ | 33,283 | |||
Remaining Performance Obligations. A performance obligation is a promise in a contract to transfer a distinct good or service to the customer and is the unit of account under Topic 606. The transaction price is allocated to each distinct performance obligation and recognized as revenue when, or as, the performance obligation is satisfied by transferring the promised good or service to the customer. The Company identifies and tracks the performance obligations at contract inception so that the Company can monitor and account for the performance obligations over the life of the contract. Remaining performance obligations represent the transaction price of orders for which products have not been delivered or services have not been performed. As of April 30, 2020, the aggregate amount of the transaction price allocated to remaining performance obligations was approximately $77.0 million. The Company expects to recognize revenue on approximately 60% of the remaining performance obligations over the next 12 months, with the remainder recognized thereafter.
Disaggregated Revenue. The Company disaggregates revenue from contracts with customers by geography, as it believes it best depicts how the nature, amount, timing and uncertainty of revenue and cash flows are affected by economic factors.
The Company’s revenue by geography is as follows:
Years ended April 30, | |||||||
2020 | 2019 | ||||||
in thousands | |||||||
Revenues: | |||||||
Domestic | $ | 93,332 | $ | 87,316 | |||
International | 22,134 | 21,390 | |||||
$ | 115,466 | $ | 108,706 | ||||
Practical Expedients and Exemptions. There are several practical expedients and exemptions allowed under Topic 606
that impact the timing of revenue recognition and the Company’s disclosures. Below is a list of practical expedients the Company applies in the application of Topic 606:
• | The Company does not evaluate a contract for a significant financing component if payment is expected within one year or less from the transfer of the promised items to the customer. |
• | The Company does not disclose the value of unsatisfied performance obligations for contracts for which the Company recognizes revenue at the amount to which it has the right to invoice for services performed (this applies to time-and-material engagements). |
65
Contract Costs. The Company capitalizes the incremental costs of obtaining a contract with a customer if the Company expects to recover those costs. The incremental costs of obtaining a contract are those that the Company incurs to obtain a contract with a customer that it would not have incurred if the contract had not been obtained (for example, a sales commission). The Company capitalizes the costs incurred to fulfill a contract only if those costs meet all of the following criteria:
• | The costs relate directly to a contract or to an anticipated contract that the Company can specifically identify. |
• | The costs generate or enhance resources of the Company that will be used in satisfying (or in continuing to satisfy) performance obligations in the future. |
• | The costs are expected to be recovered. |
Certain sales commissions incurred by the Company were determined to be incremental costs to obtain the related contracts, which are deferred and amortized ratably over the economic benefit period for license and term subscriptions. These deferred commission costs are classified as current or non-current based on the timing of when the Company expects to recognize the expense. The current and non-current portions of deferred commissions are included in prepaid expenses and other current assets and deferred sales commissions in long-term assets, respectively, in the Company’s consolidated balance sheets. Total deferred commissions at April 30, 2020 and April 30, 2019 were $3.5 million and $2.3 million, respectively. Amortization of sales commissions was $2.1 million for year ended April 30, 2020, which is included in sales and marketing expense in the accompanying consolidated statements of operations. During the fiscal 2020 and 2019 impairment analyses, no losses were recognized.
Unbilled Accounts Receivable. The unbilled receivable balance consists of amounts generated from license fee and services revenues. At April 30, 2020 and 2019, unbilled license fees were approximately $1.3 million and $0.4 million, respectively, and unbilled services revenues were approximately $1.1 million and $1.1 million, respectively. Unbilled license fee accounts receivable represents revenue that has been recognized but under the terms of the license agreements, which include specified payment terms that are considered normal and customary, certain payments have not yet been invoiced to the customers. Unbilled services revenues primarily occur due to the timing of the billings, which occur subsequent to the end of each reporting period.
(d) Cost of Revenues
Cost of revenues for licenses includes amortization of developed technology and capitalized computer software development costs, salaries and benefits and value-added reseller ("VAR") commissions. Costs for maintenance and services revenues include the cost of personnel to conduct implementations, customer support and consulting, and other personnel-related expenses as well as agent commission expenses related to maintenance revenues generated by the indirect channel. Costs for subscriptions revenues include amortization of developed technology and capitalized computer software development costs, third–party hosting costs, salaries and benefits and value–added reseller ("VAR") commissions. Commission costs for maintenance are deferred and amortized over the related maintenance term. Commission costs for subscriptions are deferred and amortized over the related subscription term.
(e) Cash Equivalents
Cash equivalents of $75.3 million and $56.6 million at April 30, 2020 and 2019, respectively, consist of overnight repurchase agreements and money market deposit accounts. The Company considers all such investments with original maturities of three months or less to be cash equivalents for purposes of the consolidated statements of cash flows.
(f) Concentrations of Credit Risk
Financial instruments that potentially subject the Company to significant concentrations of credit risk consist principally of cash and cash equivalents, short- and long-term investments and accounts receivable. The Company maintains cash and cash equivalents and short- and long-term investments with various financial institutions. The Company’s sales are primarily to companies located in North America and Europe. The Company performs periodic credit evaluations of its customers’ financial condition and does not require collateral. Accounts receivable are due principally from companies under stated contract terms.
(g) Returns and Allowances
The Company has not experienced significant returns or warranty claims to date and, as a result, the allowance for the cost of returns and product warranty claims at April 30, 2020 and 2019 is not material.
66
The Company records an allowance for doubtful accounts based on the historical experience of write-offs and a detailed assessment of accounts receivable. The total amounts of expense to operations were approximately $97,000, $0, and $24,000 for fiscal 2020, 2019, and 2018, respectively, which are included in general and administrative expenses in the accompanying consolidated statements of operations. In estimating the allowance for doubtful accounts, management considers the age of the accounts receivable, the Company’s historical write-offs, and the credit worthiness of the customer, among other factors. Should any of these factors change, the estimates made by management will also change accordingly, which could affect the level of the Company’s future provision for doubtful accounts. Uncollectible accounts are written off when it is determined that the specific balance is not collectible.
(h) Investments
Investments consist of commercial paper, corporate bonds, government securities, certificates of deposits and marketable equity securities. The Company accounts for its investments in accordance with the Investments – Debt Securities (Topic 320) and Investments—Equity Securities (Topic 321). The Company has classified its investment portfolio as “trading.” “Trading” securities are bought and held principally for the purpose of selling them in the near term and are recorded at fair value. Unrealized gains and losses on trading securities are included in the determination of net earnings. For the purposes of computing realized gains and losses, cost is identified on a specific identification basis. Investments with maturities less than one year as of the balance sheet date are classified as short-term investments and those that mature greater than one year are classified as long-term investments.
(i) Property and Equipment
Property and equipment are recorded at cost, less accumulated depreciation and amortization. Depreciation of buildings, computer equipment, purchased computer software, office furniture and equipment is calculated using the straight-line method based upon the estimated useful lives of the assets (three years for computer equipment and software, seven years for office furniture and equipment, fifteen years for building improvements and thirty years for buildings). Leasehold improvements are amortized using the straight-line method over the estimated useful lives of the assets or the related lease term, whichever is shorter. Depreciation and amortization expense on buildings, furniture, equipment and purchased computer software was $0.6 million, $0.7 million, and $0.5 million in 2020, 2019, and 2018, respectively.
(j) Capitalized Computer Software Development Costs
The Company capitalizes certain computer software development costs in accordance with the Costs of Software to be Sold, Leased or Marketed under ASC 985-20. Costs incurred internally to create a computer software product or to develop an enhancement to an existing product are charged when incurred as research and development expense until technological feasibility for the respective product is established. Thereafter, software development costs are capitalized and reported at the lower of unamortized cost or net realizable value. Capitalization ceases when the product or enhancement is available for general release to customers. The Company makes ongoing evaluations of the recoverability of its capitalized software projects by comparing the net amount capitalized for each product to the estimated net realizable value of the product. If such evaluations indicate that the unamortized software development costs exceed the net realizable value, the Company writes off the amount by which the unamortized software development costs exceed net realizable value. Capitalized computer software development costs are amortized ratably based on the projected revenues associated with the related software or on a straight-line basis over three years, whichever method results in a higher level of amortization. Amortization of capitalized computer software development costs is included in the cost of license and subscription revenues in the consolidated statements of operations.
Total Expenditures and Amortization. Total expenditures for capitalized computer software development costs, total research and development expense, and total amortization of capitalized computer software development costs are as follows:
Years ended April 30, | |||||||||||
2020 | 2019 | 2018 | |||||||||
(in thousands) | |||||||||||
Total capitalized computer software development costs | $ | 3,170 | $ | 5,961 | $ | 4,804 | |||||
Total research and development expense | 15,348 | 13,078 | 11,877 | ||||||||
Total research and development expense and capitalized computer software-development costs | $ | 18,518 | $ | 19,039 | $ | 16,681 | |||||
Total amortization of capitalized computer software development costs | $ | 5,871 | $ | 4,627 | $ | 3,690 | |||||
67
Capitalized computer software development costs consist of the following at April 30, 2020 and 2019 (in thousands):
2020 | 2019 | ||||||
Capitalized computer software development costs | $ | 42,973 | $ | 39,803 | |||
Accumulated amortization | (34,611 | ) | (28,740 | ) | |||
$ | 8,362 | $ | 11,063 | ||||
Of the Company’s capitalized software projects that are currently completed and being amortized, the Company expects amortization expense for the next three years to be as follows (in thousands):
2021 | $ | 3,437 | |
2022 | 2,222 | ||
2023 | 197 | ||
$ | 5,856 | ||
(k) Acquisition-Related Intangible Assets (exclusive of Logility’s treasury stock repurchases)
Acquisition-related intangible assets are stated at historical cost and include acquired software and certain other intangible assets with definite lives. Intangible assets are being amortized over a period ranging from one to eight years. For 2020, total amortization expense related to acquisition-related intangible assets was approximately $1.6 million, with $0.3 million included in operating expense and $1.3 million included in cost of license fees in the accompanying consolidated statements of operations. For 2019, total amortization expense related to acquisition-related intangible assets was approximately $2.4 million, with $0.4 million included in operating expense and $2.0 million included in cost of license fees in the accompanying consolidated statements of operations. For 2018, total amortization expense related to acquisition-related intangible assets was approximately $1.8 million, with $0.6 million included in operating expense and $1.2 million included in cost of license fees in the accompanying consolidated statements of operations.
Acquisition-Related Intangible Assets consist of the following at April 30, 2020 and 2019 (in thousands):
Weighted Average Amortization in Years | 2020 | 2019 | |||||||
Current technology | 3 | $ | 6,000 | $ | 6,000 | ||||
Customer relationships | 8 | 1,700 | 1,700 | ||||||
Non-compete | 3 | 100 | 100 | ||||||
Trademarks | 3 | 340 | 340 | ||||||
8,140 | 8,140 | ||||||||
Accumulated amortization | (7,008 | ) | (5,408 | ) | |||||
$ | 1,132 | $ | 2,732 | ||||||
The Company expects amortization expense for the next five years to be as follows based on intangible assets as of April 30, 2020 (in thousands):
2021 | $ | 772 | |
2022 | 212 | ||
2023 | 52 | ||
2024 | 38 | ||
2025 | 38 | ||
Thereafter | 20 | ||
$ | 1,132 | ||
68
(l) Goodwill and Other Intangibles
Goodwill represents the excess of costs over fair value of assets of businesses acquired. Goodwill and intangible assets acquired in a purchase business combination and determined to have an indefinite useful life are not amortized, but instead are tested for impairment at least annually in accordance with the FASB issued Accounting Standards Update (“ASU”) No.2017-04 Intangibles-Goodwill and Other (Topic 350). The Company evaluates the carrying value of goodwill annually and between annual evaluations if events occur or circumstances change that would more likely than not reduce the fair value of the reporting unit below its carrying amount. Such circumstances could include, but are not limited to, (1) a significant adverse change in legal factors or in business climate, (2) unanticipated competition, or (3) an adverse action or assessment by a regulator.
When evaluating whether the goodwill is impaired, the Company compares the fair value of the reporting unit to which the goodwill is assigned to its carrying amount, including goodwill. The Company identifies the reporting unit on a basis that is similar to its method for identifying operating segments as defined by the Segment Reporting Topic of the FASB ASC. If the carrying amount of a reporting unit exceeds its fair value, then the amount of the impairment loss must be measured. This evaluation is applied annually on each impairment testing date (April 30) unless there is a triggering event present during an interim period.
For the years ended April 30, 2020 and 2019, the Company performed a qualitative assessment based on economic, industry and company-specific factors as the initial step in the annual goodwill impairment test for all reporting units. Based on the results of the qualitative assessment, companies are only required to perform Step 1 of the annual impairment test for a reporting unit if the company concludes that it is more likely than not that the unit’s fair value is less than its carrying amount. To the extent the Company concludes it is more likely than not that a reporting unit’s estimated fair value is less than its carrying amount, the two-step approach is applied. The first step would require a comparison of each reporting unit’s fair value to the respective carrying value. If the carrying value exceeds the fair value, a second step is performed to measure the amount of impairment loss, if any. The Company did not identify any macroeconomic or industry conditions as of April 30, 2020, that would indicate the fair value of the reporting units were more likely than not to be less than their respective carrying values. If circumstances change or events occur to indicate it is more likely than not that the fair value of any reporting units have fallen below their carrying value, the Company would test such reporting unit for impairment.
Intangible assets with estimable useful lives are required to be amortized over their respective estimated useful lives to their estimated residual values, and reviewed for impairment in accordance with the (ASU) No. 2011-10, Property, Plant and Equipment (Topic 360).
Goodwill consisted of the following by segment (in thousands):
Supply Chain Management* | IT Consulting | Other | Total | ||||||||||||
Balance at April 30, 2018 | $ | 25,888 | $ | — | $ | — | $ | 25,888 | |||||||
Balance at April 30, 2019 | 25,888 | — | — | 25,888 | |||||||||||
Balance at April 30, 2020 | $ | 25,888 | $ | — | $ | — | $ | 25,888 | |||||||
* | Goodwill related to Logility, Inc., New Generation Computing, Inc., Demand Management, Inc. and their acquisitions. |
Intangible Assets (including Acquisition-Related Intangible Assets) consisted of the following by segment (in thousands):
IT Consulting | Other | Total | |||||||||||||
Balance at April 30, 2018 | $ | 5,120 | $ | — | $ | — | $ | 5,120 | |||||||
Amortization expense | (2,388 | ) | — | — | (2,388 | ) | |||||||||
Balance at April 30, 2019 | 2,732 | — | — | 2,732 | |||||||||||
Amortization expense | (1,600 | ) | — | — | (1,600 | ) | |||||||||
Balance at April 30, 2020 | $ | 1,132 | $ | — | $ | — | $ | 1,132 | |||||||
(m) Income Taxes
The Company accounts for income taxes using the asset and liability method. Under the asset and liability method, deferred tax assets and liabilities are recognized for the future tax consequences attributable to differences between the financial statement carrying amounts of existing assets and liabilities and their respective tax bases and operating loss and tax credit carryforwards.
69
Deferred tax assets and liabilities are measured using enacted tax rates expected to apply to taxable income in the years in which those temporary differences are expected to be recovered or settled. The effect on deferred tax assets and liabilities of a change in tax rates is recognized in income in the period that includes the enactment date.
(n) Recent Accounting Pronouncements
In May 2014, the FASB issued ASU No. 2014-09, Revenue from Contracts with Customers (Topic 606), and the related amendments, which replaced the previous revenue recognition guidance.
The Company adopted this revenue standard effective May 1, 2018 using the modified retrospective transition method. Under this method, the Company elected to apply the cumulative effect method to contracts that are not complete as of the adoption date. The Company’s total revenue impact was $1.2 million, with approximately 70% impacting the fiscal year ending April 30, 2019, which is the result of recognizing revenue for the license component of its term licenses and certain perpetual license contracts that were previously recognized over time due to the lack of vendor-specific objective evidence (VSOE) of fair value at the point in time at which control of the software license is transferred to the customer. In addition, under this standard, the Company will capitalize a portion of sales commission expenses and recognize them ratably over the associated period of economic benefit, which the Company has determined to be six years, which had an impact of $1.1 million. As a result, the cumulative impact due to the adoption of the revenue standard on the opening consolidated balance sheet was an increase in opening retained earnings, with a corresponding increase in unbilled accounts receivable and a decrease in deferred revenue.
In February 2016, the FASB issued ASU No. 2016-02, Leases (Topic 842), and the related amendments, to increase transparency and comparability among organizations by recognizing lease assets and lease liabilities on the balance sheet and disclosing key information about leasing arrangements. Under the new guidance, a lessee is required to recognize assets and liabilities for leases with lease terms of more than 12 months. The Company adopted ASU 2016-02 as of May 1, 2019 using the modified retrospective approach, which allows the Company to apply Accounting Standards Codification (ASC) 840, Leases, in the comparative periods presented in the year of adoption. Accordingly, the comparative periods and disclosures have not been restated. The cumulative effect of adoption was recorded as an adjustment to the opening balance sheet in the period of adoption.
As part of the adoption of ASC 842, the Company elected to adopt certain of the optional practical expedients, including the package of practical expedients which, among other things, gives us the option to not reassess: 1) whether expired or existing contracts are or contain leases; 2) the lease classification for expired or existing leases; and 3) initial direct costs for existing leases. The Company also elected the practical expedient to not record lease right-of-use (“ROU”) assets and lease obligations for leases with terms of 12 months or less. Finally, the Company also elected the practical expedient to not separate lease and non-lease components, which allows it to account for lease and non-lease components as a single lease component. The Company did not elect the hindsight practical expedient in its determination of the lease term for existing leases; therefore, the original lease terms, as determined under ASC 840, were used in the calculation of the Company’s initial ASC 842 lease liabilities.
Adoption of the new standard resulted in the recognition of operating lease ROU assets of approximately $2.7 million, current operating lease liabilities of approximately $0.7 million and long-term operating lease liabilities of approximately $2.1 million as of May 1, 2019.
The adoption had no impact on retained deficit, the consolidated statements of operations, or the consolidated statements of cash flows. See Note 7 for further discussion of the Company’s leases.
Recent Accounting Pronouncements Not Yet Adopted
In January 2017, the FASB issued ASU 2017–04, Intangibles—Goodwill and Other (Topic 350): Simplifying the Test for Goodwill Impairment, which simplifies the subsequent measurement of goodwill to eliminate Step 2 from the goodwill impairment test. In addition, it eliminates the requirements for any reporting unit with a zero or negative carrying amount to perform a qualitative assessment and, if it fails that qualitative test, to perform Step 2 of the goodwill impairment test. Therefore, the same impairment assessment applies to all reporting units. ASU 2017–04 will be effective for the Company’s fiscal year beginning May 1, 2020. The new guidance is required to be applied on a prospective basis. The Company does not believe adoption of ASU 2017–04 will have a material impact on its consolidated financial statements.
(o) Use of Estimates
The preparation of these consolidated financial statements requires management to make estimates and assumptions that affect the reported amounts of assets and liabilities, and disclosures of contingent assets and liabilities, at the date of the consolidated financial statements and the reported amounts of revenues and expenses during the reporting period. On an ongoing basis, we evaluate our
70
estimates, including, but not limited to, those related to revenue/reserves and allowances. We base our estimates on historical experience and on various other assumptions that we believe to be reasonable under the circumstances, the results of which form the basis for making judgments about the carrying values of assets and liabilities that are not readily apparent from other sources. Our actual results could differ materially from these estimates under different assumptions or conditions.
(p) Stock-Based Compensation
The Company has one stock-based employee compensation plan under which options to purchase common stock of the Company were outstanding as of April 30, 2020. This plan is described more fully in Note 6.
The Company recorded stock option compensation cost of approximately $2.0 million, $1.8 million and $1.5 million and related income tax benefit of approximately $0.7 million, an income tax benefit of approximately $0.3 million, and an income tax shortfall of approximately $39,000 for the years ended April 30, 2020, April 30, 2019 and 2018, respectively. Stock-based compensation expense is recorded on a straight-line basis over the vesting period for the entire award directly to additional paid-in capital.
(q) Comprehensive Income
Accounting Standards Update (ASU) 2018-02, Comprehensive Income (Topic 220), establishes standards for reporting and presentation of comprehensive income and its components in a full set of financial statements.
The Company did not have any other comprehensive income items for 2020, 2019, or 2018.
(r) Impairment of Long-Lived Assets
The Company reviews long-lived assets, such as property, and equipment, and purchased intangibles subject to amortization, for impairment whenever events or changes in circumstances indicate that the carrying amount of an asset may not be recoverable. Recoverability of assets to be held and used is measured by a comparison of the carrying amount of an asset to estimated undiscounted future cash flows expected to be generated by the asset. If the carrying amount of an asset exceeds its estimated future cash flows, an impairment charge is recognized by the amount by which the carrying amount of the asset exceeds the fair value of the asset. Assets to be disposed of by sale would be separately presented in the consolidated balance sheet and reported at the lower of the carrying amount or fair value less costs to sell, and are no longer depreciated. The assets and liabilities of a group classified as held for sale would be presented separately in the appropriate asset and liability sections of the consolidated balance sheet.
(s) Earnings per Common Share
The Company has two classes of common stock. Class B common shares are convertible into Class A common shares at any time, on a one-for-one basis. Under the Company’s Articles of Incorporation, if dividends are declared, holders of Class A common shares shall receive a $.05 dividend per share prior to the Class B common shares receiving any dividend and holders of Class A common shares shall receive a dividend at least equal to Class B common shares dividends on a per share basis. As a result, the Company has computed the earnings per share in compliance with the Earnings Per Share Topic of the FASB ASC, which requires companies that have multiple classes of equity securities to use the “two-class” method in computing earnings per share.
For the Company’s basic earnings per share calculation, the Company uses the “two-class” method. Basic earnings per share are calculated by dividing net earnings attributable to each class of common stock by the weighted average number of shares outstanding. All undistributed earnings are allocated evenly between Class A and B common shares in the earnings per share calculation to the extent that earnings equal or exceed $.05 per share. This allocation is based on management’s judgment after considering the dividend rights of the two-classes of common stock, the control of the Class B shareholders and the convertibility rights of the Class B shares to Class A shares. If Class B shares convert to Class A shares during the period, the distributed net earnings for Class B shares is calculated using the weighted average common shares outstanding during the period.
Diluted earnings per share is calculated similarly to basic earnings per share, except that the calculation includes the dilutive effect of the assumed exercise of options issuable under the Company’s stock incentive plans. For the Company’s diluted earnings per share calculation for Class A shares, the Company uses the “if-converted” method. This calculation assumes that all Class B common shares are converted into Class A common shares and, as a result, assumes there are no holders of Class B common shares to participate in undistributed earnings.
For the Company’s diluted earnings per share calculation for Class B shares, the Company uses the “two-class” method. This calculation does not assume that all Class B common shares are converted into Class A common shares. In addition, this method assumes the dilutive effect of Class A stock options were converted to Class A shares and the undistributed earnings are allocated
71
evenly to both Class A and B shares including Class A shares issued pursuant to those converted stock options. This allocation is based on management’s judgment after considering the dividend rights of the two-classes of common stock, the control of the Class B shareholders and the convertibility rights of the Class B shares into Class A shares.
The following tables set forth the computation of basic earnings per common share and diluted earnings per common share (in thousands except for per share amounts). See Note 6 for total stock options outstanding and potential dilution:
Basic earnings per common share:
Year Ended April 30, 2020 | Year Ended April 30, 2019 | Year Ended April 30, 2018 | |||||||||||||||||||||
Class A Common Shares | Class B Common Shares | Class A Common Shares | Class B Common Shares | Class A Common Shares | Class B Common Shares | ||||||||||||||||||
Distributed earnings per share | $ | 0.44 | $ | 0.44 | $ | 0.44 | $ | 0.44 | $ | 0.44 | $ | 0.43 | |||||||||||
Undistributed earnings/(loss) per share | (0.23 | ) | (0.23 | ) | (0.22 | ) | (0.22 | ) | (0.04 | ) | (0.04 | ) | |||||||||||
Total per share | $ | 0.21 | $ | 0.21 | $ | 0.22 | $ | 0.22 | $ | 0.40 | $ | 0.39 | |||||||||||
Distributed earnings | $ | 13,219 | $ | 805 | $ | 12,837 | $ | 819 | $ | 12,321 | $ | 974 | |||||||||||
Undistributed earnings/(loss) | (6,864 | ) | (418 | ) | (6,441 | ) | (412 | ) | (1,151 | ) | (91 | ) | |||||||||||
Total | $ | 6,355 | $ | 387 | $ | 6,396 | $ | 407 | $ | 11,170 | $ | 883 | |||||||||||
Basic weighted average common shares | 29,925 | 1,822 | 29,106 | 1,844 | 27,805 | 2,275 | |||||||||||||||||
Diluted EPS for Class A common shares using the If-Converted Method
Year Ended April 30, 2020
Undistributed and distributed earnings to Class A Common Shares | Class A Common Shares | EPS* | ||||||||
Per basic | $ | 6,355 | 29,925 | $ | 0.21 | |||||
Common stock equivalents | — | 620 | ||||||||
6,355 | 30,545 | 0.21 | ||||||||
Class B Common Share Conversion | 387 | 1,822 | ||||||||
Diluted EPS for Class A Common Shares | $ | 6,742 | 32,367 | $ | 0.21 | |||||
Year Ended April 30, 2019
Undistributed and distributed earnings to Class A Common Shares | Class A Common Shares | EPS* | |||||||||
Per basic | $ | 6,396 | 29,106 | $ | 0.22 | ||||||
Common stock equivalents | — | 429 | |||||||||
6,396 | 29,535 | 0.22 | |||||||||
Class B Common Share Conversion | 407 | 1,844 | |||||||||
Diluted EPS for Class A Common Shares | $ | 6,803 | $ | 31,379 | $ | 0.22 | |||||
72
Year Ended April 30, 2018
Undistributed and distributed earnings to Class A Common Shares | Class A Common Shares | EPS* | |||||||||
Per basic | $ | 11,170 | 27,805 | $ | 0.40 | ||||||
Common stock equivalents | — | 392 | |||||||||
11,170 | 28,197 | 0.40 | |||||||||
Class B Common Share Conversion | 883 | 2,275 | |||||||||
Diluted EPS for Class A Common Shares | $ | 12,053 | $ | 30,472 | $ | 0.40 | |||||
Diluted EPS for Class B common shares using the Two-Class Method
Year Ended April 30, 2020
Undistributed and distributed earnings to Class B Common Shares | Class B Common Shares | EPS* | |||||||
Per basic | $ | 387 | 1,822 | 0.21 | |||||
Reallocation of undistributed earnings from Class A Common Shares to Class B Common Shares | 5 | — | |||||||
Diluted EPS for Class B Common Shares | $ | 392 | 1,822 | 0.22 | |||||
Year Ended April 30, 2019
Undistributed and distributed earnings to Class B Common Shares | Class B Common Shares | EPS* | |||||||
Per basic | $ | 407 | 1,844 | 0.22 | |||||
Reallocation of undistributed earnings from Class A Common Shares to Class B Common Shares | 2 | — | |||||||
Diluted EPS for Class B Common Shares | $ | 409 | 1,844 | 0.22 | |||||
Year Ended April 30, 2018
Undistributed and distributed earnings to Class B Common Shares | Class B Common Shares | EPS* | |||||||
Per basic | $ | 883 | 2,275 | 0.39 | |||||
Reallocation of undistributed earnings from Class A Common Shares to Class B Common Shares | — | — | |||||||
Diluted EPS for Class B Common Shares | $ | 883 | 2,275 | 0.39 | |||||
_______________
* | Amounts adjusted for rounding |
(t) Advertising
All advertising costs are expensed as incurred. Advertising expenses, which are included within sales and marketing expenses, were $2.9 million, $2.3 million and $2.4 million in fiscal 2020, 2019 and 2018, respectively.
73
(u) Guarantees and Indemnifications
The Company accounts for guarantees in accordance with the Guarantee Topic of the FASB ASC. The Company’s sales agreements with customers generally contain infringement indemnity provisions. Under these agreements, the Company agrees to indemnify, defend and hold harmless the customer in connection with intellectual property infringement claims made by third parties with respect to the customer’s authorized use of the Company’s products and services. The indemnity provisions generally provide for the Company’s control of defense and settlement and cover costs and damages finally awarded against the customer, as well as the Company’s modification of the product so it is no longer infringing or, if it cannot be corrected, return of the product for a refund. The sales agreements with customers sometimes also contain indemnity provisions for death, personal injury or property damage caused by the Company’s personnel or contractors in the course of performing services to customers. Under these agreements, the Company agrees to indemnify, defend and hold harmless the customer in connection with death, personal injury and property damage claims made by third parties with respect to actions of the Company’s personnel or contractors. The indemnity provisions generally provide for the Company’s control of defense and settlement and cover costs and damages finally awarded against the customer. The indemnity obligations contained in sales agreements generally have a limited monetary award. The Company has not previously incurred costs to settle claims or pay awards under these indemnification obligations. The Company accounts for these indemnity obligations in accordance with the Contingencies Topic of the FASB ASC, and records a liability for these obligations when a loss is probable and reasonably estimable. The Company has not recorded any liabilities for these agreements as of April 30, 2020 or 2019.
The Company warrants to its customers that its software products will perform in all material respects in accordance with the standard specifications, generally for 90 days after delivery of the licensed products and for the subscription term for SaaS products. Additionally, the Company warrants to its customers that services will be performed consistent with generally accepted industry standards or specific service levels through completion of the agreed upon services. If necessary, the Company will provide for the estimated cost of product and service warranties based on specific warranty claims and claim history. However, the Company has not incurred significant recurring expense under product or service warranties. Accordingly, the Company has no liabilities recorded for these agreements as of April 30, 2020 or 2019.
(v) Industry Segments
The Company operates and manages its business in three reportable segments. See Note 8 of the Consolidated Financial Statements.
(2) Investments
Investments consist of the following (in thousands):
April 30, | |||||||
2020 | 2019 | ||||||
Trading: | |||||||
Debt securities—Tax-exempt state and municipal bonds | $ | 3,104 | $ | 16,192 | |||
Marketable equity securities | 11,758 | 11,002 | |||||
$ | 14,862 | $ | 27,194 | ||||
The total carrying value of all investments on a consolidated basis was approximately $14.9 million and $27.2 million at April 30, 2020 and 2019, respectively. At April 30, 2020, there were approximately $0.7 million in trading investments included in investments-noncurrent in the accompanying consolidated balance sheet. At April 30, 2019, there were approximately $2.5 million in trading investments included in investments-noncurrent in the accompanying consolidated balance sheet.
The contractual maturities of debt securities classified as trading at April 30, 2020 and 2019 were as follows (in thousands):
2020 | 2019 | ||||||
Due within one year | $ | 2,403 | $ | 13,708 | |||
Due within two years | 701 | 2,484 | |||||
Due within three years | — | — | |||||
Due after three years | — | — | |||||
$ | 3,104 | $ | 16,192 | ||||
In fiscal 2020, 2019 and 2018, the Company’s investment portfolio of marketable equity securities experienced unrealized holding gains of $0.7 million, unrealized holding losses of approximately $0.9 million and unrealized holding losses of approximately $1.0 million, respectively. In fiscal 2020, 2019 and 2018, the Company’s investment portfolio of debt securities experienced unrealized holding losses of approximately $0.6 million, unrealized holding losses of $0.1 million and unrealized holding gains of approximately $0.1 million, respectively. In fiscal 2020, 2019 and 2018, the Company’s investment portfolio of marketable equity securities experienced realized holding losses of approximately $0.2 million, realized holding losses of $0.1 million and realized holding losses of approximately $0 million, respectively. In fiscal 2020, 2019 and 2018, the Company’s investment portfolio of debt securities experienced realized holding gains of approximately $0.7 million for all periods. Unrealized and realized gains and losses are included in "Other income, net" in the company’s condensed consolidated statements of operations.
(3) Fair Value of Financial Instruments
The Company measures its investments based on a fair value hierarchy disclosure framework that prioritizes and ranks the level of market price observability used in measuring assets and liabilities at fair value. A number of factors affect market price observability including the type of asset or liability and its characteristics. This hierarchy prioritizes the inputs into three broad levels as follows:
• | Level 1—Quoted prices in active markets for identical instruments. |
• | Level 2—Quoted prices for similar instruments in active markets; quoted prices for identical or similar instruments in markets that are not active; and model-derived valuations in which all significant inputs and significant value drivers are observable in active markets. |
• | Level 3—Valuations derived from valuation techniques in which one or more significant inputs or significant value drivers are unobservable. |
The following is a general description of the valuation methodologies used for financial assets and liabilities measured at fair value, including the general classification of such assets and liabilities pursuant to the valuation hierarchy.
Cash Equivalents—Cash equivalents include investments in government obligation based money-market funds, other money market instruments and interest-bearing deposits with initial or remaining terms of three months or less. The fair value of cash equivalents approximates its carrying value due to the short-term nature of these instruments.
Marketable Securities—Marketable securities utilizing Level 1 inputs include active exchange-traded equity securities and equity index funds, and most U.S. government debt securities, as these securities all have quoted prices in active markets. Marketable securities utilizing Level 2 inputs include municipal bonds. We value these securities using market-corroborated pricing or other models that use observable inputs such as yield curves.
The following table presents our assets that we measured at fair value on a recurring basis and indicates the fair value hierarchy of the valuation techniques we utilized to determine such fair value (in thousands):
April 30, 2020 | April 30, 2019 | ||||||||||||||||||||||||||||||
Quoted Prices in Active Markets for Identical Assets (Level 1) | Significant Other Observable Inputs (Level 2) | Significant Unobservable Inputs (Level 3) | Total | Quoted Prices in Active Markets for Identical Assets (Level 1) | Significant Other Observable Inputs (Level 2) | Significant Unobservable Inputs (Level 3) | Total | ||||||||||||||||||||||||
Cash equivalents | $ | 75,256 | $ | — | $ | — | $ | 75,256 | $ | 56,645 | $ | — | $ | — | $ | 56,645 | |||||||||||||||
Marketable securities | 11,758 | 3,104 | — | 14,862 | 11,002 | 16,192 | — | 27,194 | |||||||||||||||||||||||
Total | $ | 87,014 | $ | 3,104 | $ | — | $ | 90,118 | $ | 67,647 | $ | 16,192 | $ | — | $ | 83,839 | |||||||||||||||
The carrying amounts of cash, trade accounts receivable and unbilled accounts receivable, accounts payable, accrued compensation and related costs, and other current liabilities approximate fair value because of their short-term maturities.
(4) Property and Equipment
Property and equipment consisted of the following at April 30, 2020 and 2019 (in thousands):
74
2020 | 2019 | ||||||
Buildings and leasehold improvements | $ | 16,881 | $ | 16,724 | |||
Computer equipment and purchased software | 11,478 | 11,235 | |||||
Office furniture and equipment | 4,973 | 4,953 | |||||
33,332 | 32,912 | ||||||
Accumulated depreciation and amortization | (29,959 | ) | (29,327 | ) | |||
$ | 3,373 | $ | 3,585 | ||||
75
(5) Income Taxes
Income tax expense (benefit) consisted of the following:
Years ended April 30, | |||||||||||
2020 | 2019 | 2018 | |||||||||
(in thousands) | |||||||||||
Current: | |||||||||||
Federal | $ | 295 | $ | 184 | $ | 2,298 | |||||
State | 370 | 334 | 743 | ||||||||
665 | 518 | 3,041 | |||||||||
Deferred: | |||||||||||
Federal | (513 | ) | 256 | 321 | |||||||
State | (96 | ) | 64 | 300 | |||||||
(609 | ) | 320 | 621 | ||||||||
$ | 56 | $ | 838 | $ | 3,662 | ||||||
The Company’s actual income tax expense differs from the “expected” income tax expense calculated by applying the Federal statutory rate of 21.0% for fiscal 2020 and 2019 and our blended U.S. Federal statutory rate of 30.3% for fiscal 2018, to earnings before income taxes as follows:
Years ended April 30, | |||||||||||
2020 | 2019 | 2018 | |||||||||
(in thousands) | |||||||||||
Computed “expected” income tax expense | $ | 1,428 | $ | 1,605 | $ | 4,763 | |||||
Increase (decrease) in income taxes resulting from: | |||||||||||
State income taxes, net of federal income tax effect | 214 | 339 | 891 | ||||||||
Research and development credits | (703 | ) | (678 | ) | (493 | ) | |||||
Excess tax benefits from stock option deductions | (737 | ) | (251 | ) | (165 | ) | |||||
Foreign tax credits | (164 | ) | (112 | ) | (211 | ) | |||||
Rate change – tax reform | — | — | (1,206 | ) | |||||||
Other, net, including permanent items | 18 | (65 | ) | 83 | |||||||
$ | 56 | $ | 838 | $ | 3,662 | ||||||
Our effective income tax rates were 1%, 11% and 23% in 2020, 2019 and 2018, respectively. Our effective income tax rate takes into account the source of taxable income, by state, and available income tax credits. The provision for income taxes in fiscal 2020, 2019 and 2018 includes approximately $878,000, $298,000 and $186,000, respectively, in income tax benefits related to the tax benefits realized from stock option deductions.
The significant components of deferred income tax expense attributable to income from continuing operations before income taxes for the years ended April 30, 2020, 2019, and 2018 are as follows:
Years ended April 30, | |||||||||||
2020 | 2019 | 2018 | |||||||||
(in thousands) | |||||||||||
Deferred tax (benefit) expense | $ | (639 | ) | $ | 330 | $ | 1,823 | ||||
Deferred tax benefit related to tax reform | — | — | (1,206 | ) | |||||||
Increase (decrease) in the valuation allowance for deferred tax assets | 30 | (10 | ) | 4 | |||||||
$ | (609 | ) | $ | 320 | $ | 621 | |||||
The tax effects of temporary differences that give rise to significant portions of the deferred tax assets and deferred tax liabilities at April 30, 2020 and 2019 are presented as follows:
76
2020 | 2019 | ||||||
(in thousands) | |||||||
Deferred tax assets: | |||||||
Accruals and expenses not deducted for tax purposes | $ | 363 | $ | 328 | |||
State net operating loss carryforwards | 226 | 217 | |||||
Fixed asset basis differences | 822 | 831 | |||||
Nonqualified stock options | 848 | 858 | |||||
Right of use liability | 547 | — | |||||
Tax credit carryforwards | 83 | — | |||||
Total gross deferred tax assets | 2,889 | 2,234 | |||||
Less valuation allowance | (190 | ) | (160 | ) | |||
Net deferred tax | 2,699 | 2,074 | |||||
Deferred tax liabilities: | |||||||
Capitalized computer software development costs | (2,090 | ) | (2,766 | ) | |||
Net gains/losses on trading securities | (1,005 | ) | (1,183 | ) | |||
Goodwill and intangible assets basis differences | (746 | ) | (639 | ) | |||
Right of use asset | (513 | ) | — | ||||
Deferred agent commissions | (1,242 | ) | (1,000 | ) | |||
Total gross deferred tax liabilities | (5,596 | ) | (5,588 | ) | |||
Net deferred tax liabilities | $ | (2,897 | ) | $ | (3,514 | ) | |
At April 30, 2020, the Company had approximately $5.7 million of various state net operating loss carryforwards which are available to offset future state taxable income, if any, through 2035.
In assessing the realizability of deferred tax assets, management considers whether it is more likely than not that some portion or all of the deferred tax assets will not be realized. The ultimate realization of deferred tax assets is dependent upon the generation of future taxable income during the periods in which those temporary differences become deductible. Management considers the scheduled reversal of deferred tax liabilities, projected future taxable income, and tax planning strategies in making this assessment. Based upon reversal of deferred tax liabilities and expected future profitability, management believes it is more likely than not the Company will realize the benefits of these deductible differences, net of the existing valuation allowances, at April 30, 2020.
The Company applies the accounting provisions which require us to prescribe a recognition threshold and measurement attribution for the financial statement recognition and measurement of a tax position taken or expected to be taken within an income tax return.
As of April 30, 2020, 2019 and 2018, we recorded approximately $34,000, $43,000, and $56,000, respectively, of unrecognized tax benefits, inclusive of interest and penalties, all of which would impact our effective tax rate if recognized. The liability for unrecognized tax benefits is recorded net of any federal tax benefit that would result from payment.
We recognize potential accrued interest and penalties related to unrecognized tax benefits within income tax expense. To the extent interest and penalties are not assessed with respect to uncertain tax positions, amounts accrued will be reduced and reflected as a reduction of the overall income tax provision. As of April 30, 2020 and 2019, we recorded a liability for potential penalties and interest of approximately $19,000 and $22,000, respectively, related to uncertain tax positions.
A reconciliation of the beginning and ending amount of unrecognized tax benefits is as follows, excluding interest and penalties (in thousands):
2020 | 2019 | ||||||
Balance at beginning of the period | $ | 21 | $ | 32 | |||
Decreases as a result of positions taken during prior periods | (6 | ) | (11 | ) | |||
Increases as a result of positions taken during the current period | — | — | |||||
Balance at April 30, | $ | 15 | $ | 21 | |||
77
We conduct business globally and, as a result, file consolidated income tax returns in the United States federal jurisdiction and in many state and foreign jurisdictions. We are no longer subject to state and local, or non–U.S. income tax examinations for years prior to 2002. We are no longer subject to U.S. federal income tax examination for years prior to 2016.
During the years ended April 30, 2020, 2019 and 2018, we recorded research and development state tax credits against payroll taxes of approximately $427,000, $488,000, and $290,000 respectively, which reduced general and administrative expenses by the same amounts.
On December 22, 2017, the U.S. enacted the Tax Cuts and Jobs Act (the “Act”), which significantly changed U.S. tax law. The Act lowered our U.S. statutory federal income tax rate from 35% to 21% effective January 1, 2018. For fiscal 2018, our blended U.S. federal statutory tax rate was 30.3%. This is the result of using the tax rate of 35% for the first eight months of fiscal year 2018 and the reduced tax rate of 21% for the final four months of fiscal 2018. During the fiscal year ended April 30, 2018, we recorded a $1.2 million benefit from the impact of changes in the tax rate, primarily on deferred tax assets and liabilities, which was included in income tax expense on our consolidated statement of operations and deferred income taxes on our consolidated balance sheet. We remeasured our deferred taxes to reflect the reduced rate that will apply when these deferred taxes are settled or realized in future periods. To calculate the remeasurement of deferred taxes, we estimated when the existing deferred taxes will be settled or realized.
(6) Shareholders’ Equity
Except for the election or removal of directors and class votes as required by law or our Articles of Incorporation, holders of both classes of common stock vote as a single class on all matters, with each Class A common share entitled to cast one-tenth vote per share and each Class B common share entitled to cast one vote per share. Neither class has cumulative voting rights. Holders of Class A common shares, as a class, are entitled to elect 25% of the board of directors (rounded up to the nearest whole number of directors) if the number of outstanding Class A common shares is at least 10% of the number of outstanding shares of both classes of common stock. No cash or property dividend may be paid to holders of Class B common shares during any fiscal year of the Company unless a dividend of $0.05 per share has been paid in such year on each outstanding Class A common share. This $0.05 per share annual dividend preference is noncumulative. Dividends per Class B common share during any fiscal year may not exceed dividends paid per Class A common share during such year. Each Class B common share is convertible at any time into one Class A common share at the option of the shareholder.
Stock Option Plans
As of April 30, 2020, the Company has outstanding stock options granted pursuant to four stock option plans. The 2001 Stock Option Plan (the “2001 Plan”) became effective on September 1, 2000. This Plan was terminated and replaced by the 2011 Equity Compensation Plan (the “2011 Plan”) effective May 17, 2010. Options outstanding under the 2001 Plan remain in effect, but no new options may be granted under the plan. Effective July 9, 2009, we adopted the Logility, Inc. 1997 Stock Plan and the Logility, Inc. 2007 Stock Plan as equity plans of American Software, although we will not grant any additional stock options under these plans. On August 21, 2019, shareholders approved the Company’s 2020 Equity Compensation Plan (the "2020 Plan"). The 2020 Plan reserves for issuance 2,500,000 shares of Class A Common Stock plus the number of shares, if any, remaining available for issuance under the Company’s 2011 Plan.
Under the 2020 Plan, options to purchase Class A common shares are granted in the form of both incentive stock options and non-qualified stock options. The number of options granted under this plan is determined with each grant. By resolution of the Board of Directors, non-employee directors receive grants of non-qualified options to purchase 10,000 shares upon election and 4,000 shares at the end of each fiscal quarter. The price of such grants is equal to the closing market price of the shares on the date of grant. Options are exercisable based on the terms of such options, but no more than six years after the date of grant (or five years for incentive stock options granted to any person who owns 10% or more of the combined voting power of all classes of capital stock of the Company at the time of grant). A total of 2,500,000 shares are authorized for issuance pursuant to options granted under this Plan. Incentive and nonqualified options exercisable at April 30, 2020, 2019 and 2018 totaled 900,610, 1,086,180, and 965,416, respectively. Options available for grant at April 30, 2020, for the 2020 Plan are 1,529,143 shares.
78
A summary of changes in outstanding options for the year ended April 30, 2020 is as follows:
Number of Shares | Weighted Average Exercise Price | Weighted Average Remaining Contractual Term (years) | Aggregate Intrinsic Value | |||||||||
Outstanding at May 1, 2019 | 3,983,060 | $ | 10.88 | |||||||||
Granted | 1,113,000 | 14.72 | ||||||||||
Exercised | (1,020,910 | ) | 9.87 | |||||||||
Forfeited | (327,000 | ) | 12.02 | |||||||||
Expired | (2,500 | ) | 9.79 | |||||||||
Outstanding at April 30, 2020 | 3,745,650 | $ | 12.21 | 3.8 | $ | 16,011,836 | ||||||
Exercisable at April 30, 2020 | 900,610 | $ | 10.69 | 2.8 | $ | 5,214,907 | ||||||
The weighted-average grant date fair value of stock options granted during the years ended April 30, 2020, 2019, and 2018 is $3.20, $2.58, and $2.01 per share, respectively. The fair value of each option award is estimated on the date of grant using the Black-Scholes option pricing model with the following weighted-average assumptions for the years ended April 30, 2020, 2019, and 2018:
2020 | 2019 | 2018 | ||||||
Dividend yield | 2.8 | % | 3.6 | % | 3.9 | % | ||
Expected volatility | 30.9 | % | 30.0 | % | 28.9 | % | ||
Risk-free interest rate | 1.6 | % | 2.9 | % | 1.9 | % | ||
Expected term | 5 years | 5 years | 5 years | |||||
The expected volatility is based on the historical volatility and implied volatility. The Company uses historical data to estimate stock option exercise and forfeiture rates. The expected term represents the period over which the share-based awards are expected to be outstanding. Beginning after December 31, 2007, the expected term was estimated using historical data. The dividend yield is an estimate of the expected dividend yield on the Company’s stock. The risk-free rate is based on U.S. Treasury yields in effect at the time of the grant for the expected term of the stock options.
Options issued after May 1, 2007 with graded vesting are valued as a single award. The total value of the award is expensed on a straight-line basis over the vesting period with the amount of compensation cost recognized at any date at least equal to the portion of the grant date value of the award that is vested at that date. During the years ended April 30, 2020, 2019, and 2018, we issued 1,020,910, 602,176 and 984,310 shares of common stock, respectively, resulting from the exercise of stock options. The total intrinsic value of options exercised during the years ended April 30, 2020, 2019 and 2018 based on market value at the exercise dates was $5,569,882, $2,441,830 and $2,999,372 respectively. The fair value of grants vested during the years ended April 30, 2020, 2019 and 2018 was $1,786,342, $1,470,840 and $1,287,222, respectively. As of April 30, 2020, unrecognized compensation cost related to unvested stock option awards approximated $3.4 million and is expected to be recognized over a weighted average period of 1.9 years.
Stock Repurchases
On August 19, 2002, our Board of Directors approved a resolution authorizing the repurchase of up to 2.0 million shares of our Class A common stock. These repurchases have been and will be made through open market purchases at prevailing market prices. The timing of any repurchases will depend upon market conditions, the market price of our common stock and management’s assessment of our liquidity and cash flow needs. For this repurchase plan, through April 30, 2020, we have repurchased 1,053,679 shares of common stock at a cost of approximately $6.2 million. During fiscal 2020 we did not repurchase any shares. Under all repurchase plans as of April 30, 2020, we have repurchased 4,588,632 shares of common stock at a cost of approximately $25.6 million.
(7) Leases
The Company’s operating leases are primarily related to facility leases for administration and sales personnel. The operating leases have terms ranging from three to five years. While each of the leases includes renewal options, the Company has only included the base lease term in its calculation of lease assets and liabilities. The Company does not have any finance leases.
Balance sheet information related to operating leases is as follows (in thousands):
April 30, 2020 | |||
Assets | |||
Right of use assets | $ | 2,053 | |
Liabilities | |||
Current lease liabilities | 763 | ||
Long-term lease liabilities | 1,424 | ||
Total liabilities | $ | 2,187 | |
Lease cost information related to operating leases is as follows (in thousands):
Year ended April 30, 2020 | |||
Lease cost | |||
Operating lease cost | $ | 770 | |
Short-term lease cost | 643 | ||
Variable lease cost | 225 | ||
Total lease cost | $ | 1,638 | |
Lease costs are primarily included in "Sales and marketing" and "General and administrative" expenses in the Company’s consolidated statements of operations.
The impact of the Company's leases on consolidated statement of cash flows is presented in the operating activities section, which mainly consisted of cash paid for operating lease liabilities of approximately $1.3 million during fiscal 2020. The Company did not modify any existing leases or execute any new leases during fiscal 2020.
Weighted average information associated with the measurement of the Company’s remaining operating lease obligations is as follows:
April 30, 2020 | ||
Weighted average remaining lease term | 3.3 years | |
Weighted average discount rate | 3.5 | % |
The following table summarizes the maturity of the Company’s operating lease liabilities as of April 30, 2020 (in thousands):
79
Years ended April 30: | |||
2021 | $ | 775 | |
2022 | 702 | ||
2023 | 470 | ||
2024 | 346 | ||
2025 | 20 | ||
Thereafter | — | ||
Total operating lease payments | $ | 2,313 | |
Less imputed interest | (126 | ) | |
Total operating lease liabilities | $ | 2,187 | |
Future minimum lease payments, as defined under the previous lease accounting guidance of ASC Topic 840, under noncancelable operating leases (due to existence of renewal or escalation clauses) with initial or remaining lease terms in excess of one year as of April 30, 2019 are as follows (in thousands):
Years ended April 30: | |||
2020 | $ | 847 | |
2021 | 790 | ||
2022 | 706 | ||
2023 | 433 | ||
2024 | 317 | ||
Thereafter | 17 | ||
$ | 3,110 | ||
The Company leases to other tenants a portion of its headquarters building that it owns in Atlanta, Georgia. The leases expire at various dates through March 2025. Lease income is included in "Other, net" in the Company’s consolidated statements of operations and totaled approximately $0.2 million for the year ending April 30, 2020. Lease payments to be received as of April 30, 2020 are as follows (in thousands):
Years ended April 30: | |||
2021 | $ | 165 | |
2022 | 149 | ||
2023 | 96 | ||
2024 | 98 | ||
2025 | 100 | ||
Thereafter | 50 | ||
$ | 658 | ||
Future minimum lease rentals receivable under noncancelable, as defined under the previous lease accounting guidance of ASC Topic 840, operating leases (with initial or remaining lease terms in excess of one year) as of April 30, 2019 are as follows (already included or prorated at the Company’s occupied building) (in thousands):
Years ended April 30: | |||
2020 | $ | 194 | |
2021 | 105 | ||
2022 | 55 | ||
2023 | — | ||
2024 | — | ||
Thereafter | — | ||
$ | 354 | ||
80
(8) Commitments and Contingencies
(a) 401(k) Profit Sharing Plan
Employees are offered the opportunity to participate in the Company’s 401(k) Profit Sharing Plan (the "401(k) Plan"), which is intended to be a tax-qualified defined contribution plan under Section 401(k) of the Internal Revenue Code. Under the 401(k) Plan, employees are eligible to participate on the first day of the month following the date of hire. Eligible employees may contribute up to $19,500 of their salary to the 401(k) Plan. Subject to certain limitations, the Company may make a discretionary profit sharing contribution at an amount determined by the board of directors of the Company. The Company’s profit sharing contribution was $451,000 for fiscal 2020, $429,000 for fiscal 2019 and $330,000 for fiscal 2018.
(b) Contingencies
The Company more often than not indemnifies its customers against damages and costs resulting from claims of intellectual property infringement associated with use of the Company’s products. The Company historically has not been required to make any payments under such indemnifications. However, the Company continues to monitor the circumstances that are subject to the indemnifications to identify whether it is probable that a loss has occurred, and would recognize any such losses under the indemnifications when those losses are estimable.
In addition, the Company warrants to customers that the Company’s products operate substantially in accordance with the software product’s specifications. Historically, no costs have been incurred related to software product warranties and none are expected in the future, and as such no accruals for software product warranty costs have been made. Additionally, the Company is involved in various claims arising in the ordinary course of business. In the opinion of management, the ultimate disposition of these matters will not have a material adverse effect on the financial position or results of operations of the Company.
(9) Segment Information
FASB ASC 280, Segment Reporting, establishes standards for reporting information about operating segments. Operating segments are defined as components of a public entity about which separate financial information is available that is evaluated regularly by the chief operating decision makers (“CODMs”), or decision making group, in deciding how to allocate resources and in assessing performance. Our CODMs are our Chief Executive Officer and President and our Chief Financial Officer. While our CODMs are apprised of a variety of financial metrics and information, we manage our business primarily on a segment basis, with the CODMs evaluating performance based upon segment operating profit or loss that includes an allocation of common expenses, but excludes certain unallocated corporate expenses, which are included in the Other segment. Our CODMs review the operating results of our three segments, assess performance and allocate resources in a manner that is consistent with the changing market dynamics that we have experienced. As a result, in the third quarter of fiscal 2018, we updated our operating segments to reflect the fact that we provide our software solutions through three major operating segments, which are further broken down into a total of six major product and service groups. The three operating segments are: (1) Supply Chain Management (“SCM”), (2) Information Technology Consulting (“IT Consulting”) and (3) Other.
The SCM segment consists of (i) Logility, which provides supply chain optimization and advance retail planning solutions, as an integrated suite of sales and operations planning, demand optimization, inventory optimization, manufacturing planning and scheduling, supply optimization, retail allocation and merchandise planning and transportation optimization, as well as (ii) DMI, which provides collaborative supply chain solutions to streamline and optimize the forecasting, inventory, production, supply, allocation, distribution and management of products between trading partners, and (iii) NGC, which provides cloud solutions for supply chain management, PLM, quality control, vendor compliance and enterprise resource planning for both retailers and manufacturers in the apparel, sewn products and furniture industries. The IT Consulting segment consists of The Proven Method, Inc., an IT staffing and consulting services firm, which provides support for our software products, such as software enhancements, documentation, updates, customer education, consulting, systems integration services, maintenance and support services. The Other segment consists of (i) American Software ERP, which provides purchasing and materials management, customer order processing, financial, e-commerce and traditional manufacturing solutions, and (ii) unallocated corporate overhead expenses.
All of our revenues are derived from external customers. We do not have any inter-segment revenue. Our income taxes and dividends are paid at a consolidated level. Consequently, it is not practical to show these items by operating segment.
81
Following is information related to each segment as of and for the years ended April 30, 2020, 2019 and 2018, (in thousands):
2020 | 2019 | 2018 | |||||||||
Revenues: | |||||||||||
Supply Chain Management | $ | 95,018 | $ | 86,296 | $ | 91,613 | |||||
IT Consulting | 17,997 | 20,007 | 18,460 | ||||||||
Other | 2,451 | 2,403 | 2,630 | ||||||||
$ | 115,466 | $ | 108,706 | $ | 112,703 | ||||||
Operating income/(loss): | |||||||||||
Supply Chain Management | $ | 19,612 | $ | 15,967 | $ | 19,580 | |||||
IT Consulting | 332 | 964 | 985 | ||||||||
Other | (13,896 | ) | (11,655 | ) | (7,034 | ) | |||||
$ | 6,048 | $ | 5,276 | $ | 13,531 | ||||||
Capital expenditures: | |||||||||||
Supply Chain Management | $ | 156 | $ | 375 | $ | 263 | |||||
IT Consulting | — | 1 | 10 | ||||||||
Other | 264 | 876 | 1,155 | ||||||||
$ | 420 | $ | 1,252 | $ | 1,428 | ||||||
Capitalized software: | |||||||||||
Supply Chain Management | $ | 3,170 | $ | 5,961 | $ | 4,804 | |||||
IT Consulting | — | — | — | ||||||||
Other | — | — | — | ||||||||
$ | 3,170 | $ | 5,961 | $ | 4,804 | ||||||
Depreciation and amortization: | |||||||||||
Supply Chain Management | $ | 7,727 | $ | 7,372 | $ | 5,827 | |||||
IT Consulting | 5 | 7 | 7 | ||||||||
Other | 371 | 340 | 196 | ||||||||
$ | 8,103 | $ | 7,719 | $ | 6,030 | ||||||
Interest income: | |||||||||||
Supply Chain Management | $ | 829 | $ | 1,408 | $ | 1,043 | |||||
IT Consulting | — | — | — | ||||||||
Other | 695 | 684 | 532 | ||||||||
$ | 1,524 | $ | 2,092 | $ | 1,575 | ||||||
Earnings/(loss) before income taxes: | |||||||||||
Supply Chain Management | $ | 19,855 | $ | 16,335 | $ | 20,026 | |||||
IT Consulting | 332 | 964 | 985 | ||||||||
Other | (13,389 | ) | (9,658 | ) | (5,296 | ) | |||||
$ | 6,798 | $ | 7,641 | $ | 15,715 | ||||||
April 30, 2020 | April 30, 2019 | ||||||
(in thousands) | |||||||
Total Consolidated Assets: | |||||||
Supply Chain Management | $ | 117,135 | $ | 112,604 | |||
IT Consulting | 5,200 | 4,599 | |||||
Other | 48,958 | 44,107 | |||||
$ | 171,293 | $ | 161,310 | ||||
82
International Revenue and Significant Customer
International revenues approximated $22.1 million or 19%, $21.4 million or 20%, and $21.8 million or 19%, of consolidated revenues for the years ended April 30, 2020, 2019, and 2018, respectively, and were derived primarily from customers in Canada and Europe. International revenue is based on the delivery of software and performance of services.
No single customer accounted for more than 10% of total revenues for the years ended April 30, 2020, 2019 and 2018.
(10) Financial Statements and Supplementary Data (Unaudited)
The following schedule presents results for each quarter in the years ended April 30, 2020 and 2019 (in thousands, except per share amounts):
Total revenues | Gross margin | Operating income | Net earnings | Diluted earnings per share* | |||||||||||||||
Quarter ended: | |||||||||||||||||||
July 31, 2019 | $ | 27,383 | $ | 14,622 | $ | 797 | $ | 1,152 | $ | 0.04 | |||||||||
October 31, 2019 | 28,210 | 15,186 | 843 | 1,759 | 0.05 | ||||||||||||||
January 31, 2020 | 30,600 | 17,442 | 2,819 | 3,286 | 0.10 | ||||||||||||||
April 30, 2020 | 29,273 | 15,908 | 1,589 | 545 | 0.02 | ||||||||||||||
Year ended April 30, 2020 | $ | 115,466 | $ | 63,158 | $ | 6,048 | $ | 6,742 | $ | 0.21 | |||||||||
Quarter ended: | |||||||||||||||||||
July 31, 2018 | $ | 27,399 | $ | 13,752 | $ | 607 | $ | 1,385 | $ | 0.04 | |||||||||
October 31, 2018 | 28,033 | 14,667 | 1,526 | 1,243 | 0.04 | ||||||||||||||
January 31, 2019 | 27,003 | 14,039 | 2,130 | 2,301 | 0.07 | ||||||||||||||
April 30, 2019 | 26,271 | 14,282 | 1,013 | 1,874 | 0.06 | ||||||||||||||
Year ended April 30, 2019 | $ | 108,706 | $ | 56,740 | $ | 5,276 | $ | 6,803 | $ | 0.22 | |||||||||
______________
* | Table may contain rounding |
(11) Subsequent Events
On May 20, 2020, our Board of Directors declared a quarterly cash dividend of $0.11 per share of our Class A and Class B common stock. The cash dividend is payable on August 28, 2020 to Class A and Class B shareholders of record at the close of business on August 14, 2020.
ITEM 9. | CHANGES IN AND DISAGREEMENTS WITH ACCOUNTANTS ON ACCOUNTING AND FINANCIAL DISCLOSURE |
None.
ITEM 9A. | CONTROLS AND PROCEDURES |
Evaluation of Disclosure Controls and Procedures
Our disclosure controls and procedures (as defined in Rule 13a-15(e) of the Securities Exchange Act of 1934 (“Exchange Act”)) are designed to provide reasonable assurance that information required to be disclosed in our reports filed or submitted under the Exchange Act, such as this annual report on Form 10-K, is recorded, processed, summarized and reported within the time periods specified in the SEC's rules and forms. Our disclosure controls and procedures are also designed to ensure that such information is accumulated and communicated to our management, including our principal executive officer and principal financial officer, to allow timely decisions regarding required disclosure.
Our principal executive officer and principal financial officer, with the assistance of our Disclosure Committee, have conducted an evaluation of the effectiveness of our disclosure controls and procedures as of April 30, 2020. We perform this evaluation on a quarterly basis so that the conclusions concerning the effectiveness of our disclosure controls and procedures can be reported in our annual report on Form 10-K and quarterly reports on Form 10-Q. Based on this evaluation, our principal executive officer and principal
83
financial officer have concluded that our disclosure controls and procedures were effective to provide such reasonable assurance as of April 30, 2020.
We believe our consolidated financial statements fairly present in all material respects our financial position, results of operations and cash flows in our annual report on Form 10-K. The unqualified opinion of our independent registered public accounting firm on our consolidated financial statements as of April 30, 2020 and 2019 and for each of the years in the three-year period ended April 30, 2020 is included in this annual report on Form 10-K.
Changes in Internal Control over Financial Reporting
There have not been any changes in the Company’s internal control over financial reporting (as such term is defined in Rules 13a-15(f) and 15d-15(f) under the Exchange Act) during the last fiscal quarter of fiscal 2020 to which this report relates that have materially affected, or are reasonably likely to materially affect, the Company’s internal control over financial reporting.
Reports on Internal Control Over Financial Reporting
Management’s report on internal control over financial reporting and the report of the independent registered public accounting firm on internal control over financial reporting are included under Item 8, “Financial Statements and Supplementary Data,” of this report.
ITEM 9B. OTHER INFORMATION
None.
PART III
ITEM 10. | DIRECTORS, EXECUTIVE OFFICERS AND CORPORATE GOVERNANCE |
The information required by this item is incorporated by reference from the information contained in our Proxy Statement for the Annual Meeting of Shareholders expected to be filed with the SEC on or about July 30, 2020 (the "Proxy Statement") under the captions “Election of Directors,” “Executive Compensation,” “Section 16(a) Beneficial Ownership Reporting Compliance,” “Code of Business Conduct and Ethics,” and “Committees of the Board of Directors.”
ITEM 11. | EXECUTIVE COMPENSATION |
This information is set forth under the caption “Executive Compensation” in the Proxy Statement, which information is incorporated herein by reference.
ITEM 12. | SECURITY OWNERSHIP OF CERTAIN BENEFICIAL OWNERS AND MANAGEMENT AND RELATED STOCKHOLDER MATTERS |
Information regarding security ownership of management and others is set forth under the caption “Security Ownership of Certain Beneficial Owners and Management” in the Proxy Statement, which information is incorporated herein by reference.
ITEM 13. | CERTAIN RELATIONSHIPS AND RELATED TRANSACTIONS, AND DIRECTOR INDEPENDENCE |
Policy Regarding Transactions with Related Persons
On December 8, 2003, our Board of Directors adopted a resolution directing the Audit Committee of the Board of Directors to establish and implement procedures for identifying and conducting an appropriate review of any proposed transaction that meets the definition of “related party transaction” within the meaning of Item 404 of SEC Regulation S-K. In January 2004, the Audit Committee adopted written procedures in accordance with such direction. Under those procedures, the Audit Committee reviews and evaluates any proposed related party transaction and determines whether the terms of such transaction, judged at the time of the determination, are fair to the Company. Our officers are instructed that when a related party transaction is proposed, they are to bring it to the attention of the Audit Committee, which then reviews the transaction and makes a determination of whether it meets the above standard. The Audit Committee is required to prepare a report of its deliberations, conclusions and recommendations, and furnish that report to the full Board of Directors.
Information regarding director independence is set forth under the captions “Director Independence” and “Committees of the Board of Directors” in the Proxy Statement, which information is incorporated herein by reference.
84
ITEM 14. | PRINCIPAL ACCOUNTING FEES AND SERVICES |
This information is set forth under the caption “Ratification of Appointment of Independent Registered Public Accounting Firm” in the Proxy Statement, which information is incorporated herein by reference.
PART IV
ITEM 15. | EXHIBITS, FINANCIAL STATEMENT SCHEDULES |
(a) Documents filed as part of this report.
1. Financial statements; All financial statements of the Company as described in Item 8 of this report on Form 10-K.
2. Financial statement schedule included in Part IV of this Form:
Page | ||
Schedule II—Consolidated Valuation Accounts—for the three years ended April 30, 2020 | 86 | |
All other financial statements and schedules not listed above are omitted as the required information is not applicable or the information is presented in the financial statements or related notes.
85
3. Exhibits
The following exhibits are filed herewith or incorporated herein by reference:
3.1 | The Company’s Amended and Restated Articles of Incorporation, and amendments thereto.(1)(P) | ||
3.2 | |||
10.1 | American Software, Inc. 401(k)/Profit Sharing Plan and Trust Agreement.(3)(P) | ||
10.2 | |||
10.3 | |||
10.4 | |||
10.5 | |||
10.6 | |||
10.7 | |||
10.8 | |||
10.9 | |||
21.1 | |||
23.1 | |||
31.1 | |||
31.2 | |||
32.1 | |||
101.INS | XBRL Instance Document. | ||
101.SCH | XBRL Taxonomy Extension Schema Document. | ||
101.CAL | XBRL Taxonomy Extension Calculation Linkbase Document. | ||
101.DEF | XBRL Taxonomy Extension Definition Linkbase Document. | ||
101.LAB | XBRL Taxonomy Extension Label Linkbase Document. | ||
101.PRE | XBRL Taxonomy Extension Presentation Linkbase Document. | ||
______________
(1) | Incorporated by reference herein. Filed by the Company as an exhibit to its quarterly report filed on Form 10-Q for the quarter ended October 31, 1990. |
(2) | Incorporated by reference herein. Filed by the Company as an exhibit to its quarterly report filed on Form 10-Q for the quarter ended January 31, 2010. |
(3) | Incorporated by reference herein. Filed by the Company as an exhibit to its Registration Statement No. 33-55214 filed on Form S-8 on December 1, 1992. |
(4) | Incorporated by reference herein. Filed by the Company as an exhibit to its annual report filed on Form 10-K for the fiscal year ended April 30, 2002. |
(5) | Incorporated by reference herein. Filed by the Company as an appendix to its Definitive Proxy Statement filed on July 27, 2017. |
(6) | Incorporated by reference herein. Filed by the Company as exhibit 10.1 to its current report on Form 8-K filed on July 15, 2016. |
86
(7) | Incorporated by reference herein. Filed by the Company as exhibit 10.2 to its current report on Form 8-K filed on July 15, 2016. |
(8) | Incorporated by reference herein. Filed by the Company as exhibit 10.3 to its current report on Form 8-K filed on July 15, 2016. |
(9) | Incorporated by reference herein. Filed by the Company as exhibit 10.4 to its current report on Form 8-K filed on July 15, 2016. |
(10) | Incorporated by reference herein. Filed by the Company as exhibit 10.1 to its current report on Form 8-K/A filed on July 13, 2017. |
(11) | Incorporated by reference herein. Filed as Appendix A to the Company’s Definitive Proxy Statement on Schedule 14A filed with the Securities and Exchange Commission on July 26, 2019. |
SCHEDULE II
AMERICAN SOFTWARE, INC.
CONSOLIDATED VALUATION ACCOUNTS
Years ended April 30, 2020, 2019, 2018
(In thousands)
Allowance for Doubtful Accounts
Year ended: | Balance at beginning of year | Amounts charged to expense | Other Additions (1) | Deductions (2) | Balance at end of year | |||||||||||
April 30, 2020 | $ | 153 | 97 | 14 | — | 264 | ||||||||||
April 30, 2019 | $ | 159 | — | — | 6 | 153 | ||||||||||
April 30, 2018 | $ | 171 | 24 | — | 36 | 159 | ||||||||||
_______________
(1) | Recovery of previously written-off amounts. |
(2) | Write-off of uncollectible accounts. |
Deferred Income Tax Valuation Allowance
The deferred tax valuation allowance roll-forward is included in Item 8 of this Report in the Notes to Consolidated Financial Statements—Note 5.
See accompanying report of independent registered public accounting firm.
ITEM 16. | FORM 10-K SUMMARY. |
None.
87
SIGNATURES
Pursuant to the requirements of Section 13 or 15(d) of the Securities Exchange Act of 1934, the registrant has duly caused this report to be signed on its behalf by the undersigned, thereunto duly authorized.
AMERICAN SOFTWARE, INC. | |||
By: | /s/ H. Allan Dow | ||
H. Allan Dow | |||
Chief Executive Officer and President (Principal Executive Officer) | |||
Date: July 10, 2020
Pursuant to the requirements of the Securities Exchange Act of 1934, this report has been signed below by the following persons on behalf of the registrant and in the capacities and on the dates indicated.
Signatures | Title | Date | ||
/s/ James C. Edenfield | Executive Chairman, Treasurer and Director | July 10, 2020 | ||
James C. Edenfield | ||||
/s/ H. Allan Dow | Chief Executive Officer and President (Principal Executive Officer) and Director | July 10, 2020 | ||
H. Allan Dow | ||||
/s/ W. Dennis Hogue | Director | July 10, 2020 | ||
W. Dennis Hogue | ||||
/s/ James B. Miller, Jr. | Director | July 10, 2020 | ||
James B. Miller, Jr. | ||||
/s/ Thomas L. Newberry, V. | Director | July 10, 2020 | ||
Thomas L. Newberry, V. | ||||
/s/ Matthew G. McKenna | Director | July 10, 2020 | ||
Matthew G. McKenna | ||||
/s/ Lizanne Thomas | Director | July 10, 2020 | ||
Lizanne Thomas | ||||
/s/ Vincent C. Klinges | Chief Financial Officer (Principal Financial Officer) | July 10, 2020 | ||
Vincent C. Klinges | ||||
/s/ Bryan L. Sell | Controller (Principal Accounting Officer) | July 10, 2020 | ||
Bryan L. Sell | ||||
88