Attached files
| file | filename |
|---|---|
| 8-K - FORM 8-K - HEALTHEQUITY, INC. | tm2024096-3_8k.htm |
Exhibit 99.1

Copyright © 2020 HealthEquity, Inc. All rights reserved. Investor update July 7, 2020 HealthEquity does not provide legal, tax or financial advice.
Safe harbor 2 This presentation includes information contained in our public filings filed with the Securities and Exchange Commission (SEC ), which public filings are expressly incorporated herein by reference (see http://ir.healthequity.com/ ), and other publicly available information. Readers are encouraged to review our public filings for further information. Forward - Looking Statements This presentation contains “forward - looking” statements that are based on our management’s beliefs and assumptions and on inform ation currently available to management. These forward - looking statements include, without limitation, statements regarding our indust ry, business strategy, plans, goals and expectations concerning our market position, product expansion, future operations, margins, profitability, future efficiencie s, capital expenditures, liquidity and capital resources and other financial and operating information. When used in this discussion, the words “may,” “believes,” “intends, ” “ seeks,” “anticipates,” “plans,” “estimates,” “expects,” “should,” “assumes,” “continues,” “could,” “will,” “future” and the negative of these or similar terms and phrases ar e intended to identify forward - looking statements. Forward - looking statements involve known and unknown risks, uncertainties and other factors that may cause our actual results, p erformance or achievements to be materially different from any future results, performance or achievements expressed or implied by the forward - looking statements . Forward - looking statements represent our management’s beliefs and assumptions only as of the date of this presentation. Our actual future results may be materially di ffe rent from what we expect. Except as required by law, we assume no obligation to update these forward - looking statements publicly, or to update the reasons actual results cou ld differ materially from those anticipated in the forward - looking statements, even if new information becomes available in the future. Readers are encouraged to review our pu blic filings with the SEC for further disclosure of other factors that could cause actual results to differ materially from those indicated in any forward - looking sta tements included herein. This presentation also contains estimates and other statistical data made by independent parties and by us relating to market si ze and growth and other data about our industry. This data involves a number of assumptions and limitations, and you are cautioned not to give undue weight to such est imates. Non - GAAP Information This presentation includes certain non - GAAP financial measures as defined by SEC rules. As required by Regulation G, we have pro vided a reconciliation of those measures to the most directly comparable GAAP measures, which is attached in the appendix hereto. SEC Rule 433 The issuer has filed a registration statement (including a base prospectus and the accompanying prospectus supplement) with t he SEC for the offering to which this communication relates. Before you invest, you should read the prospectus and the accompanying prospectus supplemen t i n that registration statement and other documents the issuer has filed with the SEC for more complete information about the issuer and this offering. You may get the se documents for free by visiting EDGAR on the SEC Web site at www.sec.gov . To obtain a copy of the prospectus supplement and related base prospectus for this offering, please contact Wells Fargo Sec uri ties, Attention: Equity Syndicate Department, 500 West 33rd Street, New York, New York, 10001, at (800) 326 - 5897 or email a request to cmclientsupport@wellsfargo.com .
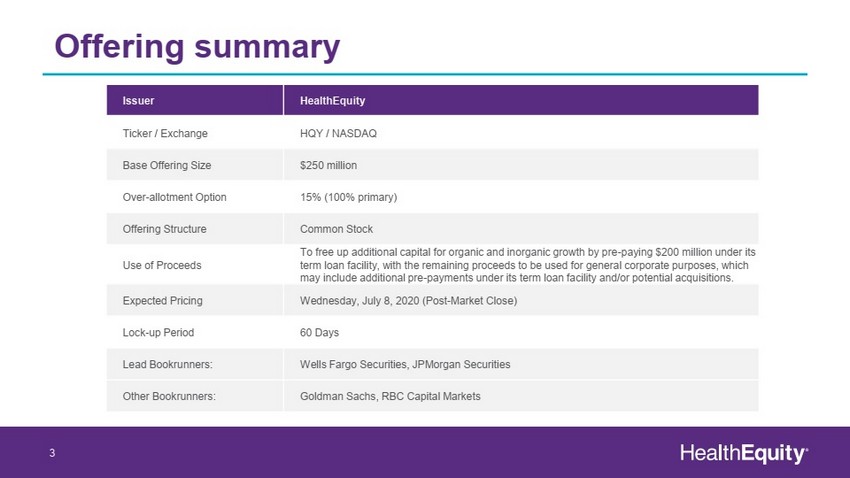
Offering summary 3 Issuer HealthEquity Ticker / Exchange HQY / NASDAQ Base Offering Size $250 million Over - allotment Option 15% (100% primary) Offering Structure Common Stock Use of Proceeds To free up additional capital for organic and inorganic growth by pre - paying $200 million under its term loan facility, with the remaining proceeds to be used for general corporate purposes, which may include additional pre - payments under its term loan facility and/or potential acquisitions. Expected Pricing Tuesday, July 7, 2020 (Post - Market Close) Lock - up Period 60 Days Lead Bookrunners: Wells Fargo Securities, JP Morgan Securities Other Bookrunners : Goldman Sachs, RBC Capital Markets
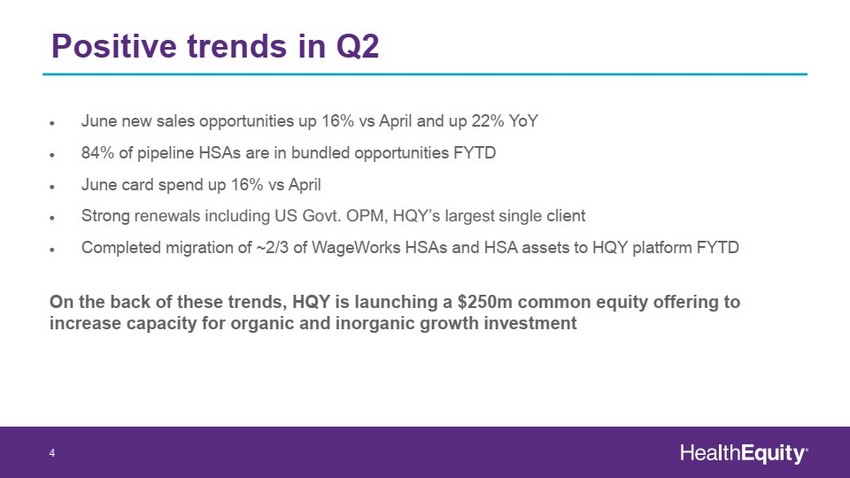
Positive trends in Q2 4 June new sales opportunities up 16% vs April and up 22% YoY 84% of pipeline HSAs are in bundled opportunities FYTD June card spend up 16% vs April Continued HSA, Custodial Asset and CDB account growth Low attrition from BNYM migration Strong renewals including US Govt. OPM, HQYs largest single client On the back of these trends, HQY is launching a $250m common equity offering to increase capacity for organic and inorganic growth investment

An industry leader 5 HealthEquity HSAs, HSA Assets, HRAs, FSAs, Commuter, COBRA, and Other CDBs as of April 30, 2020. Integrations information and em ployer served information is as of January 31, 2020. Management estimates benefits administration for employers that employ 1 in 7 working Americans based on Pew Research Center ana lysis of 2018 labor force data estimating 154m working Americans as of December 31, 2018, and management’s assumption that our 12 million members represent less than half of the wo rkf orce of the employers we serve as of January 2020. HealthEquity Advisors, LLC is a wholly owned subsidiary of HealthEquity, Inc. and an SEC - registered investment adviser. Registra tion does not imply endorsement by any state or agency and does not imply a level of skill, education, or training.
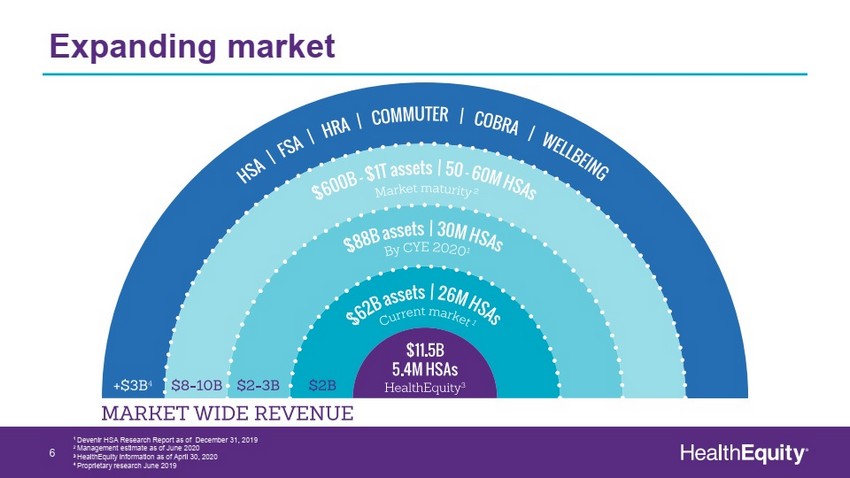
Expanding market 6 1 Devenir HSA Research Report as of December 31, 2019 2 Management estimate as of June 2020 3 HealthEquity information as of April 30, 2020 4 Proprietary research June 2019
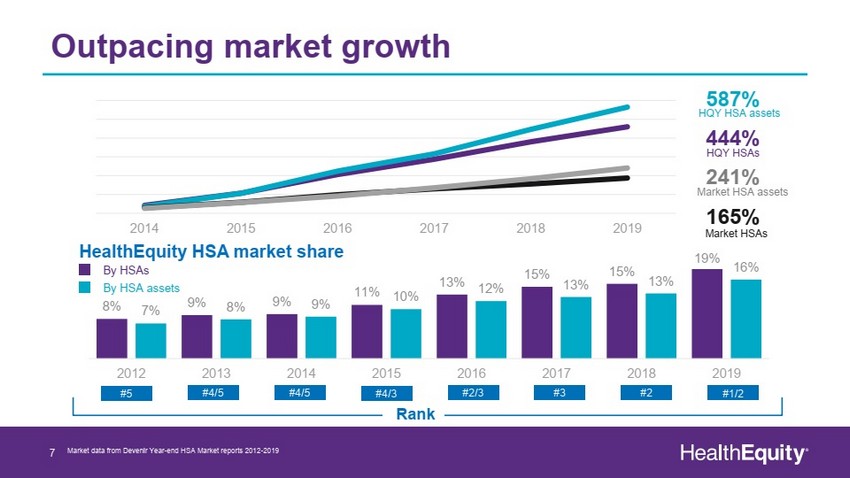
Outpacing market growth 7 Market data from Devenir Year - end HSA Market reports 2012 - 2019 Rank #5 #4/5 #4/5 #4/3 #2/3 #3 #2 #1/2 HealthEquity HSA market share 2014 2015 2016 2017 2018 2019 587% HQY HSA assets 444% HQY HSAs 241% Market HSA assets 165% Market HSAs By HSAs By HSA assets 8% 9% 9% 11% 13% 15% 15% 19% 7% 8% 9% 10% 12% 13% 13% 16% 2012 2013 2014 2015 2016 2017 2018 2019
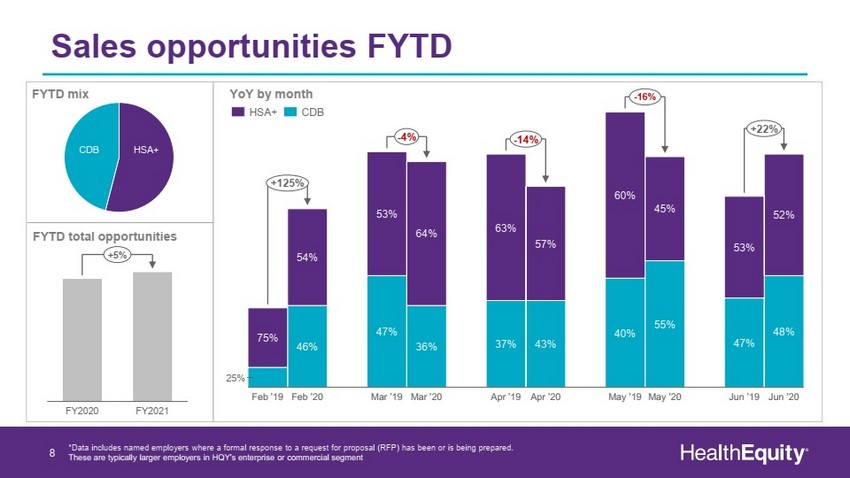
Sales opportunities FYTD 8 Mar ’19 64% 36% Mar ’20 63% Apr ’19 57% 43% Apr ’20 47% 37% May ’19 May ’20 53% Jun ’20 52% 75% 60% 54% Jun ’19 25% Feb ’19 46% 45% 40% 55% Feb ’20 48% 53% 47% +125% - 4% - 14% - 16% +22% HSA+ CDB FYTD total opportunities YoY by month FYTD mix FY2020 FY2021 +5% CDB HSA+ *Data includes named employers where a formal response to a request for proposal (RFP) has been or is being prepared. These are typically larger employers in HQY’s enterprise or commercial segment
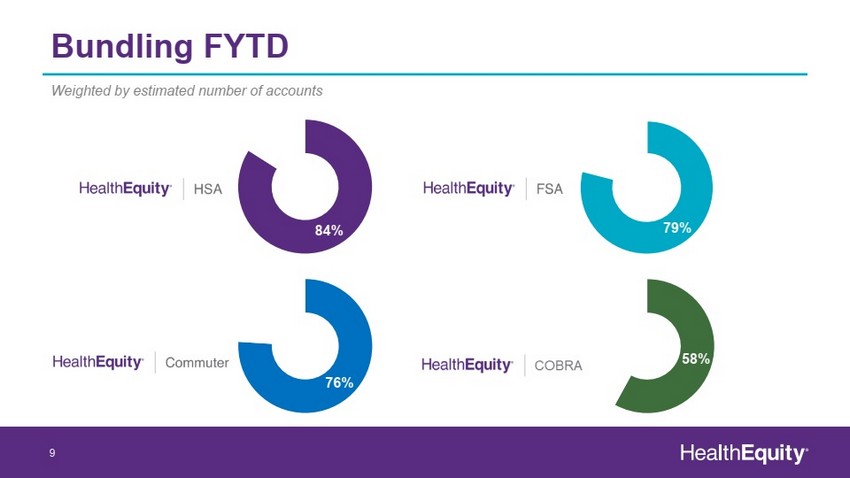
79% Bundling FYTD 9 Weighted by estimated number of accounts 84% 76% 58%
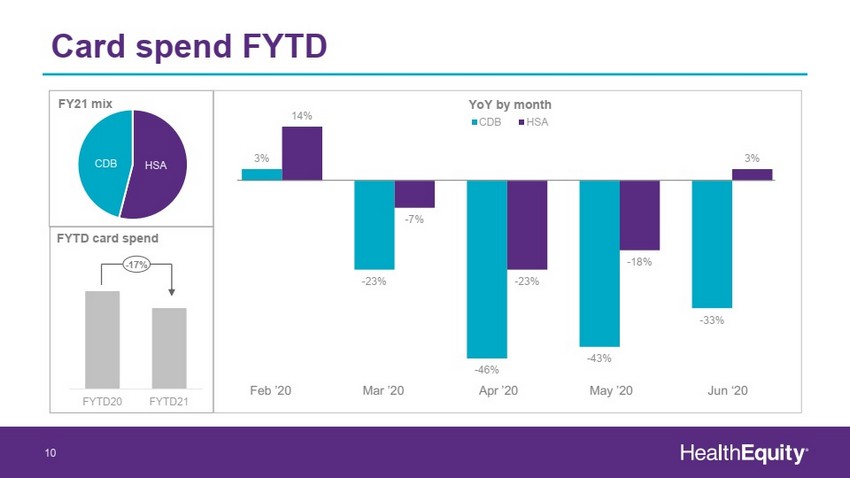
Card spend FYTD 10 FYTD20 FYTD21 - 17% CDB HSA FYTD card spend FY21 mix Note: Amounts representative of the Company’s largest card provider. Is not inclusive of all the Company’s card providers. 3% - 23% - 46% - 43% - 33% 14% - 7% - 23% - 18% 3% CDB HSA Feb ’20 Mar ’20 Apr ’20 May ’20 Jun ‘20 YoY by month
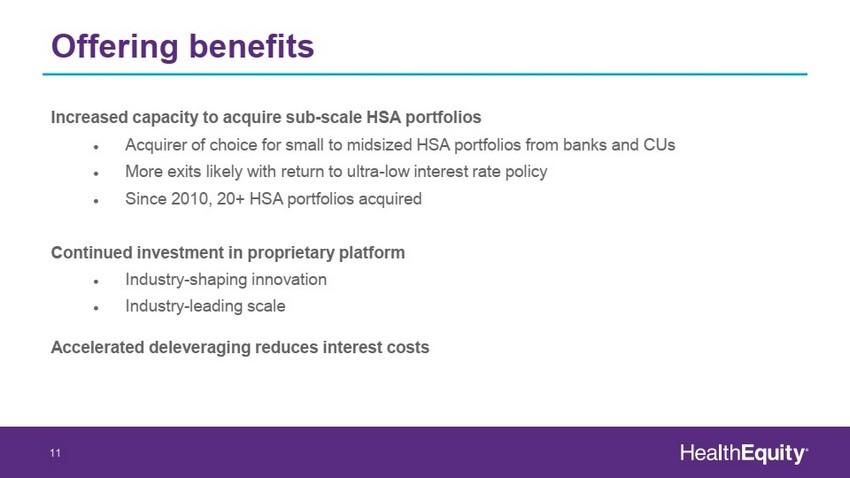
Offering benefits 11 Increased capacity to acquire sub - scale HSA portfolios Acquirer of choice for small to midsized HSA portfolios from banks and CUs More exits likely with return to ultra - low interest rate policy Since 2010, 20+ HSA portfolios acquired Continued investment in proprietary platform Industry - shaping innovation Industry - leading scale Accelerated deleveraging reduces interest costs
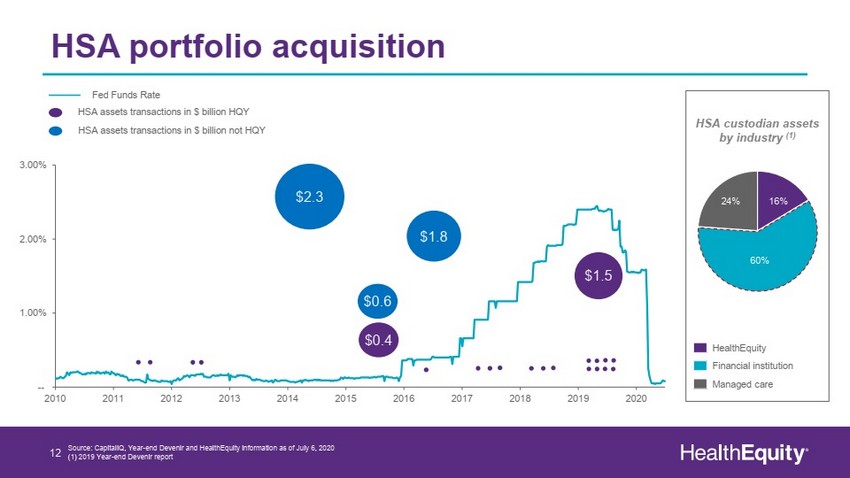
2010 2011 2012 2013 2014 2015 2016 2017 2018 2019 2020 -- 1.00% 2.00% 3.00% HSA portfolio acquisition 12 Source: CapitalIQ , Year - end Devenir and HealthEquity information as of July 6, 2020 (1) 2019 Year - end Devenir report Fed Funds Rate HSA custodian assets by industry (1) 16% 60% 24% HealthEquity Financial institution Managed care $2.3 $0.6 $1.8 $1.5 HSA assets transactions in $ billion not HQY HSA assets transactions in $ billion HQY $0.4
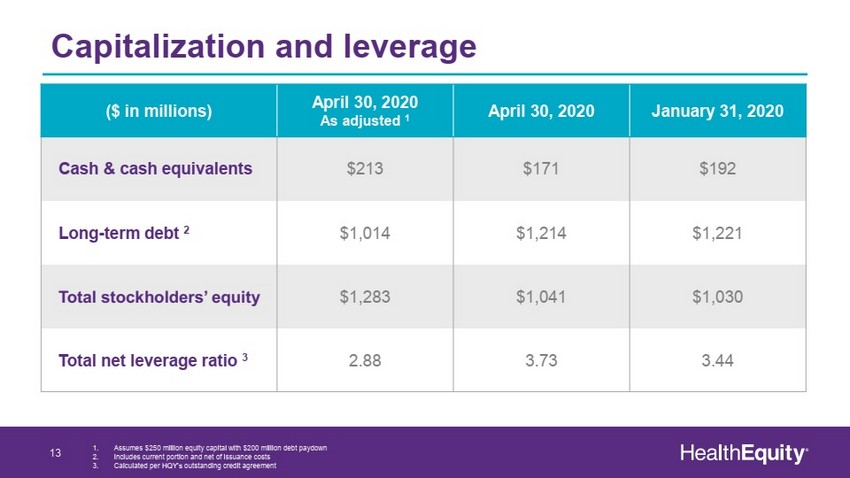
Capitalization and leverage 13 ($ in millions) April 30, 2020 As adjusted 1 April 30, 2020 January 31, 2020 Cash & cash equivalents $213 $171 $192 Long - term debt 2 $1,014 $1,214 $1,221 Total stockholders’ equity $1,283 $1,041 $1,030 Total net leverage ratio 3 2.88 3.73 3.44 1. Assumes $250 million equity capital with $200 million debt paydown 2. Includes current portion and net of issuance costs 3. Calculated per HQY’s outstanding credit agreement

$171 $213 $1,214 $1,014 Q1 21 As Adjusted Q1 21 ² Interest savings offset earnings dilution 14 x Reduces debt outstanding x Lowers pricing on overall pro forma debt x Enhances liquidity and acquisition flexibility x Increases covenant cushion Borrowing costs: L + 200 L + 175 Debt outstanding 1 Cash 1. Includes current portion and net of issuance costs 2. Assumes $250 million equity capital with $200 million debt paydown ($ in Millions)
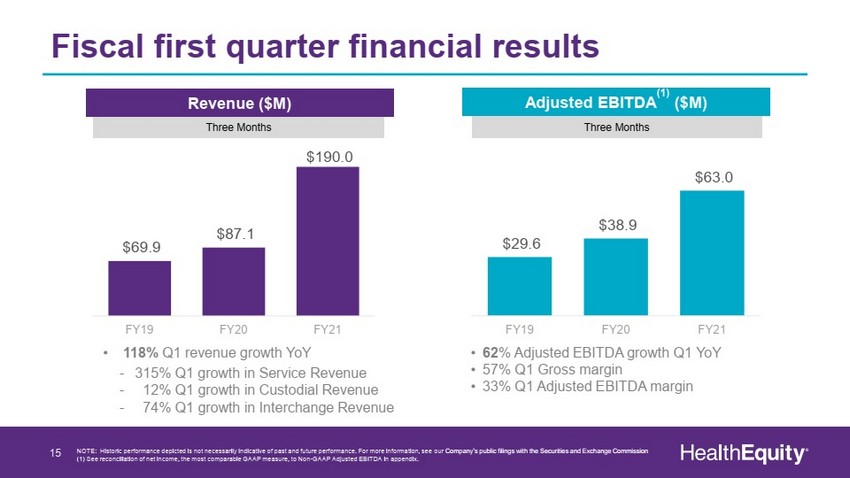
Fiscal first quarter financial results 15 NOTE: Historic performance depicted is not necessarily indicative of past and future performance. For more information, see our Company’s public filings with the Securities and Exchange Commission (1) See reconciliation of net income, the most comparable GAAP measure, to Non - GAAP Adjusted EBITDA in appendix . • 118% Q1 revenue growth YoY - 315% Q1 growth in Service Revenue - 12% Q1 growth in Custodial Revenue - 74% Q1 growth in Interchange Revenue • 62 % Adjusted EBITDA growth Q1 YoY • 57% Q1 Gross margin • 33% Q1 Adjusted EBITDA margin Three Months Three Months Revenue ($M) Adjusted EBITDA (1) ($M) $69.9 $87.1 $190.0 FY19 FY20 FY21 $29.6 $38.9 $63.0 FY19 FY20 FY21
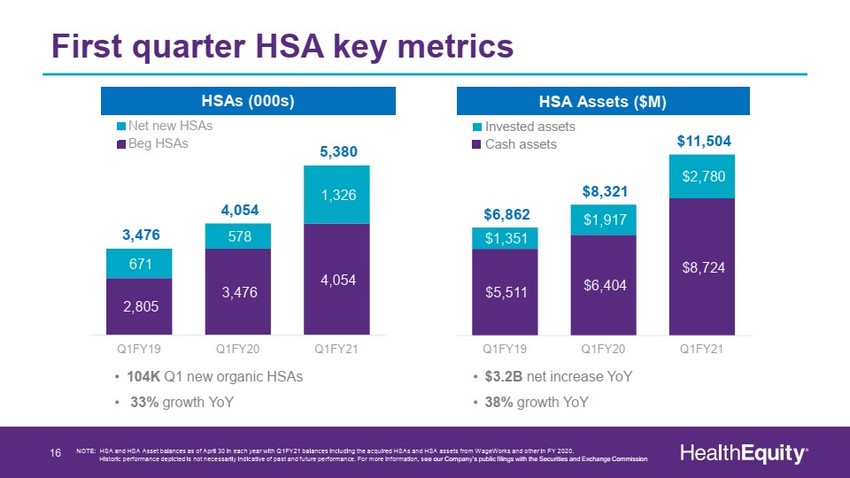
First quarter HSA key metrics 16 HSAs (000s) • 104K Q1 new organic HSAs • 33% growth YoY • $3.2B net increase YoY • 38% growth YoY NOTE: HSA and HSA Asset balances as of April 30 in each year with Q1FY21 balances including the acquired HSAs and HSA assets fr om WageWorks and other in FY 2020. Historic performance depicted is not necessarily indicative of past and future performance. For more information, s ee our Company’s public filings with the Securities and Exchange Commission HSA Assets ($M) 2,805 3,476 4,054 671 578 1,326 3,476 4,054 5,380 Q1FY19 Q1FY20 Q1FY21 Net new HSAs Beg HSAs $5,511 $6,404 $8,724 $1,351 $1,917 $2,780 $6,862 $8,321 $11,504 Q1FY19 Q1FY20 Q1FY21 Invested assets Cash assets
18 Appendix
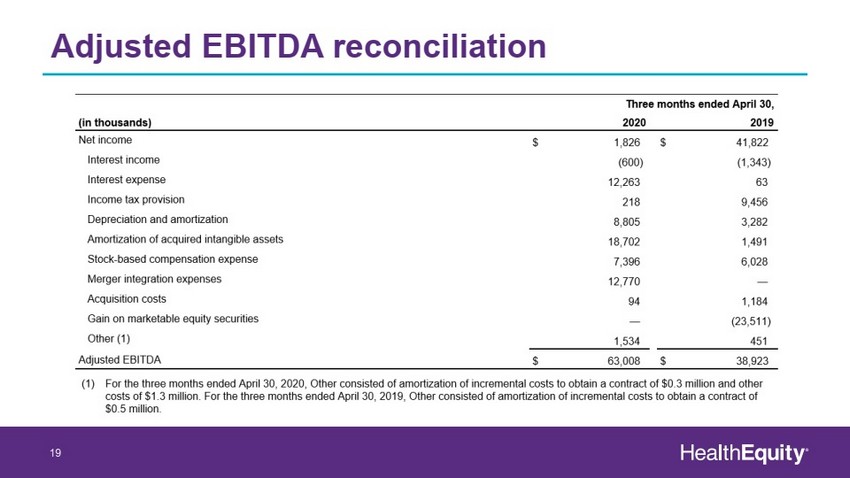
Adjusted EBITDA reconciliation 19