Attached files
| file | filename |
|---|---|
| EX-99.1 - EXHIBIT 99.1 - PRESS RELEASE - ASBURY AUTOMOTIVE GROUP INC | ex991pressrelease.htm |
| 8-K - 8-K - ASBURY AUTOMOTIVE GROUP INC | abg-20200706.htm |
Business Update and Acquisition of Park Place Dealerships July 6, 2020 1 © Asbury Automotive Group 2020. All rights reserved.
Forward Looking Statements To the extent that statements in this presentation are not recitations of historical fact, such statements constitute “forward-looking statements" as such term is defined in the Private Securities Litigation Reform Act of 1995. The forward-looking statements in this presentation may include statements relating to goals, plans, expectations, projections regarding the expected benefits of the proposed transaction, management’s plans, projections and objectives for future operations, scale and performance, integration plans and expected synergies therefrom, the timing of completion of the proposed transaction, our financial position, results of operations, market position, capital allocation strategy, business strategy and expectations of our management with respect to, among other things: changes in general economic and business conditions, including the impact of COVID-19 on the automotive industry in general, the automotive retail industry in particular and our customers, suppliers, vendors and business partners; our preliminary financial results for the period ending June 30, 2020; our relationships with vehicle manufacturers; our ability to improve our margins; operating cash flows and availability of capital; capital expenditures; the amount of our indebtedness; the completion of any pending and future acquisitions and divestitures; future return targets; future annual savings; general economic trends, including consumer confidence levels, interest rates, and fuel prices; and automotive retail industry trends. The following are some but not all of the factors that could cause actual results or events to differ materially from those anticipated, including: the occurrence of any event, change or other circumstances that could give rise to the termination of the asset purchase agreement; the risk that the necessary manufacturer approvals may not be obtained; the risk that the necessary regulatory approvals may not be obtained or may be obtained subject to conditions that are not anticipated; the risk that the proposed transaction will not be consummated in a timely manner; risks that any of the closing conditions to the proposed acquisition may not be satisfied or may not be satisfied in a timely manner; risks related to disruption of management time from ongoing business operations due to the proposed acquisition; failure to realize the benefits expected from the proposed acquisition; failure to promptly and effectively integrate the acquisition; and the effect of the announcement of the proposed acquisition on their operating results and businesses and on the ability of Asbury and Park Place Dealerships to retain and hire key personnel, maintain relationships with suppliers; our ability to execute our business strategy; our financial closing procedures for the three months ended June 30, 2020, which may cause final results upon completion of our closing procedures to vary from the preliminary estimates, which were prepared by the Company’s management, based upon a number of assumptions and additional items that would require material adjustments to the preliminary financial information may be identified; the annual rate of new vehicle sales in the U.S.; our ability to generate sufficient cash flows; our ability to improve our liquidity position; market factors and the future economic environment, including consumer confidence, interest rates, the price of oil and gasoline, the level of manufacturer incentives and the availability of consumer credit; the reputation and financial condition of vehicle manufacturers whose brands we represent and our relationships with such manufacturers, and their ability to design, manufacture, deliver and market their vehicles successfully; significant disruptions in the production and delivery of vehicles and parts for any reason, including COVID-19 and natural disasters, affecting the manufacturers whose brand we sell; our ability to enter into, maintain and/or renew our framework and dealership agreements on favorable terms; the inability of our dealership operations to perform at expected levels or achieve expected return targets; our ability to successfully integrate recent and future acquisitions; changes in, failure or inability to comply with, laws and regulations governing the operation of automobile franchises, accounting standards, the environment and taxation requirements; our ability to leverage gains from our dealership portfolio; high levels of competition in the automotive retailing industry which may create pricing pressures on the products and services we offer; our ability to minimize operating expenses or adjust our cost structure; our ability to execute our capital expenditure plans; our ability to capitalize on opportunities to repurchase our debt and equity securities; our ability to achieve estimated future savings from our various cost saving initiatives and strategies; our ability to comply with our debt or lease covenants and obtain waivers for the covenants as necessary; and any negative outcome from any future litigation. These risks, uncertainties and other factors are disclosed in Asbury’s Annual Report on Form 10-K, subsequent quarterly reports on Form 10-Q and other periodic and current reports filed with the Securities and Exchange Commission from time to time. These forward-looking statements and such risks, uncertainties and other factors speak only as of the date of this presentation. We expressly disclaim any obligation or undertaking to disseminate any updates or revisions to any forward-looking statement contained herein, whether as a result of new information, future events or otherwise. 2 © Asbury Automotive Group 2020. All rights reserved.
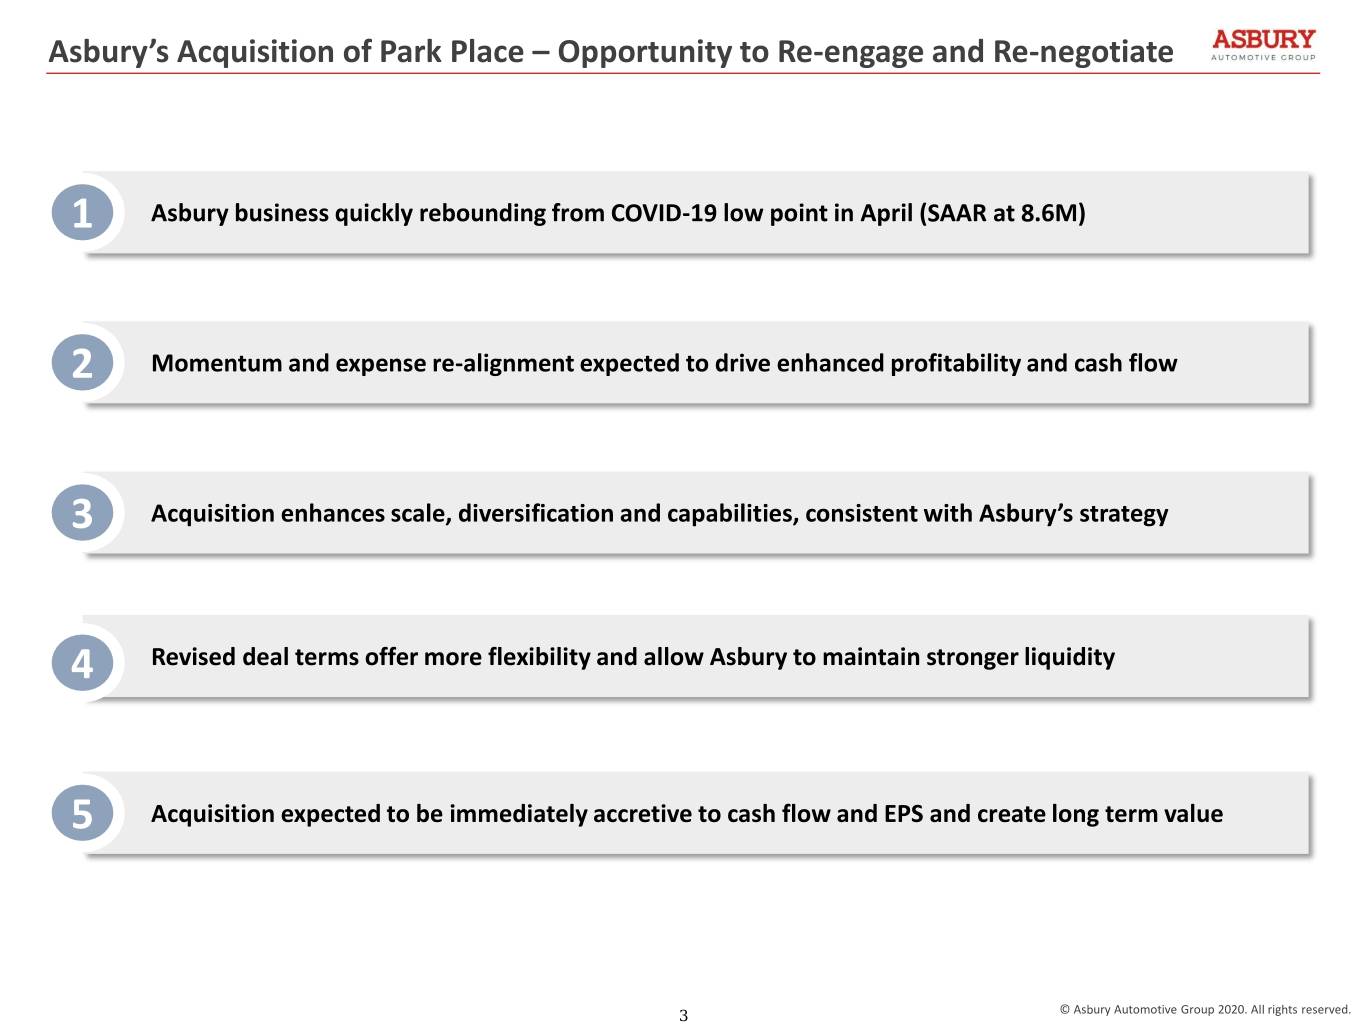
Asbury’s Acquisition of Park Place – Opportunity to Re-engage and Re-negotiate 1 Asbury business quickly rebounding from COVID-19 low point in April (SAAR at 8.6M) 2 Momentum and expense re-alignment expected to drive enhanced profitability and cash flow 3 Acquisition enhances scale, diversification and capabilities, consistent with Asbury’s strategy 4 Revised deal terms offer more flexibility and allow Asbury to maintain stronger liquidity 5 Acquisition expected to be immediately accretive to cash flow and EPS and create long term value 3 © Asbury Automotive Group 2020. All rights reserved.
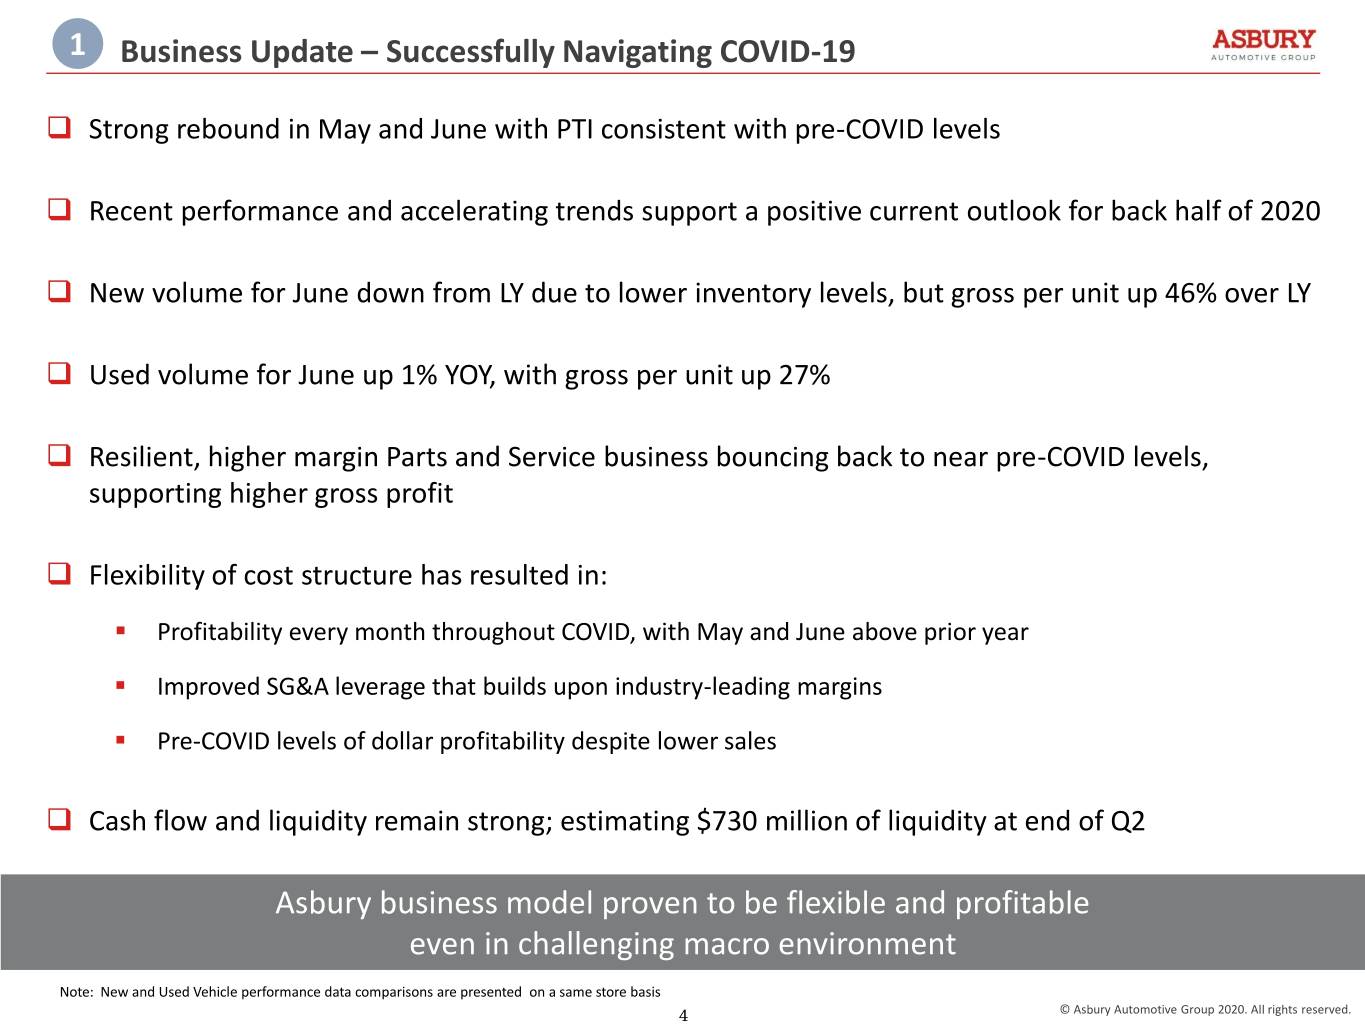
1 Business Update – Successfully Navigating COVID-19 Strong rebound in May and June with PTI consistent with pre-COVID levels Recent performance and accelerating trends support a positive current outlook for back half of 2020 New volume for June down from LY due to lower inventory levels, but gross per unit up 46% over LY Used volume for June up 1% YOY, with gross per unit up 27% Resilient, higher margin Parts and Service business bouncing back to near pre-COVID levels, supporting higher gross profit Flexibility of cost structure has resulted in: . Profitability every month throughout COVID, with May and June above prior year . Improved SG&A leverage that builds upon industry-leading margins . Pre-COVID levels of dollar profitability despite lower sales Cash flow and liquidity remain strong; estimating $730 million of liquidity at end of Q2 Asbury business model proven to be flexible and profitable even in challenging macro environment Note: New and Used Vehicle performance data comparisons are presented on a same store basis 4 © Asbury Automotive Group 2020. All rights reserved.
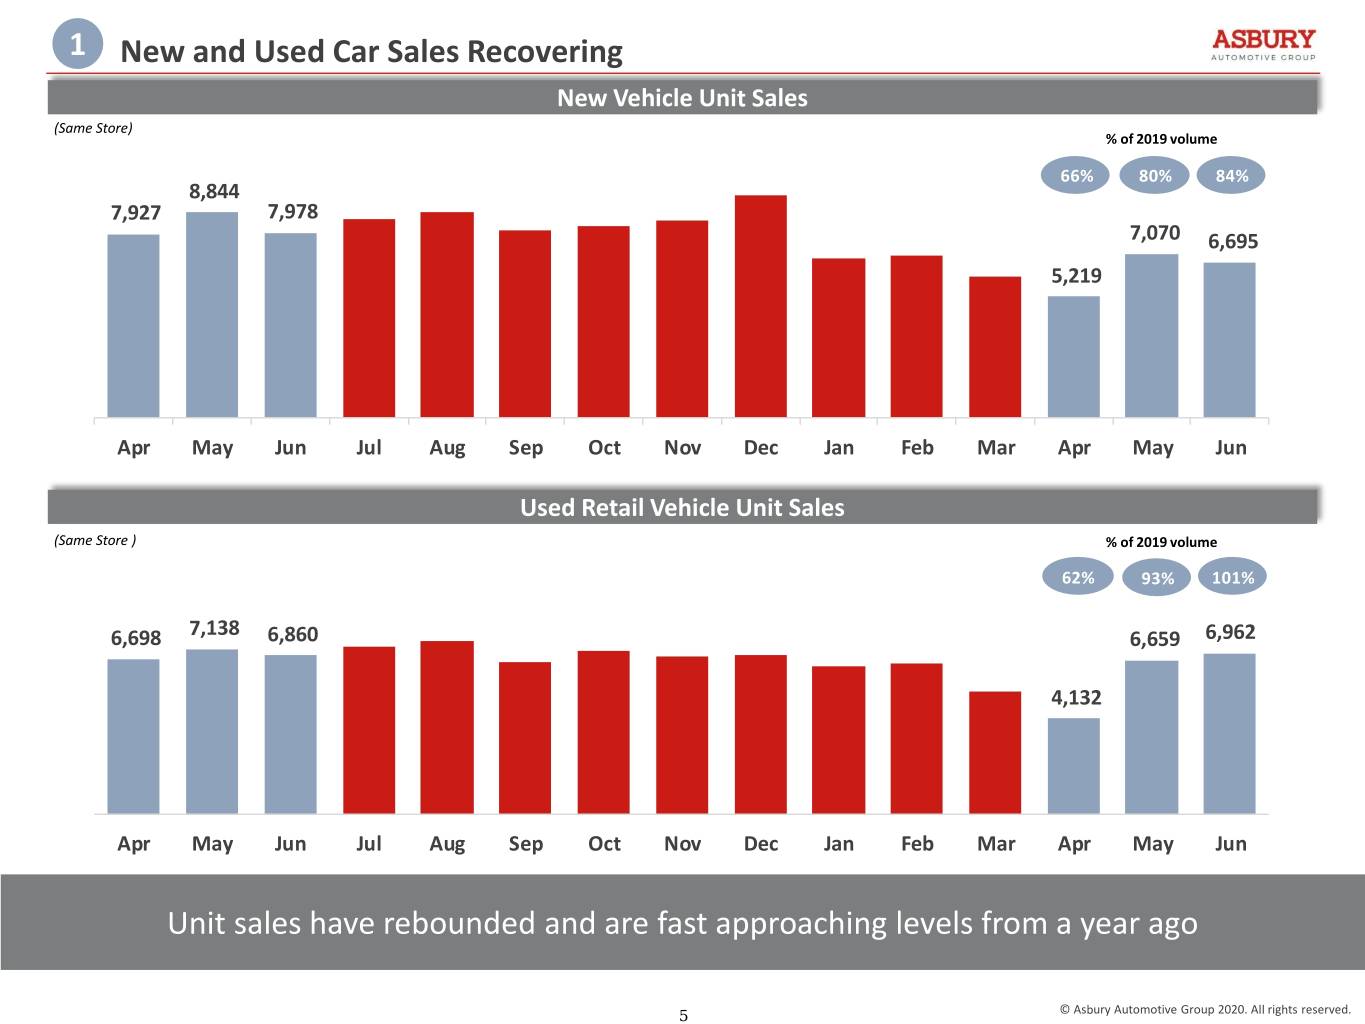
1 New and Used Car Sales Recovering New Vehicle Unit Sales (Same Store) % of 2019 volume 66% 80% 84% 8,844 7,927 7,978 7,070 6,695 5,219 Apr May Jun Jul Aug Sep Oct Nov Dec Jan Feb Mar Apr May Jun Used Retail Vehicle Unit Sales (Same Store ) % of 2019 volume 62% 93% 101% 6,698 7,138 6,860 6,659 6,962 4,132 Apr May Jun Jul Aug Sep Oct Nov Dec Jan Feb Mar Apr May Jun Unit sales have rebounded and are fast approaching levels from a year ago 5 © Asbury Automotive Group 2020. All rights reserved.
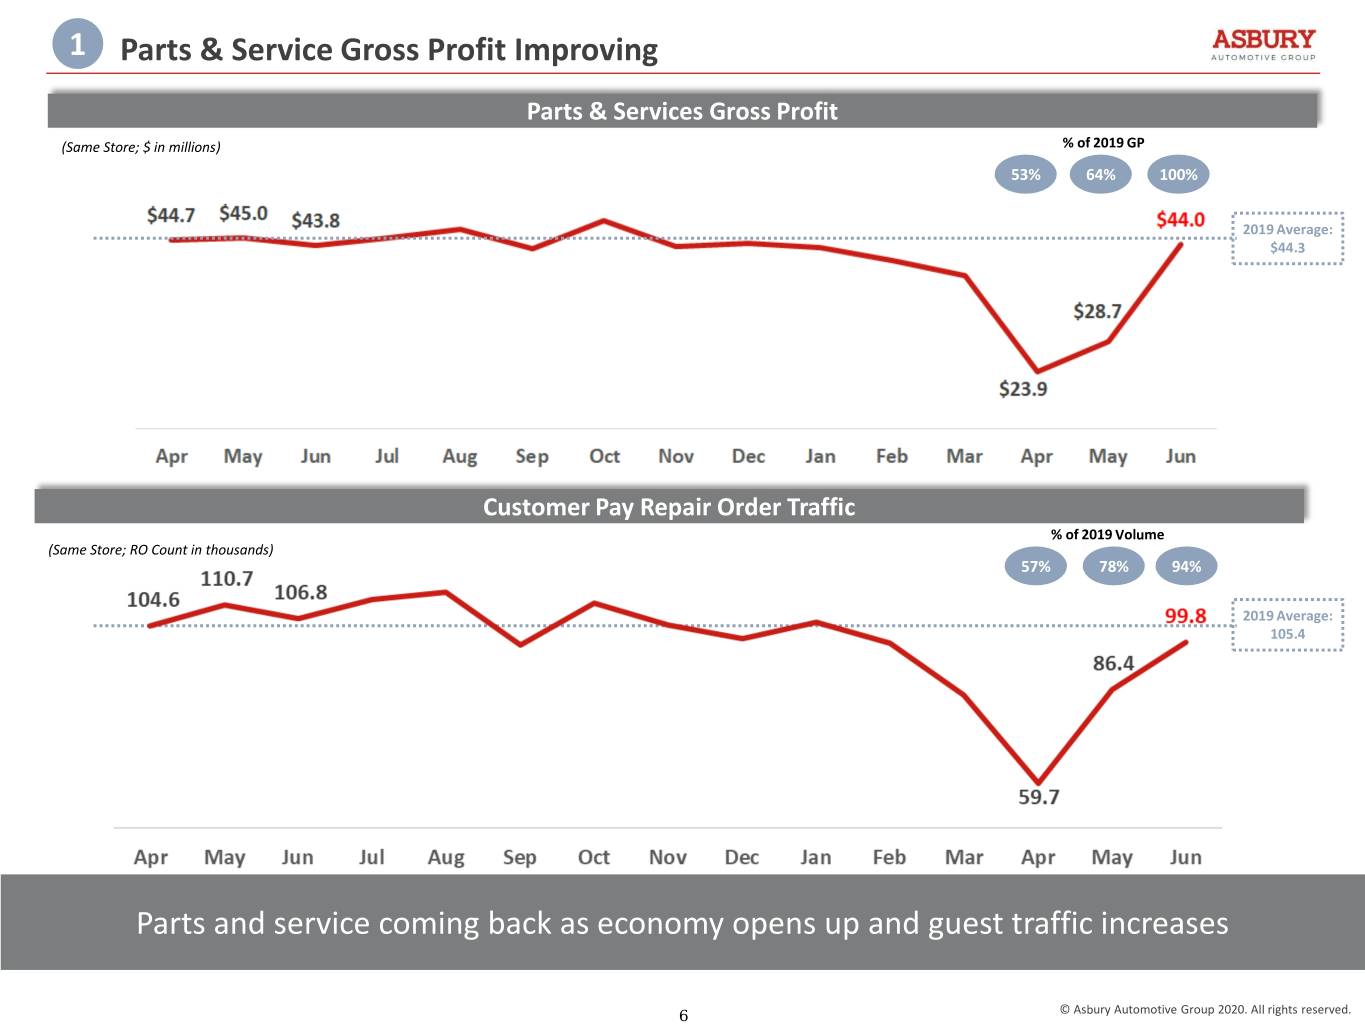
1 Parts & Service Gross Profit Improving Parts & Services Gross Profit (Same Store; $ in millions) % of 2019 GP 53% 64% 100% 2019 Average: $44.3 Customer Pay Repair Order Traffic % of 2019 Volume (Same Store; RO Count in thousands) 57% 78% 94% 2019 Average: 105.4 Parts and service coming back as economy opens up and guest traffic increases 6 © Asbury Automotive Group 2020. All rights reserved.
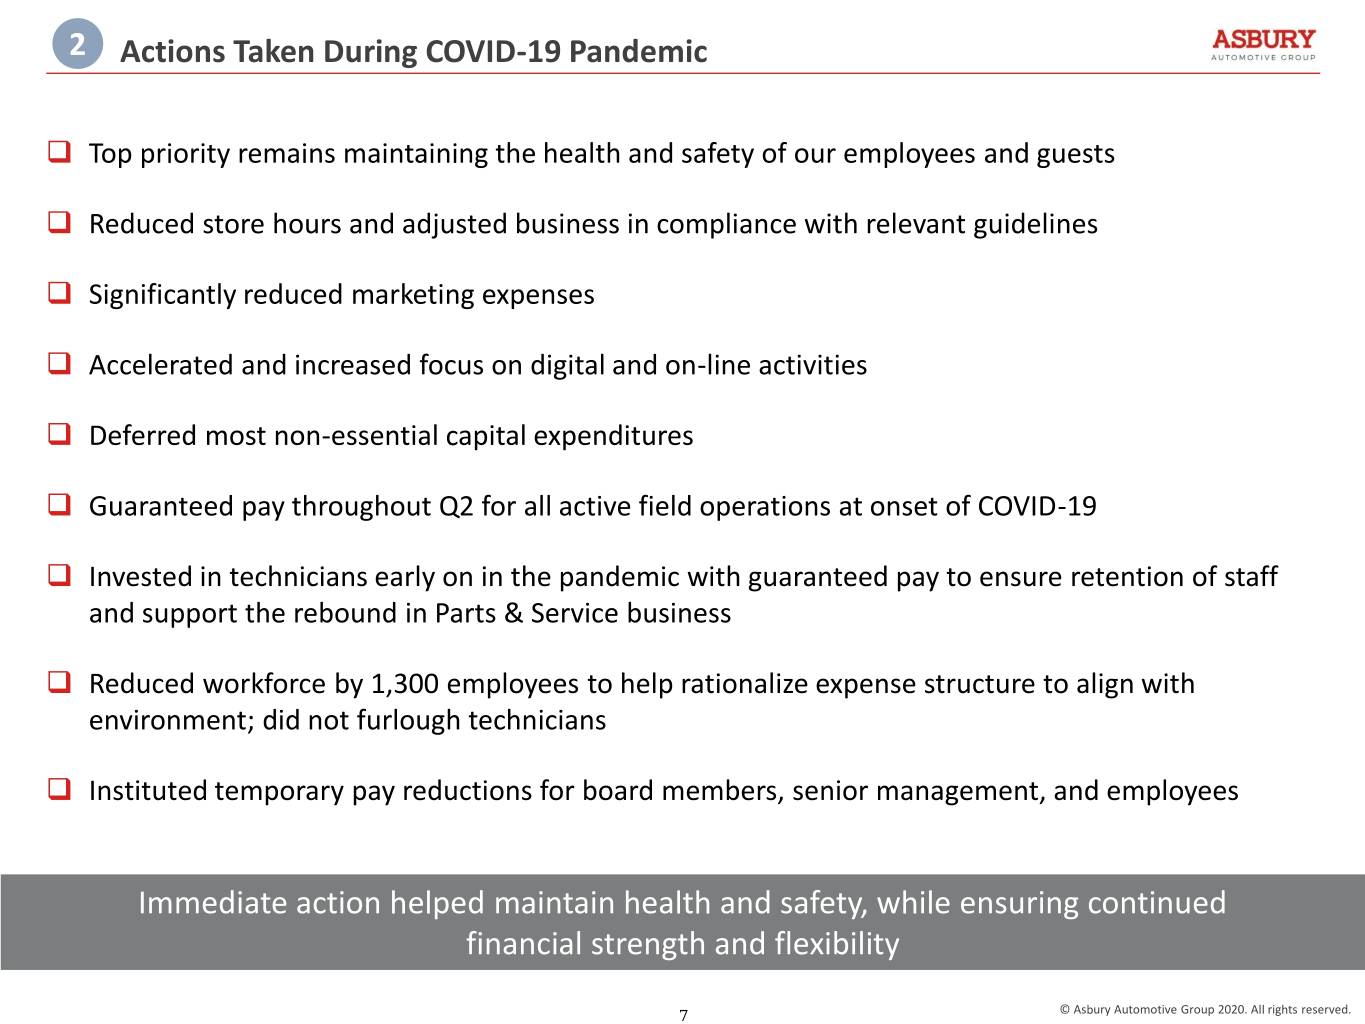
2 Actions Taken During COVID-19 Pandemic Top priority remains maintaining the health and safety of our employees and guests Reduced store hours and adjusted business in compliance with relevant guidelines Significantly reduced marketing expenses Accelerated and increased focus on digital and on-line activities Deferred most non-essential capital expenditures Guaranteed pay throughout Q2 for all active field operations at onset of COVID-19 Invested in technicians early on in the pandemic with guaranteed pay to ensure retention of staff and support the rebound in Parts & Service business Reduced workforce by 1,300 employees to help rationalize expense structure to align with environment; did not furlough technicians Instituted temporary pay reductions for board members, senior management, and employees Immediate action helped maintain health and safety, while ensuring continued financial strength and flexibility 7 © Asbury Automotive Group 2020. All rights reserved.
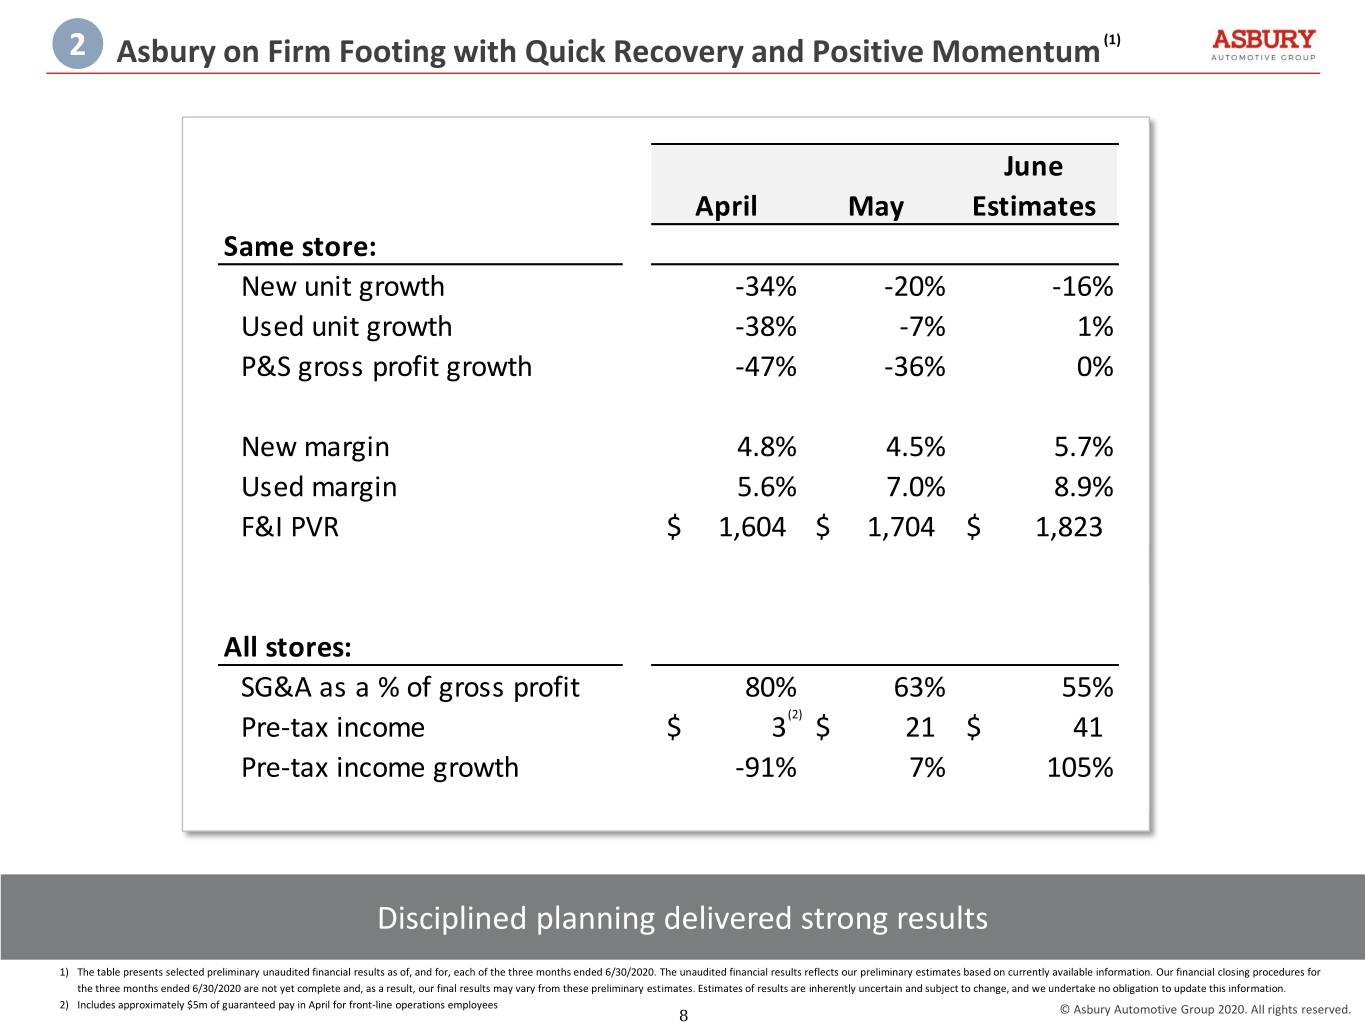
2 Asbury on Firm Footing with Quick Recovery and Positive Momentum (1) June April May Estimates Same store: New unit growth -34% -20% -16% Used unit growth -38% -7% 1% P&S gross profit growth -47% -36% 0% New margin 4.8% 4.5% 5.7% Used margin 5.6% 7.0% 8.9% F&I PVR $ 1,604 $ 1,704 $ 1,823 All stores: SG&A as a % of gross profit 80% 63% 55% Pre-tax income $ 3(2) $ 21 $ 41 Pre-tax income growth -91% 7% 105% Disciplined planning delivered strong results 1) The table presents selected preliminary unaudited financial results as of, and for, each of the three months ended 6/30/2020. The unaudited financial results reflects our preliminary estimates based on currently available information. Our financial closing procedures for the three months ended 6/30/2020 are not yet complete and, as a result, our final results may vary from these preliminary estimates. Estimates of results are inherently uncertain and subject to change, and we undertake no obligation to update this information. 2) Includes approximately $5m of guaranteed pay in April for front-line operations employees 8 © Asbury Automotive Group 2020. All rights reserved.
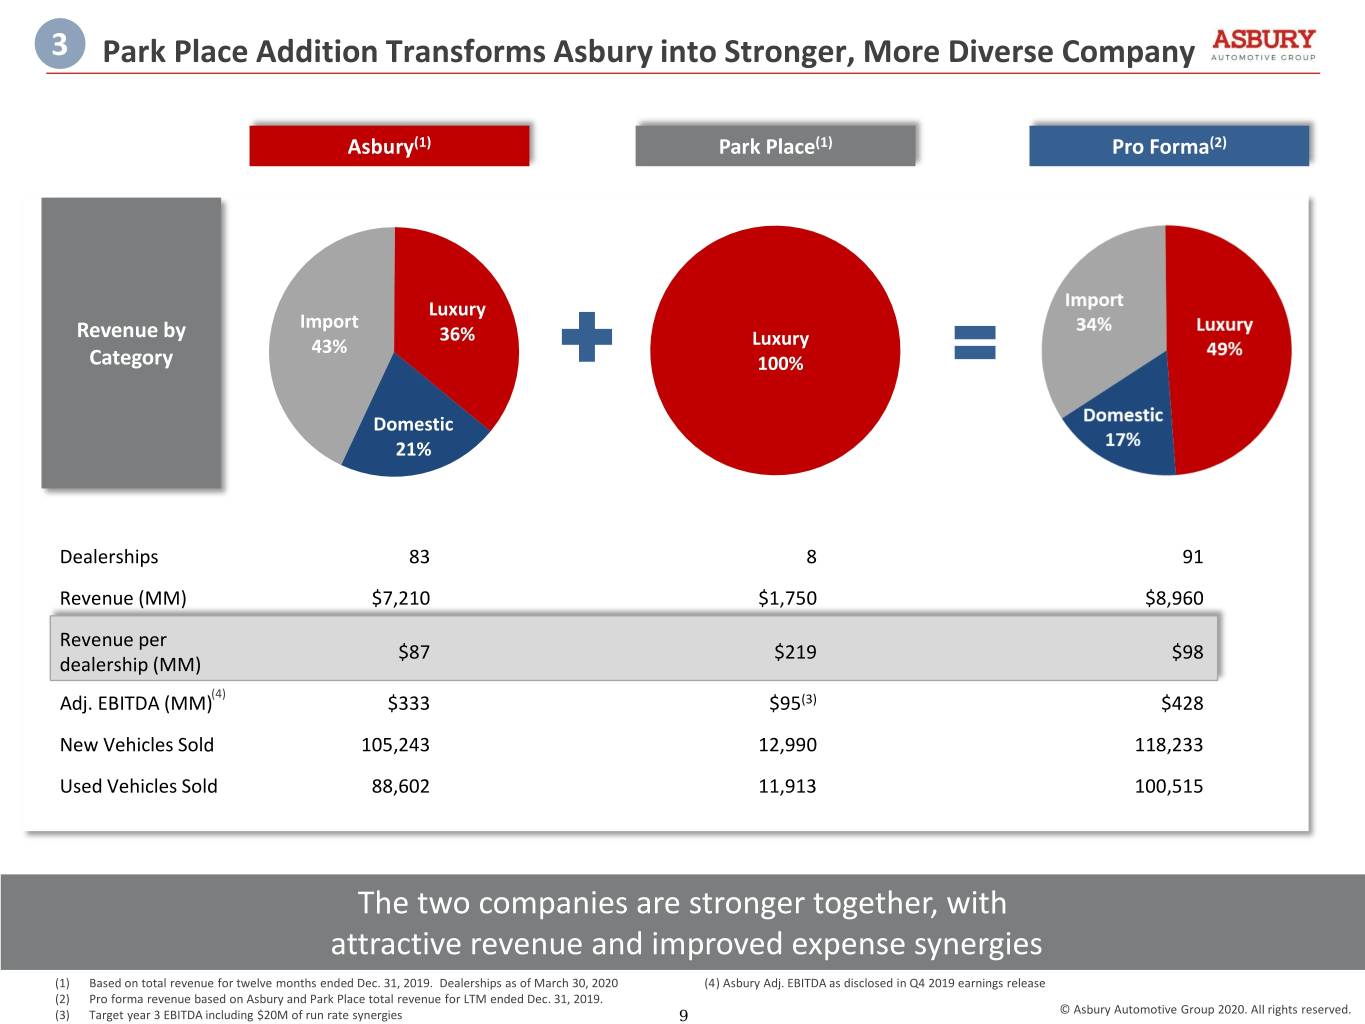
3 Park Place Addition Transforms Asbury into Stronger, More Diverse Company Asbury(1) Park Place(1) Pro Forma(2) Luxury Import Revenue by 36% 43% Luxury Category 100% Domestic 21% Dealerships 83 8 91 Revenue (MM) $7,210 $1,750 $8,960 Revenue per $87 $219 $98 dealership (MM) Adj. EBITDA (MM)(4) $333 $95(3) $428 New Vehicles Sold 105,243 12,990 118,233 Used Vehicles Sold 88,602 11,913 100,515 The two companies are stronger together, with attractive revenue and improved expense synergies (1) Based on total revenue for twelve months ended Dec. 31, 2019. Dealerships as of March 30, 2020 (4) Asbury Adj. EBITDA as disclosed in Q4 2019 earnings release (2) Pro forma revenue based on Asbury and Park Place total revenue for LTM ended Dec. 31, 2019. (3) Target year 3 EBITDA including $20M of run rate synergies 9 © Asbury Automotive Group 2020. All rights reserved.
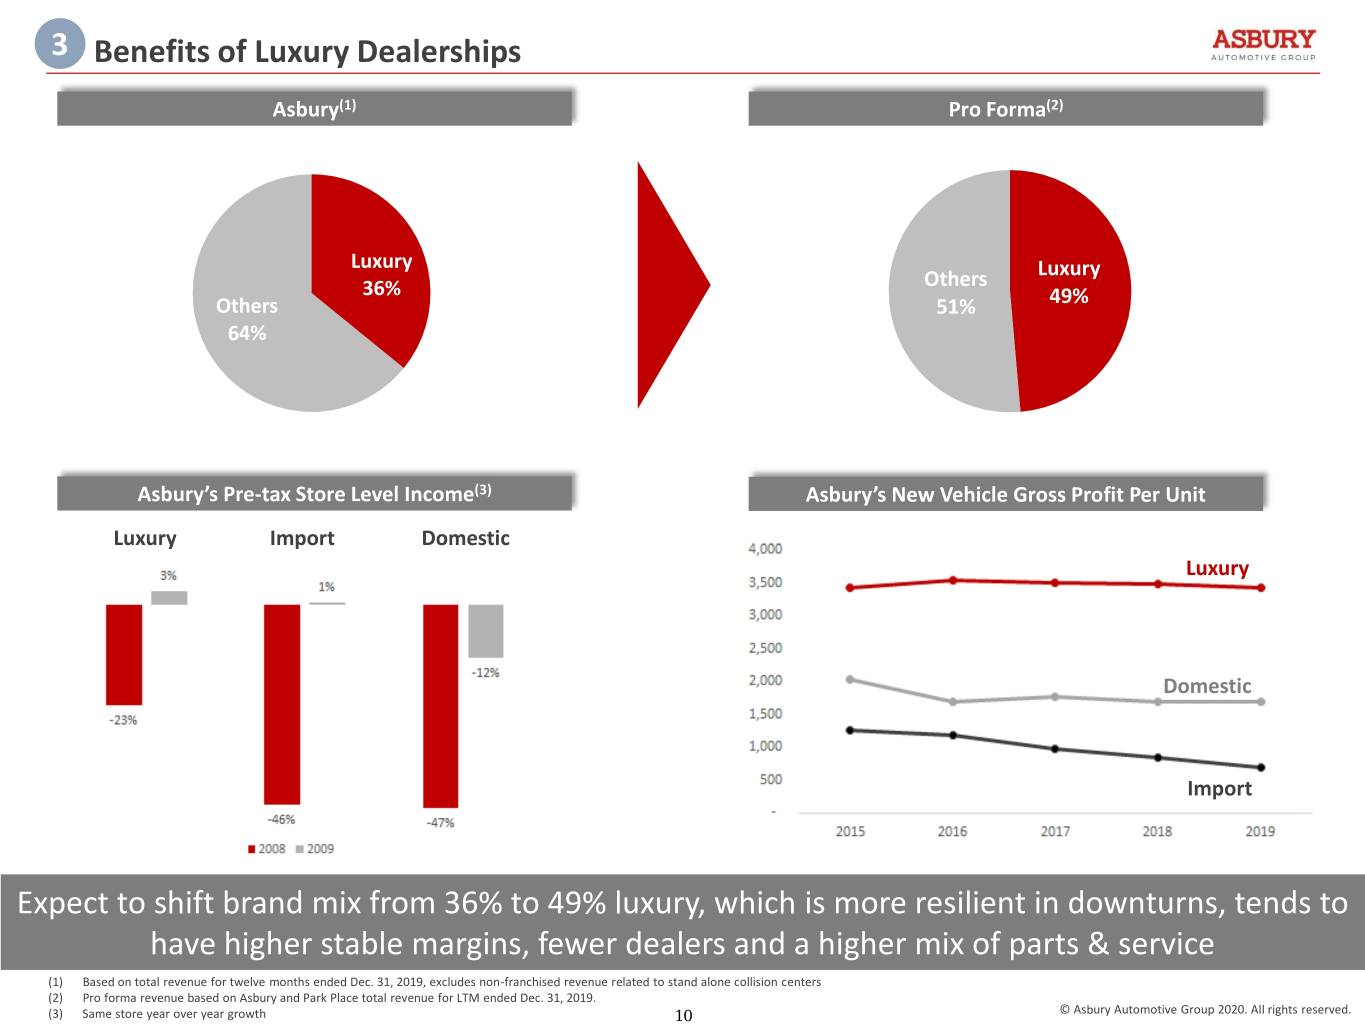
3 Benefits of Luxury Dealerships Asbury(1) Pro Forma(2) Luxury Luxury 36% Others Others 51% 49% 64% Asbury’s Pre-tax Store Level Income(3) Asbury’s New Vehicle Gross Profit Per Unit Luxury Import Domestic Luxury Domestic Import Expect to shift brand mix from 36% to 49% luxury, which is more resilient in downturns, tends to have higher stable margins, fewer dealers and a higher mix of parts & service (1) Based on total revenue for twelve months ended Dec. 31, 2019, excludes non-franchised revenue related to stand alone collision centers (2) Pro forma revenue based on Asbury and Park Place total revenue for LTM ended Dec. 31, 2019. (3) Same store year over year growth 10 © Asbury Automotive Group 2020. All rights reserved.
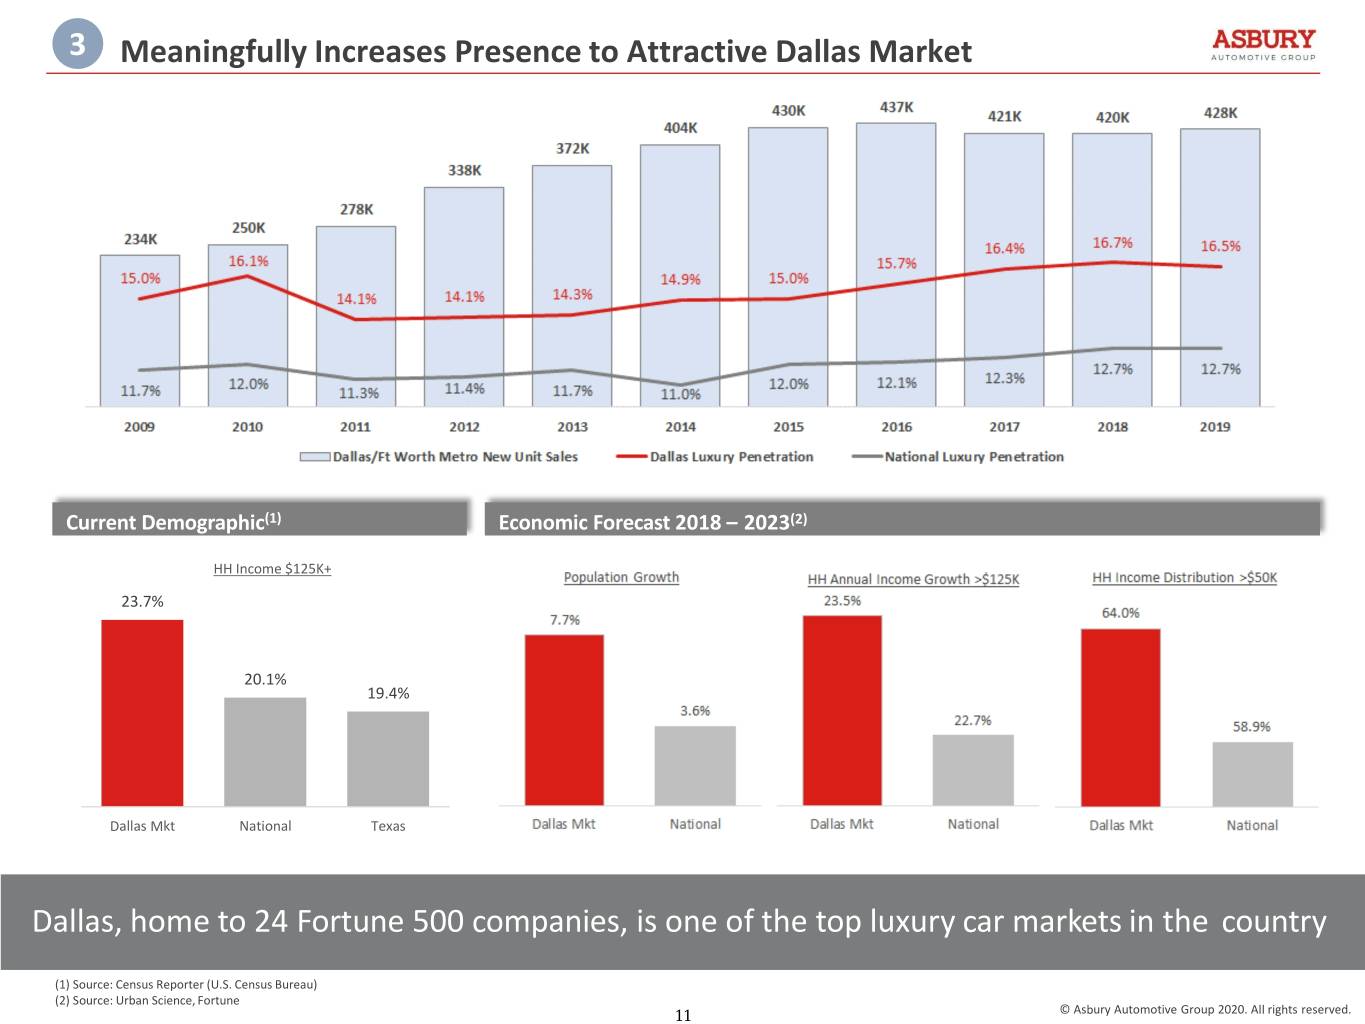
3 Meaningfully Increases Presence to Attractive Dallas Market Current Demographic(1) Economic Forecast 2018 – 2023(2) HH Income $125K+ 23.7% 20.1% 19.4% Dallas Mkt National Texas Dallas, home to 24 Fortune 500 companies, is one of the top luxury car markets in the country (1) Source: Census Reporter (U.S. Census Bureau) (2) Source: Urban Science, Fortune 11 © Asbury Automotive Group 2020. All rights reserved.
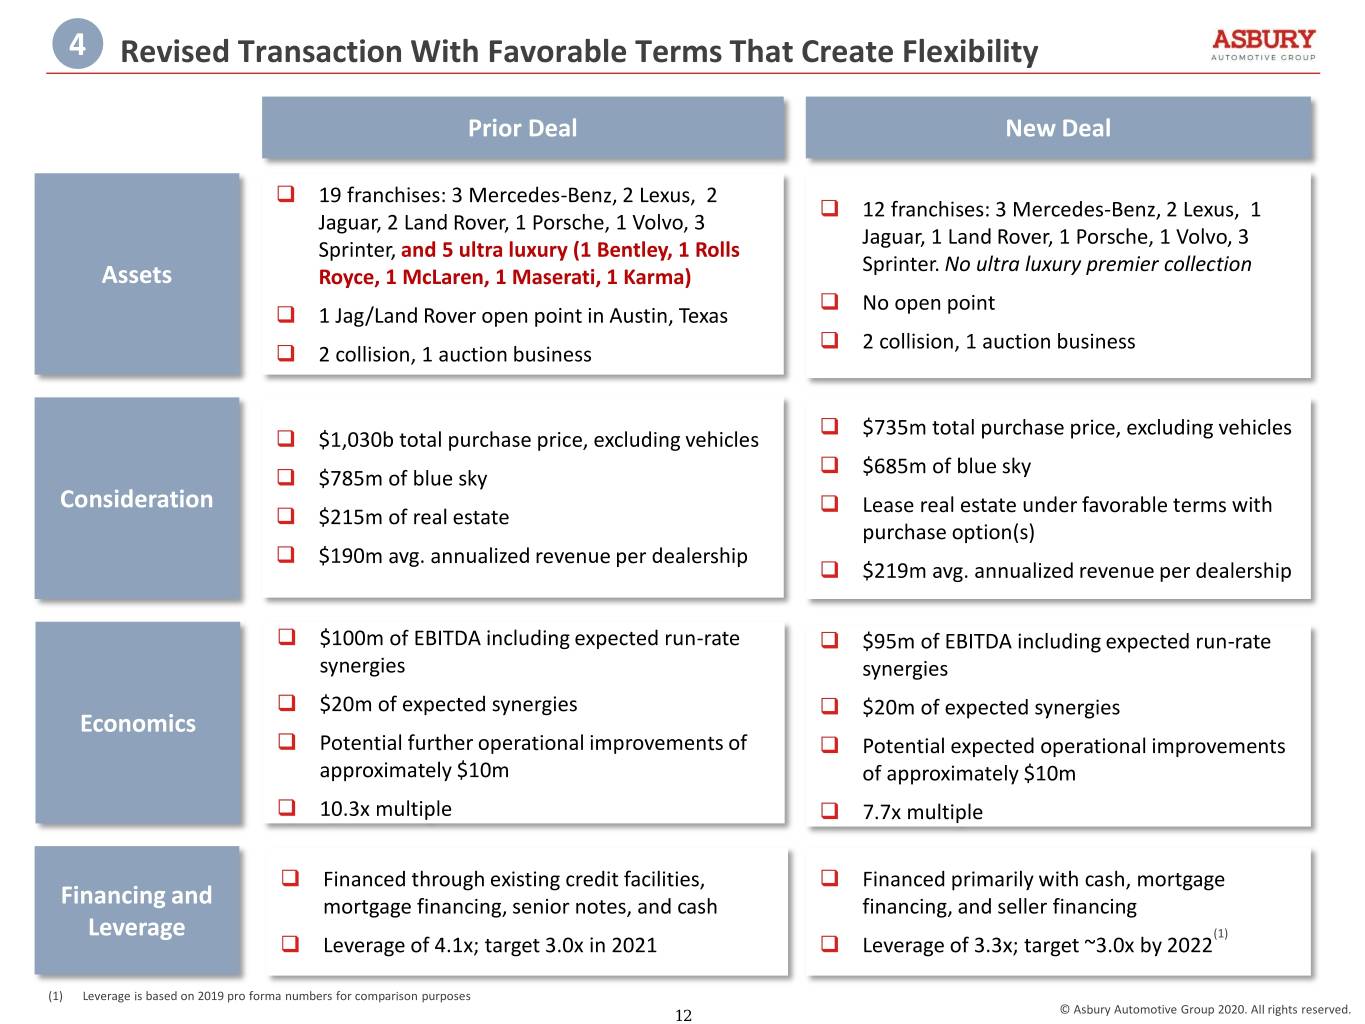
4 Revised Transaction With Favorable Terms That Create Flexibility Prior Deal New Deal 19 franchises: 3 Mercedes-Benz, 2 Lexus, 2 12 franchises: 3 Mercedes-Benz, 2 Lexus, 1 Jaguar, 2 Land Rover, 1 Porsche, 1 Volvo, 3 Jaguar, 1 Land Rover, 1 Porsche, 1 Volvo, 3 Sprinter, and 5 ultra luxury (1 Bentley, 1 Rolls Sprinter. No ultra luxury premier collection Assets Royce, 1 McLaren, 1 Maserati, 1 Karma) No open point 1 Jag/Land Rover open point in Austin, Texas 2 collision, 1 auction business 2 collision, 1 auction business $735m total purchase price, excluding vehicles $1,030b total purchase price, excluding vehicles $685m of blue sky $785m of blue sky Consideration Lease real estate under favorable terms with $215m of real estate purchase option(s) $190m avg. annualized revenue per dealership $219m avg. annualized revenue per dealership $100m of EBITDA including expected run-rate $95m of EBITDA including expected run-rate synergies synergies $20m of expected synergies $20m of expected synergies Economics Potential further operational improvements of Potential expected operational improvements approximately $10m of approximately $10m 10.3x multiple 7.7x multiple Financed through existing credit facilities, Financed primarily with cash, mortgage Financing and mortgage financing, senior notes, and cash financing, and seller financing Leverage (1) Leverage of 4.1x; target 3.0x in 2021 Leverage of 3.3x; target ~3.0x by 2022 (1) Leverage is based on 2019 pro forma numbers for comparison purposes 12 © Asbury Automotive Group 2020. All rights reserved.
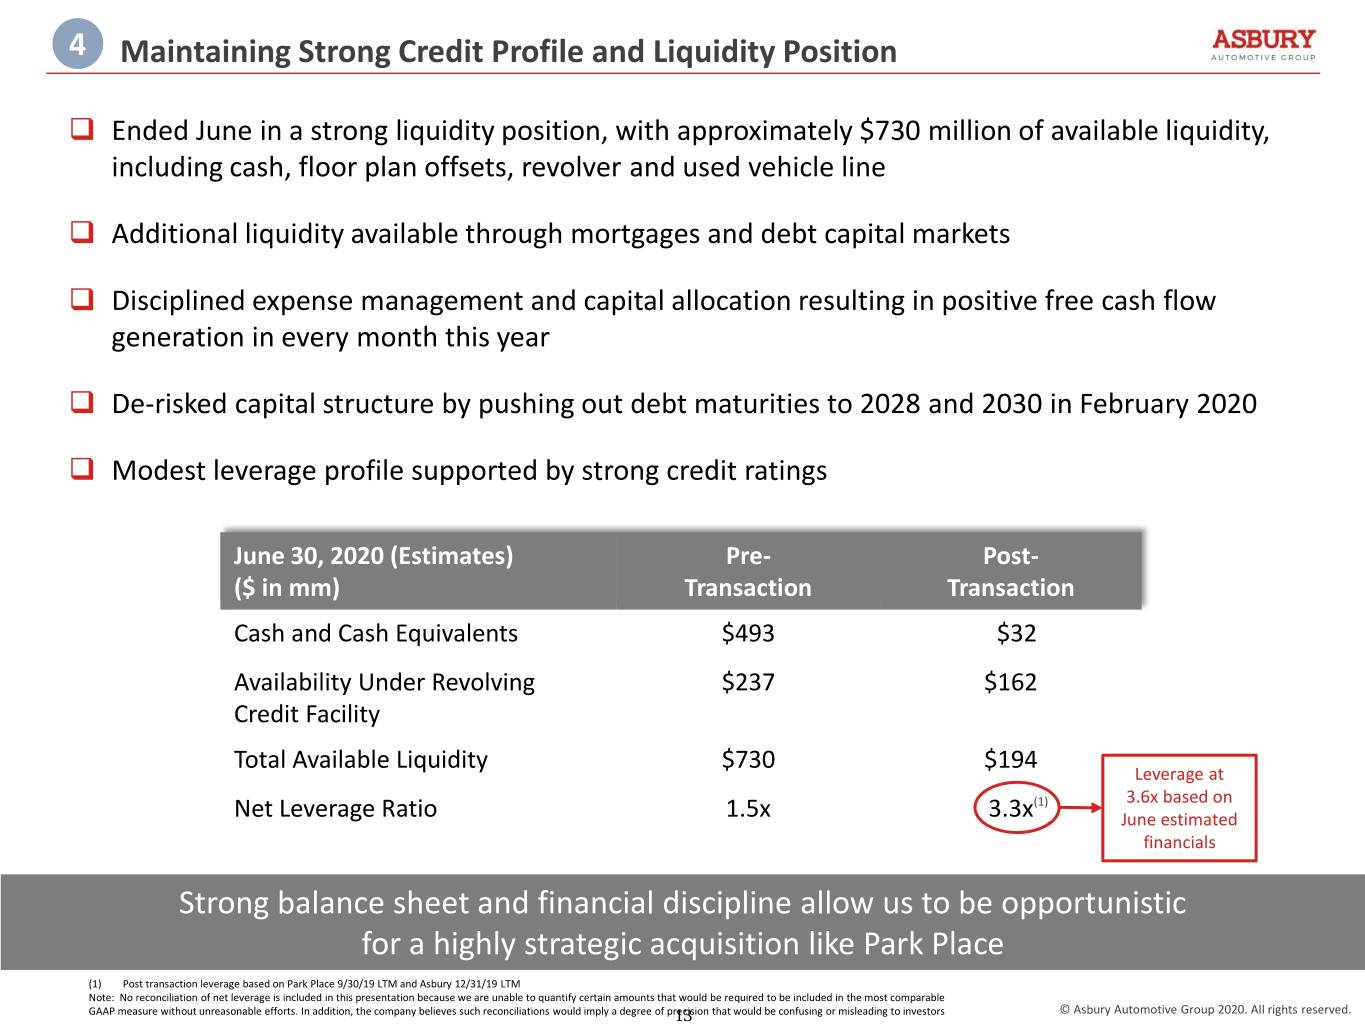
4 Maintaining Strong Credit Profile and Liquidity Position Ended June in a strong liquidity position, with approximately $730 million of available liquidity, including cash, floor plan offsets, revolver and used vehicle line Additional liquidity available through mortgages and debt capital markets Disciplined expense management and capital allocation resulting in positive free cash flow generation in every month this year De-risked capital structure by pushing out debt maturities to 2028 and 2030 in February 2020 Modest leverage profile supported by strong credit ratings June 30, 2020 (Estimates) Pre- Post- ($ in mm) Transaction Transaction Cash and Cash Equivalents $493 $32 Availability Under Revolving $237 $162 Credit Facility Total Available Liquidity $730 $194 Leverage at (1) 3.6x based on Net Leverage Ratio 1.5x 3.3x June estimated financials Strong balance sheet and financial discipline allow us to be opportunistic for a highly strategic acquisition like Park Place (1) Post transaction leverage based on Park Place 9/30/19 LTM and Asbury 12/31/19 LTM Note: No reconciliation of net leverage is included in this presentation because we are unable to quantify certain amounts that would be required to be included in the most comparable GAAP measure without unreasonable efforts. In addition, the company believes such reconciliations would imply a degree of pre13cision that would be confusing or misleading to investors © Asbury Automotive Group 2020. All rights reserved.
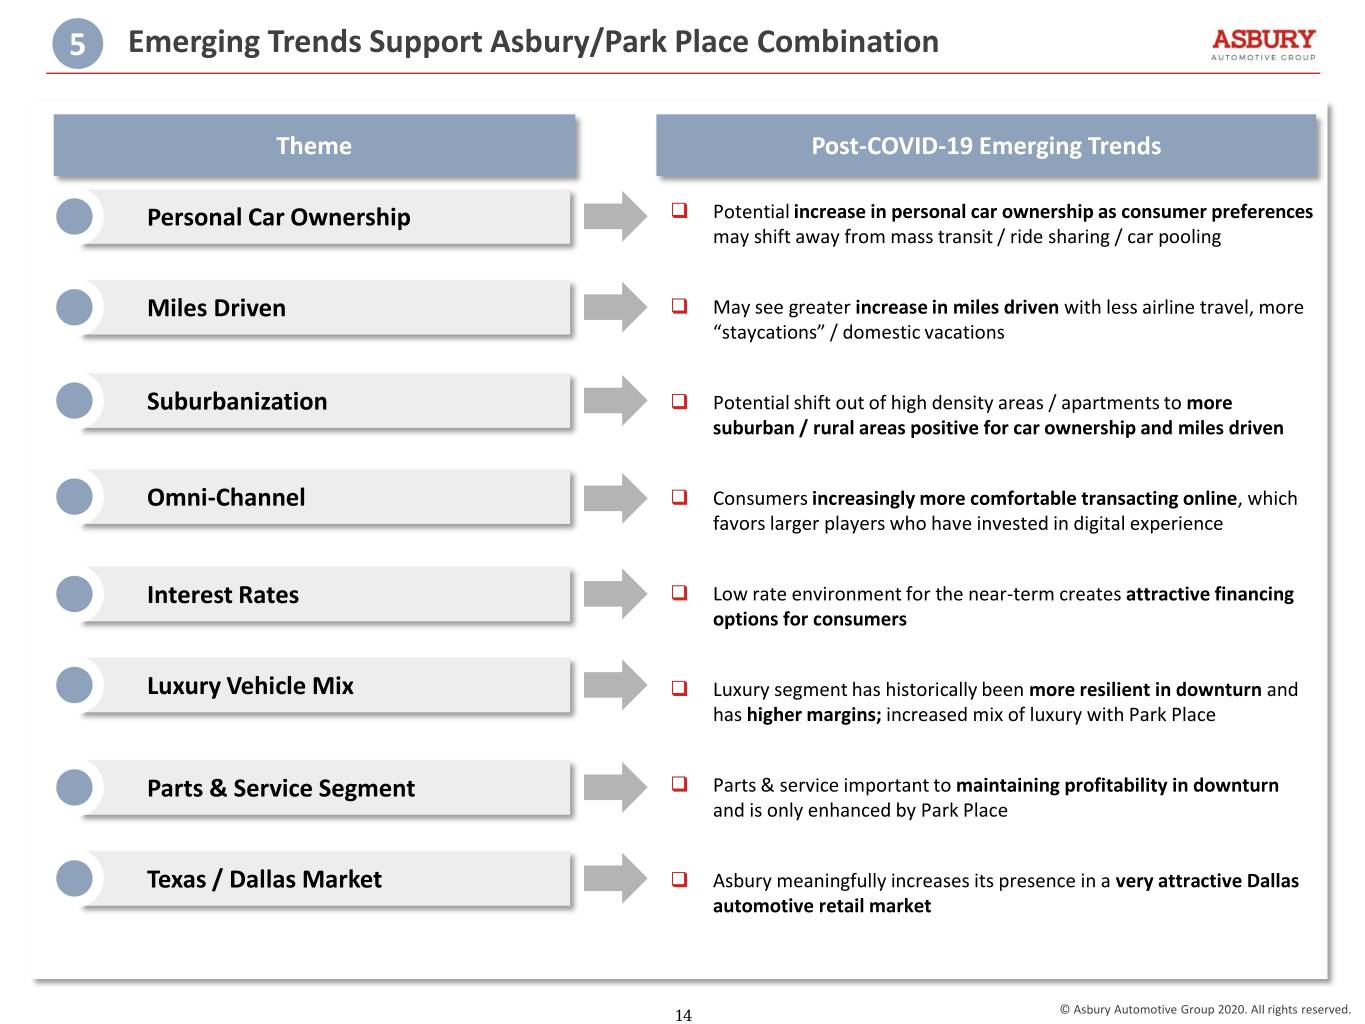
5 Emerging Trends Support Asbury/Park Place Combination Theme Post-COVID-19 Emerging Trends Personal Car Ownership Potential increase in personal car ownership as consumer preferences may shift away from mass transit / ride sharing / car pooling Miles Driven May see greater increase in miles driven with less airline travel, more “staycations” / domestic vacations Suburbanization Potential shift out of high density areas / apartments to more suburban / rural areas positive for car ownership and miles driven Omni-Channel Consumers increasingly more comfortable transacting online, which favors larger players who have invested in digital experience Interest Rates Low rate environment for the near-term creates attractive financing options for consumers Luxury Vehicle Mix Luxury segment has historically been more resilient in downturn and has higher margins; increased mix of luxury with Park Place Parts & Service Segment Parts & service important to maintaining profitability in downturn and is only enhanced by Park Place Texas / Dallas Market Asbury meaningfully increases its presence in a very attractive Dallas automotive retail market 14 © Asbury Automotive Group 2020. All rights reserved.
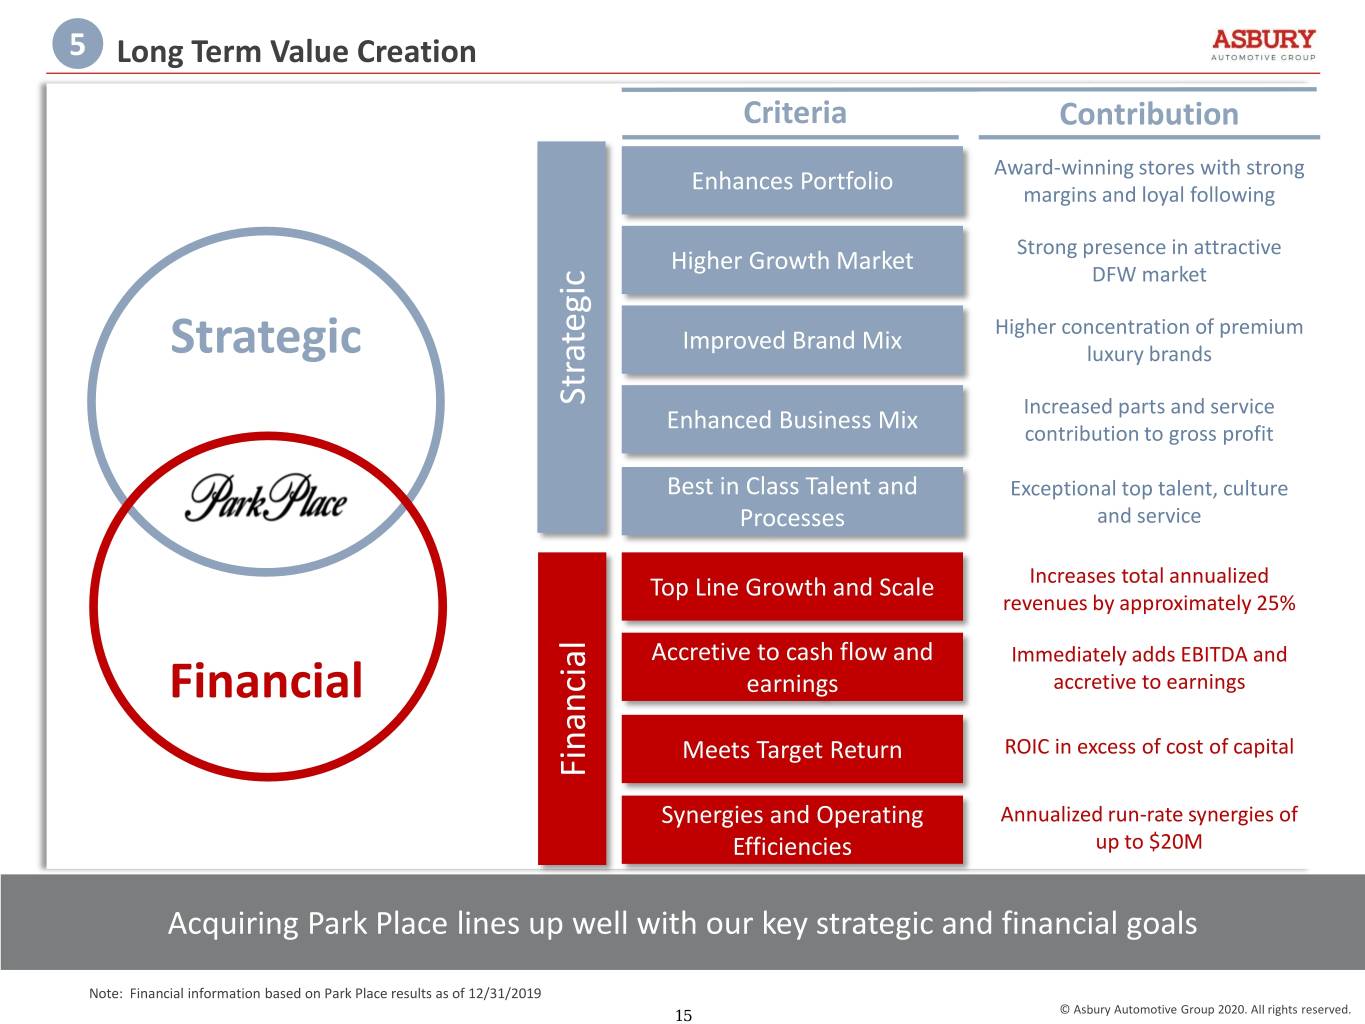
5 Long Term Value Creation Criteria Contribution Award-winning stores with strong Enhances Portfolio margins and loyal following Strong presence in attractive Higher Growth Market DFW market Higher concentration of premium Improved Brand Mix Strategic luxury brands Strategic Increased parts and service Enhanced Business Mix contribution to gross profit Best in Class Talent and Exceptional top talent, culture Processes and service Top Line Growth and Scale Increases total annualized revenues by approximately 25% Accretive to cash flow and Immediately adds EBITDA and Financial earnings accretive to earnings Meets Target Return ROIC in excess of cost of capital Financial Synergies and Operating Annualized run-rate synergies of Efficiencies up to $20M Acquiring Park Place lines up well with our key strategic and financial goals Note: Financial information based on Park Place results as of 12/31/2019 15 © Asbury Automotive Group 2020. All rights reserved.
Appendix 16 © Asbury Automotive Group 2020. All rights reserved.
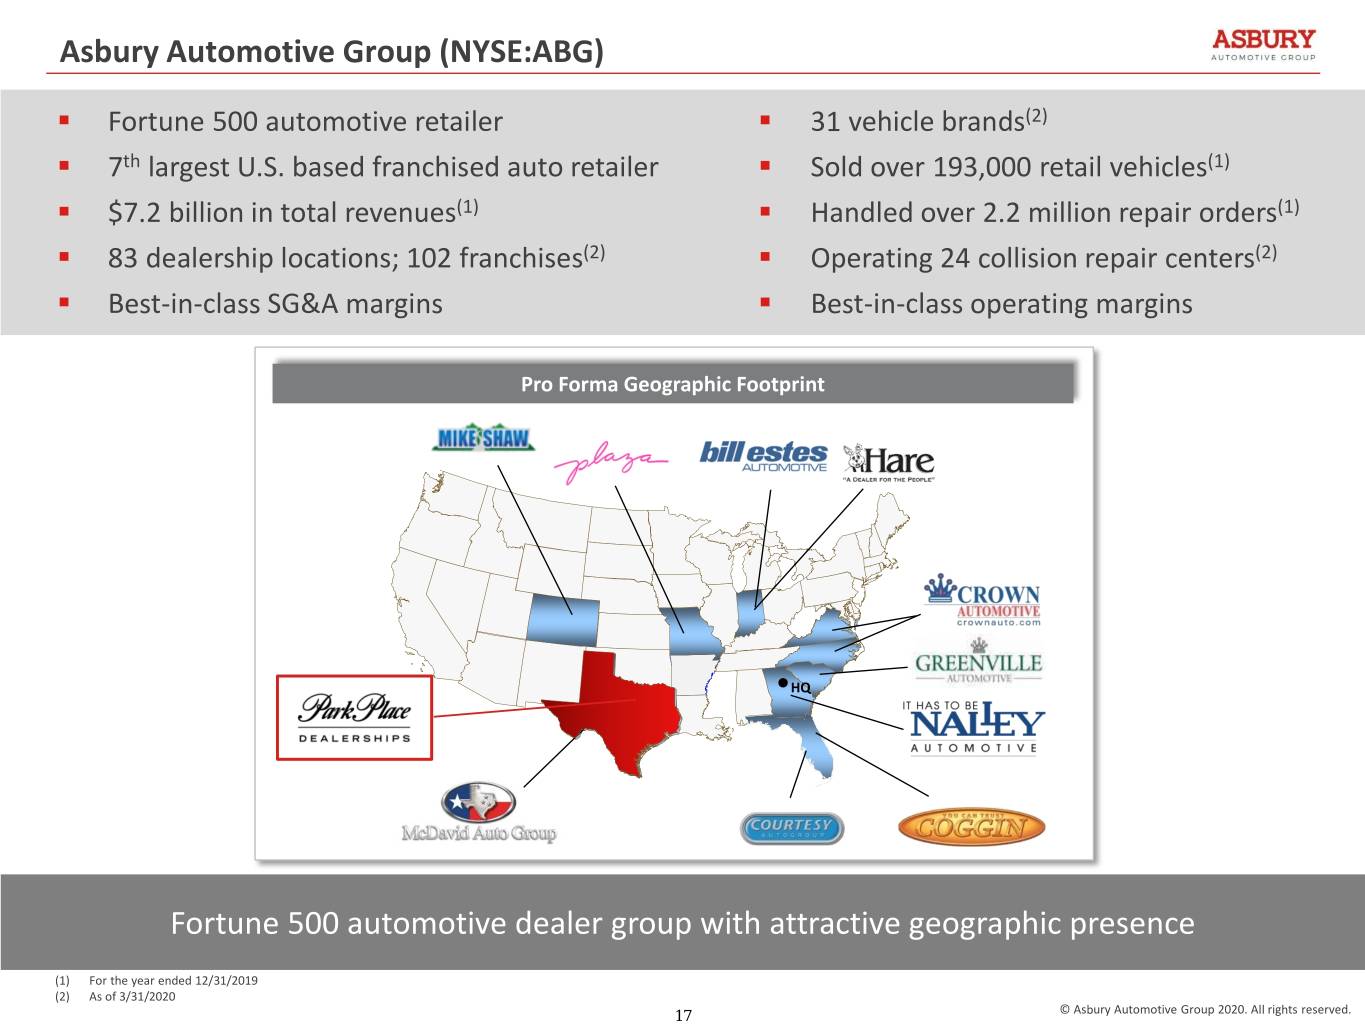
Asbury Automotive Group (NYSE:ABG) . Fortune 500 automotive retailer . 31 vehicle brands(2) . 7th largest U.S. based franchised auto retailer . Sold over 193,000 retail vehicles(1) . $7.2 billion in total revenues(1) . Handled over 2.2 million repair orders(1) . 83 dealership locations; 102 franchises(2) . Operating 24 collision repair centers(2) . Best-in-class SG&A margins . Best-in-class operating margins Pro Forma Geographic Footprint •HQ Fortune 500 automotive dealer group with attractive geographic presence (1) For the year ended 12/31/2019 (2) As of 3/31/2020 17 © Asbury Automotive Group 2020. All rights reserved.
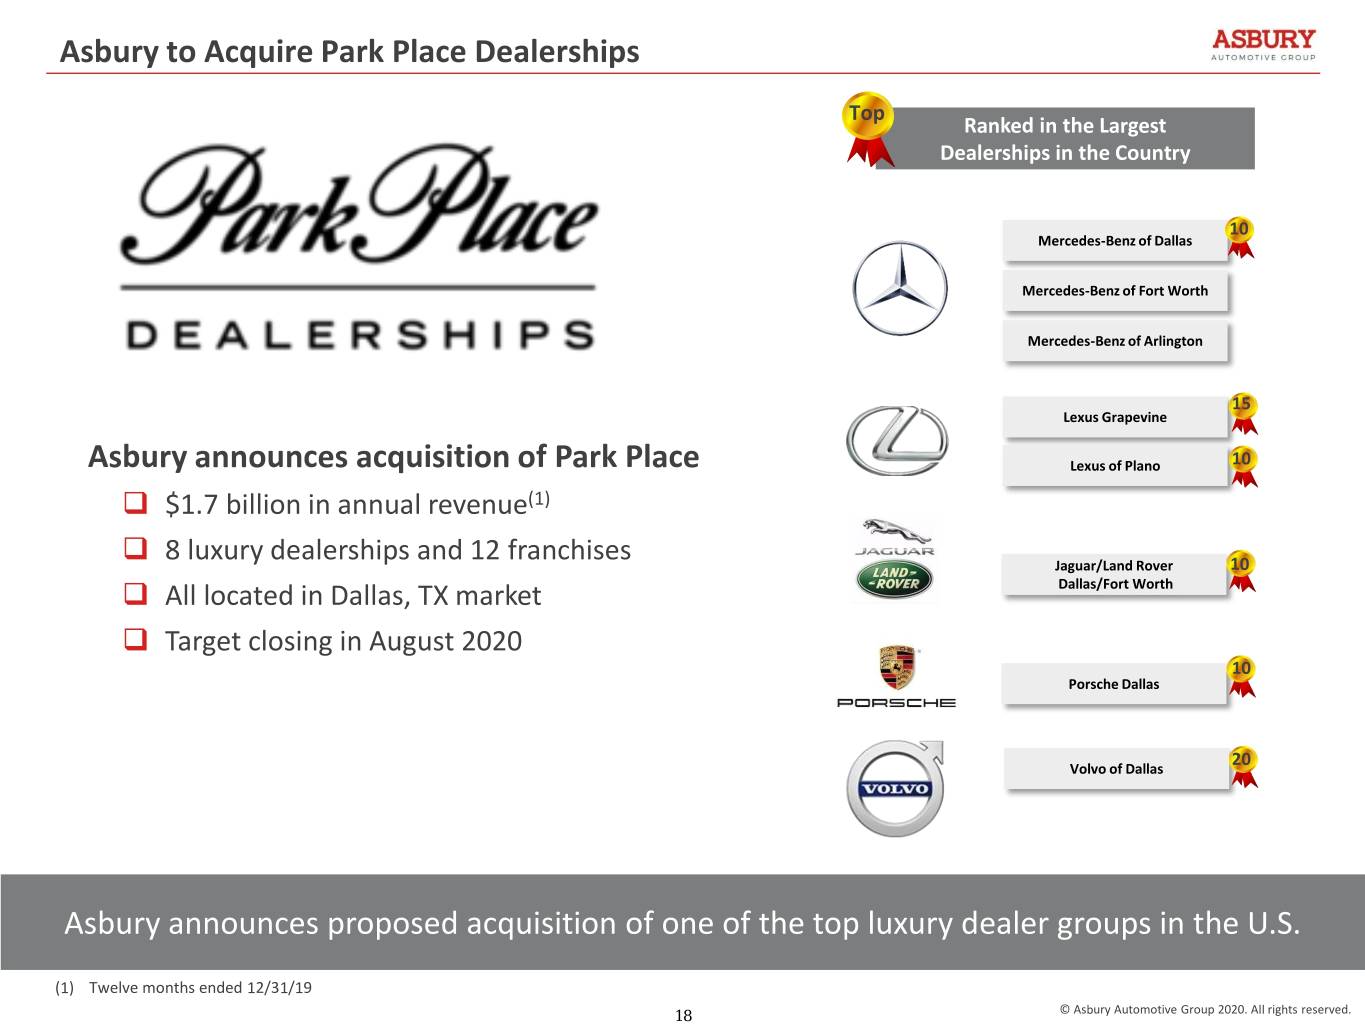
Asbury to Acquire Park Place Dealerships Top Ranked in the Largest Dealerships in the Country 10 Mercedes-Benz of Dallas Mercedes-Benz of Fort Worth Mercedes-Benz of Arlington 15 Lexus Grapevine Asbury announces acquisition of Park Place Lexus of Plano 10 $1.7 billion in annual revenue(1) 8 luxury dealerships and 12 franchises Jaguar/Land Rover 10 All located in Dallas, TX market Dallas/Fort Worth Target closing in August 2020 10 Porsche Dallas 20 Volvo of Dallas Asbury announces proposed acquisition of one of the top luxury dealer groups in the U.S. (1) Twelve months ended 12/31/19 18 © Asbury Automotive Group 2020. All rights reserved.
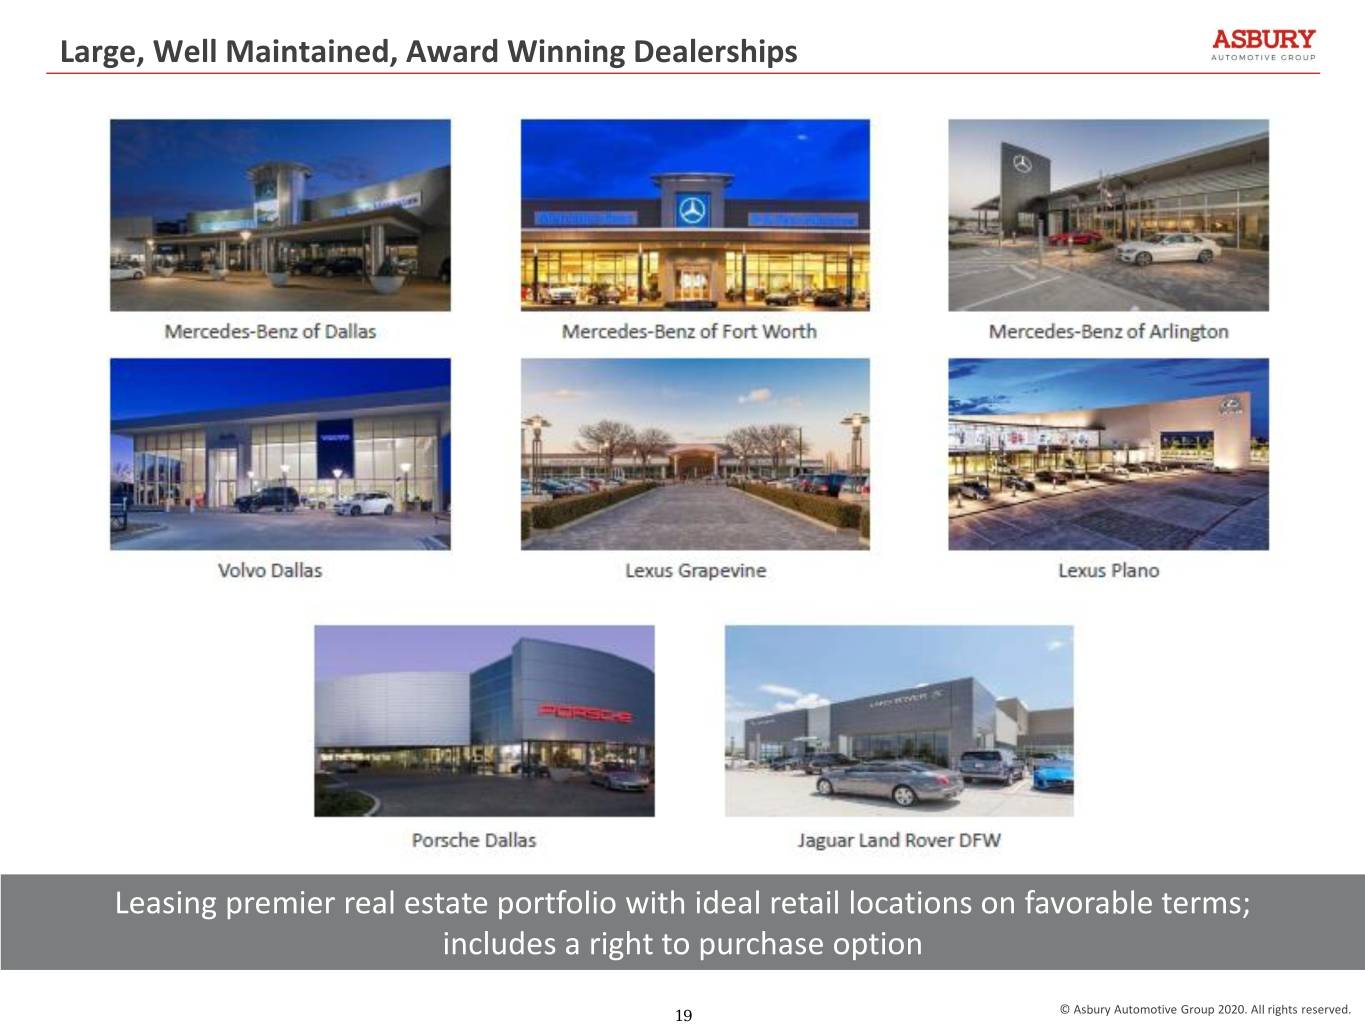
Large, Well Maintained, Award Winning Dealerships Leasing premier real estate portfolio with ideal retail locations on favorable terms; includes a right to purchase option 19 © Asbury Automotive Group 2020. All rights reserved.
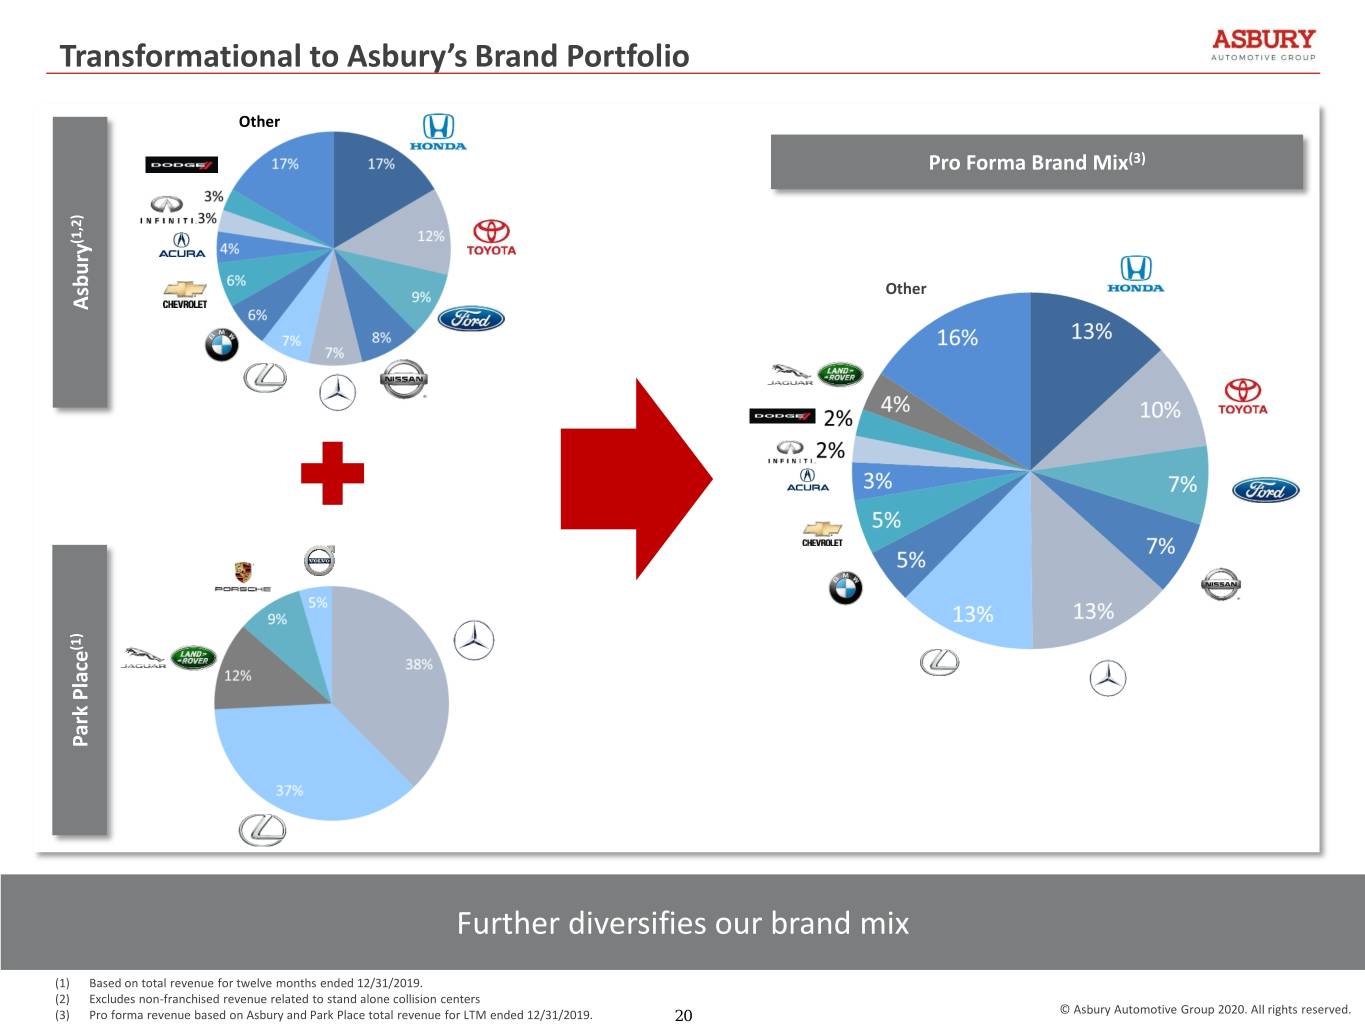
Transformational to Asbury’s Brand Portfolio Other Pro Forma Brand Mix(3) (1,2) Other Asbury (1) Park Place Park Further diversifies our brand mix (1) Based on total revenue for twelve months ended 12/31/2019. (2) Excludes non-franchised revenue related to stand alone collision centers (3) Pro forma revenue based on Asbury and Park Place total revenue for LTM ended 12/31/2019. 20 © Asbury Automotive Group 2020. All rights reserved.
