Attached files
| file | filename |
|---|---|
| EX-99.2 - EX-99.2 - II-VI INC | d53753dex992.htm |
| EX-23.1 - EX-23.1 - II-VI INC | d53753dex231.htm |
| 8-K - 8-K - II-VI INC | d53753d8k.htm |
Exhibit 99.1
PART I
| Item 1. | BUSINESS |
Definitions
II-VI Incorporated (“II-VI,” the “Company,” “we,” “us,” or “our”) was incorporated in Pennsylvania in 1971. Our headquarters are located at 375 Saxonburg Boulevard, Saxonburg, Pennsylvania 16056. Our telephone number is 724-352-4455. Reference to “II-VI,” the “Company,” “we,” “us,” or “our” in this Exhibit 99.1 to our Current Report on Form 8-K, unless the context requires otherwise, refers to II-VI Incorporated and its wholly owned subsidiaries. The Company’s name is pronounced “Two Six Incorporated.” The name II-VI refers to Groups II and VI on the periodic table of elements from which II-VI originally designed and produced infrared optics for high-power CO2 lasers used in materials processing. We address seven major markets. The majority of our revenues are attributable to the sale of engineered materials and optoelectronic components, devices, and subsystems for the industrial materials processing, optical communications, and aerospace and defense markets. Reference to “fiscal” or “fiscal year” means our fiscal year ended June 30 for the year referenced.
As of June 30, 2019, the Company’s operations were organized into two reporting segments: (i) Compound Semiconductors and (ii) Photonic Solutions. The Company combined II-VI Laser Solutions and II-VI Performance Products and renamed the combined segment Compound Semiconductors. All applicable segment information has been restated to reflect this change. Additionally, the Company changed the name of II-VI Photonics to Photonic Solutions. See below for a more detailed description of each of these segments.
The following terms are defined for reference: bismuth telluride (“Bi2Te3”); cadmium telluride (“CdTe”); carbon dioxide (“CO2”); carbon monoxide (“CO”); chemical vapor deposited (“CVD”) materials including diamond; dense wavelength division multiplexing (“DWDM”); extreme-ultraviolet (“EUV”) lithography; 5th-generation (“5G”) wireless; 4th-generation (“4G”) wireless; gallium arsenide (“GaAs”); gallium nitride (“GaN”); gigabit Ethernet (“GbE”); gigabit per second (“Gb/s”); high-definition multimedia interface (“HDMI”); indium phosphide (“InP”); infrared (“IR”); intellectual property (“IP”); light detection and ranging (“LiDAR”); liquid crystal (“LC”); liquid crystal on silicon (“LCOS”); nanometers (“nm”); near-infrared (“NIR”); organic light-emitting diode (“OLED”); original equipment manufacturer (“OEM”); optical time domain reflectometer (“OTDR”); radio frequency (“RF”); reconfigurable optical add/drop multiplexer (“ROADM”); research, development, and engineering (“RD&E”); silicon carbide (“SiC”); three-dimensional (“3D”); ultraviolet (“UV”); vertical cavity surface-emitting laser (“VCSEL”); wavelength division multiplexing (“WDM”); wavelength selective switching (“WSS”); zinc selenide (“ZnSe”); and zinc sulfide (“ZnS”).
Pending Acquisition of Finisar Corporation
II-VI and Finisar have entered into an Agreement and Plan of Merger, dated as of November 8, 2018 (the “Merger Agreement”). Pursuant to the terms of the Merger Agreement, Mutation Merger Sub Inc., a Delaware corporation and wholly owned subsidiary of II-VI, will be merged with and into Finisar, and Finisar will continue as the surviving corporation in the merger and a wholly owned subsidiary of II-VI (the “Merger”).
If the Merger is consummated, Finisar stockholders will be entitled to receive, at their election, consideration per share of common stock of Finisar (the “Finisar Common Stock”) consisting of (i) $26.00 in cash, without interest (the “Cash Consideration”), (ii) 0.5546 shares of II-VI common stock (the shares, the “II-VI Common Stock,” and the consideration, the “Stock Consideration”), or (iii) a combination of $15.60 in cash, without interest, and 0.2218 shares of II-VI Common Stock (the “Mixed Consideration,” and, together with the Cash Consideration and the Stock Consideration, the “Merger Consideration”). The Cash Consideration and the Stock Consideration are subject to proration adjustment pursuant to the terms of the Merger Agreement such that the aggregate Merger Consideration will consist of approximately 60% cash and approximately 40% II-VI Common Stock assuming a per share price of II-VI common stock equal to the price when the Merger Agreement was signed on November 8, 2018, which was $46.88 per share.
At the effective time of the Merger (the “Effective Time”), each option granted pursuant to Finisar’s 2005 Stock Incentive Plan, as such plan has been further amended and restated (each, a “Finisar Stock Option”), or portion thereof, that is outstanding and unexercised as of immediately prior to the Effective Time (whether vested or unvested) will be cancelled, terminated and converted into the right to receive an amount of Mixed Consideration that would be payable to a holder of such number of shares of Finisar Common Stock equal to the quotient of (i) the product of (a) the excess, if any, of $26.00 over the exercise price per share of such Finisar Stock Option multiplied by (b) the number of shares of Finisar Common Stock subject to such Finisar Stock Option, divided by (ii) $26.00.
At the Effective Time, each restricted stock unit granted pursuant to Finisar’s 2005 Stock Incentive Plan, as such plan has been further amended and restated (each, a “Finisar Restricted Stock Unit”), or portion thereof , that is outstanding and subject to a
performance-based vesting condition that relates solely to the value of Finisar Common Stock will, to the extent such Finisar Restricted Stock Unit vests in accordance with its terms in connection with the Merger (the “Participating RSUs”), be cancelled and extinguished and converted into the right to receive the Cash Consideration, the Stock Consideration or the Mixed Consideration at the election of the holder of such Participating RSUs, subject to proration adjustment.
At the Effective Time, each Finisar Restricted Stock Unit (or portion thereof) that is outstanding and unvested, does not vest in accordance with its terms in connection with the Merger and is either (x) subject to time-based vesting requirements only or (y) subject to a performance-based vesting condition other than the value of Finisar Common Stock will be assumed by II-VI (each, an “Assumed RSU”). Each Assumed RSU will be subject to substantially the same terms and conditions as applied to the related Finisar Restricted Stock Unit immediately prior to the Effective Time, including the vesting schedule (and the applicable performance-vesting conditions in the case of a grant contemplated by clause (y) of the preceding sentence) and any provisions for accelerated vesting applicable thereto, except that the number of shares of II-VI Common Stock subject to each Assumed RSU will be equal to the product of (i) the number of shares of Finisar Common Stock underlying such unvested Finisar Restricted Stock Unit award as of immediately prior to the Effective Time multiplied by (ii) the sum of (a) 0.2218 plus (b) the quotient obtained by dividing (1) $15.60 by (2) the volume weighted average price per share of II-VI Common Stock (rounded to the nearest cent) on the Nasdaq Global Select Market for the ten consecutive trading days ending on (and including) the third trading day immediately prior to the Effective Time (with the resulting number rounded down to the nearest whole share).
II-VI filed with the SEC a registration statement on Form S-4 relating to the Merger, and that registration statement became effective in accordance with the provisions of Section 8(a) of the Securities Act of 1933, as amended, on February 7, 2019. Shareholders of II-VI and stockholders of Finisar voted to approve proposals related to the Merger at special meetings held on March 26, 2019 by the respective companies.
The waiting period under the Hart-Scott-Rodino Antitrust Improvements Act of 1976, as amended, with respect to the Merger has expired without a request for additional information. Other regulatory approvals applicable to the Merger have been obtained in Germany, Mexico and Romania.
The completion of the Merger is subject to the satisfaction or waiver of certain additional customary closing conditions, including review and approval of the Merger by the State Administration for Market Regulation in China. The Company is planning to refile with the State Administration for Market Regulation in China, extending the approval period. Subject to the satisfaction or waiver of each of the closing conditions, II-VI and Finisar expect that the Merger will be completed in the second half of calendar 2019. However, it is possible that factors outside the control of both companies could result in the Merger being completed at a different time or not at all.
On November 8, 2018, in connection with its entry into the Merger Agreement, II-VI entered into a commitment letter (together with a related fee letter) with Bank of America, N.A., which was subsequently amended and restated on December 7, 2018 and on December 14, 2018 (together with one or more related fee letters, the “Commitment Letter”). Subject to the terms and conditions set forth in the Commitment Letter, the lender parties thereto severally committed to provide 100% of up to $2.425 billion in aggregate principal amount of senior secured credit facilities of II-VI.
On March 4, 2019, II-VI entered into a Credit Agreement, dated as of March 4, 2019 (as amended, the “New Credit Agreement”), by and among the Company, Bank of America, N.A., as Administrative Agent, Swing Line Lender and an L/C Issuer, and the other lenders party thereto. II-VI also entered into Amendment No. 1 to Credit Agreement, dated as of May 24, 2019, by and among the Company, Bank of America, N.A., as Administrative Agent, and the other lenders party thereto, which includes the final results of the syndication of the Term A Facility (as defined below). Pursuant to the terms and subject to the conditions therein, the New Credit Agreement provides for senior secured financing of $1.705 billion in the aggregate, consisting of (i) a five-year senior secured first-lien term A loan facility in an aggregate principal amount of $1.255 billion (the “Term A Facility”) and (ii) a five-year senior secured first-lien revolving credit facility in an aggregate principal amount of $450.0 million (the “Revolving Credit Facility” and together with the Term A Facility, the “New Senior Credit Facilities”). The New Credit Agreement also provides for a letter of credit sub-facility not to exceed $25.0 million and a swing loan sub-facility initially not to exceed $20.0 million, subject to adjustment in accordance with the terms of the New Credit Agreement. II-VI anticipates using the proceeds from the Term A Facility, together with a separately committed term B loan facility in an aggregate principal amount of up to $720.0 million (the “Term B Facility”) and cash and short-term investments of II-VI and Finisar, to pay the cash portion of the merger consideration payable in connection with the Merger and related fees and expenses. II-VI currently does not intend to draw on the Revolving Credit Facility in order to fund the cash portion of the merger consideration payable in connection with the Merger.
The funding obligations of the lenders under the New Senior Credit Facilities are subject to certain currently unsatisfied conditions, including the consummation of the Merger. Accordingly, no borrowings are currently outstanding under the New Senior Credit Facilities, and II-VI currently is not able to borrow under the New Senior Credit Facilities. Further, II-VI expects that the New Credit Agreement will be amended prior to the consummation of the Merger to reflect syndication of the Term B Facility and to finalize certain other terms in the New Credit Agreement. Upon the consummation of the Merger, the New Senior Credit Facilities, governed by the New Credit Agreement as it may be amended as of such time, will be used (i) to refinance in full the Amended Credit Facility (as defined in Note 9 to the Company’s Consolidated Financial Statements included in Item 8 of this Exhibit 99.1 to our Current Report on Form 8-K) and (ii) on or after the date of the consummation of the Merger, to repay amounts owed in connection with Finisar’s outstanding convertible notes, currently in an aggregate principal amount outstanding of $575.0 million, including with the proceeds of a portion of the Term A Facility which will be available to II-VI for a certain period after the initial funding under the New Senior Credit Facilities.
Unless and until the Merger is consummated and the other currently unsatisfied conditions to the funding obligations of the lenders under the New Senior Credit Facilities are satisfied or waived, the Amended Credit Facility remains in effect in accordance with its terms.
General Description of Business
We develop, manufacture, and market engineered materials, optoelectronic components, and devices for precision use in industrial materials processing, optical communications, aerospace and defense, consumer electronics, semiconductor capital equipment, life sciences, and automotive applications and markets. We use advanced engineered materials growth technologies coupled with proprietary high-precision fabrication, microassembly, optical thin-film coating, and electronic integration to manufacture complex optoelectronic devices and modules. Our products are deployed in a variety of applications, including (i) laser cutting, welding, and marking operations; (ii) 3D sensing consumer applications; (iii) optical, data, and wireless communications products; (iv) strategic aerospace and defense applications including intelligence, surveillance, and reconnaissance; (v) semiconductor processing and tooling; and (vi) thermoelectric cooling and power-generation solutions.
Through RD&E and acquisitions, II-VI has expanded its portfolio of materials. We believe that the materials we grow and fabricate are differentiated by one or a combination of unique optical, electrical, thermal, and mechanical properties. II-VI’s optics are shaped by precision surfacing techniques to meet the most stringent requirements for flat or curved geometries, functionalized with smooth or structured surfaces, or with patterned metallization. Proprietary processes developed at our global optical coating centers differentiate our products’ durability against high-energy lasers and extreme operating environments. Optical coatings also provide the desired spectral characteristics ranging from the ultraviolet to the far-infrared. II-VI leverages these capabilities to deliver miniature- to large-scale precision optical assemblies, including those in combination with thermal management components, integrated electronics, and/or software.
II-VI also offers a broad portfolio of compound semiconductor lasers that are used in a variety of applications in most of our end markets. These compound semiconductor lasers enable high-power lasers for materials processing; optical signal amplification in terrestrial and submarine communications networks; high-bit-rate server connectivity between and within datacenters; and fast and accurate measurements in biomedical instruments, consumer electronics, and optical communications network monitoring.
II-VI continues to work to perfect its operational capabilities, develop next-generation products, and invest in new technology platforms. With a strategic focus on fast-growing and sustainable markets, II-VI pursues its vision of enabling the world to be safer, healthier, closer, and more efficient.
Information Regarding Market Segments and Foreign Operations
Financial data regarding our revenues, results of operations, industry segments, and international sales for the three years ended June 30, 2019, are set forth in the Consolidated Statements of Earnings and in Note 14 to the Company’s Consolidated Financial Statements included in Item 8 of this Exhibit 99.1 to our Current Report on Form 8-K and are incorporated herein by reference. We also discuss certain Risk Factors set forth in Item 1A – Risk Factors of our Annual Report on Form 10-K filed August 16, 2019 related to our foreign operations, which are incorporated herein by reference.
Bookings and Backlog
We define our bookings as customer orders received that are expected to be converted to revenues over the next 12 months. The Company records only those orders which are expected to be converted into revenues within 12 months from the end of the reporting period. Bookings are adjusted if changes in customer demands or production schedules cause the expected time of a delivery to extend beyond 12 months. For the fiscal year ended June 30, 2019, our bookings were approximately $1.4 billion, compared with bookings of approximately $1.2 billion for the fiscal year ended June 30, 2018.
We define our backlog as bookings that have not been converted to revenues by the end of the reporting period. As of June 30, 2019, our backlog was approximately $500 million, compared with approximately $450 million as of June 30, 2018.
Global Operations
II-VI is headquartered in Saxonburg, PA, with RD&E, manufacturing, and sales facilities worldwide. Our U.S. production and research and development operations are located in Pennsylvania, California, New Jersey, Texas, Mississippi, Massachusetts, Connecticut, Delaware, New York, Florida, Ohio, Arizona, Colorado, and Illinois, and our non-U.S. production operations are based in China, Singapore, Vietnam, the Philippines, Germany, Switzerland, and the United Kingdom. We also utilize contract manufacturers and strategic suppliers. In addition to sales offices at most of our manufacturing sites, we have sales and marketing subsidiaries in Hong Kong, Japan, Germany, China, Switzerland, Belgium, the United Kingdom, Italy, South Korea, and Taiwan. Approximately 70% of our revenues for the fiscal year ended June 30, 2019, were generated from sales to customers outside of the United States.
Employees
The table below summarizes the number of our employees as of June 30, 2019, in the main functions. We have a long-standing practice of encouraging active employee participation in areas of operations and quality management. We believe our relations with our employees are good. We reward substantially all our employees with some form of variable compensation based on achievement of performance goals. There are approximately 236 employees located in the United States and the Philippines who are covered under collective bargaining agreements. The Company’s collective bargaining agreement in the Philippines expired in June 2019, and the Company is in the process of negotiating a new collective bargaining agreement. The collective bargaining agreement covering certain U.S.-based employees expires in January 2021. There are 735 employees of II-VI Photop in China who work under contract manufacturing arrangements for customers of the Company.
| Number of employees |
Percent of total |
|||||||
| Direct production |
9,778 | 78 | % | |||||
| Research, development, and engineering |
1,707 | 14 | % | |||||
| Sales, marketing, administration, finance, and supporting services |
1,002 | 8 | % | |||||
|
|
|
|
|
|||||
| Total: |
12,487 | 100 | % | |||||
|
|
|
|
|
|||||
Manufacturing Processes
Our success in developing and manufacturing many of our products depends on our ability to manufacture and to tailor the optical and physical properties of technically challenging materials and components. The ability to produce, process, and refine these complex materials and to control their quality and in-process yields is an expertise of the Company that is critical to the performance of our customers’ subsystems and systems. In the markets we serve, there are a limited number of high-quality suppliers of many of the components we manufacture, and there are very few industry-standard products.
Our network of worldwide manufacturing sites allows us to manufacture our products in regions that provide cost-effective and risk management advantages. We employ numerous advanced manufacturing technologies and systems at our manufacturing facilities. These include metal–organic chemical vapor deposition and molecular beam epitaxy reactors, automated computer numeric control optical fabrication, high-throughput thin-film coaters, nanoprecision metrology, and custom-engineered automated furnace controls for crystal growth processes. Manufacturing products for use across the electromagnetic spectrum requires the capability to repeatedly produce products with high yields to atomic tolerances. II-VI continuously updates its comprehensive quality management systems that feature manufacturing quality best practices. II-VI is committed to delivering products within specification, on time, and with high quality, with a goal of fully satisfying customers and continually improving.
Sources of Supply
Among the major feed stock and raw materials we use are zinc, selenium, ZnSe, ZnS, hydrogen selenide, hydrogen sulfide, arsine, phosphine, hydrogen, silon, tellurium, yttrium oxide, aluminum oxide, iridium, platinum, bismuth, silicon, thorium fluoride, antimony, carbon, graphite, GaAs, InP, copper, germanium, molybdenum, quartz, optical glass, and diamond.
The continued high quality of and access to these materials is critical to the stability and predictability of our manufacturing yields. We test materials at the onset and throughout the production process. Additional research and capital investment may be needed to better define future material specifications. We have not experienced significant production delays due to shortages of materials. However, we do occasionally experience problems associated with vendor-supplied materials not meeting contract specifications for quality or purity. As discussed in greater detail in Item 1A – Risk Factors of this Exhibit 99.1 to our Current Report on Form 8-K, significant failure of our suppliers to deliver sufficient quantities of necessary high-quality materials to our specifications on a timely basis could have a materially adverse effect on our results of our operations.
Business Units
As of June 30, 2019, the Company’s organizational structure is divided into two reporting segments for the purpose of making operational decisions and assessing financial performance: (i) Compound Semiconductors and (ii) Photonic Solutions. These segments, and the business units within the segments, are reflected in the organizational chart below:
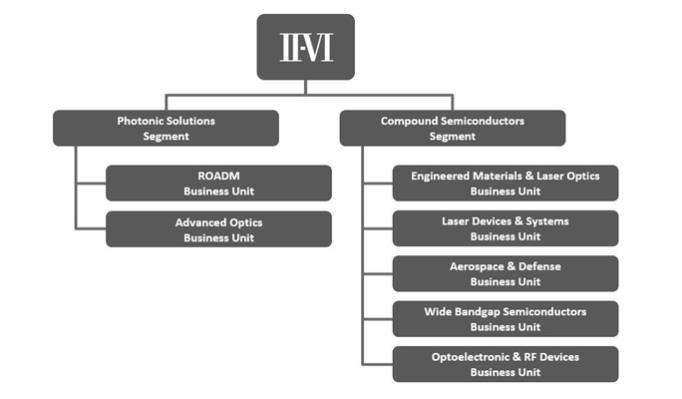
Compound Semiconductors designs, manufactures, and markets: (i) optical and electro-optical components and materials sold under the II-VI Infrared brand name that are used primarily in high-power CO2 lasers, fiber-delivered beam delivery systems, and processing tools; direct-diode lasers for industrial use sold under the II-VI HIGHYAG brand name; (ii) infrared optical components and high-precision optical assemblies for aerospace and defense, medical, and commercial laser imaging applications; and (iii) unique silicon carbide engineered materials for thermoelectric devices and subsystems for SiC applications servicing the semiconductor equipment, aerospace and defense, communications, automotive, and life science markets. Compound Semiconductors also manufactures compound semiconductor epitaxial wafers under the II-VI EpiWorks brand name for applications in optical components, wireless devices, and high-speed communications systems; and 6-inch gallium arsenide wafers allowing for the production of high-performance lasers, optoelectronics, and integrated circuits in high volume under the II-VI Laser Enterprise, II-VI EpiWorks, II-VI Compound Semiconductor Ltd., and II-VI OptoElectronic Devices brand names.
Photonic Solutions manufactures crystal materials, optics, microchip lasers, and optoelectronic modules for use in optical communications networks and other diverse consumer, life sciences, and commercial applications. In addition, the segment also manufactures pump lasers, optical isolators, optical amplifiers, and micro-optics for optical amplifiers for both terrestrial and
submarine applications within the optical communications market; direct-diode laser modules, subsystems, and systems sold under the II-VI Suwtech and II-VI DIRECTPHOTONICS brand names; and super-hard materials processing laser systems sold under the II-VI LASERTECH brand name.
II-VI’s segments are organized by business unit at the group or division level. Each of these business units develops and markets products as described below.
| Segment |
Business Unit |
Our Products | ||
| Photonic Solutions | ROADM | • Products and solutions that enable high-bit-rate interconnects for datacenters and communications service providers, datacenter interconnects, ROADM systems, and undersea fiber-optic transmission
| ||
| Advanced Optics | • Fiber optics and precision optics used in projection and displays; crystal materials and components for optical communications; high-power UV, visible, and NIR optics for industrial lasers; filters and assemblies for life sciences as well as for sensors, instrumentation, and semiconductor equipment |
| Segment |
Business Unit |
Our Products | ||
| Compound Semiconductors | Engineered Materials & Laser Optics | • Laser optics and accessories for CO2 lasers used in materials processing, semiconductors, and life sciences
• High-power fiber and direct-diode laser optics
• Infrared thermal imaging optics and assemblies
• II-VI compound crystalline materials production including ZnSe, ZnS, ZnS multispectral, and CVD diamond
• Thermoelectric components, subassemblies, and systems for heating, cooling, temperature tuning, thermal cycling, and power generation in aerospace and defense, medical, industrial, automotive, consumer, telecommunications, and energy-production markets
• Specialty refining, recycling, and materials recovery services for high-purity rare metals such as selenium and tellurium, as well as related chemical products such as tellurium dioxide, for optics, photovoltaics, semiconductors, thermoelectric coolers, metallurgy, agriculture, and industrial applications
• Advanced ceramic and metal-matrix composite products for semiconductor capital equipment, flat-panel displays, industrial and optical equipment, and defense applications
| ||
| Laser Devices & Systems | • High-power semiconductor lasers and laser bars enabling fiber and direct-diode lasers for materials processing, medical, defense, consumer, and printing applications
• Laser heads and modules; Q-switched laser modules; high-power, uncooled pump laser modules; laser solutions for super-hard materials processing; high-brightness direct-diode laser engines
• Laser processing heads and beam delivery systems for laser materials processing with industrial lasers
|
| Segment |
Business Unit |
Our Products | ||
| Aerospace & Defense | • Precision optical assemblies, objectives, infrared optics, thin-film coatings, and optical materials
• Optical solutions for critical and complex design, engineering, and production challenges in defense, aerospace, and commercial industries
| |||
| Wide Bandgap Semiconductors | • SiC and advanced semiconductor materials for high-frequency and high-power electronic device applications in defense, telecommunications, automotive, and industrial markets
| |||
| Optoelectronic & RF Devices | • VCSELs for optical interconnects and sensing
• VCSELs for 3D sensing in consumer electronics and automotive applications
• RF devices for communications
• GaAs-based RF electronic devices
• II-IV epitaxial wafers to enable higher-performance photonic and RF components for consumer, communications, network, and mobile applications |
Our Markets
Our market-focused businesses are organized by technology and products. Our businesses are composed of the following primary markets: communications, materials processing, aerospace and defense, semiconductor capital equipment, life sciences, consumer electronics, and automotive.
Communications Market
II-VI’s optical communications products and technologies enable the next generation of high-speed optical transmission systems, networks, and datacenter solutions necessary to meet the accelerating global bandwidth demand. At the core of both terrestrial and undersea optical networks, our market-leading 980 nm pump lasers boost the power of the optical signal in the fiber optic cable at intervals along the way to enable a larger number of high-speed signals to be transmitted over longer distances. Our latest generation of 980 nm pump lasers along with miniature tunable filters and hybrid passives is part of our ultracompact family of components critical to a new generation of small-size, long-reach DWDM transmission modules operating at 100, 200, and 400 Gb/s.
Customers continue to rely on us for our industry-leading optical amplification and embedded monitoring solutions for their next-generation ROADM systems to compensate for inherent signal loss and to monitor signal integrity. Our proprietary OTDR modules allow systems to automatically detect and pinpoint issues along the transmission path in real time. The accelerating adoption of applications such as cloud computing is driving the rapid growth of datacenter buildouts. Our high-speed 25 Gb/s VCSELs enable intra-datacenter transceivers to transmit and receive signals. Our miniature WDM thin-film filter assemblies are used to increase the bandwidth within 100 GbE transceivers by combining wavelengths at the transmitter end and separating them out at the receiver end.
In mobile wireless applications, II-VI supplies base SiC substrates to customers who manufacture RF power amplifier devices that are embedded in remote radio heads in 4G wireless base stations to boost the power of the RF signal before it reaches the antenna. These devices are also widely expected to be embedded in next-generation active antennas for 5G wireless, where multiple devices per antenna will be required to enable higher bandwidth. SiC has a high number of intrinsic physical and electronic advantages, such as high thermal conductivity, that enables it to operate at high power levels and still dissipate the excess heat generated.
Materials Processing Market
Our industrial laser optics and solutions for the materials processing market remain in strong demand. There continues to be a steady global demand to support existing installations and new deployments of CO2 and fiber laser systems. Our vertically integrated and market-leading ZnSe optics and components, due to their inherent low loss at around 10-micron wavelength, have enabled high-power CO2 laser systems for many decades and remain critical to the steady stream of new deployments as well as to continued operation, serving as replacement optics for the installed base of CO2 lasers. II-VI continues to introduce products that address new and growing applications for low-power CO2 lasers, such as cutting textiles, leather, wood, and other organic materials, for which the CO2 laser’s 10-micron wavelength is ideally suited. CO2 lasers are also at the core of EUV lithography systems, which are now emerging on the market to enable a new generation of smaller and more powerful personal integrated circuits for internet of things computing devices.
Over the past several years, fiber laser-based systems operating at 1-micron wavelength in pulsed or continuous mode have taken a central role in nearly all materials processing segments, especially for precision machining such as marking and micro-drilling. From the laser chips that generate the input optical power to the beam delivery systems that direct the output optical power to the target, II-VI supplies a broad set of laser optics and fused fiber products that enable many functions within these systems. The same set of II-VI products is also at the core of existing and emerging direct-diode laser systems. II-VI is also driving innovation with a direct-diode laser engine small enough to be mounted on a robotic arm so that the end user can apply square beams directly to the workpiece at wavelengths optimized for aluminum processing.
II-VI’s broad portfolio of coated optics and crystal materials serve all of these growing laser markets.
Aerospace and Defense Market
II-VI aerospace and defense optical products and technologies enable targeting, night vision, and navigation as well as intelligence, surveillance, and reconnaissance systems. Moreover, our recently acquired optical beam combining and directing technologies, along with our fiber laser components, are enabling High Energy Laser (HEL) systems and applications.
Multiple fighter jets are equipped with our large-area sapphire windows that surround advanced electro-optical targeting and imaging systems. Infrared domes are used on missiles with infrared guidance systems ranging from small human-portable designs to larger designs mounted on helicopters, fixed-wing aircraft, and ground vehicles. High-precision domes are an integral component of a missile’s targeting system, providing efficient tactical capability while serving as a multi-functional protective cover for its internal components.
Rotary and fixed-wing aircraft also use missile warning systems to protect against the threat of shoulder-fired human-portable missiles. Our competencies in materials growth for UV crystals and our optical assembly capabilities provide significant support to these common missile warning systems. A key attribute of several of these systems is the ability to filter electromagnetic interference using microfine conductive mesh patterns. This technology is also applied to non-optical applications for absorbing and transmitting energy from the surfaces of aircraft and missiles.
Many aerospace and defense systems employ laser designation and range-finding capabilities supported by our semiconductor laser bars and solid state laser host crystals and laser optics, all manufactured in-house, and benefit from our competency in short-wave infrared and visible optics. Our thermoelectric coolers are used to increase thermal imaging sensitivity or to maintain a constant window temperature in various visible and infrared applications for night vision and sighting applications.
We provide a range of battlefield-ready technologies for soldier equipment and specifically designed variants for law enforcement. Our precision patterned reticles can be embedded in rifle scopes. Our reaction-bonded boron carbide materials are shaped into torso plates and employed as in-aircraft cabin and protective body armor. Our thermoelectric coolers are used to regulate the soldier’s body heat. They are also used to convert heat produced by battlefield fuel burners into electrical power, for example, to extend battery life on the battlefield.
We maintain engineering and manufacturing facilities in the United States with strictly controlled access that are dedicated to our U.S. government supported contracts.
Semiconductor Capital Equipment Market
Semiconductor capital equipment requires advanced materials to meet the need for tighter tolerances, enhanced thermal stability, faster wafer transfer speeds, and reduced stage settling times. Our metal-matrix composites and reaction-bonded ceramics enable these applications, thanks to their optimum combination of light weight, strength, hardness, and coefficient of thermal expansion. Our reaction-bonded SiC materials are used to manufacture wafer chucks, lightweight scanning stages, and high-temperature corrosion-resistant wafer support systems. Our cooled SiC mirrors and precision patterned reticles are used in the illumination systems of lithography tools.
In the emerging market of EUV lithography systems, CO2 lasers are used to generate extreme-ultraviolet light. These CO2 lasers and beam delivery systems leverage our broad portfolio of CO2 laser optics, CdTe modulators, and high-power damage-resistant polycrystalline CVD diamond windows to route the powerful laser beam to a tin droplet from which EUV light will emanate. Due to its very high mechanical and thermal performance characteristics, our reaction-bonded SiC is used in structural support systems that are integral to EUV lithography optics to meet critical requirements for optical system stability.
Life Sciences Market
The majority of our business in the life sciences end market is in analytical tools. Many analytical tools found in modern biotech laboratories are based on some form of interaction with light. This applies to flow cytometry, cell sorting, confocal microscopy, DNA genome sequencing, Raman spectroscopy, fluorescence spectroscopy, and particle sizing, to name a few. Our multicolored laser engines along with our broad portfolio of application-specific optics, filters, and gratings are embedded in these analytical tools. We also supply objective lenses, precision patterned reticles, and assemblies for microscopes.
Genome sequencing involves temperature-cycling DNA in flow cells with a high degree of temperature uniformity and precision. We believe that our thermal engines are the state of the art in chiller technology, and they achieve what we believe to be industry-leading temperature control and uniformity across large areas. Our green lasers are used to excite the fluorescence of DNA to reveal its structure. Our flow cells are micromachined with a high degree of precision to ensure the smooth flow of sample fluids undergoing analysis. Our thermal engines are also used in a multitude of other biomedical applications, for example, to measure substance concentration in complex mixtures, protect blood supplies, and perform heating- and cooling-based physical therapy.
Clinical procedures are increasingly performed with tools that embed our lasers and optics. For example, our semiconductor laser bars are used in hair and wrinkle removal procedures, and our custom-designed lens assemblies are used for laser eye surgery. We continue to leverage our core laser, optics, and temperature-control expertise into new applications to grow our business in the life sciences.
Consumer Electronics Market
II-VI manufactures low-cost VCSELs, VCSEL arrays, and filters for the consumer electronics market. Our VCSEL products leverage our world-class 6-inch GaAs platform, combining our epitaxial wafer growth and wafer fabrication capabilities.
Our VCSELs, unlike many on the market, have already been designed into consumer products such as the computer mouse as well as for menu navigation in smart phones and vehicle steering wheels. Our VCSELs are also widely deployed in datacenters and in the emerging market for HDMI optical cables. This expertise in VCSEL technology is being leveraged for the emerging 3D sensing market. With our acquisitions of 6-inch epitaxy and wafer capabilities, we have invested significantly to round out our capacity expansion.
Automotive Market
Power-conversion electronics for high-efficiency electric vehicles need a combination of high power density, high efficiency, and high-temperature operation that is only afforded by advanced materials systems based on SiC substrates. Our SiC substrates are available in large diameters and have what we believe to be best-in-class quality and low defect levels.
Our thermoelectric modules are used to cool batteries to extend their operating life. They are also more efficient than resistive heaters when used in heated car seats and extend an electric vehicle’s range of travel in cold environments.
To operate safely, self-driving cars will rely on control systems that are informed by a comprehensive number of sensors. One such sensor is based on LiDAR, which employs semiconductor lasers to properly identify and measure the distance to obstacles ahead. Our GaAs-based semiconductor laser platform, which already enables a broad portfolio of products in communications and materials processing, is now being scaled further for consumer electronics and will be leveraged to deliver a highly reliable and cost-effective laser product for this emerging market.
Marketing and Sales
We market our products through a direct sales force and through representatives and distributors around the world. Our market strategy is focused on understanding our customers’ requirements and building market awareness and acceptance of our products. New products are continually being developed and introduced to our new and established customers in all markets.
The Company has centralized its worldwide marketing and sales functions across the Company’s business units. Sales offices have been strategically established to best serve and distribute products to our worldwide customer base. There are significant cooperation, coordination, and synergies among our business units, which capitalize on the most efficient and appropriate marketing channels to address diverse applications within our markets.
Our sales force develops effective communications with our OEM and end-user customers worldwide. Products are actively marketed through targeted mailings, telemarketing, select advertising, attendance at trade shows, and customer partnerships. Our sales force includes a highly trained team of applications engineers to assist customers in designing, testing, and qualifying our products as key components of our customers’ systems. As of June 30, 2019, we employed approximately 273 individuals in sales, marketing, and support.
We do business with a number of customers in the defense industry, who in turn generally contract with a governmental entity, typically a U.S. government agency. Most governmental programs are subject to funding approval and can be modified or terminated without warning by a legislative or administrative body.
Customers
The representative groups of customers by segments are as follows:
| Segment: |
Group/Division: |
Our Customers Are: |
Representative Customers: | |||
| Photonic Solutions | ROADM | Worldwide network system and subsystem providers of telecommunications, data communications, and CATV | • Ciena Corporation
• Fujitsu Network Communications
• Nokia Solutions and Networks | |||
| Advanced Optics | Global manufacturers of industrial and medical laser optics and crystals including commercial and consumer products used in a wide array of instruments, sensors, fiber lasers, displays, and projection devices | • Corning Incorporated
• Coherent Inc.
• Han’s Laser Technology Industry Group Co. Ltd. | ||||
| Compound Semiconductors | Engineered Materials & Laser Optics |
OEM and system integrators of industrial, medical, personal comfort, and aerospace and defense laser systems; laser end users who require replacement optics for their existing laser systems | • TRUMPF GmbH + Co. KG
• Bystronic Laser AG
• Coherent Inc. | |||
| Manufacturers and developers of integrated-circuit capital equipment for the semiconductor capital equipment industry | • ASML Holding NV
• Carl Zeiss AG
• Nikon Corporation
• KLA-Tencore Corporation | |||||
| Primary mineral processors, refiners, and providers of specialized materials used in laser optics, photovoltaics, semiconductors, thermoelectric coolers, metallurgy, and industrial products | • Aurubis AG | |||||
| Laser Devices & Systems |
Manufacturers of industrial laser components, optical communications equipment, and consumer technology applications; automotive manufacturers | • Ford Motor Company
• Laserline GmbH
• Wuhan Raycus Fiber Laser Technologies Co. Ltd. | ||||
| OEM and subsystem integrators of aiming, machine vision, biomedical instruments, and fiber lasers; laser cutting machines for super-hard materials | • BGI Complete Genomics, Shenzhen Co. Ltd.
• TRUMPF GmbH + Co. KG | |||||
| Segment: |
Group/Division: |
Our Customers Are: |
Representative Customers: | |||
| Aerospace & Defense | Manufacturers of equipment and devices for aerospace, defense, and commercial markets | • Lockheed Martin Corporation | ||||
| Wide Bandgap Semiconductors | Manufacturers and developers of equipment and devices for high-power RF electronics and high-power, voltage-switching, and power-conversion systems for both commercial and aerospace and defense applications | • Sumitomo Electric Device Innovations Inc.
• Showa Denko KK
• STMicroelectronics
• IQE PLC
• Infineon Technologies AG | ||||
| Optoelectronic & RF Devices | Manufacturers of consumer electronics and transceivers | • Sumitomo Electric Device Innovations Inc. | ||||
Competition
II-VI is a global leader in many of its product families. We compete partly on the basis of our reputation for offering highly engineered products, product and technology roadmaps, intellectual property, ability to scale, quality, on-time delivery, technical support, and pricing. We believe that we compete favorably with respect to these factors and that our vertical integration, manufacturing facilities and equipment, experienced technical and manufacturing employees, and worldwide marketing and distribution channels provide us with competitive advantages. The representative groups of our competitors by segment are as follows:
| Segment: |
Areas of Competition: |
Competitors: | ||
| Compound Semiconductors | Infrared laser optics |
• Sumitomo Electric Industries Ltd.
• MKS Instruments Inc.
• Wavelength Opto-Electronic Pte. Ltd.
• Sigma Koki Co. Ltd. | ||
|
Automated equipment and laser materials processing tools to deliver high-power 1-micron laser systems |
• Optoskand AB
• Precitec GmbH & Co. KG
• Mitsubishi Cable Industries Ltd. | |||
|
Biomedical instruments for flow cytometry, DNA sequencing, and fluorescence microscopy |
• Coherent Inc.
• Pavilion Integration Corporation
• Shimadzu Corporation | |||
|
Semiconductor laser diodes for the industrial and consumer markets |
• Lumentum Operations LLC
• Finisar Corporation
• Broadcom Ltd.
• ams AG
• Jenoptik AG
• OSRAM Licht AG
• Sony Corporation
• Hamamatsu Photonics KK | |||
|
Infrared optics for aerospace and defense applications |
• In-house fabrication and thin-film coating capabilities of major aerospace and defense customers | |||
|
Thermoelectric components, subassemblies, and systems |
• Komatsu Ltd.
• Laird PLC
• Ferrotec Corporation | |||
|
Metal-matrix composites and reaction-bonded ceramic products |
• Berliner Glas KGaA Herbert Kubatz GmbH & Co.
• CoorsTek Inc.
• Japan Fine Ceramics Co. Ltd. | |||
|
Single-crystal SiC substrates |
• Cree Inc.
• Dow Corning Corporation
• SICC Co. Ltd.
• TankeBlue Semiconductor Co. Ltd.
• ROHM Co. Ltd. |
| Segment: |
Areas of Competition: |
Competitors: | ||
| Refining and materials-recovery services for high-purity rare metals | • Vital Materials Co. Ltd.
• 5N Plus Inc.
• RETORTE GmbH Selenium Chemicals & Metals | |||
|
Photonic Solutions |
Optics, optical components, modules, and subsystems for optical communications |
• Molex LLC
• Lumentum Operations LLC | ||
|
Optical and crystal components, thin-film coatings, and subassemblies for lasers and metrology instruments |
• Casix Inc.
• CASTECH Inc.
• Hellma GmbH & Co. KG
• Research Electro-Optics Inc.
• IDEX Corporation |
In addition to competitors who manufacture products similar to those we produce, there are other technologies and products available that may compete with our technologies and products.
Our Strategy
Our strategy is to grow businesses with world-class engineered materials capabilities to advance our current customers’ strategies, penetrate new markets through innovative technologies and platforms, and enable new applications in large and growing markets. A key strategy of ours is to develop and manufacture high-performance materials and, in certain cases, components from those materials that are differentiated from those produced by our competitors. We focus on providing components that are critical to the heart of our customers’ products serving the applications mentioned above.
We have grown the number and size of our key accounts substantially. Now, a significant portion of our business is based on sales orders with market leaders, which enable our forward planning and production efficiencies. We intend to continue capitalizing and executing on this proven model, participating effectively in the growth of the markets discussed above, and continuing our focus on operational excellence as we execute our primary business strategies:
| Key Business Strategies: |
Our Plan to Execute: | |
| Identify New Products and Markets | Identify new technologies, products, and markets to meet evolving customer requirements for high-performance engineered materials through our dedicated RD&E programs to increase new product revenue and maximize return on investment. | |
|
Balanced Approach to Research and Development |
Internally and externally funded RD&E expenditures, targeting an overall investment of between 10–15% of revenues depending on the nature of the investment in terms of technology platforms or products. | |
|
Leverage Vertical Integration |
Combine RD&E and manufacturing expertise, operating with a bias toward components and production machines, reducing cost and lead time to enhance competitiveness, time to market, profitability, and quality, and enabling our customers to offer competitive products. | |
|
Investment in Scalable Manufacturing |
Strategically invest in, evaluate, and identify opportunities to consolidate and automate manufacturing operations worldwide to increase production capacity, capabilities, and cost-effectiveness. | |
|
Enhance Our Performance and Reputation as a Quality and Customer Service Leader |
Continue to improve upon our established reputation as a consistent, high-quality supplier of engineered materials and optoelectrical components that are built into our customers’ products. | |
|
Execute our global quality transformation process, eliminating costs of nonconforming materials and processes. | ||
|
Identify and Complete Strategic Acquisitions and Alliances |
Identify acquisition opportunities that accelerate our access to emerging, high-growth segments of the markets we serve and further leverage our competencies and economies of scale. | |
Research, Development, and Engineering
During the fiscal year ended June 30, 2019, the Company continued to identify, invest in, and focus our research and development on new products and platform technologies in an effort to accelerate our organic growth. This approach is managed under a disciplined innovation program that we refer to as the “II-VI Phase Gate Process.”
From time to time, the ratio of externally funded contract activity to internally funded contract activity varies due to the unevenness of government-funded research programs and changes in the focus of our internally funded research programs. We are committed to having the right mix of internally and externally funded research that ties closely to our long-term strategic objectives.
We devote significant resources to RD&E programs directed at the continuous improvement of our existing products and processes and to the timely development of new materials, technologies, and products. We believe that our RD&E activities are essential to establishing and maintaining a leadership position in each of the markets we serve. As of June 30, 2019, we employed 1,707 people in RD&E functions. In addition, certain manufacturing personnel support or participate in our research and development efforts on an ongoing basis. We believe this interaction between the development and manufacturing functions enhances the direction of our projects, reducing costs and accelerating technology transfers.
During the fiscal year ended June 30, 2019, we focused our RD&E investments in the following areas:
| Segment: |
Area of Development: |
Our RD&E Investments: | ||
| Compound Semiconductors | High-power laser diodes and high-volume manufacturing | Focusing on increasing fiber coupled optical output power of multi-emitter modules. | ||
|
Developing high-power VCSELs for consumer devices and next-generation, high-speed VCSELs for 3D sensing and datacom applications. | ||||
|
High power beam delivery |
Developing multi-kW beam delivery systems and cables for welding and cutting. | |||
|
CVD diamond technology |
Developing CVD diamond for EUV applications. | |||
|
Broadening our portfolio beyond infrared window applications. | ||||
|
SiC technology |
Developing advanced SiC substrate growth technologies to support emerging markets in GaN RF and SiC power electronics. | |||
|
Continuous improvement to maintain world-class, high-quality, large-diameter substrates and epitaxial wafers. | ||||
|
Thermoelectric materials and devices |
Continuing to develop leading Bi2Te3 materials for thermoelectric cooling/heating. | |||
|
Focusing on thermoelectric power-generation capability in order to introduce new products to the market. | ||||
|
Metal-matrix composites and reaction-bonded ceramics |
Support industrial customers in developing application-specific wear and thermal-management solutions. | |||
|
Fiber laser technologies |
Developing high-power fiber laser technologies for aerospace and defense and commercial applications. | |||
|
Photonic Solutions |
Photonics design |
Continuing to develop and improve crystal materials, precision optical parts, and laser device components for photonics applications. | ||
|
Pump lasers |
Continuing to invest in our next-generation GaAs pump laser portfolio and flexible manufacturing footprint to address evolving terrestrial and undersea markets. | |||
|
Developing InP growth and processing capability together with associated packaging technology. | ||||
|
Optical amplifiers and subsystems |
Investing and broadening the range of amplifiers and integrated subsystems including ROADMs. | |||
|
Wavelength selective switching |
Developing LC and LCOS technologies and associated module designs for WSS; investing in manufacturing equipment and the automation platform. | |||
|
Optical monitoring |
Continuing optical channel monitoring investment. | |||
|
Developing OTDRs to monitor the health of the fiber plant. | ||||
|
Micro-optics manufacturing |
Shifting toward smaller, more compact optics and automated assembly platforms and packages. | |||
|
Investing in manufacturing equipment for computerized processes. |
The development of our products and manufacturing processes is largely based on proprietary technical know-how and expertise. We rely on a combination of contract provisions, trade secret laws, invention disclosures, and patents to protect our proprietary rights. We have entered into selective intellectual property licensing agreements. We have asserted in the past, and expect that we will continue to assert, as well as vigorously protect, our intellectual property rights. We have a total of approximately 800 patents globally.
Internally funded research and development expenditures were $139.2 million, $116.9 million, and $96.8 million for the fiscal years 2019, 2018, and 2017, respectively. For these same periods, externally funded research and development expenditures were $14.7 million, $12.7 million, and $8.7 million, respectively, and were included in cost of goods sold in the Consolidated Statements of Earnings.
Export and Import Compliance
We are required to comply with various export/import control and economic sanction laws, including:
| • | The International Traffic in Arms Regulations administered by the U.S. Department of State, Directorate of Defense Trade Controls, which among other things impose licensing requirements on the export from the United States of certain defense articles and defense services, generally including items that are specially designed or adapted for a military application and/or listed on the United States Munitions List; |
| • | The Export Administration Regulations administered by the U.S. Department of Commerce, Bureau of Industry and Security, which among other things impose licensing requirements on certain dual-use goods, technology, and software, i.e., items that potentially have both commercial and military applications; |
| • | The regulations administered by the U.S. Department of the Treasury, Office of Foreign Assets Control, which implement economic sanctions imposed against designated countries, governments, and persons based on U.S. foreign policy and national security considerations; and |
| • | The import regulations administered by U.S. Customs and Border Protection. |
Foreign governments have also implemented similar export and import control regulations, which may affect our operations or transactions subject to their jurisdiction. For additional discussions regarding our import and export compliance, see the discussion set forth in Item 1A – Risk Factors of our Annual Report Form on Form 10-K filed August 16, 2019.
Trade Secrets, Patents, and Trademarks
Our use of trade secrets, proprietary know-how, trademarks, copyrights, patents, contractual confidentiality, and IP ownership provisions help us develop and maintain our competitive position with respect to our products and manufacturing processes. We aggressively pursue process and product patents in certain areas of our businesses, and in certain jurisdictions across the globe. We have entered into selective intellectual property licensing agreements. We have confidentiality and noncompetition agreements with certain personnel. We require that our U.S. employees sign a confidentiality and noncompetition agreement upon commencement of their employment with us.
The design, processes, and specialized equipment utilized in our engineered materials, advanced components, and subsystems are innovative, complex, and difficult to duplicate. However, there can be no assurance that others will not develop or patent similar technology, or that all aspects of our proprietary technology will be protected. Others have obtained patents covering a variety of materials, devices, equipment, configurations, and processes, and others could obtain patents covering technology similar to ours. We may be required to obtain licenses under such patents, and there can be no assurance that we would be able to obtain such licenses, if required, on commercially reasonable terms, or that claims regarding rights to technology will not be asserted that may adversely affect our results of operations. In addition, our research and development contracts with agencies of the U.S. government present a risk that project-specific technology could be disclosed to competitors as contract reporting requirements are fulfilled.
Executive Officers of the Registrant
The executive officers of the Company and their respective ages and positions as of June 30, 2019, are set forth below. Each executive officer listed has been appointed by the Board of Directors to serve until removed or until such person’s successor is appointed and qualified.
| Name | Age | Position | ||
| Vincent D. Mattera, Jr. |
63 | President and Chief Executive Officer; Director | ||
| Mary Jane Raymond |
58 | Chief Financial Officer and Treasurer and Assistant Secretary | ||
| Giovanni Barbarossa |
57 | Chief Technology Officer and President, Compound Semiconductors | ||
| Name | Age | Position | ||
| Gary A. Kapusta |
59 | Chief Operating Officer | ||
| Jo Anne Schwendinger |
63 | Chief Legal and Compliance Officer and Secretary | ||
| David G. Wagner |
56 | Vice President, Human Resources | ||
Vincent D. Mattera, Jr. Dr. Mattera initially served as a member of the II-VI Board of Directors from 2000 to 2002. Dr. Mattera joined the Company as a Vice President in 2004 and served as Executive Vice President from January 2010 to November 2013, when he became the Chief Operating Officer. In November 2014, Dr. Mattera became the President and Chief Operating Officer and was reappointed to the Board of Directors. In November 2015, he became the President of II-VI. In September 2016, Dr. Mattera became the Company’s third President and Chief Executive Officer in 45 years. During his career at II-VI, he has assumed successively broader management roles, including as a lead architect of the Company’s diversification strategy. He has provided vision, energy, and dispatch to the Company’s growth initiatives, including overseeing the acquisition-related integration activities in the United States, Europe, and Asia—especially in China—thereby establishing additional platforms. These have contributed to a new positioning of the Company into large and transformative global growth markets while increasing considerably the global reach of the Company, deepening the technology and IP portfolio, broadening the product roadmap and customer base, and increasing the potential of II-VI.
Prior to joining II-VI as an executive, Dr. Mattera had a continuous 20-year career in the Optoelectronic Device Division of AT&T Bell Laboratories, Lucent Technologies, and Agere Systems, during which he led the development and manufacturing of semiconductor laser-based materials and devices for optical and data communications networks. Dr. Mattera has 34 years of leadership experience in the compound semiconductor materials, device technology, operations, and markets that are core to II-VI’s business and strategy. Dr. Mattera holds a B.S. degree in chemistry from the University of Rhode Island (1979) and a Ph.D. in chemistry from Brown University (1984). He completed the Stanford University Executive Program (1996).
Mary Jane Raymond has been Chief Financial Officer and Treasurer of the Company since March 2014. Previously, Ms. Raymond was Executive Vice President and Chief Financial Officer of Hudson Global Inc. (Nasdaq:HSON) from 2005 to 2013. Ms. Raymond was the Chief Risk Officer and Vice President and Corporate Controller at Dun and Bradstreet Inc. from 2002 to 2005. Additionally, she was the Vice President, Merger Integration, at Lucent Technologies from 1997 to 2002 and held several management positions at Cummins Engine Company from 1988 to 1997. Ms. Raymond holds a B.A. degree in Public Management from St. Joseph’s University, and an MBA from Stanford University.
Giovanni Barbarossa joined II-VI in 2012, served as the Chief Technology Officer from 2012 through June 30, 2019 and as the President, II-VI Laser Solutions, from 2014 to 2019, and has served as the President, Compound Semiconductors, since 2019. Dr. Barbarossa was employed at Avanex Corporation from 2000 through 2009, serving in various executive positions in product development and general management, and ultimately serving as President and Chief Executive Officer. When Avanex merged with Bookham Technology, forming Oclaro, Dr. Barbarossa became a member of the Board of Directors of Oclaro and served as such from 2009 to 2011. Previously, he had management responsibilities at British Telecom, AT&T Bell Labs, Lucent Technologies, and Hewlett-Packard. Dr. Barbarossa graduated from the University of Bari, Italy, with a B.S. degree in Electrical Engineering and holds a Ph.D. in Photonics from the University of Glasgow, U.K.
Gary A. Kapusta joined II-VI in February 2016 and served from then through June 30, 2019 as the Company’s Chief Operating Officer. Prior to his employment with the Company, Mr. Kapusta served in various roles at Coca-Cola, including as President and Chief Executive Officer, Coca-Cola Bottlers’ Sales & Services LLC; President, Customer Business Solutions; and Vice President, Procurement Transformation, Coca-Cola Refreshments. He joined Coca-Cola following a 19-year career at Agere Systems, Lucent Technologies, and AT&T. Mr. Kapusta graduated from the University of Pittsburgh with B.S. and M.S. degrees in Industrial Engineering and holds an MBA from Lehigh University.
Jo Anne Schwendinger has served as the Company’s Chief Legal and Compliance Officer and Secretary since March 2017. Ms. Schwendinger also served as the Company’s General Counsel and Secretary from when she joined the Company in March 2017 until November 2017. Prior to her employment with the Company, Ms. Schwendinger practiced law with the firm Blank Rome LLP from August 2016 until February 2017. Previously, Ms. Schwendinger served in various legal roles at Deere & Company from February 2000 until August 2016, including Regional General Counsel–Asia-Pacific and Sub-Saharan Africa and Assistant General Counsel. Ms. Schwendinger holds a bachelor’s degree from the Université d’Avignon et des Pays de Vaucluse, a master’s degree from the Université de Strasbourg, and a Juris Doctor degree from the University of Pittsburgh Law School.
David G. Wagner has been employed by the Company since 2008 and has been Vice President, Human Resources, since 2011. Prior to his employment with the Company, Mr. Wagner was employed with Owens Corning (NYSE:OC) from 1985 through 2008, serving in various human resource management positions, ultimately becoming Vice President, Human Resources, for Owen Corning’s global sales force. Mr. Wagner graduated with a B.S. degree in Human Resources Management from Juniata College in 1985. Mr. Wagner has announced his intention to retire from the Company, to be effective in 2019, at a date to be determined.
Appointment of Walter R. Bashaw II as President Effective July 1, 2019
On June 27, 2019, the Board of Directors of the Company appointed Walter R. Bashaw II as the Company’s President, effective July 1, 2019. Dr. Mattera remains the Company’s Chief Executive Officer and a member of the Company’s Board of Directors.
Mr. Bashaw, 54, has served as the Company’s Senior Vice President, Corporate Strategy and Development, Administration since October 2018 and previously served as the Company’s Interim General Counsel and Secretary from December 2015 until March 2017. Mr. Bashaw also previously was the Managing Shareholder and a Director of the law firm of Sherrard, German & Kelly, P.C. (“SGK”) in Pittsburgh, Pennsylvania, until October 2018 and has been Of Counsel at SGK since October 2018. Mr. Bashaw graduated from The Pennsylvania State University with a B.S. degree in Logistics and also holds a J.D. degree from the University of Pittsburgh School of Law.
Changes in Management Roles Effective July 1, 2019
The Company’s Board of Directors also determined on June 27, 2019 that Dr. Barbarossa would be reassigned to the position of Chief Strategy Officer and President of the Compound Semiconductor segment, effective July 1, 2019. The Company’s Board of Directors appointed Christopher Koeppen, who most recently served as the Company’s Vice President, Laser Systems Group, as the Company’s Chief Technology Officer, effective July 1, 2019. Mr. Kapusta, who most recently served as the Company’s Chief Operating Officer, was reassigned by the Company’s Board of Directors to the position of Chief Procurement Officer, effective July 1, 2019.
Availability of Information
Our internet address is www.ii-vi.com. Information contained on our website is not part of, and should not be construed as being incorporated by reference into, this Exhibit 99.1 to our Current Report on Form 8-K. We post the following reports on our website as soon as reasonably practical after they are electronically filed with or furnished to the Securities and Exchange Commission (“SEC”): our Annual Reports on Form 10-K, our Quarterly Reports on Form 10-Q, our Current Reports on Form 8-K, and any amendments to those reports or statements filed or furnished pursuant to Section 13(a) or 15(d) of the Exchange Act. In addition, we post our proxy statements on Schedule 14A related to our annual shareholders’ meetings as well as reports filed by our directors, officers, and 10% beneficial owners pursuant to Section 16 of the Exchange Act. In addition, all filings are available via the SEC’s website (www.sec.gov). We also make our corporate governance documents available on our website, including the Company’s Code of Business Conduct and Ethics, governance guidelines, and the charters for our Board committees. All such documents are located on the Investors page of our website and are available free of charge.
PART II
| Item 7. | MANAGEMENT’S DISCUSSION AND ANALYSIS OF FINANCIAL CONDITION AND RESULTS OF OPERATIONS |
Forward-Looking Statements
Certain statements contained in this Management’s Discussion and Analysis of Financial Condition and Results of Operations are forward-looking statements. Forward-looking statements are also identified by words such as “expects,” “anticipates,” “believes,” “intends,” “plans,” “projects” or similar expressions. Actual results could differ materially from those anticipated in these forward-looking statements for many reasons, including those potential risks set forth in Item 1A, of our Annual Report on Form 10-K filed on August 16, 2019, which are incorporated herein by reference.
Overview
II-VI Incorporated (“II-VI,” the “Company,” “we,” “us” or “our”), a worldwide leader in engineered materials and optoelectronic components, is a vertically integrated manufacturing company that develops innovative products for diversified applications in the industrial materials processing, optical communications, aerospace and defense, consumer electronics, semiconductor capital equipment, life science and automotive applications and markets. The Company produces a wide variety of application-specific photonic and electronic materials and components, and deploys them in various forms, including integration with advanced software.
The Company generates revenues, earnings and cash flows from developing, manufacturing and marketing engineered materials and optoelectronic components and devices for precision use in industrial materials processing, optical communications, consumer electronics, semiconductor capital equipment, life sciences and automotive applications. We also generate revenue, earnings and cash flows from government funded research and development contracts relating to the development and manufacture of new technologies, materials and products.
Our customer base includes OEMs, laser end-users, system integrators of high-power lasers, manufacturers of equipment and devices for the industrial, optical communications, aerospace and defense, semiconductor, medical and life science markets, consumer, U.S. government prime contractors, various U.S. Government agencies and thermoelectric integrators. `
In September 2018, November 2018, and March 2019, the Company completed its acquisitions of CoAdna Holdings, Inc. (“CoAdna”), an additional product line, and Redstone Aerospace Corporation (“Redstone”), respectively. See Note 3, Acquisitions, to our Consolidated Financial Statements contained in Item 8 of this Exhibit 99.1 to our Current Report on Form 8-K. The operating results of these acquisitions have been reflected in the selected financial information of the Company’s Photonic Solutions segment since the respective dates of the acquisitions, with the exclusion of Redstone which is reflected in the Compound Semiconductors segment.
As we grow, we are focused on scaling our Company and deriving the continued benefits of vertical integration as we strive to be a best in class competitor in all of our highly competitive markets. The Company may elect to change the way in which the Company operates or is organized in the future to enable the most efficient implementation of its strategy.
Pending Acquisition of Finisar Corporation
II-VI and Finisar have entered into an Agreement and Plan of Merger, dated as of November 8, 2018 (the “Merger Agreement”). Pursuant to the terms of the Merger Agreement, Mutation Merger Sub Inc., a Delaware corporation and wholly owned subsidiary of II-VI, will be merged with and into Finisar, and Finisar will continue as the surviving corporation in the merger and a wholly owned subsidiary of II-VI (the “Merger”).
If the Merger is consummated, Finisar stockholders will be entitled to receive, at their election, consideration per share of common stock of Finisar (the “Finisar Common Stock”) consisting of (i) $26.00 in cash, without interest (the “Cash Consideration”), (ii) 0.5546 shares of II-VI common stock (the shares, the “II-VI Common Stock,” and the consideration, the “Stock Consideration”), or (iii) a combination of $15.60 in cash, without interest, and 0.2218 shares of II-VI Common Stock (the “Mixed Consideration,” and, together with the Cash Consideration and the Stock Consideration, the “Merger Consideration”). The Cash Consideration and the Stock Consideration are subject to proration adjustment pursuant to the terms of the Merger Agreement such that the aggregate Merger Consideration will consist of approximately 60% cash and approximately 40% II-VI Common Stock assuming a per share price of II-VI common stock equal to the price when the Merger Agreement was signed on November 8, 2018, which was $46.88 per share.
At the effective time of the Merger (the “Effective Time”), each option granted pursuant to Finisar’s 2005 Stock Incentive Plan, as such plan has been further amended and restated (each, a “Finisar Stock Option”), or portion thereof, that is outstanding and unexercised as of immediately prior to the Effective Time (whether vested or unvested) will be cancelled, terminated and converted into the right to receive an amount of Mixed Consideration that would be payable to a holder of such number of shares of Finisar Common Stock equal to the quotient of (i) the product of (a) the excess, if any, of $26.00 over the exercise price per share of such Finisar Stock Option multiplied by (b) the number of shares of Finisar Common Stock subject to such Finisar Stock Option, divided by (ii) $26.00.
At the Effective Time, each restricted stock unit granted pursuant to Finisar’s 2005 Stock Incentive Plan, as such plan has been further amended and restated (each, a “Finisar Restricted Stock Unit”), or portion thereof , that is outstanding and subject to a performance-based vesting condition that relates solely to the value of Finisar Common Stock will, to the extent such Finisar Restricted Stock Unit vests in accordance with its terms in connection with the Merger (the “Participating RSUs”), be cancelled and extinguished and converted into the right to receive the Cash Consideration, the Stock Consideration or the Mixed Consideration at the election of the holder of such Participating RSUs, subject to proration adjustment.
At the Effective Time, each Finisar Restricted Stock Unit (or portion thereof) that is outstanding and unvested, does not vest in accordance with its terms in connection with the Merger and is either (x) subject to time-based vesting requirements only or (y) subject to a performance-based vesting condition other than the value of Finisar Common Stock will be assumed by II-VI (each, an “Assumed RSU”). Each Assumed RSU will be subject to substantially the same terms and conditions as applied to the related Finisar Restricted Stock Unit immediately prior to the Effective Time, including the vesting schedule (and the applicable performance-vesting conditions in the case of a grant contemplated by clause (y) of the preceding sentence) and any provisions for accelerated vesting applicable thereto, except that the number of shares of II-VI Common Stock subject to each Assumed RSU will be equal to the product of (i) the number of shares of Finisar Common Stock underlying such unvested Finisar Restricted Stock Unit award as of immediately prior to the Effective Time multiplied by (ii) the sum of (a) 0.2218 plus (b) the quotient obtained by dividing (1) $15.60 by (2) the volume weighted average price per share of II-VI Common Stock (rounded to the nearest cent) on the Nasdaq Global Select Market for the ten consecutive trading days ending on (and including) the third trading day immediately prior to the Effective Time (with the resulting number rounded down to the nearest whole share).
II-VI filed with the SEC a registration statement on Form S-4 relating to the Merger, and that registration statement became effective in accordance with the provisions of Section 8(a) of the Securities Act of 1933, as amended, on February 7, 2019. Shareholders of II-VI and stockholders of Finisar voted to approve proposals related to the Merger at special meetings held on March 26, 2019 by the respective companies.
The waiting period under the Hart-Scott-Rodino Antitrust Improvements Act of 1976, as amended, with respect to the Merger has expired without a request for additional information. Other regulatory approvals applicable to the Merger have been obtained in Germany, Mexico and Romania.
The completion of the Merger is subject to the satisfaction or waiver of certain additional customary closing conditions, including review and approval of the Merger by the State Administration for Market Regulation in China. The Company is planning to refile with the State Administration for Market Regulation in China, extending the approval period. Subject to the satisfaction or waiver of each of the closing conditions, II-VI and Finisar expect that the Merger will be completed in the second half of calendar 2019. However, it is possible that factors outside the control of both companies could result in the Merger being completed at a different time or not at all.
On November 8, 2018, in connection with its entry into the Merger Agreement, II-VI entered into a commitment letter (together with a related fee letter) with Bank of America, N.A., which was subsequently amended and restated on December 7, 2018 and on December 14, 2018 (together with one or more related fee letters, the “Commitment Letter”). Subject to the terms and conditions set forth in the Commitment Letter, the lender parties thereto severally committed to provide 100% of up to $2.425 billion in aggregate principal amount of senior secured credit facilities of II-VI.
On March 4, 2019, II-VI entered into a Credit Agreement, dated as of March 4, 2019 (as amended, the “New Credit Agreement”), by and among the Company, Bank of America, N.A., as Administrative Agent, Swing Line Lender and an L/C Issuer, and the other lenders party thereto. II-VI also entered into Amendment No. 1 to Credit Agreement, dated as of May 24, 2019, by and among the Company, Bank of America, N.A., as Administrative Agent, and the other lenders party thereto, which includes the final results of the syndication of the Term A Facility (as defined below). Pursuant to the terms and subject to the conditions therein, the New Credit Agreement provides for senior secured financing of $1.705 billion in the aggregate, consisting of (i) a five-year senior secured first-lien term A loan facility in an aggregate principal amount of $1.255 billion (the “Term A Facility”) and (ii) a five-year senior secured first-lien revolving credit facility in an aggregate principal amount of $450.0 million (the “Revolving Credit Facility” and together with the Term A Facility, the “New Senior Credit Facilities”). The New Credit Agreement also provides for a letter of credit sub-facility not to exceed $25.0 million and a swing loan sub-facility initially not to exceed $20.0 million, subject to adjustment in accordance with the terms of the New Credit Agreement. II-VI anticipates using the proceeds from the Term A Facility, together with a separately committed term B loan facility in an
aggregate principal amount of up to $720.0 million (the “Term B Facility”) and cash and short-term investments of II-VI and Finisar, to pay the cash portion of the merger consideration payable in connection with the Merger and related fees and expenses. II-VI currently does not intend to draw on the Revolving Credit Facility in order to fund the cash portion of the merger consideration payable in connection with the Merger.
The funding obligations of the lenders under the New Senior Credit Facilities are subject to certain currently unsatisfied conditions, including the consummation of the Merger. Accordingly, no borrowings are currently outstanding under the New Senior Credit Facilities, and II-VI currently is not able to borrow under the New Senior Credit Facilities. Further, II-VI expects that the New Credit Agreement will be amended prior to the consummation of the Merger to reflect syndication of the Term B Facility and to finalize certain other terms in the New Credit Agreement. Upon the consummation of the Merger, the New Senior Credit Facilities, governed by the New Credit Agreement as it may be amended as of such time, will be used (i) to refinance in full the Amended Credit Facility (as defined in Note 9 to the Company’s Consolidated Financial Statements included in Item 8 of this Exhibit 99.1 to our Current Report on Form 8-K) and (ii) on or after the date of the consummation of the Merger, to repay amounts owed in connection with Finisar’s outstanding convertible notes, currently in an aggregate principal amount outstanding of $575.0 million, including with the proceeds of a portion of the Term A Facility which will be available to II-VI for a certain period after the initial funding under the New Senior Credit Facilities.
Unless and until the Merger is consummated and the other currently unsatisfied conditions to the funding obligations of the lenders under the New Senior Credit Facilities are satisfied or waived, the Amended Credit Facility remains in effect in accordance with its terms.
Critical Accounting Policies and Estimates
The preparation of financial statements and related disclosures in conformity with accounting principles generally accepted in the United States (“U.S. GAAP”) and the Company’s discussion and analysis of its financial condition and results of operations requires the Company’s management to make judgments, assumptions and estimates that affect the amounts reported in its Consolidated Financial Statements and accompanying notes. Note 1 of the Notes to our Consolidated Financial Statements contained in Item 8 of this Exhibit 99.1 to our Current Report on Form 8-K describes the significant accounting policies and accounting methods used in the preparation of the Company’s Consolidated Financial Statements. Management bases its estimates on historical experience and on various other assumptions that it believes to be reasonable under the circumstances, the results of which form the basis for making judgments about the carrying values of assets and liabilities. Actual results may differ from these estimates.
Management believes the Company’s critical accounting estimates are those related to business combinations, impairment of goodwill and indefinite-lived intangible assets, and income taxes. Management believes these estimates to be critical because they are both important to the portrayal of the Company’s financial condition and results of operations, and they require management to make judgments and estimates about matters that are inherently uncertain.
Management has discussed the development and selection of these critical accounting policies and estimates with the Audit Committee of the Board of Directors and the Audit Committee has reviewed the related disclosure. In addition, there are other items within our consolidated financial statements that require estimation, but are not deemed critical as described above. Changes in estimates used in these and other items could have a material impact on the consolidated financial statements.
Business Combinations
The Company accounts for business acquisitions under the acquisition method of accounting whereby the total purchase price was allocated to tangible and intangible assets acquired and liabilities assumed based on the respective fair values. The Company believes that the accounting estimates related to business combinations are “critical accounting estimates” because the Company must, in determining the fair value of assets acquired, make assumptions about the future performance of the acquired business, including among other things, the forecasted revenue attributable to the asset group. The valuation methodologies applied require the Company to determine a risk-adjusted discount rate that is reflective of the level of risk associated with these estimates to discount the forward-looking estimates to present value. Different assumptions may result in materially different values for these assets, which would impact the Company’s financial position and future results of operations.
The Company’s intangible assets are comprised of customer relationships and developed technology. The estimated fair value of the customer relationships and developed technology are determined using the multi-period excess earnings method and relief from royalty method, respectively. Both methods require forward looking estimates that are discounted to determine the fair value of the intangible asset using a risk-adjusted discount rate that is reflective of the level of risk associated with future estimates associated with the asset group.
Goodwill and Indefinite-Lived Intangibles
The Company tests goodwill and indefinite-lived intangible assets for impairment annually, and when events or changes in circumstances indicate that goodwill or indefinite-lived intangible assets might be impaired. Other intangible assets are amortized over their estimated useful lives. The determination of the estimated useful lives of other intangible assets and whether goodwill or indefinite-lived intangibles are impaired requires us to make judgments based on long-term projections of future performance. Estimates of fair value are based on our projection of revenues, operating costs and cash flows of each reporting unit, considering historical and anticipated results and general economic and market conditions and their projections. The fair values of the reporting units are determined using a discounted cash flow analysis based on historical and projected financial information as well as market analysis. The annual goodwill impairment analysis considers the financial projections of the reporting unit based on our most recently completed long-term strategic planning processes and also considers the current financial performance compared to our prior projections of the reporting unit. Changes in our internal structuring, financial performance, judgments and projections could result in an impairment of goodwill or indefinite-lived intangible assets. As of June 30, 2019, no reporting units are at risk for impairment, as the fair value of the reporting units substantially exceeds the carrying values.
The Company has the option to perform a qualitative assessment of goodwill prior to completing the quantitative assessment described above, to determine whether it is more likely than not that the fair value of a reporting unit is less than its carrying amount, including goodwill and other intangible assets. If the Company concludes that this is the case, it must perform the quantitative assessment. Otherwise, the Company will forego the quantitative assessment process and does not need to perform any further testing. The Company did not use the optional qualitative assessment during the years ended June 30, 2019 and 2018.
As a result of the purchase price allocations from our acquisitions, and due to our decentralized structure, our goodwill is included in multiple reporting units which are the same as the Company’s operating segments. Due to the cyclical nature of our business, and the other factors described in the section on Risk Factors set forth in Item 1A of our Annual Report on Form 10-K filed on August 16, 2019, the profitability of our individual reporting units may periodically be affected by downturns in customer demand, operational challenges and other factors. These factors may have a relatively more pronounced impact on the individual reporting units as compared to the Company as a whole, and might adversely affect the fair value of the individual reporting units. If material adverse conditions occur that impact one or more of our reporting units, our determination of future fair value might not support the carrying amount of one or more of our reporting units, and the related goodwill would need to be impaired. Based upon our annual quantitative goodwill and indefinite-lived intangible assets impairment tests, the Company did not record any impairment of goodwill or indefinite-lived intangible assets for the fiscal year ended June 30, 2019.
Income Taxes
The Company prepares and files tax returns based on its interpretation of tax laws and regulations and records estimates based on these judgments and interpretations. In the normal course of business, the Company’s tax returns are subject to examination by various taxing authorities, which may result in future tax, interest and penalty assessments by these authorities. Inherent uncertainties exist in estimates of many tax positions due to changes in tax law resulting from legislation, regulation and/or as concluded through the various jurisdictions’ tax court systems. The Company recognizes the tax benefit from an uncertain tax position only if it is more likely than not that the tax position will be sustained on examination by the taxing authorities, based on the technical merits of the position. The tax benefits recognized in the financial statements from such a position are measured based on the largest benefit that has a greater than 50% likelihood of being realized upon ultimate resolution. The amount of unrecognized tax benefits is adjusted for changes in facts and circumstances. For example, adjustments could result from significant amendments to existing tax law and the issuance of regulations or interpretations by the taxing authorities, new information obtained during a tax examination, or resolution of an examination. The Company believes that its estimates for uncertain tax positions are appropriate and sufficient to pay assessments that may result from examinations of its tax returns. The Company recognizes both accrued interest and penalties related to unrecognized tax benefits in income tax expense.
Management evaluates the realizability of deferred tax assets for each jurisdiction in which it operates. If the Company experiences cumulative pretax income in a particular jurisdiction in a three-year period including the current and prior two years, management normally concludes that the income tax assets will more likely than not be realizable and no valuation allowance is recognized, unless known or planned operating developments, or changes in tax laws, would lead management to conclude otherwise. However, if the Company experiences cumulative pretax losses in a particular jurisdiction in a three year period, management then considers a series of factors in the determination of whether the deferred tax assets can be realized.
The Company has recorded valuation allowances against certain of its deferred tax assets, primarily those that have been generated from net operating losses in certain foreign taxing jurisdictions and acquired U.S. carryforwards. In evaluating whether the Company would more likely than not recover these deferred tax assets, it has not assumed any future taxable income or tax planning strategies in the jurisdictions associated with these carry-forwards where history does not support such an assumption. Implementation of tax planning strategies to recover these deferred tax assets or future income generation in these jurisdictions could lead to the reversal of these valuation allowances and a reduction of income tax expense.
Fiscal Year 2019 Compared to Fiscal Year 2018
The Company aligns its organizational structure into the following two reporting segments for the purpose of making operational decisions and assessing financial performance: (i) Compound Semiconductors and (ii) Photonic Solutions. The Company is reporting financial information (revenue through operating income) for these reporting segments in this Exhibit 99.1 to our Current Report on Form 8-K.
The following table sets forth select items from our Consolidated Statements of Earnings for the years ended June 30, 2019 and 2018 ($ in millions except per share information):
| Year Ended June 30, 2019 |
Year Ended June 30, 2018 |
|||||||||||||||
| % of Revenues |
% of Revenues |
|||||||||||||||
| Total revenues |
$ | 1,362.4 | 100.0 | % | $ | 1,158.8 | 100.0 | % | ||||||||
| Cost of goods sold |
841.1 | 61.7 | 696.6 | 60.1 | ||||||||||||
|
|
|
|
|
|
|
|
|
|||||||||
| Gross margin |
521.3 | 38.3 | 462.2 | 39.9 | ||||||||||||
|
|
|
|
|
|
|
|
|
|||||||||
| Operating expenses: |
||||||||||||||||
| Internal research and development |
139.2 | 10.2 | 116.9 | 10.1 | ||||||||||||
| Selling, general and administrative |
233.5 | 17.1 | 208.6 | 18.0 | ||||||||||||
| Interest and other, net |
19.8 | 1.5 | 14.6 | 1.3 | ||||||||||||
|
|
|
|
|
|
|
|
|
|||||||||
| Earnings before income tax |
128.8 | 9.5 | 122.2 | 10.5 | ||||||||||||
| Income taxes |
21.3 | 1.6 | 34.2 | 3.0 | ||||||||||||
|
|
|
|
|
|
|
|
|
|||||||||
| Net earnings |
$ | 107.5 | 7.9 | % | $ | 88.0 | 7.5 | % | ||||||||
|
|
|
|
|
|||||||||||||
| Diluted earnings per share |
$ | 1.63 | $ | 1.35 | ||||||||||||
|
|
|
|
|
|||||||||||||
Executive Summary
Net earnings for fiscal year 2019 were $107.5 million ($1.63 per-share diluted), compared to $88.0 million ($1.35 per-share diluted) for fiscal year 2018. The increase in net earnings during the current fiscal year from fiscal year 2018 was primarily driven by incremental margin realized on the 18% revenue increase due primarily to strong demand from customers in the optical communications market. Offsetting the incremental margin on net earnings, the Company realized increased investments in internal research and development during the current fiscal year addressing new product development in growing mega-trend markets as well as higher selling, general and administrative expenses supporting the growing revenue base. During the current fiscal year, the Company incurred approximately $18.6 million in acquisition and integration expenses on its completed acquisitions as well as its pending acquisition of Finisar, which is included in selling, general and administrative expenses. The Company’s effective income tax rate of 16.6% was lower than the 28% effective tax rate for fiscal year 2018. The higher income tax rate in fiscal year 2018 was the result of the adoption of the Tax Act and the income tax expense associated with the transition tax.
Consolidated
Revenues. Revenues for the year ended June 30, 2019 increased 18% to $1,362.4 million, compared to $1,158.8 million for the prior fiscal year. The increase in revenues during the current fiscal year was driven by strong demand from customers across the majority of the Company’s business units. In particular, Photonic Solutions experienced a 31% revenue growth from the prior fiscal year, primarily driven by increased demand from customers in the optical communication market. Specifically, the segment saw increased demand for ROADM and other optical communication products addressing the growing deployment of 5G optical networks. Compound Semiconductors recorded an 8% revenue increase during the current fiscal year, driven by
strengthening demand for SiC substrate products addressing RF electronics and high-power switching and power conversion systems for automotive and communication end markets. In addition, this segment also realized increased revenues from its aerospace and defense products addressing strengthening demand from customers in the intelligence, surveillance and reconnaissance markets.
Gross margin. Gross margin for the year ended June 30, 2019 was $521.3 million, or 38.3%, of total revenues, compared to $462.2 million, or 39.9% of total revenues, for the same period last fiscal year. Gross margin as a percentage of revenues decreased 160 basis points compared to the prior fiscal year despite the 18% increase in revenues during this same period. The Company’s Photonic Solutions’ gross margin was negatively impacted by a shift in product mix to lower margin products while Compound Semiconductors experienced under-absorption of manufacturing costs for its 3D Sensing product line due to continued delays in the program and underutilization of capacity.
Internal research and development. Company-funded internal research and development (“IR&D”) expenses for the fiscal year ended June 30, 2019 were $139.2 million, or 10.2% of revenues, compared to $116.9 million, or 10.1% of revenues, last fiscal year. The increase in IR&D expenses is primarily due to the Company continuing to invest in new products and processes across all its businesses including investments in 5G technology, 3D Sensing and other engineered material applications. IR&D expenses as a percentage of revenues were consistent between both fiscal years, and the Company anticipates this percentage to continue to range between 10% and 15% of revenues as the Company continues investing in new product and process development.
Selling, general and administrative. Selling, general and administrative (“SG&A”) expenses for the year ended June 30, 2019 were $233.5 million, or 17.1% of revenues, compared to $208.6 million, or 18.0% of revenues, last fiscal year. During fiscal year 2019, the Company announced its intention to acquire Finisar, and incurred approximately $15.6 million of related transaction expenses. In addition to the transaction expenses, the Company incurred higher SG&A expenses to support its growing revenue base. The Company has been successful in capitalizing on synergies from its recent acquisitions to improve its operating leverage.
Interest and other, net. Interest and other, net for the year ended June 30, 2019 was expense of $19.8 million compared to expense of $14.6 million last fiscal year. Included in interest and other, net were interest expense on long-term borrowings, earnings from equity investments, interest income on excess cash reserves, unrealized gains and losses on the Company’s deferred compensation plan, and foreign currency gains and losses. The increase in interest and other, net was primarily due to increased interest expense during the current fiscal year of approximately $4.1 million due to the higher levels of outstanding debt.
Income taxes. The Company’s year-to-date effective income tax rate at June 30, 2019 was 16.6%, compared to an effective tax rate of 28.0% last fiscal year. The prior fiscal year’s effective tax rate was negatively impacted by the U.S. enacted tax legislation and the recording the provision for the transition tax under the new tax law.
Segment Reporting
Revenues and operating income for each of the Company’s reportable segments are discussed below. Operating income differs from income from operations in that operating income excludes certain operational expenses included in other expense (income) – net, as reported. Management believes operating income to be a useful measure for investors, as it reflects the results of segment performance over which management has direct control and is used by management in its evaluation of segment performance. See Note 14 to the Company’s Consolidated Financial Statements included in Item 8 of this Exhibit 99.1 to our Current Report on Form 8-K for further information on the Company’s reportable segments and for the reconciliation of operating income to net earnings, which is incorporated herein by reference.
Effective July 1, 2019, the Company realigned its composition of its operating segments. The Company combined II-VI Laser Solutions and II-VI Performance Products and renamed the combined segment Compound Semiconductors. All applicable segment information has been restated to reflect this change. Additionally, the Company changed the name of II-VI Photonics to Photonic Solutions.
Compound Semiconductors ($ in millions)
| Year Ended June 30, |
% Increase |
|||||||||||
| 2019 | 2018 | |||||||||||
| Revenues |
$ | 723.6 | $ | 672.3 | 8 | % | ||||||
| Operating income |
$ | 82.4 | $ | 73.6 | 12 | % | ||||||
Revenues for the fiscal year ended June 30, 2019 for Compound Semiconductors increased 8% to $723.6 million, compared to revenues of $672.3 million last fiscal year. The increase in revenues during the current fiscal year was primarily driven by increased demand for SiC products addressing RF electronics and high-power switching and power conversion systems for automotive and communication markets. In addition, the segment has seen increased demand for products and components for its thermoelectric and aerospace and defense markets.
Operating income for the fiscal year ended June 30, 2019 for Compound Semiconductors increased 12% to $82.4 million, compared to operating income of $73.6 million last fiscal year. The increase in operating income during the current fiscal year was primarily driven by incremental margin realized by increased sales volume, as well as favorable product mix toward higher margin products.
Photonic Solutions ($ in millions)
| Year Ended June 30, |
% Increase |
|||||||||||
| 2019 | 2018 | |||||||||||
| Revenues |
638.8 | 486.5 | 31 | % | ||||||||
| Operating income |
81.9 | 63.2 | 30 | % | ||||||||
The above operating results for the year ended June 30, 2019 include the Company’s acquisitions of CoAdna in September 2018 and the product line which was acquired in November 2018.
Revenues for the year ended June 30, 2019 for Photonic Solutions increased 31% to $638.8 million, compared to $486.5 million for last fiscal year. Included in the current year’s revenues were $12.4 million of revenues, excluding sales to customers through our sales offices, from the above acquisitions. Exclusive of these acquisitions, the increase in revenues was primarily attributed to increased demand for optical communication products driven by the China broadband initiative as China continues to build out its broadband networks. Specifically, the segment has seen increased demand for its ROADM and EDFA product lines to address this and other market demands, including the accelerating demand for 5G technology.
Operating income for the year ended June 30, 2019 for Photonic Solutions increased 30% to $81.9 million, compared to an operating income of $63.2 million last fiscal year. The increase in operating income was primarily due to incremental margin realized on increased revenues.
Fiscal Year 2018 Compared to Fiscal Year 2017
The following table sets forth select items from our Consolidated Statements of Earnings for the years ended June 30, 2018 and 2017. ($ millions, except per share information):
| Year Ended June 30, 2018 |
Year Ended June 30, 2017 |
|||||||||||||||
| % of Revenues |
% of Revenues |
|||||||||||||||
| Total revenues |
$ | 1,158.8 | 100.0 | % | $ | 972.0 | 100.0 | % | ||||||||
| Cost of goods sold |
696.6 | 60.1 | 583.7 | 60.1 | ||||||||||||
|
|
|
|
|
|
|
|
|
|||||||||
| Gross margin |
462.2 | 39.9 | 388.3 | 39.9 | ||||||||||||
|
|
|
|
|
|
|
|
|
|||||||||
| Operating expenses: |
||||||||||||||||
| Internal research and development |
116.9 | 10.1 | 96.8 | 10.0 | ||||||||||||
| Selling, general and administrative |
208.6 | 18.0 | 176.0 | 18.1 | ||||||||||||
| Interest and other, net |
14.6 | 1.3 | (3.3 | ) | (0.3 | ) | ||||||||||
|
|
|
|
|
|
|
|
|
|||||||||
| Earnings before income tax |
122.2 | 10.5 | 118.8 | 12.2 | ||||||||||||
| Income taxes |
34.2 | 3.0 | 23.5 | 2.4 | ||||||||||||
|
|
|
|
|
|
|
|
|
|||||||||
| Net earnings |
$ | 88.0 | 7.6 | % | $ | 95.3 | 9.8 | % | ||||||||
|
|
|
|
|
|||||||||||||
| Diluted earnings per shares |
$ | 1.35 | $ | 1.48 | ||||||||||||
|
|
|
|
|
|||||||||||||
Consolidated
Revenues. Revenues for the year ended June 30, 2018 increased 19% to $1,158.8 million, compared to $972.0 million for the fiscal year ended June 30, 2017. The increase in revenues during fiscal year 2018 were driven by strong demand from customers across all of the Company’s business segments. In particular, Compound Semiconductors realized a 26% revenue growth from the fiscal year 2017, driven by (i) increased demand from industrial based customers for CO2, fiber and direct diode optics and components and (ii) strengthening demand for SiC substrate products addressing RF electronics and high-power switching and power conversion systems for automotive, communication and aerospace and defense markets. This segment also recorded increased shipments of its VCSELs products addressing the growing consumer electronics, datacom and other developing end markets.
Gross margin. Gross margin as a percentage of revenues for the year ended June 30, 2018 was $462.2 million, or 39.9%, compared to $388.3 million, or 39.9%, for the fiscal year ended June 30, 2017. Gross margin as a percentage of revenues was consistent with the fiscal year 2017 due to a balance of operating efficiencies and investments to expand capacity. The Company’s Photonic Solutions’ gross margin was negatively impacted by both product mix and the effects of foreign currency.
Internal research and development. Company-funded internal research and development expenses for the year ended June 30, 2018 were $116.9 million, or 10.1% of revenues, compared to $96.8 million, or 10.0% of revenues, for the fiscal year ended June 30, 2017. The increase in IR&D expenses is primarily the result of the acquisition of Kaiam Laser Limited, acquired in August 2017, which contributed $14.6 million of expense.
Selling, general and administrative. SG&A expenses for the fiscal year ended June 30, 2018 were $208.6 million, or 18.0% of revenues, compared to $176.0 million, or 18.1% of revenues, for the fiscal year ended June 30, 2017. SG&A expenses includes $3.7 million and $2.5 million, respectively, for the combined acquisitions of II-VI Integrated Photonics Inc. (“IPI”), acquired in June 2017, and Kaiam Laser Limited, acquired in August 2017. Exclusive of these acquisitions, the increase in SG&A expenses is primarily due to increased operating costs to support the Company’s growing revenue and infrastructure base, as well as its ongoing merger and acquisition strategy.
Interest and other, net. Interest and other, net for the year ended June 30, 2018 was expense of $14.6 million compared to income of $3.3 million for the year ended June 30, 2017. Interest expense increased $11.5 million due to the higher levels of the Company’s outstanding debt. The majority of the interest expense increase was related to the Company’s $345.0 million aggregate principal amount of convertible notes issued in August 2017. The Company recognized $10.8 million of interest and amortization of debt discounts and issuance costs. Other income during fiscal year 2017 included approximately $7.0 million of income from earn-out and technology transfer agreements from the Company’s sale of its ANADIGICS’ RF business.
Income taxes. The Company’s year-to-date effective income tax rate at June 30, 2018 was 28.0%, compared to an effective tax rate of 19.8% at June 30, 2017. The variation between the Company’s effective tax rate and the U.S. statutory rate was primarily due to the Company’s foreign operations, which are subject to income taxes at lower statutory rates. The increase in the fiscal year 2018’s effective tax rate is the result of approximately $8.0 million of increased income tax expense relating to repatriation on foreign source earnings.
Compound Semiconductors ($ in millions)
| Year Ended June 30, |
% Increase |
|||||||||||
| 2018 | 2017 | |||||||||||
| Revenues |
$ | 672.3 | $ | 531.7 | 26 | % | ||||||
| Operating income |
$ | 73.6 | $ | 49.1 | 50 | % | ||||||
The Company’s Compound Semiconductors segment includes the operations of Kaiam Laser Limited (now operating under II-VI Compound Semiconductors, Ltd.). The Company acquired II-VI Compound Semiconductors, Ltd. in August 2017.
Revenues for the year ended June 30, 2018 for Compound Semiconductors increased 26% to $672.3 million, compared to $531.7 million for fiscal year ended June 30, 2017. The increase in revenues from fiscal year 2017 was the result of increased demand from industrial based customers for the Company’s CO2, fiber and direct diode laser optics and components and increased demand for SiC products addressing RF electronics and high-power switching and power conversion systems for automotive and communication markets. In addition, the segment has also seen increased demand for its CVD diamond optics used in the EUV lithography markets, as well as VCSELs used in consumer electronics, datacom and other end markets. The segment also saw increased demand for products and components for the semiconductor capital equipment and aerospace and defense markets.
Operating income for the year ended June 30, 2018 for Compound Semiconductors increased 50% to $73.6 million, compared to $49.1 million for fiscal year June 30, 2017. The increase in operating income during fiscal year 2018 was the result of incremental margins realized from increased capacity utilization, increase in mix of higher margin products, offset somewhat by greater investment in growth markets.
Photonic Solutions ($ in millions)
| % | ||||||||||||
| Year Ended June 30, |
Increase (Decrease) |
|||||||||||
| 2018 | 2017 | |||||||||||
| Revenues |
$ | 486.5 | $ | 440.4 | 10 | % | ||||||
| Operating income |
$ | 63.2 | $ | 66.5 | (5 | )% | ||||||
The above operating results for the year ended June 30, 2018 include the Company’s acquisition of IPI, which was acquired in June 2017.
Revenues for the year ended June 30, 2018 for Photonic Solutions increased 10% to $486.5 million, compared to $440.4 million for the fiscal year ended June 30, 2017. Exclusive of IPI, the increase in revenues was primarily attributed to increased demand of optics and optic assemblies for applications for industrial laser products. In addition, the segment realized increased demand for transport and amplification component products, including its 980 nm pumps.
Operating income for the year ended June 30, 2018 for Photonic Solutions decreased 5% to $63.2 million, compared to an operating income of $66.5 million for the fiscal year ended June 30, 2017. The increase in operating income was primarily due to incremental margin realized on increased revenues but significantly offset by mix shifts and negative foreign exchange effects.
LIQUIDITY AND CAPITAL RESOURCES
Historically, our primary sources of cash have been provided through operations and long-term borrowings. Other sources of cash include proceeds received from the exercise of stock options and sales of equity investments and businesses. Our historical uses of cash have been for capital expenditures, investments in research and development, business acquisitions, payments of
principal and interest on outstanding debt obligations, debt issuance costs, payments in satisfaction of employees’ minimum tax obligations and purchases of treasury stock. Supplemental information pertaining to our sources and uses of cash is presented as follows:
Sources (uses) of Cash (millions):
| Year Ended June 30, |
2019 | 2018 | 2017 | |||||||||
| Net cash provided by operating activities |
$ | 178.5 | $ | 161.0 | $ | 118.6 | ||||||
| Net proceeds on long-term borrowings |
15.0 | 153.0 | 104.0 | |||||||||
| Proceeds from exercises of stock options |
8.7 | 10.5 | 15.1 | |||||||||
| Additions to property, plant & equipment |
(137.1 | ) | (153.4 | ) | (138.5 | ) | ||||||
| Purchases of businesses, net of cash acquired |
(83.1 | ) | (80.5 | ) | (40.0 | ) | ||||||
| Payments in satisfaction of employees’ minimum tax obligations |
(7.1 | ) | (6.6 | ) | (4.1 | ) | ||||||
| Debt issuance costs |
(5.6 | ) | (10.1 | ) | — | |||||||
| Purchases of equity investments |
(4.5 | ) | (52.1 | ) | — | |||||||
| Payment on earnout consideration |
(4.5 | ) | — | (2.0 | ) | |||||||
| Purchases of treasury stock |
(1.6 | ) | (49.9 | ) | — | |||||||
| Effect of exchange rate changes on cash and cash equivalents and other |
(0.8 | ) | 3.2 | 0.3 | ||||||||
Net cash provided by operating activities:
Net cash provided by operating activities was $178.5 million and $161.0 million for the fiscal years ended June 30, 2019 and 2018, respectively. The increase in cash provided by operations during the current fiscal year was due to a combination of higher net earnings as well as non-cash items such as depreciation, amortization, and share-based compensation expense and improved working capital management of accounts payable.
Net cash provided by operating activities was $161.0 million and $118.6 million for the fiscal years ended June 30, 2018 and 2017, respectively. The increase in cash provided by operating activities during fiscal year 2018 was due to a combination of higher net earnings as well as non-cash items such as depreciation, amortization and share-based compensation expense and better working capital management of accounts payable, income tax payable and other operating net assets.
Net cash used in investing activities:
Net cash used in investing activities was $224.0 million and $285.0 million for the fiscal years ended June 30, 2019 and 2018, respectively. The decrease in cash used in investing activities was the result of lower level of investments in property, plant & equipment as the Company continues to strategically allocate resources.
Net cash used in investing activities was $285.0 million and $177.2 million for the fiscal years ended June 30, 2018 and 2017, respectively. The increase in cash used in investing activities was the result of higher level of investments in property, plant & equipment to continue to build capacity to meet the growing demand for the Company’s product portfolio. In addition, the Company completed several strategic investments in both wholly and majority owned investments during fiscal year 2018, totaling approximately $132.6 million.
Net cash provided by financing activities:
Net cash provided by financing activities was $4.9 million for the year ended June 30, 2019 compared to net cash provided by financing activities of $97.0 million for the year ended June 30, 2018. During the current fiscal year, the Company had net borrowings of $15.0 million. The Company realized $8.7 million of proceeds received from the exercise of stock options offset, by $7.1 million of cash payments in satisfaction of employees’ minimum tax obligations on the vesting of the Company’s restricted and performance shares during the current fiscal year. In addition, the Company incurred approximately $1.6 million of purchases of treasury stock and $5.6 million of debt issuance costs associated with its pending financing of the cash consideration payable in connection with its Finisar acquisition.
Net cash provided by financing activities was $97.0 million for the year ended June 30, 2018 compared to net cash provided by financing activities of $111.6 million for the year ended June 30, 2017. During fiscal year 2018, the Company completed its
offering and sale of $345 million aggregate principal amount of convertible notes. In addition, the Company borrowed $100.0 million on its revolving credit facility to fund investments in capital expenditures and research and development to address new and growing technology platforms. The net proceeds from the convertible debt offering as well as cash generated from operations was used to repay $272.0 million on the Company’s revolving credit facility under the Amended Credit Facility (as defined below), $20.0 million on the Company’s term loan under the Amended Credit Facility and $10.1 million of convertible debt issuance costs. The Company also utilized $49.9 million of net proceeds from its offering and sale of its convertible notes to repurchase 1,414,900 shares of its common stock. The Company realized $10.5 million of proceeds received from exercises of stock options, offset by $6.6 million of cash payments in satisfaction of employees’ minimum tax obligations on the vesting of the Company’s restricted and performance shares during fiscal year 2018.
0.25% Convertible Senior Notes
On August 24, 2017, the Company entered into a purchase agreement with Merrill Lynch, Pierce, Fenner & Smith Incorporated, as representative of the several initial purchasers named therein (collectively, the “Initial Purchasers”), to issue and sell $300 million aggregate principal amount of our 0.25% convertible senior notes due 2022 (the “Notes”) in a private placement to qualified institutional buyers within the meaning of Rule 144A under the Securities Act of 1933, as amended. In addition, we granted the Initial Purchasers a 30-day option to purchase up to an additional $45 million aggregate principal amount of the Notes (the “Over-Allotment Option”).
On August 29, 2017, the Initial Purchasers exercised their Over-Allotment Option to purchase the entire $45 million in aggregate principal amount of additional Notes. The Notes mature on September 1, 2022, unless earlier repurchased by the Company or converted by holders in accordance with the terms of the Notes. Interest is payable semi-annually in arrears on March 1 and September 1 of each year, beginning on March 1, 2018.
The sale of the Notes to the Initial Purchasers settled on August 29, 2017, and resulted in approximately $336 million in net proceeds to the Company after deducting the initial purchasers’ discount and the offering expenses. The net proceeds from the offering and sale of the Notes were used, in part, to repurchase approximately $49.9 million of our common stock. The Company used the remaining net proceeds to repay $252 million on its revolving credit facility and to pay debt issuance costs of $10.1 million.
The Notes are governed by an Indenture between the Company, as issuer, and U.S. Bank, National Association, as trustee. The Notes are our senior unsecured obligations and rank senior in right of payment to any of our indebtedness that is expressly subordinated in right of payment to the Notes; equal in right of payment to any of our indebtedness that is not so subordinated; effectively junior in right of payment to any of our secured indebtedness to the extent of the value of the assets securing such indebtedness; and structurally junior to all indebtedness and other liabilities (including trade payables) of our subsidiaries. In the event of our bankruptcy, liquidation, reorganization or other winding up, our assets that secure secured debt will be available to pay obligations on the Notes only after all indebtedness under such secured debt has been repaid in full from such assets. Upon conversion, the Company will pay or deliver, as the case may be, cash, shares of our common stock or a combination of cash and shares of our common stock, at the Company’s election.
As a result of our cash conversion option, the Company separately accounted for the value of the embedded conversion option as a debt discount. The value of the embedded conversion option was determined based on the estimated fair value of the debt without the conversion feature, which was determined using an expected present value technique (income approach) to estimate the fair value of similar nonconvertible debt; the debt discount is being amortized as additional non-cash interest expense over the term of the Notes using the effective interest method with an effective interest rate of 4.5% per annum.
The equity component is not remeasured as long as it continues to meet the conditions for equity classification. The initial conversion rate is 21.25 shares of common stock per $1,000 principal amount of Notes, which is equivalent to an initial conversion price of $47.06 per share of common stock. Throughout the term of the Notes, the conversion rate may be adjusted upon the occurrence of certain events. The if-converted value of the Notes amounted to $268 million as of June 30, 2019 (based on the Company’s closing stock price on the last trading day of the year ended June 30, 2019).
Holders of the Notes will not receive any cash payment representing accrued and unpaid interest upon conversion of a note. Accrued but unpaid interest will be deemed to be paid in full upon conversion rather than cancelled, extinguished or forfeited.
Prior to the close of business on the business day immediately preceding June 1, 2022, the Notes will be convertible only upon satisfaction of at least one of the conditions as follows:
| a) | During any fiscal quarter (and only during such fiscal quarter), if the last reported sale price of our common stock for at least 20 trading days (whether or not consecutive) during a period of 30 consecutive trading days ending on the last trading day of the immediately preceding quarter is greater than or equal to 130% of the conversion price on each applicable trading day; |
| b) | During the five business day period after any five consecutive trading day period (the “measurement period”) in which the trading price per $1,000 principal amount of Notes for each trading day of the measurement period was less than 98% of the product of the last reported sale price of our common stock and the conversion rate on each such trading day; or |
| c) | Upon the occurrence of specified corporate events. |
On or after June 1, 2022 until the close of business on the business day immediately preceding the maturity date, holders may convert all or any portion of their Notes, in multiples of $1,000 principal amount, at the option of the holder regardless of the foregoing circumstances.
As of June 30, 2019, the Notes are not convertible. The Notes will become convertible upon the satisfaction of at least one of the above conditions. In accounting for the transaction costs related to the Note issuance, the Company allocated the total amount of offering costs incurred to the debt and equity components based on their relative values. Offering costs attributable to the debt component, totaling $8.4 million, are being amortized as non-cash interest expense over the term of the Notes, and offering costs attributable to the equity component, totaling $1.7 million, were recorded within Shareholders’ equity.
The Company was in compliance with all the covenants set forth under the indenture as of June 30, 2019.
The following table sets forth total interest expense recognized related to the Notes for the fiscal years ended June 30, 2019 and 2018 (representing an effective interest rate of 4.5%):
| Year ended June 30, |
2019 | 2018 | ||||||
| 0.25% contractual coupon |
$ | 874 | $ | 731 | ||||
| Amortization of debt discount and debt issuance costs including initial purchaser discount |
12,550 | 10,058 | ||||||
|
|
|
|
|
|||||
| Interest expense |
$ | 13,424 | $ | 10,789 | ||||
|
|
|
|
|
|||||
The unamortized discount amounted to $38.3 million as of June 30, 2019 and is being amortized over the remaining period of three years.
Amended Credit Facility
On July 28, 2016, the Company amended and restated its existing credit agreement. The Third Amended and Restated Credit Agreement (the “Amended Credit Facility”) provides for a revolving credit facility of $325 million, as well as a $100 million term loan. The term loan is being repaid in consecutive quarterly principal payments on the first business day of each January, April, July and October, with the first payment having commenced on October 1, 2016, as follows: (i) twenty consecutive quarterly installments of $5 million and (ii) a final installment of all remaining principal due and payable on the maturity date of July 27, 2021. Amounts borrowed under the revolving credit facility are due and payable on the maturity date. The Amended Credit Facility is unsecured, but is guaranteed by each existing and subsequently acquired or organized wholly-owned domestic subsidiary of the Company. The Company has the option to request an increase to the size of the revolving credit facility in an aggregate additional amount not to exceed $100 million. The Amended Credit Facility has a five-year term through July 27, 2021 and has an interest rate of either a Base Rate Option or a Euro-Rate Option, plus an Applicable Margin, as defined in the agreement governing the Amended Credit Facility. If the Base Rate option is selected for a borrowing, the Applicable Margin is 0.00% to 1.25% and if the Euro-Rate Option is selected for a borrowing, the Applicable Margin is 1.00% to 2.25%. The Applicable Margin is based on the ratio of the Company’s consolidated indebtedness to consolidated EBITDA. Additionally, the Amended Credit Facility is subject to certain covenants, including those relating to minimum interest coverage and maximum leverage ratios. As of June 30, 2019, the Company was in compliance with all financial covenants under its Amended Credit Facility.
Yen Loan
The Company’s yen denominated line of credit is a 500 million Yen ($4.6 million) facility. The Yen line of credit matures in August 2020. The interest rate is equal to LIBOR, as defined in the loan agreement, plus 0.625% to 1.75%. At June 30, 2019 and 2018, the Company had 300 million Yen outstanding under the line of credit. Additionally, the facility is subject to certain covenants, including those relating to minimum interest coverage and maximum leverage ratios. As of June 30, 2019, the Company had $2.8 million outstanding and was in compliance with all covenants under its Yen facility.
Aggregate Availability
The Company had aggregate availability of $211.9 million and $246.4 million under its lines of credit as of June 30, 2019 and 2018, respectively. The amounts available under the Company’s lines of credit are reduced by outstanding letters of credit. Total outstanding letters of credit supported by the credit facilities were immaterial for fiscal year 2019 and $0.4 million for fiscal year 2018, respectively.
Weighted Average Interest Rate
The weighted average interest rate of total borrowings was 1.6% and 1.3% for the years ended June 30, 2019 and 2018, respectively. The weighted average of total borrowings for the fiscal years ended June 30, 2019 and 2018 was $533.9 million and $476.6 million, respectively.
Share Repurchase Programs
In August 2017, in conjunction with the Company’s offering and sale of the Notes, the Company’s Board of Directors authorized the Company to purchase up to $50 million of its common stock with a portion of the net proceeds received from the offering and sale of the Notes. The shares that were purchased by the Company pursuant to this authorization were retained as treasury stock and are available for general corporate purposes. The Company purchased 1,414,900 shares of its common stock for approximately $49.9 million pursuant to this authorization.
In August 2014, the Company’s Board of Directors authorized the Company to purchase up to $50 million of its common Stock through a share repurchase program (the “Program”) that calls for shares to be purchased in the open market or in private transactions from time to time. The Program has no expiration and may be suspended or discontinued at any time. Shares purchased by the Company are retained as treasury stock and available for general corporate purposes. As of June 30, 2019, the Company has cumulatively purchased 1,366,587 shares of its common stock pursuant to the Program for approximately $20.7 million.
Our cash position, borrowing capacity and debt obligations are as follows (in millions):
| June 30, 2019 |
June 30, 2018 |
|||||||
| Cash and cash equivalents |
$ | 204.9 | $ | 247.0 | ||||
| Available borrowing capacity |
211.9 | 246.4 | ||||||
| Total debt obligations |
467.0 | 439.0 | ||||||
The Company believes cash flow from operations, existing cash reserves and available borrowing capacity from its credit facilities will be sufficient to fund its needs for working capital, capital expenditures, repayment of scheduled long-term borrowings and capital lease obligations, investments in internal research and development, share repurchases, acquisition and integration expenses for the pending Finisar acquisition, and internal and external growth objectives at least through fiscal year 2020.
The Company’s cash and cash equivalent balances are generated and held in numerous locations throughout the world, including amounts held outside the United States. As of June 30, 2019, the Company held approximately $173 million of cash and cash equivalents outside of the United States. Cash balances held outside the United States could be repatriated to the United States. The Tax Act created significant changes to the taxation of undistributed foreign earnings and has changed our future intentions regarding repatriation of earnings.
Off-Balance Sheet Arrangements
The Company’s off-balance sheet arrangements include the operating lease obligations and the purchase obligations disclosed in the contractual obligations table below, as well as letters of credit as discussed in Note 9 to the Company’s Consolidated Financial Statements included in Item 8 of this Exhibit 99.1 to our Current Report on Form 8-K. The Company enters into these off-balance sheet arrangements to acquire goods and services used in its business.
Tabular Disclosure of Contractual Obligations
| Payments Due By Period | ||||||||||||||||||||
| Less Than 1 |
1-3 | 3-5 | More Than 5 |
|||||||||||||||||
| Contractual Obligations |
Total | Year | Years | Years | Years | |||||||||||||||
| ($000) |
||||||||||||||||||||
| Long-term debt obligations |
$ | 511,617 | $ | 23,834 | $ | 142,783 | $ | 345,000 | $ | — | ||||||||||
| Interest payments(1) |
25,321 | 8,590 | 10,134 | 2,394 | 4,203 | |||||||||||||||
| Capital lease obligation |
24,360 | 1,021 | 2,426 | 3,000 | 17,913 | |||||||||||||||
| Operating lease obligations(2) |
119,900 | 23,000 | 32,000 | 20,900 | 44,000 | |||||||||||||||
| Purchase obligations(3)(4) |
37,012 | 32,048 | 4,964 | — | — | |||||||||||||||
|
|
|
|
|
|
|
|
|
|
|
|||||||||||
| Total |
$ | 718,210 | $ | 88,493 | $ | 192,307 | $ | 371,294 | $ | 66,116 | ||||||||||
|
|
|
|
|
|
|
|
|
|
|
|||||||||||
| (1) | Interest payments represent both variable and fixed rate interest obligations based on the interest rate in place at June 30, 2019, relating to the Amended Credit Facility, the Notes and interest relating to the Company’s capital lease obligation. |
| (2) | Includes an obligation for the use of three parcels of land related to II-VI Performance Metals. The lease obligations extend through years 2039, 2056, and 2061, respectively. |
| (3) | A purchase obligation is defined as an agreement to purchase goods or services that is enforceable and legally binding on the Company and that specifies all significant terms, including fixed or minimum quantities to be purchased; minimum or variable price provisions, and the approximate timing of the transaction. These amounts are primarily comprised of open purchase order commitments to vendors for the purchase of supplies and materials. |
| (4) | Includes cash earn out opportunities based on certain acquisitions’ achieving agreed-upon financial, operational and technology targets, and the value of the net purchase option for the Company’s Equity Investment in a Privately Held Company. |
Pension obligations are not included in the table above. The Company expects defined benefit plan employer contributions to be $3.0 million in 2020. Estimated funding obligations are determined by asset performance, workforce and retiree demographics, tax and employment laws and other actuarial assumptions which may change the annual funding obligations. The funded status of our defined benefit plans is disclosed in Note 17 to the Company’s Consolidated Financial Statements included in item 8 of this Exhibit 99.1 to our Current Report on Form 8-K.
The gross unrecognized income tax benefits at June 30, 2019, which are excluded from the above table, were $12.7 million. The Company is not able to reasonably estimate the amount by which the liability will increase or decrease over time; however, at this time, the Company does not expect a significant payment related to these obligations within the next fiscal year.
| Item 8. | FINANCIAL STATEMENTS AND SUPPLEMENTARY DATA |
MANAGEMENT’S REPORT ON INTERNAL CONTROL OVER FINANCIAL REPORTING
Management’s Responsibility for Preparation of the Financial Statements
Management is responsible for the preparation of the consolidated financial statements included in this Annual Report on Form 10-K. The consolidated financial statements were prepared in accordance with the accounting principles generally accepted in the United States of America and include amounts that are based on the best estimates and judgments of management. The other financial information contained in this Annual Report on Form 10-K is consistent with the consolidated financial statements.
Management’s Report on Internal Control Over Financial Reporting
Management is responsible for establishing and maintaining adequate internal control over financial reporting. The Company’s internal control system is designed to provide reasonable assurance concerning the reliability of the financial data used in the preparation of the Company’s consolidated financial statements, as well as reasonable assurance with respect to safeguarding the Company’s assets from unauthorized use or disposition.
All internal control systems, no matter how well designed, have inherent limitations. Therefore, even those systems determined to be effective can provide only reasonable assurance with respect to financial statement presentation and other results of such systems.
Management conducted an evaluation of the effectiveness of the Company’s internal control over financial reporting as of June 30, 2019. In making this evaluation, management used the criteria set forth by the Committee of Sponsoring Organizations of the Treadway Commission (COSO) in Internal Control – Integrated Framework (2013). Management’s evaluation included reviewing the documentation of its controls, evaluating the design effectiveness of controls and testing their operating effectiveness. Management excluded from the scope of its assessment of internal control over financial reporting the internal controls of CoAdna Holdings, Inc., which was acquired in September 2018, and Redstone Aerospace Corporation, which was acquired in March 2019. The recent acquisitions excluded from management’s assessment of internal controls over financial reporting represented approximately $98.1 million and $84.1 million of total assets and net assets, respectively, as of June 30, 2019 and approximately $15.5 million and $1.2 million of total revenues and net loss, respectively, for the fiscal year then ended. Based on the evaluation, management concluded that as of June 30, 2019, the Company’s internal controls over financial reporting were effective.
Ernst & Young LLP, an independent registered public accounting firm, has issued its report on the effectiveness of our internal control over financial reporting as of June 30, 2019. Its report is included herein.
Report of Independent Registered Public Accounting Firm
To the Board of Directors and Shareholders of II-VI Incorporated and Subsidiaries
Opinion on the Financial Statements
We have audited the accompanying consolidated balance sheets of II-VI Incorporated and Subsidiaries (the Company) as of June 30, 2019 and 2018, the related consolidated statements of earnings, comprehensive income, shareholders’ equity and cash flows for each of the three years in the period ended June 30, 2019, and the related notes and the financial statement schedule listed in the Index at Item 15(a)(2) (collectively referred to as the “consolidated financial statements”). In our opinion, the consolidated financial statements present fairly, in all material respects, the financial position of the Company at June 30, 2019 and 2018, and the results of its operations and its cash flows for each of the three years in the period ended June 30, 2019, in conformity with U.S. generally accepted accounting principles.
We also have audited, in accordance with the standards of the Public Company Accounting Oversight Board (United States) (PCAOB), the Company’s internal control over financial reporting as of June 30, 2019, based on criteria established in Internal Control-Integrated Framework issued by the Committee of Sponsoring Organizations of the Treadway Commission (2013 framework) and our report dated August 16, 2019 expressed an unqualified opinion thereon.
Basis for Opinion
These financial statements are the responsibility of the Company’s management. Our responsibility is to express an opinion on the Company’s financial statements based on our audits. We are a public accounting firm registered with the PCAOB and are required to be independent with respect to the Company in accordance with the U.S. federal securities laws and the applicable rules and regulations of the Securities and Exchange Commission and the PCAOB.
We conducted our audits in accordance with the standards of the PCAOB. Those standards require that we plan and perform the audit to obtain reasonable assurance about whether the financial statements are free of material misstatement, whether due to error or fraud. Our audits included performing procedures to assess the risks of material misstatement of the financial statements, whether due to error or fraud, and performing procedures that respond to those risks. Such procedures included examining, on a test basis, evidence regarding the amounts and disclosures in the financial statements. Our audits also included evaluating the accounting principles used and significant estimates made by management, as well as evaluating the overall presentation of the financial statements. We believe that our audits provide a reasonable basis for our opinion.
Critical Audit Matters
The critical audit matters communicated below are matters arising from the current period audit of the financial statements that were communicated or required to be communicated to the audit committee and that: (1) relate to accounts or disclosures that are material to the financial statements and (2) involved our especially challenging, subjective, or complex judgments. The communication of critical audit matters does not alter in any way our opinion on the consolidated financial statements, taken as a whole, and we are not, by communicating the critical audit matters below, providing separate opinions on the critical audit matters or on the accounts or disclosures to which they relate.
| Accounting for acquisition of CoAdna Holdings, Inc. | ||
| Description of the Matter | As discussed in Note 3 to the consolidated financial statements, during the year ended June 30, 2019, the Company completed the acquisition of CoAdna Holdings, Inc (“CoAdna”) for a total purchase price of approximately $42.8 million, net of cash acquired. The acquisition was accounted for under the acquisition method of accounting whereby the total purchase price was allocated to tangible and intangible assets acquired and liabilities assumed based on the respective fair values. | |
| Auditing the Company’s accounting for its acquisition of CoAdna was complex due to the significant estimation uncertainty in determining the fair value of identified intangible assets, which principally consisted of customer relationships and developed technology. The significant estimation uncertainty was primarily due to the sensitivity of the respective fair values to underlying assumptions about the future performance of the acquired business which rely upon innovation and growth within the optical communications market and applicability of the existing offerings to future technologies. The Company used the multi-period excess earnings method and the relief from royalty method to value the customer relationships and developed technology, respectively. The significant assumptions used to estimate the fair value of the customer relationships included the forecasted revenue and earnings generated by the customer relationships and a discount rate that reflected the level of risk associated with the future cash flows attributable to the customer relationships. The significant assumptions used to estimate the fair value of the developed technology included the forecasted revenue generated by the asset group and a discount rate that reflected the level of risk associated with the future revenue attributable to the developed technology. These significant assumptions are forward-looking and could be affected by future economic and market conditions. | ||
| How We Addressed the Matter in Our Audit | We tested controls that address the risks of material misstatement relating to the valuation of the customer relationships and developed technology. For example, we tested controls over management’s review of the significant assumptions, such as the acquired business’s forecasted revenue and earnings and the discount rates used in the valuation.
To test the estimated fair value of the acquired customer relationships and developed technology, our audit procedures included, among others, assessing the appropriateness of the valuation methodologies and testing the significant assumptions discussed above and the underlying data used by the Company. For example, we compared the forecasted revenue and earnings to current industry and economic trends as well as the historic financial performance of the acquired business and its primary customers, and compared the projected revenue growth to the assumptions used in the valuation of the Company’s Photonic Solutions reporting unit. We also performed sensitivity analyses to evaluate the changes in the fair value of the intangible assets that would result from changes in the significant assumptions. We involved our valuation specialist to assist in evaluating the valuation techniques and discount rate used to value the customer relationships and developed technology, which included comparison of the selected discount rate to the acquired business’s weighted average cost of capital, an evaluation of the relationship of the weighted average cost of capital, internal rate of return and weighted-average return on assets, and consideration of implied deal multiples exhibited by recent transactions of guideline public companies. | |
| Accounting for acquisition of Redstone Aerospace Corporation | ||
| Description of the Matter | As discussed in Note 3 to the consolidated financial statements, during the year ended June 30, 2019, the Company completed the acquisition of Redstone Aerospace Corporation (“Redstone”) for a total purchase price of approximately $29.7 million, net of cash acquired. The acquisition was accounted for under the acquisition method of accounting whereby the total purchase price was allocated to tangible and intangible assets acquired and liabilities assumed based on the respective fair values.
Auditing the Company’s accounting for its acquisition of Redstone was complex due to the significant estimation uncertainty in determining the fair value of identified intangible assets, which principally consisted of developed technology. The significant estimation uncertainty was primarily due to the sensitivity of the respective fair value to underlying assumptions about the future performance of the acquired business which rely upon significant revenue growth arising from accelerating the deployment and expansion of the acquired business’s operating capacity as well as market-participant based revenue synergies. The Company used the relief from royalty method to value the developed technology. The significant assumptions used to estimate the fair value of the developed technology included the forecasted revenue generated by the asset group and a discount rate that reflected the level of risk associated with the future revenue attributable to the developed technology. These significant assumptions are forward-looking and could be affected by future economic and market conditions. | |
| How We Addressed the Matter in Our Audit | We tested controls that address the risks of material misstatement relating to the valuation of the developed technology. For example, we tested controls over management’s review of the significant assumptions, such as the acquired business’s forecasted revenue and the discount rate used in the valuation.
To test the estimated fair value of the acquired developed technology, our audit procedures included, among others, assessing the appropriateness of the valuation methodology and testing the significant assumptions discussed above and the underlying data used by the Company. For example, we compared the forecasted revenue growth rate to current industry and economic trends and performed sensitivity analyses to evaluate the changes in the fair value of the intangible asset that would result from changes in the significant assumptions, including the timing of projected revenue growth. We involved our valuation specialist to assist in evaluating the valuation techniques and discount rate used to value the developed technology, which included comparison of the selected discount rate to the acquired business’s weighted average cost of capital, an evaluation of the relationship of the weighted average cost of capital, internal rate of return and weighted-average return on assets, and consideration of guideline public company benchmarking analyses reflecting the composition of purchase prices for similar transactions. | |
/s/ Ernst & Young LLP
We have served as the Company’s auditor since 2008.
Pittsburgh, Pennsylvania
August 16, 2019, except for the effects of the operating segment realignment disclosed in Note 14, as to which the date is June 29, 2020
Report of Independent Registered Public Accounting Firm
To the Board of Directors and Shareholders of II-VI Incorporated and Subsidiaries
Opinion on Internal Control over Financial Reporting
We have audited II-VI Incorporated and Subsidiaries’ internal control over financial reporting as of June 30, 2019, based on criteria established in Internal Control-Integrated Framework issued by the Committee of Sponsoring Organizations of the Treadway Commission (2013 framework) (the COSO criteria). In our opinion, II-VI Incorporated and Subsidiaries (the Company) maintained, in all material respects, effective internal control over financial reporting as of June 30, 2019, based on the COSO criteria.
As indicated in the accompanying Management’s Report on Internal Control Over Financial Reporting, management’s assessment of and conclusion on the effectiveness of internal control over financial reporting did not include the internal controls of CoAdna Holdings, Inc. (“CoAdna”) and Redstone Aerospace Corporation (“Redstone”), which are included in the June 30, 2019 consolidated financial statements of the Company and constituted $98.1 million and $84.1 million of total and
net assets, respectively, as of June 30, 2019 and $15.5 million and $1.2 million of revenues and net loss, respectively, for the fiscal year then ended. Our audit of internal control over financial reporting of the Company also did not include an evaluation of the internal control over financial reporting of CoAdna and Redstone.
We also have audited, in accordance with the standards of the Public Company Accounting Oversight Board (United States) (PCAOB), the consolidated balance sheets of the Company as of June 30, 2019 and 2018, the related consolidated statements of earnings, comprehensive income, shareholders’ equity and cash flows for each of the three years in the period ended June 30, 2019, and the related notes and the financial statement schedule listed in the Index at Item 15(a)(2) and our report dated August 16, 2019 expressed an unqualified opinion thereon.
Basis for Opinion
The Company’s management is responsible for maintaining effective internal control over financial reporting and for its assessment of the effectiveness of internal control over financial reporting included in the accompanying Management’s Report on Internal Control Over Financial Reporting. Our responsibility is to express an opinion on the Company’s internal control over financial reporting based on our audit. We are a public accounting firm registered with the PCAOB and are required to be independent with respect to the Company in accordance with the U.S. federal securities laws and the applicable rules and regulations of the Securities and Exchange Commission and the PCAOB.
We conducted our audit in accordance with the standards of the PCAOB. Those standards require that we plan and perform the audit to obtain reasonable assurance about whether effective internal control over financial reporting was maintained in all material respects.
Our audit included obtaining an understanding of internal control over financial reporting, assessing the risk that a material weakness exists, testing and evaluating the design and operating effectiveness of internal control based on the assessed risk, and performing such other procedures as we considered necessary in the circumstances. We believe that our audit provides a reasonable basis for our opinion.
Definition and Limitations of Internal Control Over Financial Reporting
A company’s internal control over financial reporting is a process designed to provide reasonable assurance regarding the reliability of financial reporting and the preparation of financial statements for external purposes in accordance with generally accepted accounting principles. A company’s internal control over financial reporting includes those policies and procedures that (1) pertain to the maintenance of records that, in reasonable detail, accurately and fairly reflect the transactions and dispositions of the assets of the company; (2) provide reasonable assurance that transactions are recorded as necessary to permit preparation of financial statements in accordance with generally accepted accounting principles, and that receipts and expenditures of the company are being made only in accordance with authorizations of management and directors of the company; and (3) provide reasonable assurance regarding prevention or timely detection of unauthorized acquisition, use, or disposition of the company’s assets that could have a material effect on the financial statements.
Because of its inherent limitations, internal control over financial reporting may not prevent or detect misstatements. Also, projections of any evaluation of effectiveness to future periods are subject to the risk that controls may become inadequate because of changes in conditions, or that the degree of compliance with the policies or procedures may deteriorate.
/s/ Ernst & Young LLP
Pittsburgh, Pennsylvania
August 16, 2019
II-VI Incorporated and Subsidiaries
Consolidated Balance Sheets
($000)
| June 30, |
2019 | 2018 | ||||||
| Assets |
||||||||
| Current Assets |
||||||||
| Cash and cash equivalents |
$ | 204,872 | $ | 247,038 | ||||
| Accounts receivable - less allowance for doubtful accounts of $1,292 at June 30, 2019 and $837 at June 30, 2018 |
269,642 | 215,032 | ||||||
| Inventories |
296,282 | 248,268 | ||||||
| Prepaid and refundable income taxes |
11,778 | 7,845 | ||||||
| Prepaid and other current assets |
30,337 | 43,654 | ||||||
|
|
|
|
|
|||||
| Total Current Assets |
812,911 | 761,837 | ||||||
| Property, plant & equipment, net |
582,790 | 524,890 | ||||||
| Goodwill |
319,778 | 270,678 | ||||||
| Other intangible assets, net |
139,324 | 125,069 | ||||||
| Investments |
76,208 | 69,215 | ||||||
| Deferred income taxes |
8,524 | 2,046 | ||||||
| Other assets |
14,238 | 7,926 | ||||||
|
|
|
|
|
|||||
| Total Assets |
$ | 1,953,773 | $ | 1,761,661 | ||||
|
|
|
|
|
|||||
| Liabilities and Shareholders’ Equity |
||||||||
| Current Liabilities |
||||||||
| Current portion of long-term debt |
$ | 23,834 | $ | 20,000 | ||||
| Accounts payable |
104,462 | 89,774 | ||||||
| Accrued compensation and benefits |
71,847 | 66,322 | ||||||
| Accrued income taxes payable |
20,476 | 17,392 | ||||||
| Other accrued liabilities |
49,944 | 42,979 | ||||||
|
|
|
|
|
|||||
| Total Current Liabilities |
270,563 | 236,467 | ||||||
| Long-term debt |
443,163 | 419,013 | ||||||
| Deferred income taxes |
23,913 | 27,241 | ||||||
| Other liabilities |
82,925 | 54,629 | ||||||
|
|
|
|
|
|||||
| Total Liabilities |
820,564 | 737,350 | ||||||
| Shareholders’ Equity |
||||||||
| Preferred stock, no par value; authorized - 5,000,000 shares; none issued |
— | — | ||||||
| Common stock, no par value; authorized - 300,000,000 shares; issued - 76,315,337 shares at June 30, 2019; 75,692,683 shares at June 30, 2018 |
382,423 | 351,761 | ||||||
| Accumulated other comprehensive income (loss) |
(24,221 | ) | (3,780 | ) | ||||
| Retained earnings |
943,581 | 836,064 | ||||||
|
|
|
|
|
|||||
| 1,301,783 | 1,184,045 | |||||||
| Treasury stock, at cost - 12,603,781 shares at June 30, 2019 and 12,395,791 shares at June 30, 2018 |
(168,574 | ) | (159,734 | ) | ||||
|
|
|
|
|
|||||
| Total Shareholders’ Equity |
1,133,209 | 1,024,311 | ||||||
|
|
|
|
|
|||||
| Total Liabilities and Shareholders’ Equity |
$ | 1,953,773 | $ | 1,761,661 | ||||
|
|
|
|
|
|||||
See Notes to Consolidated Financial Statements.
II-VI Incorporated and Subsidiaries
Consolidated Statements of Earnings
| Year Ended June 30, |
2019 | 2018 | 2017 | |||||||||
| ($000, except per share data) |
||||||||||||
| Revenues |
$ | 1,362,496 | $ | 1,158,794 | $ | 972,046 | ||||||
| Costs, Expenses and Other Expense (Income) |
||||||||||||
| Cost of goods sold |
841,147 | 696,591 | 583,684 | |||||||||
| Internal research and development |
139,163 | 116,875 | 96,806 | |||||||||
| Selling, general and administrative |
233,518 | 208,565 | 176,000 | |||||||||
| Interest expense |
22,417 | 18,352 | 6,809 | |||||||||
| Other expense (income), net |
(2,562 | ) | (3,783 | ) | (10,041 | ) | ||||||
|
|
|
|
|
|
|
|||||||
| Total Costs, Expenses and Other Expense (Income) |
1,233,683 | 1,036,600 | 853,258 | |||||||||
|
|
|
|
|
|
|
|||||||
| Earnings Before Income Taxes |
128,813 | 122,194 | 118,788 | |||||||||
| Income Taxes |
21,296 | 34,192 | 23,514 | |||||||||
|
|
|
|
|
|
|
|||||||
| Net Earnings |
$ | 107,517 | $ | 88,002 | $ | 95,274 | ||||||
|
|
|
|
|
|
|
|||||||
| Basic Earnings Per Share |
$ | 1.69 | $ | 1.41 | $ | 1.52 | ||||||
| Diluted Earnings Per Share |
$ | 1.63 | $ | 1.35 | $ | 1.48 | ||||||
See Notes to Consolidated Financial Statements.
II-VI Incorporated and Subsidiaries
Consolidated Statements of Comprehensive Income
| Year Ended June 30, |
2019 | 2018 | 2017 | |||||||||
| ($000) |
||||||||||||
| Net earnings |
$ | 107,517 | $ | 88,002 | $ | 95,274 | ||||||
| Other comprehensive income (loss): |
||||||||||||
| Foreign currency translation adjustments |
(14,319 | ) | 7,152 | (2,275 | ) | |||||||
| Pension adjustment, net of taxes of $(1,642), $763, and $674 for the years ended June 30, 2019, 2018, and 2017, respectively |
(6,122 | ) | 2,846 | 2,514 | ||||||||
|
|
|
|
|
|
|
|||||||
| Other comprehensive income (loss) |
(20,441 | ) | 9,998 | 239 | ||||||||
|
|
|
|
|
|
|
|||||||
| Comprehensive income |
$ | 87,076 | $ | 98,000 | $ | 95,513 | ||||||
|
|
|
|
|
|
|
|||||||
See Notes to Consolidated Financial Statements.
II-VI Incorporated and Subsidiaries
Consolidated Statements of Shareholders’ Equity
| |
Accumulated Other |
|||||||||||||||||||||||||||
| Common Stock | Comprehensive | Retained | Treasury Stock | |||||||||||||||||||||||||
| Shares | Amount | Income (Loss) | Earnings | Shares | Amount | Total | ||||||||||||||||||||||
| ($000, including share amounts) |
||||||||||||||||||||||||||||
| Balance - June 30, 2016 |
72,840 | $ | 243,812 | $ | (14,017 | ) | $ | 652,788 | (10,966 | ) | $ | (100,245 | ) | $ | 782,338 | |||||||||||||
| Share-based and deferred compensation activities |
1,241 | 25,826 | — | — | 26 | (3,114 | ) | 22,712 | ||||||||||||||||||||
| Net earnings |
— | — | — | 95,274 | — | — | 95,274 | |||||||||||||||||||||
| Foreign currency translation adjustments |
— | — | (2,275 | ) | — | — | — | (2,275 | ) | |||||||||||||||||||
| Pension adjustment, net of taxes of $674 |
— | — | 2,514 | — | — | — | 2,514 | |||||||||||||||||||||
|
|
|
|
|
|
|
|
|
|
|
|
|
|
|
|||||||||||||||
| Balance - June 30, 2017 |
74,081 | $ | 269,638 | $ | (13,778 | ) | $ | 748,062 | (10,940 | ) | $ | (103,359 | ) | $ | 900,563 | |||||||||||||
|
|
|
|
|
|
|
|
|
|
|
|
|
|
|
|||||||||||||||
| Share-based and deferred compensation activities |
1,612 | 25,717 | — | — | (41 | ) | (6,500 | ) | 19,217 | |||||||||||||||||||
| Net earnings |
— | — | — | 88,002 | — | — | 88,002 | |||||||||||||||||||||
| Purchases of treasury stock |
— | — | — | — | (1,415 | ) | (49,875 | ) | (49,875 | ) | ||||||||||||||||||
| Foreign currency translation adjustments |
— | — | 7,152 | — | — | — | 7,152 | |||||||||||||||||||||
| Equity portion of convertible debt, net of issuance costs of $1,694 |
— | 56,406 | — | — | — | — | 56,406 | |||||||||||||||||||||
| Pension adjustment, net of taxes of $763 |
— | — | 2,846 | — | — | — | 2,846 | |||||||||||||||||||||
|
|
|
|
|
|
|
|
|
|
|
|
|
|
|
|||||||||||||||
| Balance - June 30, 2018 |
75,693 | $ | 351,761 | $ | (3,780 | ) | $ | 836,064 | (12,396 | ) | $ | (159,734 | ) | $ | 1,024,311 | |||||||||||||
|
|
|
|
|
|
|
|
|
|
|
|
|
|
|
|||||||||||||||
| Share-based and deferred compensation activities |
622 | 30,662 | — | — | (158 | ) | (7,224 | ) | 23,438 | |||||||||||||||||||
| Net earnings |
— | — | — | 107,517 | — | — | 107,517 | |||||||||||||||||||||
| Purchases of treasury stock |
— | — | — | — | (50 | ) | (1,616 | ) | (1,616 | ) | ||||||||||||||||||
| Foreign currency translation adjustments |
— | — | (14,319 | ) | — | — | — | (14,319 | ) | |||||||||||||||||||
| Pension adjustment, net of taxes of ($1,642) |
— | — | (6,122 | ) | — | — | — | (6,122 | ) | |||||||||||||||||||
|
|
|
|
|
|
|
|
|
|
|
|
|
|
|
|||||||||||||||
| Balance - June 30, 2019 |
76,315 | $ | 382,423 | $ | (24,221 | ) | $ | 943,581 | (12,604 | ) | $ | (168,574 | ) | $ | 1,133,209 | |||||||||||||
|
|
|
|
|
|
|
|
|
|
|
|
|
|
|
|||||||||||||||
See Notes to Consolidated Financial Statements.
II-VI Incorporated and Subsidiaries
Consolidated Statements of Cash Flows
| Year Ended June 30, |
2019 | 2018 | 2017 | |||||||||
| ($000) |
||||||||||||
| Cash Flows from Operating Activities |
||||||||||||
| Net earnings |
$ | 107,517 | $ | 88,002 | $ | 95,274 | ||||||
| Adjustments to reconcile net earnings to net cash provided by operating activities: |
||||||||||||
| Depreciation |
75,745 | 66,202 | 50,894 | |||||||||
| Amortization |
16,620 | 14,568 | 12,743 | |||||||||
| Share-based compensation expense |
21,946 | 15,312 | 11,756 | |||||||||
| Amortization of discount on convertible debt and debt issuance costs |
12,550 | 10,057 | — | |||||||||
| Losses (gains) on foreign currency remeasurements and transactions |
3,155 | 850 | (1,275 | ) | ||||||||
| Earnings from equity investments |
(3,214 | ) | (3,594 | ) | (744 | ) | ||||||
| Deferred income taxes |
(10,462 | ) | 945 | (1,184 | ) | |||||||
| Increase (decrease) in cash from changes in (net of effects of acquisitions): |
||||||||||||
| Accounts receivable |
(50,764 | ) | (21,044 | ) | (26,247 | ) | ||||||
| Inventories |
(36,392 | ) | (38,732 | ) | (24,992 | ) | ||||||
| Accounts payable |
15,999 | 17,436 | 6,704 | |||||||||
| Contract liabilities |
15,889 | 1,168 | 2,345 | |||||||||
| Income taxes |
366 | 7,380 | 735 | |||||||||
| Other operating net assets |
9,520 | 2,464 | (7,393 | ) | ||||||||
|
|
|
|
|
|
|
|||||||
| Net cash provided by operating activities |
178,475 | 161,014 | 118,616 | |||||||||
|
|
|
|
|
|
|
|||||||
| Cash Flows from Investing Activities |
||||||||||||
| Additions to property, plant & equipment |
(137,122 | ) | (153,438 | ) | (138,517 | ) | ||||||
| Purchases of businesses, net of cash acquired |
(83,067 | ) | (80,503 | ) | (40,015 | ) | ||||||
| Purchases of equity investments |
(4,480 | ) | (52,056 | ) | — | |||||||
| Other investing activities |
693 | 1,047 | 1,291 | |||||||||
|
|
|
|
|
|
|
|||||||
| Net cash used in investing activities |
(223,976 | ) | (284,950 | ) | (177,241 | ) | ||||||
|
|
|
|
|
|
|
|||||||
| Cash Flows from Financing Activities |
||||||||||||
| Proceeds from issuance of 0.25% convertible senior notes due 2022 |
— | 345,000 | — | |||||||||
| Proceeds from borrowings under Credit Facility |
150,000 | 100,000 | 129,000 | |||||||||
| Proceeds from exercises of stock options |
8,698 | 10,469 | 15,092 | |||||||||
| Payments on borrowings under Credit Facility |
(135,000 | ) | (292,000 | ) | (25,000 | ) | ||||||
| Payments in satisfaction of employees’ minimum tax obligations |
(7,092 | ) | (6,564 | ) | (4,136 | ) | ||||||
| Debt issuance costs |
(5,589 | ) | (10,061 | ) | (1,384 | ) | ||||||
| Payments on earnout considerations |
(4,524 | ) | — | (2,000 | ) | |||||||
| Purchases of treasury stock |
(1,616 | ) | (49,875 | ) | — | |||||||
|
|
|
|
|
|
|
|||||||
| Net cash provided by financing activities |
4,877 | 96,969 | 111,572 | |||||||||
|
|
|
|
|
|
|
|||||||
| Effect of exchange rate changes on cash and cash equivalents |
(1,542 | ) | 2,117 | 496 | ||||||||
| Net (decrease) increase in cash and cash equivalents |
(42,166 | ) | (24,850 | ) | 53,443 | |||||||
| Cash and Cash Equivalents at Beginning of Period |
247,038 | 271,888 | 218,445 | |||||||||
|
|
|
|
|
|
|
|||||||
| Cash and Cash Equivalents at End of Period |
$ | 204,872 | $ | 247,038 | $ | 271,888 | ||||||
|
|
|
|
|
|
|
|||||||
| Non cash transactions: |
||||||||||||
| Purchases of business - earnout consideration recorded in other accrued liabilities |
$ | 4,397 | $ | — | $ | 2,250 | ||||||
| Capital lease obligation incurred on facility lease |
$ | — | $ | — | $ | 25,000 | ||||||
| Additions to property, plant & equipment included in accounts payable and accrued liabilities |
$ | 10,986 | $ | 12,313 | $ | 4,428 | ||||||
See Notes to Consolidated Financial Statements.
II-VI Incorporated and Subsidiaries
Notes to the Consolidated Financial Statements
Note 1. Nature of Business and Summary of Significant Accounting Policies
Nature of Business. II-VI Incorporated and its subsidiaries (the “Company,” “we,” “us,” or “our”), a global leader in engineered materials and optoelectronic components and devices, is a vertically-integrated manufacturing company that develops, manufactures and markets engineered materials and optoelectronic components and devices for precision use in industrial materials processing, optical communications, aerospace and defense, consumer electronics, semiconductor capital equipment, life sciences and automotive applications. The Company markets its products through its direct sales force and through distributors and agents.
The Company uses certain uncommon materials and compounds to manufacture its products. Some of these materials are available from only one proven outside source. The continued high quality of these materials is critical to the stability of the Company’s manufacturing yields. The Company has not experienced significant production delays due to a shortage of materials. However, the Company does occasionally experience problems associated with vendor-supplied materials not meeting specifications for quality or purity. A significant failure of the Company’s suppliers to deliver sufficient quantities of necessary high-quality materials on a timely basis could have a material adverse effect on the Company’s results of operations.
Principles of Consolidation. The Consolidated Financial Statements include the accounts of the Company. All intercompany transactions and balances have been eliminated.
Estimates. The preparation of financial statements in conformity with accounting principles generally accepted in the United States (“U.S. GAAP”) requires management to make estimates and assumptions that affect the reported amounts of assets and liabilities and disclosure of contingent assets and liabilities at the date of the financial statements and the reported amounts of revenues and expenses during the reporting period. Actual results could differ from those estimates.
Foreign Currency Translation. For II-VI Singapore Pte., Ltd. and its subsidiaries, II-VI Laser Enterprise of the Compound Semiconductors segment, II-VI Network Solutions Division of the Photonic Solutions segment, and II-VI Performance Metals of the Compound Semiconductors segment, the functional currency is the United States (U.S.) dollar. The determination of the functional currency is made based on the appropriate economic and management indicators.
For all other foreign subsidiaries, the functional currency is the local currency. Assets and liabilities of those operations are translated into U.S. dollars using period-end exchange rates while income and expenses are translated using the average exchange rates for the reporting period. Translation adjustments are recorded as accumulated other comprehensive income within shareholders’ equity in the accompanying Consolidated Balance Sheets.
Cash and Cash Equivalents. The Company considers highly liquid investment instruments with an original maturity of three months or less to be cash equivalents. We place our cash and cash equivalents with high credit quality financial institutions and to date have not experienced credit losses in these instruments. Cash of foreign subsidiaries is on deposit at banks in China, Vietnam, Singapore, Japan, Switzerland, the Netherlands, Germany, the Philippines, Belgium, Italy, Hong Kong, the United Kingdom, South Korea and Taiwan.
Accounts Receivable. The Company establishes an allowance for doubtful accounts based on historical experience and believes the collection of revenues, net of this allowance, is reasonably assured.
Inventories. Inventories are valued at the lower of cost or net realizable value, with cost determined on the first-in, first-out basis. Inventory costs include material, labor and manufacturing overhead. In evaluating the net realizable value of inventory, management also considers, if applicable, other factors, including known trends, market conditions, currency exchange rates and other such issues. The Company generally records a reduction to the carrying value of inventory as a charge against earnings for all products on hand more than 12 to 24 months, depending on the products that have not been sold to customers or cannot be further manufactured for sale to alternative customers. An additional charge may be recorded for product on hand that is in excess of product sold to customers over the same periods noted above. The cumulative adjustments to the carrying value of inventory totaled $23.5 million and $22.5 million at June 30, 2019 and 2018, respectively.
Property, Plant and Equipment. Property, plant and equipment are carried at cost or fair value upon acquisition. Major improvements are capitalized, while maintenance and repairs are generally expensed as incurred. The Company reviews its property, plant and equipment and other long-lived assets for impairment whenever events or circumstances indicate that the carrying amounts may not be recoverable. Depreciation for financial reporting purposes is computed primarily by the straight-line method over the estimated useful lives for building, building improvements and land improvements of 10 to 20 years and three to 20 years for machinery and equipment.
Business Combinations. The Company accounts for business acquisitions by establishing the acquisition-date fair value as the measurement for all assets acquired and liabilities assumed. Certain provisions of U.S. GAAP prescribe, among other things, the determination of acquisition-date fair value of consideration paid in a business combination (including contingent consideration) and the exclusion of transaction and acquisition-related restructuring costs from acquisition accounting.
Goodwill. The excess purchase price over the fair value allocated to identifiable tangible and intangible net assets of businesses acquired is reported as goodwill in the accompanying Consolidated Balance Sheets. The Company tests goodwill for impairment at least annually as of April 1, or when events or changes in circumstances indicate that goodwill might be impaired. The evaluation of impairment involves comparing the current fair value of the Company’s reporting units to the recorded value (including goodwill). The Company uses a discounted cash flow (“DCF”) model and/or a market analysis to determine the fair value of its reporting units. A number of assumptions and estimates are involved in estimating the forecasted cash flows used in the DCF model, including markets and market shares, sales volume and pricing, costs to produce, working capital changes and income tax rates. Management considers historical experience and all available information at the time the fair values of the reporting units are estimated. Goodwill impairment is now measured as the amount by which a reporting unit’s carrying value exceeds its fair value, not to exceed the carrying amount of goodwill.
The Company has the option to perform a qualitative assessment of goodwill prior to completing the quantitative assessment described above to determine whether it is more likely than not that the fair value of a reporting unit is less than its carrying amount, including goodwill and other intangible assets. If the Company concludes that this is the case, it must perform the quantitative assessment. Otherwise, the Company will forego the quantitative assessment and does not need to perform any further testing. As of April 1 of fiscal years 2019 and 2018, the Company completed its annual impairment tests of its reporting units using the quantitative assessment. Based on the results of these analyses the Company’s goodwill was not impaired.
Intangibles. Intangible assets are initially recorded at their cost or fair value upon acquisition. Finite-lived intangible assets are amortized for financial reporting purposes using the straight-line method over the estimated useful lives of the assets ranging from five to 20 years. Indefinite-lived intangible assets are not amortized but tested annually for impairment at April 1st, or when events or changes in circumstances indicate that indefinite-lived intangible assets might be impaired.
Investments in Other Entities. In the normal course of business, the Company enters into various types of investment arrangements, each having unique terms and conditions. These investments may include equity interests held by the Company in business entities, including general or limited partnerships, contractual ventures, or other forms of equity participation. The Company determines whether such investments involve a variable interest entity (“VIE”) based on the characteristics of the subject entity. If the entity is determined to be a VIE, then management determines if the Company is the primary beneficiary of the entity and whether or not consolidation of the VIE is required. The primary beneficiary consolidating the VIE must normally have both (i) the power to direct the activities of a VIE that most significantly affect the VIE’s economic performance and (ii) the obligation to absorb losses of the VIE or the right to receive benefits from the VIE, in either case that could potentially be significant to the VIE. When the Company is deemed to be the primary beneficiary, the VIE is consolidated and the other party’s equity interest in the VIE is accounted for as a noncontrolling interest.
The Company generally accounts for investments it makes in VIEs in which it has determined that it does not have a controlling financial interest but has significant influence over and holds at least a 20% ownership interest using the equity method. Any such investment not meeting the parameters to be accounted under the equity method would be accounted for under ASU 2016-1.
If an entity fails to meet the characteristics of a VIE, management then evaluates such entity under the voting model. Under the voting model, management consolidates the entity if they determine that the Company, directly or indirectly, has greater than 50% of the voting shares and determines that other equity holders do not have substantive participating rights.
Commitments and Contingencies. Liabilities for loss contingencies arising from claims, assessments, litigation, fines, and penalties and other sources are recorded when it is probable that a liability has been incurred and the amount of the assessment and/or remediation can be reasonably estimated. Legal costs incurred in connection with loss contingencies are expensed as incurred. Such accruals are adjusted as further information develops or circumstances change. Our customers may discover defects in our products after the products have been fully deployed and operated under peak stress conditions. If we are unable to correct defects or other problems, we could experience, among other things, loss of customers, increased costs of product returns and warranty expenses, damage to our brand reputation, failure to attract new customers or achieve market acceptance, diversion of development and engineering resources, or legal action by our customers. The Company had no material loss contingency liabilities at June 30, 2019 related to commitments and contingencies.
Income Taxes. Deferred income tax assets and liabilities are determined based on the differences between the consolidated financial statement and tax basis of assets and liabilities using enacted tax rates in effect in the years in which the differences are expected to reverse. Valuation allowances are established when necessary to reduce deferred income tax assets to the amount more likely than not to be realized.
The Company recognizes the tax benefit from an uncertain tax position only if it is more likely than not that the tax position will be sustained on examination by the taxing authorities, based on the technical merits of the position. The tax benefits recognized in the financial statements from such a position are measured based on the largest benefit that has a greater than 50% likelihood of being realized upon ultimate resolution. The amount of unrecognized tax benefits is adjusted for changes in facts and circumstances. For example, adjustments could result from significant amendments to existing tax law and the issuance of regulations or interpretations by the taxing authorities, new information obtained during a tax examination, or resolution of an examination. The Company believes that its estimates for uncertain tax positions are appropriate and sufficient to pay assessments that may result from examinations of its tax returns. The Company recognizes both accrued interest and penalties related to unrecognized tax benefits in income tax expense.
Revenue Recognition. Revenue is recognized under ASC 606 when or as obligations under the terms of a contract with the Company’s customer have been satisfied and control has transferred to the customer. The Company has elected to exclude all taxes from the measurement of the transaction price.
For contracts with commercial customers, which comprise the majority of the Company’s performance obligations, ownership of the goods and associated revenue are transferred to customers at a point in time, generally upon shipment of a product (“Direct Ship Parts”) to the customer or receipt of the product by the customer and without significant judgments. The majority of contracts typically require payment within 30 to 60 days after transfer of ownership to the customer.
Contracts with the United States (“U.S.”) government through its prime contractors are typically for products or services with no alternative future use to the Company with an enforceable right to payment for performance completed to date, whereas commercial contracts typically have alternative use. Customized products with no alternative future use to the Company with an enforceable right to payment for performance completed to date are recorded over time utilizing the output method of units delivered. The Company considers this to be a faithful depiction of the transfer to the customer of revenue over time due to short cycle time and immaterial work-in-process balances. The majority of contracts typically require payment within 30 to 60 days after transfer of ownership to the customer.
Service revenue includes repairs, non-recurring engineering, tolling arrangements and installation. Repairs, tolling and installation activities are usually completed in a short period of time (normally less than one month) and therefore recorded at a point in time when the services are completed. Non-recurring engineering arrangements are typically recognized over time under the time and material practical expedient, as the entity has a right to consideration from a customer, in an amount that corresponds directly with the value to the customer of the entity’s performance completed to date. The majority of contracts typically require payment within 60 days.
The Company’s revenue recognition policy is consistently applied across the Company’s segments, product lines and geographical locations. Further for the periods covered herein, we did not have post shipment obligations such as training or installation, customer acceptance provisions, credits and discounts, rebates and price protection, or other similar privileges. Our distributors and agents are not granted price protection. Our distributors and agents, which comprise less than 10% of consolidated revenues, have no additional product return rights beyond the right to return defective products covered by our warranty policy.
Under ASC 606, the Company expenses sales commissions when incurred because the amortization period would have been one year or less. These costs are recorded within selling, general and administration expenses. The Company has elected to recognize the costs for freight and shipping when control over products has transferred to the customer as an expense in cost of sales.
The Company monitors and tracks the amount of product returns and reduces revenue at the time of shipment for the estimated amount of future returns, based on historical experience. The Company makes estimates evaluating its allowance for doubtful accounts. The Company continuously monitors collections and payments from its customers and maintains a provision for estimated credit losses based upon its historical experience and any specific customer collection issues that it has identified.
The Company offers an assurance-type limited warranty that products will be free from defects in materials and workmanship. The warranty is typically one year or the industry standard in length and is limited to either (1) the replacement or repair of the product or (2) a credit against future purchases. The products are not sold with a right of return.
The Company has elected not to disclose the aggregate amount of the transaction price allocated to unsatisfied performance obligations, as our contracts have an original expected duration of less than one year.
Research and Development. Internal research and development costs and costs not related to customer and government funded research and development contracts are expensed as incurred.
Share-Based Compensation. Share-based compensation arrangements require the recognition of the grant-date fair value of stock compensation in net earnings. The Company recognizes the share-based compensation expense over the requisite service period of the individual grantees, which generally equals the vesting period.
Accumulated Other Comprehensive Income. Accumulated other comprehensive income is a measure of all changes in shareholders’ equity that result from transactions and other economic events in the period other than transactions with owners. Accumulated other comprehensive (loss) income is a component of shareholders’ equity and consists of accumulated foreign currency translations adjustments and pension adjustments.
Fair Value Measurements. The Company applies fair value accounting for all financial assets and liabilities that are required to be recognized or disclosed at fair value in the financial statements. Fair value is defined as the price that would be received from selling an asset or paid to transfer a liability in an orderly transaction between market participants at the measurement date. When determining the fair value measurements for assets and liabilities, the Company considers the principal or most advantageous market in which the Company would transact, and the market-based risk measurements or assumptions that market participants would use in pricing the asset or liability, such as inherent risk, transfer restrictions and credit risk.
Operating Leases. The Company classifies operating leases in accordance with the provisions of lease accounting. Rent expense under noncancelable operating leases with scheduled rent increases or rent holidays is accounted for on a straight-line basis over the lease term, beginning on the date of initial possession or the effective date of the lease agreement. The amount of the excess straight-line rent expense over scheduled payments is recorded as a deferred liability. The current portion of unamortized deferred lease costs is included in other accrued liabilities and the long-term portion is included in other liabilities in the Consolidated Balance Sheets.
Capital Leases. The Company accounts for capital leases at the lesser of the estimated fair market value of the leased property or the net present value of the aggregate future minimum lease payments. The current and long-term portion of the capital lease obligation is recorded in other accrued liabilities and other liabilities, respectively, in the Consolidated Balance Sheet. Capital lease assets are included in property, plant & equipment and are generally depreciated over the term of the lease. Interest expense on capital leases are included in interest expense in the Consolidated Statements of Earnings.
Recently Issued Financial Accounting Standards
Revenue Recognition Pronouncement
In May 2014, the Financial Accounting Standards Board (“FASB”) issued Accounting Standards Update (“ASU”) 2014-9, Revenue from Contracts with Customers (Topic 606). The standard requires an entity to recognize revenue in a manner that depicts the transfer of goods or services to customers at an amount that reflects the consideration to which the entity expects to be entitled in exchange for those goods or services. The Company adopted this standard on July 1, 2018 using the modified retrospective method of adoption applied to all contracts at that date. Adoption of the ASU did not require an adjustment to the opening balance of equity. The standard did not have a significant effect on its results of operations, liquidity or financial position in fiscal year 2019. The Company implemented processes and controls to ensure new contracts are reviewed for the appropriate accounting treatment and to generate the disclosures required under the new standard. For the disclosures required by this ASU, see Note 5, Revenue from Contracts with Customers.
Other Adopted Pronouncements
In August 2018, the FASB issued ASU 2018-14, Disclosure Framework – Changes to the disclosure framework requirements for Defined Benefit Plans. This update defined a narrower set of disclosures required on the basis of an evaluation of whether the expected benefits of entities providing the information justify the expected costs. The adoption of this standard did not have a material effect on the Company’s Consolidated Financial Statements.
In August 2018, the FASB issued ASU 2018-13, Fair Value Measurement (Topic 820): Disclosure Framework – Changes to the disclosure requirements for fair value measurements. This update defined a narrower set of disclosures required on the basis of an evaluation of whether the expected benefits of entities providing the information justify the expected costs. The adoption of this standard did not have a material effect on the Company’s Consolidated Financial Statements.
In March 2017, the FASB issued ASU 2017-7, Compensation (Topic 715): Improving the Presentation of Net Periodic Pension Cost and Net Periodic Postretirement Benefit Cost. This update affects employers’ presentation of defined benefit retirement plan costs. With the adoption of this standard, the Company restated the prior periods ending June 30, 2018, 2017, and 2016. These restatements did not have a material effect on the Company’s Consolidated Financial Statements.
In January 2017, the FASB issued ASU 2017-1, Business Combinations (Topic 805): Clarifying the Definition of a Business. This update changes the definition of a business to assist entities with evaluating when a set of transferred assets and activities is a business. The adoption of this standard did not have a material effect on the Company’s Consolidated Financial Statements.
In October 2016, the FASB issued ASU 2016-16, Income Taxes (Topic 740): Intra-Entity Transfers of Assets Other Than Inventory. This update requires that when intra-entity asset transfers occur, the entity must recognize tax effects in the period in which the transfer occurs. The adoption of this standard did not have a material effect on the Company’s Consolidated Financial Statements.
In August 2016, the FASB issued ASU 2016-15, Statement of Cash Flows (Topic 230): Classification of Certain Cash Receipts and Cash Payments. The guidance clarifies how entities should classify certain cash receipts and cash payments on the statement of cash flows. The guidance also clarifies how the predominance principle should be applied when cash receipts and cash payments have aspects of more than one class of cash flow. The adoption of this standard did not have a material effect on the Company’s Consolidated Financial Statements.
Pronouncements Currently Under Evaluation
In February 2016, the FASB issued ASU 2016-2, Leases (Topic 842). This update modifies lease accounting for lessees to increase transparency and comparability by recording lease assets and liabilities for operating leases and disclosing key information about leasing arrangements. The new standard will become effective for the Company’s fiscal year 2020, which begins on July 1, 2019. During fiscal year 2019, we conducted a survey to identify all leases across the organization (including embedded leases). We identified that a majority of our leases are categorized into one of three categories: office equipment, real estate and vehicles. We are finalizing the accumulation of lease data, including new leases entered into at the end of fiscal year 2019, and preparing the final transition adjustment calculations. We estimate that total assets and total liabilities will increase within the range of $90 million and $120 million on July 1, 2019 when the ASU is adopted.
In July 2018, the FASB issued targeted improvements to ASU 2016-2 in ASU 2018-11. This update provides entities with an optional transition method, which permits an entity to initially apply the new leases standard at the adoption date and recognize a cumulative-effect adjustment to the opening balance of retained earnings in the period of adoption. We expect to use this new transition approach and the comparative periods presented in our fiscal 2020 consolidated financial statements will continue to be reported in accordance with ASC 840, Leases. We anticipate that we will elect the package of practical expedients allowed in the standard, which among other things, allows us to carry forward our historical lease classification. We also anticipate that we will make an accounting policy election to use the practical expedient allowed in the standard to not separate lease and non-lease components when calculating the lease liability under Topic 842.
In July 2016, the FASB issued ASU No. 2016-13, Financial Instruments – Credit Losses (Topic 326): Measurement of Credit Losses on Financial Instruments (“ASU 2016-13”), which among other things, requires the measurement of all expected credit losses of financial assets held at the reporting date based on historical experience, current conditions, and reasonable and supportable forecasts. Financial institutions and other organizations will now use forward looking information to better inform their credit loss estimates. In addition, the ASU amends the accounting for credit losses on available-for-sale debt securities and purchased financial assets with credit deterioration. ASU 2016-13 is effective for periods beginning after December 15, 2019, and interim periods within those fiscal years. The Company is in the process of evaluating the impact of the pronouncement.
Note 2. Pending Merger
II-VI and Finisar Corporation (“Finisar”) have entered into an Agreement and Plan of Merger, dated as of November 8, 2018 (the “Merger Agreement”). Pursuant to the terms of the Merger Agreement, Mutation Merger Sub Inc., a Delaware corporation and wholly owned subsidiary of II-VI, will be merged with and into Finisar, and Finisar will continue as the surviving corporation in the merger and a wholly owned subsidiary of II-VI (the “Merger”).
If the Merger is consummated, Finisar stockholders will be entitled to receive, at their election, consideration per share of common stock of Finisar (the “Finisar Common Stock”) consisting of (i) $26.00 in cash, without interest (the “Cash Election Consideration”), (ii) 0.5546 shares of II-VI common stock (the shares, the “II-VI Common Stock,” and the consideration, the “Stock Election Consideration”), or (iii) a combination of $15.60 in cash, without interest, and 0.2218 shares of II-VI Common Stock (the “Mixed Election Consideration,” and, together with the Cash Election Consideration and the Stock Election Consideration, the “Merger Consideration”). The Cash Election Consideration and the Stock Election Consideration are subject to proration adjustment pursuant to the terms of the Merger Agreement such that the aggregate Merger Consideration will consist of approximately 60% cash and approximately 40% II-VI Common Stock (assuming a per share price of II-VI common stock equal to the price when the Merger Agreement was signed on November 8, 2018, which was $46.88 per share) regardless of the individual election.
At the effective time of the Merger (the “Effective Time”), each option granted pursuant to Finisar’s 2005 Stock Incentive Plan, as such plan has been further amended and restated (each, a “Finisar Stock Option”), or portion thereof, that is outstanding and unexercised as of immediately prior to the Effective Time (whether vested or unvested) will be cancelled, terminated and converted into the right to receive an amount of Mixed Election Consideration that would be payable to a holder of such number of shares of Finisar Common Stock equal to the quotient of (i) the product of (a) the excess, if any, of $26.00 over the exercise price per share of such Finisar Stock Option multiplied by (b) the number of shares of Finisar Common Stock subject to such Finisar Stock Option, divided by (ii) $26.00.
At the Effective Time, each restricted stock unit granted pursuant to Finisar’s 2005 Stock Incentive Plan, as such plan has been further amended and restated, each, a “Finisar Restricted Stock Unit”), or portion thereof, that is outstanding and subject to a performance-based vesting condition that relates solely to the value of Finisar Common Stock will, to the extent such Finisar Restricted Stock Unit vests in accordance with its terms in connection with the Merger (the “Participating RSUs”), be cancelled and extinguished and converted into the right to receive the Cash Election Consideration, the Stock Election Consideration or the Mixed Election Consideration at the election of the holder of such Participating RSUs, subject to proration adjustment.
At the Effective Time, each Finisar Restricted Stock Unit (or portion thereof) that is outstanding and unvested, does not vest in accordance with its terms in connection with the Merger and is either (x) subject to time-based vesting requirements only or (y) subject to a performance-based vesting condition other than the value of Finisar Common Stock will be assumed by II-VI (each, an “Assumed RSU”). Each Assumed RSU will be subject to substantially the same terms and conditions as applied to the related Finisar Restricted Stock Unit immediately prior to the Effective Time, including the vesting schedule (and the applicable performance-vesting conditions in the case of a grant contemplated by clause (y) of the preceding sentence) and any provisions for accelerated vesting applicable thereto, except that the number of shares of II-VI Common Stock subject to each Assumed RSU will be equal to the product of (i) the number of shares of Finisar Common Stock underlying such unvested Finisar Restricted Stock Unit award as of immediately prior to the Effective Time multiplied by (ii) the sum of (a) 0.2218 plus (b) the quotient obtained by dividing (1) $15.60 by (2) the volume weighted average price per share of II-VI Common Stock (rounded to the nearest cent) on the Nasdaq Global Select Market for the ten consecutive trading days ending on (and including) the third trading day immediately prior to the Effective Time (with the resulting number rounded down to the nearest whole share).
II-VI filed with the Securities and Exchange Commission a registration statement on Form S-4 relating to the Merger, and that registration statement became effective in accordance with the provisions of Section 8(a) of the Securities Act of 1933, as amended, on February 7, 2019. Shareholders of II-VI and stockholders of Finisar voted to approve proposals related to the Merger at special meetings held on March 26, 2019 by the respective companies.
The waiting period under the Hart-Scott-Rodino Antitrust Improvements Act of 1976, as amended, with respect to the Merger has expired without a request for additional information. Other regulatory approvals applicable to the Merger have been obtained in Germany, Mexico and Romania.
On November 8, 2018, in connection with its entry into the Merger Agreement, II-VI entered into a commitment letter (together with a related fee letter) with Bank of America, N.A., which was subsequently amended and restated on December 7, 2018 and on December 14, 2018 (together with one or more related fee letters, the “Commitment Letter”). Subject to the terms and conditions set forth in the Commitment Letter, the lender parties thereto severally committed to provide 100% of up to $2.425 billion in aggregate principal amount of senior secured credit facilities of II-VI.
On March 4, 2019, II-VI entered into a Credit Agreement (the “New Credit Agreement”), by and among the Company, Bank of America, N.A., as Administrative Agent, Swing Line Lender and a L/C Issuer, and the other lenders party thereto. Pursuant to
the terms and subject to the conditions therein, the New Credit Agreement provides for senior secured financing of $1.625 billion in the aggregate, consisting of (i) a five-year senior secured first-lien term A loan facility in an aggregate principal amount of $1.175 billion (the “Term A Facility”) and (ii) a five-year senior secured first-lien revolving credit facility in an aggregate principal amount of $450.0 million (the “Revolving Credit Facility” and together with the Term A Facility, the “New Senior Credit Facilities”). The New Credit Agreement also provides for a letter of credit sub-facility not to exceed $25.0 million and a swing loan sub-facility initially not to exceed $20.0 million, subject to adjustment in accordance with the terms of the New Credit Agreement. II-VI anticipates using the proceeds from the Term A Facility, together with a separately committed term B loan facility in an aggregate principal amount of up to $720.0 million (the “Term B Facility”) and cash and short-term investments of II-VI and Finisar, to pay the cash portion of the merger consideration payable in connection with the Merger and related fees and expenses. II-VI currently does not intend to draw on the Revolving Credit Facility in order to fund the cash portion of the merger consideration payable in connection with the Merger.
The funding obligations of the lenders under the New Senior Credit Facilities are subject to certain currently unsatisfied conditions, including the consummation of the Merger. Accordingly, no borrowings are currently outstanding under the New Senior Credit Facilities, and II-VI currently is not able to borrow under the New Senior Credit Facilities. Further, II-VI expects that the New Credit Agreement will be amended prior to the Closing Date to reflect syndication of the Term B Facility and to finalize certain other terms in the New Credit Agreement. Upon the consummation of the Merger, the New Senior Credit Facilities, governed by the New Credit Agreement as it may be amended as of such time, will be used (i) to refinance in full the Amended Credit Facility (as defined in Note 9) and (ii) on or after the date of the consummation of the Merger, to repay amounts owed in connection with Finisar’s outstanding convertible notes, currently in an aggregate principal amount outstanding of $575.0 million, including the proceeds of a portion of the Term A Facility which will be available to II-VI for a certain period after the initial funding under the New Senior Credit Facilities.
Unless and until the Merger is consummated and the other currently unsatisfied conditions to the funding obligations of the lenders under the New Senior Credit Facilities are satisfied or waived, the Amended Credit Facility remains in effect in accordance with its terms.
The completion of the Merger is subject to the satisfaction or waiver of certain additional customary closing conditions, including review and approval of the Merger by the State Administration for Market Regulation in China. The Company is planning to refile with the State Administration for Market Regulation in China, extending the approval period. Subject to the satisfaction or waiver of each of the closing conditions, II-VI and Finisar expect that the Merger will be completed in the second half of calendar 2019. However, it is possible that factors outside the control of both companies could result in the Merger being completed at a different time or not at all.
Note 3. Acquisitions
CoAdna, Inc.
In September 2018, the Company acquired CoAdna Holdings, Inc. (“CoAdna”), a previously publicly traded company on the Taiwan Stock Exchange with headquarters in Sunnyvale, CA, in a cash transaction valued at approximately $85.0 million, inclusive of cash acquired of approximately $42.2 million at closing.
CoAdna is a global leader in wavelength selective switches based on its patented liquid crystal platform. CoAdna operates within the Company’s Photonic Solutions operating segment.
The following table presents the final allocation of the purchase price of the assets acquired and liabilities assumed at the date of acquisition ($000):
| Assets |
||||
| Accounts receivable |
$ | 5,684 | ||
| Inventories |
6,189 | |||
| Prepaid and other assets |
2,454 | |||
| Property, plant & equipment |
3,181 | |||
| Intangible assets |
16,072 | |||
| Goodwill |
24,898 | |||
|
|
|
|||
| Total assets acquired |
$ | 58,478 | ||
|
|
|
|||
| Liabilities |
||||
| Accounts payable |
$ | 4,006 | ||
| Other accrued liabilities |
4,103 | |||
| Long term accrued income taxes |
6,656 | |||
| Deferred tax liabilities |
897 | |||
|
|
|
|||
| Total liabilities assumed |
15,662 | |||
|
|
|
|||
| Net assets acquired |
$ | 42,816 | ||
|
|
|
The goodwill of $24.9 million is included in the Photonic Solutions segment and is attributed to the expected synergies and the assembled workforce of CoAdna. None of the goodwill is deductible for income tax purposes. The fair value of accounts receivable acquired was $5.7 million, with the gross contractual amount being $5.7 million. The Company expensed transaction costs during the year ended June 30, 2019 of $1.9 million.
The amount of revenues of CoAdna included in the Company’s Consolidated Statements of Earnings for the year ended June 30, 2019 was $12.4 million, excluding sales to customers through our sales offices. The amount of net loss of CoAdna included in the Company’s Consolidated Statement of Earnings for the year ended June 30, 2019 was $0.6 million.
Purchase of a Product Line
In November 2018, the Company acquired certain assets of a product line in a cash transaction valued at approximately $10.0 million. The transaction was accounted for as a business combination under ASC 805 and ASU 2017-1, Business Combinations (Topic 805): Clarifying the Definition of a Business. In conjunction with the acquisition of the product line, the Company acquired inventory of $0.2 million, equipment of $2.3 million, acquired technology of $6.3 million, and recorded goodwill of $1.2 million. The goodwill is deductible for income tax purposes. The goodwill is recorded in the Photonic Solutions segment and is attributable to the workforce acquired as part of the transaction. Transaction expenses for this acquisition were insignificant for the year ended June 30, 2019.
Redstone Aerospace Corporation
In March 2019, the Company acquired Redstone Aerospace Corporation (“Redstone”), an aerospace and defense company located in Colorado. Redstone has unique capabilities to continue our growth in the emerging high-energy market. The consideration consisted of initial cash paid at the acquisition date of $28.0 million, net of cash acquired. In addition, the acquisition agreement provides up to a maximum of $2.0 million of additional cash earn out opportunities based on achievement of certain agreed-upon financial objectives.
The following table presents the final purchase price at the date of acquisition ($000):
| Net cash paid at acquisition |
$ | 27,959 | ||
| Fair value of cash earnout arrangement |
1,776 | |||
|
|
|
|||
| Purchase price |
$ | 29,735 | ||
|
|
|
The following table presents a final allocation of the purchase price of the assets acquired and liabilities assumed at the date of acquisition ($000):
| Assets |
||||
| Accounts receivable |
$ | 1,606 | ||
| Other Assets |
215 | |||
| Property, plant & equipment |
350 | |||
| Intangible assets |
9,100 | |||
| Goodwill |
21,596 | |||
|
|
|
|||
| Total assets acquired |
$ | 32,867 | ||
|
|
|
|||
| Liabilities |
||||
| Non-Interest bearing liabilities |
$ | 980 | ||
| Deferred tax liabilities |
2,152 | |||
|
|
|
|||
| Total liabilities assumed |
3,132 | |||
|
|
|
|||
| Net assets acquired |
$ | 29,735 | ||
|
|
|
The goodwill of $21.6 million is recorded in the Compound Semiconductors segment and is attributed to the expected synergies and the assembled workforce of Redstone. The goodwill is non-deductible for income tax purposes. At the time of the acquisition, the Company expected to collect all of the accounts receivable. Transaction expenses for this acquisition were insignificant for the year ended June 30, 2019.
The amount of revenues and net earnings from the acquisition included in the Company’s Consolidated Statements of Earnings for the year ended June 30, 2019 were insignificant.
| Note 4. | Other Investments |
Purchase of Equity Investment
In November 2017, the Company acquired a 93.8% equity investment in a privately-held company for $51.5 million. The Company’s pro-rata share of earnings from this investment since the acquisition date was $1.3 million and $2.4 million for the years ended June 30, 2019 and 2018, respectively, and was recorded in other expense (income), net in the Consolidated Statement of Earnings.
This investment is accounted for under the equity method of accounting (“Equity Investment”). The following table summarizes the Company’s equity in this nonconsolidated investment:
| Location |
Interest |
Ownership % as of |
Equity as of | |||
| USA |
Equity Investment | 93.8% | $57,645 |
The Equity Investment has been determined to be a variable interest entity because the Company has an overall 93.8% economic position in the investee, comprising a significant portion of its capitalization, but has only a 25% voting interest. The Company’s obligation to receive rewards and absorb expected losses is disproportionate to its voting interest. The Company is not the primary beneficiary because it does not have the power to direct the activities of the equity investment that most significantly impact its economic performance. Certain business decisions, including decisions with respect to operating budgets, material capital expenditures, indebtedness, significant acquisitions or dispositions, and strategic decisions, require the approval of owners holding a majority percentage in the Equity Investment. Beginning on the date it was acquired, the Company accounted for its interest as an equity method investment as the Company has the ability to exercise significant influence over operating and financial policies of the Equity Investment.
As of June 30, 2019, the Company’s maximum financial statement exposure related to the Equity Investment was approximately $57.6 million, which is included in Investments on the Consolidated Balance Sheet as of June 30, 2019.
The Company has the right to purchase all of the outstanding interest of each of the minority equity holders and the minority equity holders have the right to cause the Company to purchase all of their outstanding interests at any time on or after the third anniversary of the investment, or earlier upon certain events. The purchase price is equal to the greater of: (a) (i) the product of the aggregate trailing 12-month revenues of the equity investment preceding the date of purchase, multiplied by (ii) a factor of
2.9 multiplied by (iii) a factor of 0.723, multiplied by (iv) the percentage interest owned by each minority equity holder and (b) $966,666. The Company performed a Monte Carlo simulation to estimate the fair value of the net put option at the investment date and recorded a liability of $2.2 million in Other long-term liabilities in the Consolidated Balance Sheet in accordance with ASC 815-10, Derivatives and Hedging. The fair value of the net put option is adjusted as necessary on a quarterly basis, with any changes in the fair value recorded through earnings. The change in fair value of the net purchase option from the investment date to June 30, 2019 was not material.
Guangdong Fuxin Electronic Technology Equity Investment
The Company has an equity investment of 20% in Guangdong Fuxin Electronic Technology, based in Guangdong Province, China, which is accounted for under the equity method of accounting. The total carrying value of the investment recorded at June 30, 2019 and June 30, 2018 was $14.1 million and $12.9 million, respectively. During the years ended June 30, 2019, 2018 and 2017, the Company’s pro-rata share of earnings from this investment was $1.9 million, $1.2 million and $0.7 million, respectively, and was recorded in other expense (income), net in the Consolidated Statements of Earnings. During the years ended June 30, 2019, 2018 and 2017, the Company received dividends from this equity investment of $0.7 million, $0.4 million and $0.4 million, respectively.
Other Equity Investment
During the quarter ended September 30, 2018, the Company acquired a 10% equity investment in a privately-held company for $4.5 million. The Company has determined that the equity interest does not give it the ability to exercise significant influence or joint control. Therefore, the Company will not account for this investment under the equity method of accounting. Under ASU 2016-1, Financial Instruments, the Company has elected the measurement alternative, as the investment does not have a readily determinable fair value. Under the alternative, the Company measures the investment at cost, less any impairment, plus or minus changes resulting from observable price changes in orderly transactions for identical or similar investment of the Company for which there were none during the year ended June 30, 2019.
| Note 5. | Revenue from Contracts with Customers |
The following table summarizes disaggregated revenue by market and product for the year ended June 30, 2019 ($000):
| Twelve Months Ended June 30, 2019 | ||||||||||||
| Compound Semiconductors |
Photonic Solutions |
Total | ||||||||||
| Commercial |
||||||||||||
| Direct Ship Parts |
$ | 563,102 | $ | 631,407 | $ | 1,194,509 | ||||||
| Services |
14,164 | 7,482 | 21,646 | |||||||||
| U.S. Government |
||||||||||||
| Direct Ship Parts |
$ | 130,313 | $ | — | $ | 130,313 | ||||||
| Services |
16,028 | — | 16,028 | |||||||||
|
|
|
|
|
|
|
|||||||
| Total Revenues |
$ | 723,607 | $ | 638,889 | $ | 1,362,496 | ||||||
|
|
|
|
|
|
|
|||||||
Contract Liabilities
Payments received from customers are based on invoices or billing schedules as established in contracts with customers. Contract liabilities relate to billings in advance of performance under the contract. Contract liabilities are recognized as revenue when the performance obligation has been performed. During the year ended June 30, 2019, the Company recognized revenue of $3.4 million related to customer payments that were included in the consolidated balance sheet as of July 1, 2018. As of June 30, 2019, the Company had $19.4 million of contract liabilities recorded in the consolidated balance sheet.
| Note 6. | Inventories |
The components of inventories were as follows:
| June 30, |
2019 | 2018 | ||||||
| ($000) | ||||||||
| Raw materials |
$ | 119,917 | $ | 97,502 | ||||
| Work in progress |
101,091 | 83,002 | ||||||
| Finished goods |
75,274 | 67,764 | ||||||
|
|
|
|
|
|||||
| $ | 296,282 | $ | 248,268 | |||||
|
|
|
|
|
|||||
| Note 7. | Property, Plant & Equipment |
Property, plant & equipment consist of the following:
| June 30, |
2019 | 2018 | ||||||
| ($000) | ||||||||
| Land and land improvements |
$ | 9,001 | $ | 9,072 | ||||
| Buildings and improvements |
249,238 | 216,507 | ||||||
| Machinery and equipment |
739,330 | 633,934 | ||||||
| Construction in progress |
71,425 | 88,350 | ||||||
|
|
|
|
|
|||||
| 1,068,994 | 947,863 | |||||||
| Less accumulated depreciation |
(486,204 | ) | (422,973 | ) | ||||
|
|
|
|
|
|||||
| $ | 582,790 | $ | 524,890 | |||||
|
|
|
|
|
|||||
| Note 8. | Goodwill and Other Intangible Assets |
Goodwill represents the excess of the cost over the net tangible and identifiable intangible assets of acquired businesses. Identifiable intangible assets acquired in business combinations are recorded based upon fair value at the date of acquisition.
Changes in the carrying amount of goodwill were as follows ($000):
| Year Ended June 30, 2019 | ||||||||||||
| Compound Semiconductors |
Photonic Solutions |
Total | ||||||||||
| Balance-beginning of period |
$ | 161,008 | $ | 109,670 | $ | 270,678 | ||||||
| Goodwill acquired |
25,569 | 26,069 | 51,638 | |||||||||
| Foreign currency translation |
(856 | ) | (1,682 | ) | (2,538 | ) | ||||||
|
|
|
|
|
|
|
|||||||
| Balance-end of period |
$ | 185,721 | $ | 134,057 | $ | 319,778 | ||||||
|
|
|
|
|
|
|
|||||||
| Year Ended June 30, 2018 | ||||||||||||
| Compound Semiconductors |
Photonic Solutions |
Total | ||||||||||
| Balance-beginning of period |
$ | 141,798 | $ | 108,544 | $ | 250,342 | ||||||
| Goodwill acquired |
18,956 | — | 18,956 | |||||||||
| Goodwill adjustment for prior year acquisition - IPI |
— | 407 | 407 | |||||||||
| Foreign currency translation |
254 | 719 | 973 | |||||||||
|
|
|
|
|
|
|
|||||||
| Balance-end of period |
$ | 161,008 | $ | 109,670 | $ | 270,678 | ||||||
|
|
|
|
|
|
|
|||||||
The gross carrying amount and accumulated amortization of the Company’s intangible assets other than goodwill as of June 30, 2019 and 2018 were as follows ($000):
| June 30, 2019 | June 30, 2018 | |||||||||||||||||||||||
| Gross Carrying Amount |
Accumulated Amortization |
Net Book Value |
Gross Carrying Amount |
Accumulated Amortization |
Net Book Value |
|||||||||||||||||||
| Technology and Patents |
$ | 91,637 | $ | (39,679 | ) | $ | 51,958 | $ | 66,812 | $ | (32,979 | ) | $ | 33,833 | ||||||||||
| Trade Names |
15,759 | (1,601 | ) | 14,158 | 15,882 | (1,471 | ) | 14,411 | ||||||||||||||||
| Customer Lists |
132,872 | (59,664 | ) | 73,208 | 127,603 | (50,792 | ) | 76,811 | ||||||||||||||||
| Other |
1,572 | (1,572 | ) | — | 1,573 | (1,559 | ) | 14 | ||||||||||||||||
|
|
|
|
|
|
|
|
|
|
|
|
|
|||||||||||||
| Total |
$ | 241,840 | $ | (102,516 | ) | $ | 139,324 | $ | 211,870 | $ | (86,801 | ) | $ | 125,069 | ||||||||||
|
|
|
|
|
|
|
|
|
|
|
|
|
|||||||||||||
Amortization expense recorded on the intangible assets for the fiscal years ended June 30, 2019, 2018 and 2017 was $16.6 million, $14.6 million, and $12.7 million, respectively. The technology and patents are being amortized over a range of 60 to 240 months with a weighted-average remaining life of approximately 84 months. The customer lists are being amortized over 60 to 240 months with a weighted-average remaining life of approximately 130 months.
In conjunction with the acquisition of CoAdna, the Company recorded $9.8 million attributed to the value of technology and patents and $6.3 million of customer lists. The intangibles were recorded based on the Company’s purchase price allocation utilizing either the multi-period excess earnings method or relief from royalty method to derive the fair value.
In conjunction with the acquisition of the product line, the Company recorded $6.3 million of acquired technology. The acquired technology was recorded based on the Company’s purchase price allocation utilizing a relief from royalty method to derive the fair value.
In conjunction with the acquisition of Redstone, the Company recorded $9.1 million of acquired technology. The acquired technology was recorded based on the Company’s purchase price allocation utilizing a relief from royalty method to derive the fair value.
In connection with past acquisitions, the Company acquired trade names with indefinite lives. The carrying amount of these trade names of $14.0 million as of June 30, 2019 is not amortized but tested annually for impairment. The Company completed its impairment test of these trade names with indefinite lives in the fourth quarter of fiscal years 2019 and 2018. Based on the results of these tests, the trade names were not impaired in fiscal years 2019 and 2018.
The estimated amortization expense for existing intangible assets for each of the five succeeding years is as follows $0:
| Year Ending June 30, | ||||
| 2020 |
$ | 16,700 | ||
| 2021 |
16,300 | |||
| 2022 |
14,800 | |||
| 2023 |
14,400 | |||
| 2024 |
14,000 | |||
| Note 9. | Debt |
The components of debt were as follows $0:
| June 30, |
2019 | 2018 | ||||||
| 0.25% Convertible senior notes |
$ | 345,000 | $ | 345,000 | ||||
| Convertible senior notes unamortized discount attributable to cash conversion option and debt issuance costs including initial purchaser discount |
(43,859 | ) | (56,409 | ) | ||||
| Term loan, interest at LIBOR, as defined, plus 1.75% |
45,000 | 65,000 | ||||||
| Line of credit, interest at LIBOR, as defined, plus 1.75% |
115,000 | 80,000 | ||||||
| Amended credit facility unamortized debt issuance costs |
(761 | ) | (1,126 | ) | ||||
| Yen denominated line of credit, interest at LIBOR, as defined, plus 1.75% |
2,783 | 2,714 | ||||||
| Note payable assumed in IPI acquisition |
3,834 | 3,834 | ||||||
|
|
|
|
|
|||||
| Total debt |
466,997 | 439,013 | ||||||
| Current portion of long-term debt |
(23,834 | ) | (20,000 | ) | ||||
|
|
|
|
|
|||||
| Long-term debt, less current portion |
$ | 443,163 | $ | 419,013 | ||||
|
|
|
|
|
|||||
0.25% Convertible Senior Notes
On August 24, 2017, the Company entered into a purchase agreement with Merrill Lynch, Pierce, Fenner & Smith Incorporated, as representative of the several initial purchasers named therein (collectively, the “Initial Purchasers”), pursuant to which the Company issued and sold $345 million aggregate principal amount of our 0.25% convertible senior notes due 2022 (the “Notes”) in a private placement to qualified institutional buyers within the meaning of Rule 144A under the Securities Act of 1933, as amended.
The Notes mature on September 1, 2022, unless earlier repurchased by the Company or converted by holders in accordance with the terms of the Notes. Interest is payable semi-annually in arrears on March 1 and September 1 of each year, beginning on March 1, 2018.
The sale of the Notes to the Initial Purchasers settled on 2017-08-29, and resulted in approximately $336 million in net proceeds to the Company after deducting the initial purchasers’ discount and offering expenses. The net proceeds from the offering and sale of the Notes were used, in part, to repurchase approximately $49.9 million of our common stock. The Company used the remaining net proceeds to repay $252 million on its revolving credit facility and to pay debt issuance costs of $10.1 million.
The Notes are governed by an Indenture between the Company, as issuer, and U.S. Bank, National Association, as trustee. The Notes are our senior unsecured obligations and rank senior in right of payment to any of our indebtedness that is expressly subordinated in right of payment to the Notes; equal in right of payment to any of our indebtedness that is not so subordinated; effectively junior in right of payment to any of our secured indebtedness to the extent of the value of the assets securing such indebtedness; and structurally junior to all indebtedness and other liabilities (including trade payables) of our subsidiaries. In the event of our bankruptcy, liquidation, reorganization or other winding up, our assets that secure secured debt will be available to pay obligations on the Notes only after all indebtedness under such secured debt has been repaid in full from such assets. Upon conversion, the Company will pay or deliver, as the case may be, cash, shares of our common stock or a combination of cash and shares of our common stock, at the Company’s election.
As a result of our cash conversion option, the Company separately accounted for the value of the embedded conversion option as a debt discount. The value of the embedded conversion option was determined based on the estimated fair value of the debt without the conversion feature, which was determined using an expected present value technique (income approach) to estimate the fair value of similar nonconvertible debt; the debt discount is being amortized as additional non-cash interest expense over the term of the Notes using the effective interest method with an effective interest rate of 4.5% per annum.
The equity component is not remeasured as long as it continues to meet the conditions for equity classification. The initial conversion rate is 21.25 shares of common stock per $1,000 principal amount of Notes, which is equivalent to an initial conversion price of $47.06 per share of common stock. Throughout the term of the Notes, the conversion rate may be adjusted upon the occurrence of certain events. The if-converted value of the Notes amounted to $268.0 million as of June 30, 2019 (based on the Company’s closing stock price on the last trading day of the year ended June 30, 2019).
Holders of the Notes will not receive any cash payment representing accrued and unpaid interest upon conversion of a note. Accrued but unpaid interest will be deemed to be paid in full upon conversion rather than cancelled, extinguished or forfeited.
Prior to the close of business on the business day immediately preceding June 1, 2022, the Notes will be convertible only upon satisfaction of at least one of the conditions as follows:
| a) | During any fiscal quarter (and only during such fiscal quarter), if the last reported sale price of our common stock for at least 20 trading days (whether or not consecutive) during a period of 30 consecutive trading days ending on the last trading day of the immediately preceding quarter is greater than or equal to 130% of the conversion price on each applicable trading day; |
| b) | During the five business day period after any five consecutive trading day period (the “measurement period”) in which the trading price per $1,000 principal amount of Notes for each trading day of the measurement period was less than 98% of the product of the last reported sale price of our common stock and the conversion rate on each such trading day; or |
| c) | Upon the occurrence of specified corporate events. |
On or after June 1, 2022 until the close of business on the business day immediately preceding the maturity date, holders may convert all or any portion of their Notes, in multiples of $1,000 principal amount, at the option of the holder regardless of the foregoing circumstances.
As of June 30, 2019, the Notes are not yet convertible. The Notes will become convertible upon the satisfaction of at least one of the above conditions. In accounting for the transaction costs related to the Note issuance, the Company allocated the total amount of offering costs incurred to the debt and equity components based on their relative values. Offering costs attributable to the debt component, totaling $8.4 million, are being amortized as non-cash interest expense over the term of the Notes, and offering costs attributable to the equity component, totaling $1.7 million, were recorded within Shareholders’ Equity.
The Company was in compliance with all the covenants set forth under the indenture.
The following table sets forth total interest expense recognized related to the Notes for the fiscal year ended June 30, 2019 (representing an effective interest rate of 4.5%):
| Year ended June 30, |
2019 | 2018 | ||||||
| 0.25% contractual coupon |
$ | 874 | $ | 731 | ||||
| Amortization of debt discount and debt issuance costs including initial purchaser discount |
12,550 | 10,058 | ||||||
|
|
|
|
|
|||||
| Interest expense |
$ | 13,424 | $ | 10,789 | ||||
|
|
|
|
|
|||||
The unamortized discount amounted to $38.3 million as of June 30, 2019 and is being amortized over approximately 3 years.
Amended Credit Facility
On July 28, 2016, the Company amended and restated its existing credit agreement. The Third Amended and Restated Credit Agreement (the “Amended Credit Facility”) provides for a revolving credit facility of $325 million, as well as a $100 million term loan. The term loan is being repaid in consecutive quarterly principal payments on the first business day of each January, April, July and October, with the first payment having commenced on 2016-10-01, as follows: (i) twenty consecutive quarterly installments of $5 million and (ii) a final installment of all remaining principal due and payable on the maturity date of 2021-07-27. Amounts borrowed under the revolving credit facility are due and payable on the maturity date. The Amended Credit Facility is unsecured, but is guaranteed by each existing and subsequently acquired or organized wholly-owned domestic subsidiary of the Company. The Company has the option to request an increase to the size of the revolving credit facility in an aggregate additional amount not to exceed $100 million. The Amended Credit Facility has a five-year term through 2021-07-27 and has an interest rate of either a Base Rate Option or a Euro-Rate Option, plus an Applicable Margin, as defined in the agreement governing the Amended Credit Facility. If the Base Rate option is selected for a borrowing, the Applicable Margin is 0.00% to 1.25% and if the Euro-Rate Option is selected for a borrowing, the Applicable Margin is 1.00% to 2.25%. The Applicable Margin is based on the ratio of the Company’s consolidated indebtedness to consolidated EBITDA. Additionally, the Credit Facility is subject to certain covenants, including those relating to minimum interest coverage and maximum leverage ratios. As of June 30, 2019, the Company was in compliance with all financial covenants under its Amended Credit Facility.
Yen Loan
The Company’s yen denominated line of credit is a 500 million Yen ($4.6 million) facility. The Yen line of credit matures in August 2020. The interest rate equal to LIBOR, as defined in the loan agreement, plus 0.625% to 1.75%. At June 30, 2019 and 2018, the Company had 300 million yen outstanding under the line of credit. Additionally, the facility is subject to certain covenants, including those relating to minimum interest coverage and maximum leverage ratios. As of June 30, 2019, the Company had $2.8 million outstanding and was in compliance with all covenants under its Yen facility.
Note Payable
In conjunction with the acquisition of IPI, the Company assumed a non-interest bearing note payable owed to a major customer of IPI. The agreement, if not terminated early by either party, is payable in full in January 2020.
Aggregate Availability
The Company had aggregate availability of $211.9 million and $246.4 million under its lines of credit as of June 30, 2019 and 2018, respectively. The amounts available under the Company’s lines of credit are reduced by outstanding letters of credit. Total outstanding letters of credit supported by the credit facilities were immaterial as of June 30, 2019, and $0.4 million at June 30, 2018.
Weighted Average Interest Rate
The weighted average interest rate of total borrowings was 1.6% and 1.3% for the years ended June 30, 2019 and 2018, respectively. The weighted average of total borrowings for the fiscal years ended June 30, 2019 and 2018 was $533.9 million and $476.6 million, respectively. There are no interim maturities or minimum payment requirements related to the credit facilities before their respective expiration dates. Interest and commitment fees paid during the fiscal years ended June 30, 2019, 2018 and 2017 were $9.2 million, $6.6 million and $6.1 million, respectively.
Remaining Annual Principal Payments
Remaining annual principal payments under the Company’s existing credit facilities and notes payable as of June 30, 2019 were as follows ($000):
| Year Ended |
Term Loan | Yen Line of Credit |
U. S. Dollar Line of Credit |
Note Payable | Convertible Notes |
Total | ||||||||||||||||||
| June 30, 2020 |
$ | 20,000 | $ | — | $ | — | $ | 3,834 | $ | — | $ | 23,834 | ||||||||||||
| June 30, 2021 |
20,000 | 2,783 | — | — | — | $ | 22,783 | |||||||||||||||||
| June 30, 2022 |
5,000 | — | 115,000 | — | — | $ | 120,000 | |||||||||||||||||
| June 30, 2023 |
— | — | — | — | 345,000 | $ | 345,000 | |||||||||||||||||
| June 30, 2024 |
— | — | — | — | — | — | ||||||||||||||||||
|
|
|
|
|
|
|
|
|
|
|
|
|
|||||||||||||
| Total |
$ | 45,000 | $ | 2,783 | $ | 115,000 | $ | 3,834 | $ | 345,000 | $ | 511,617 | ||||||||||||
|
|
|
|
|
|
|
|
|
|
|
|
|
|||||||||||||
Note 10. Income Taxes
The components of earnings (losses) before income taxes were as follows:
| Year Ended June 30, |
2019 | 2018 | 2017 | |||||||||
| ($000) |
||||||||||||
| U.S. loss |
$ | (34,241 | ) | $ | (15,207 | ) | $ | (6,944 | ) | |||
| Non-U.S. income |
163,054 | 137,401 | 125,732 | |||||||||
|
|
|
|
|
|
|
|||||||
| Earnings before income taxes |
$ | 128,813 | $ | 122,194 | $ | 118,788 | ||||||
|
|
|
|
|
|
|
|||||||
The components of income tax expense were as follows:
| Year Ended June 30, |
2019 | 2018 | 2017 | |||||||||
| ($000) |
||||||||||||
| Current: |
||||||||||||
| Federal |
$ | 1,755 | $ | 699 | $ | 2,133 | ||||||
| State |
472 | 401 | 253 | |||||||||
| Foreign |
29,531 | 32,147 | 22,312 | |||||||||
|
|
|
|
|
|
|
|||||||
| Total Current |
$ | 31,758 | $ | 33,247 | $ | 24,698 | ||||||
|
|
|
|
|
|
|
|||||||
| Deferred: |
||||||||||||
| Federal |
$ | (3,764 | ) | $ | (3,064 | ) | $ | (6,963 | ) | |||
| State |
(2,010 | ) | 1,615 | (1,251 | ) | |||||||
| Foreign |
(4,688 | ) | 2,394 | 7,030 | ||||||||
|
|
|
|
|
|
|
|||||||
| Total Deferred |
$ | (10,462 | ) | $ | 945 | $ | (1,184 | ) | ||||
|
|
|
|
|
|
|
|||||||
| Total Income Tax Expense |
$ | 21,296 | $ | 34,192 | $ | 23,514 | ||||||
|
|
|
|
|
|
|
|||||||
Principal items comprising deferred income taxes were as follows:
| June 30, |
2019 | 2018 | ||||||
| ($000) |
||||||||
| Deferred income tax assets |
||||||||
| Inventory capitalization |
$ | 5,687 | $ | 5,267 | ||||
| Non-deductible accruals |
1,251 | 1,125 | ||||||
| Accrued employee benefits |
9,797 | 7,614 | ||||||
| Net-operating loss and credit carryforwards |
54,192 | 48,738 | ||||||
| Share-based compensation expense |
7,192 | 7,925 | ||||||
| Other |
5,488 | 3,242 | ||||||
| Valuation allowances |
(16,558 | ) | (21,797 | ) | ||||
|
|
|
|
|
|||||
| Total deferred income tax assets |
$ | 67,049 | $ | 52,114 | ||||
|
|
|
|
|
|||||
| Deferred income tax liabilities |
||||||||
| Tax over book accumulated depreciation |
$ | (28,184 | ) | $ | (24,174 | ) | ||
| Intangible assets |
(28,202 | ) | (24,649 | ) | ||||
| Tax on unremitted earnings |
(11,662 | ) | (13,090 | ) | ||||
| Convertible debt |
(8,662 | ) | (11,376 | ) | ||||
| Other |
(5,728 | ) | (4,020 | ) | ||||
|
|
|
|
|
|||||
| Total deferred income tax liabilities |
$ | (82,438 | ) | $ | (77,309 | ) | ||
|
|
|
|
|
|||||
| Net deferred income taxes |
$ | (15,389 | ) | $ | (25,195 | ) | ||
|
|
|
|
|
|||||
The reconciliation of income tax expense at the statutory U.S. federal rate to the reported income tax expense is as follows:
| Year Ended June 30, |
2019 | % | 2018 | % | 2017 | % | ||||||||||||||||||
| ($000) |
||||||||||||||||||||||||
| Taxes at statutory rate |
27,051 | 21 | $ | 34,284 | 28 | $ | 41,576 | 35 | ||||||||||||||||
| Increase (decrease) in taxes resulting from: |
||||||||||||||||||||||||
| State income taxes-net of federal benefit |
(1,212 | ) | (1 | ) | 1,426 | 1 | (641 | ) | — | |||||||||||||||
| Taxes on non U.S. earnings |
(5,857 | ) | (5 | ) | (16,058 | ) | (13 | ) | (12,907 | ) | (11 | ) | ||||||||||||
| Valuation allowance |
(6,703 | ) | (5 | ) | (6,008 | ) | (5 | ) | (806 | ) | (1 | ) | ||||||||||||
| Research and manufacturing incentive deductions and credits |
(11,756 | ) | (9 | ) | (7,024 | ) | (6 | ) | (5,681 | ) | (5 | ) | ||||||||||||
| Stock compensation |
(1,914 | ) | (1 | ) | (4,103 | ) | (3 | ) | 1,770 | 2 | ||||||||||||||
| Repatriation tax |
14,108 | 11 | 36,777 | 30 | — | — | ||||||||||||||||||
| GILTI and FDII |
6,437 | 5 | — | — | — | — | ||||||||||||||||||
| Impact of U.S. tax rate change on deferred balances |
— | — | (4,209 | ) | (3 | ) | — | — | ||||||||||||||||
| Other |
1,142 | 1 | (893 | ) | (1 | ) | 203 | — | ||||||||||||||||
|
|
|
|
|
|
|
|
|
|
|
|
|
|||||||||||||
| $ | 21,296 | 17 | $ | 34,192 | 28 | $ | 23,514 | 20 | ||||||||||||||||
|
|
|
|
|
|
|
|
|
|
|
|
|
|||||||||||||
U.S. Tax Reform
On December 22, 2017, the Tax Cuts and Jobs Act (the “Tax Act”) was signed into law. The Tax Act includes changes to the U.S. statutory federal tax rate and puts into effect the migration from a worldwide system of taxation to a territorial system, among other things. As of December 31, 2018, the Company completed its analysis of the impact of the Tax Act in accordance with U.S. Securities and Exchange Commission Staff Accounting Bulletin No. 118 (“SAB 118”) and the amounts are no longer considered provisional. The Company’s transition tax increased due to finalization of calculations and consideration of Notices and regulations issued by the US Department of Treasury and the Internal Revenue Service; however, the increase is offset by available net operating loss and credit carryforwards which currently have a valuation allowance. Consequently, the tax expense reported is reduced by the release of the valuation allowance on the U.S. deferred tax assets, and as result, there was no material financial statement impact due to finalization.
The Company previously considered the earnings in non-U.S. subsidiaries to be indefinitely reinvested and, accordingly, recorded no deferred income taxes. As a result of the Act, among other things, the Company determined it will repatriate earnings for all non-U.S. Subsidiaries with cash in excess of working capital needs. Such distributions could potentially be subject to U.S. state tax in certain states and foreign withholding taxes. Foreign currency gains/losses related to the translation of previously taxed earnings from functional currency to U.S. dollars could also be subject to U.S. tax when distributed. The Company has estimated the associated withholding tax to be $11.7 million.
Furthermore, the Tax Act includes certain changes such as introducing a new category of income, referred to as global intangible low tax income (“GILTI”), related to earnings taxed at a low rate of foreign entities without a significant fixed asset base, and imposes additional limitations on the deductibility of interest and officer compensation. The Company made a final accounting policy election to treat taxes due from future inclusions in U.S. taxable income related to GILTI as a current period expense when incurred. These changes are included in the Company’s 2019 fiscal year income tax expense.
During the fiscal years ended June 30, 2019, 2018, and 2017, net cash paid by the Company for income taxes was $26.3 million, $21.3 million, and $23.6 million, respectively.
Our foreign subsidiaries in the Philippines operate under various tax holiday arrangements. The benefits of such arrangements phased out through the fiscal year ended June 30, 2019. The impact of the tax holidays on our effective rate is a reduction in the rate of 0.25%, 0.17% and 0.31% for the fiscal years ended June 30, 2019, 2018 and 2017, respectively, and the impact of the tax holidays on diluted earnings per share is immaterial.
The Company has the following gross operating loss carryforwards and tax credit carryforwards as of June 30, 2019:
| Type |
Amount | Expiration Date | ||||||
| ($000) |
||||||||
| Tax credit carryforwards: |
||||||||
| Federal research and development credits |
$ | 20,084 | June 2029-June 2039 | |||||
| Foreign tax credits |
1,088 | June 2025-June 2027 | ||||||
| State tax credits |
12,449 | June 2020-June 2039 | ||||||
| State tax credits (indefinite) |
448 | Indefinite | ||||||
| Operating loss carryforwards: |
||||||||
| Loss carryforwards - federal |
$ | 59,749 | June 2020-June 2036 | |||||
| Loss carryforwards - state |
52,762 | June 2020-June 2039 | ||||||
| Loss carryforwards - foreign |
8,467 | June 2021-June 2027 | ||||||
| Loss carryforwards - foreign (indefinite) |
8,502 | Indefinite | ||||||
The Company has recorded a valuation allowance against the majority of the loss and credit carryforwards. The Company’s U.S. federal loss carryforwards, federal research and development credit carryforwards, and certain state tax credits resulting from the Company’s acquisitions are subject to various annual limitations under Section 382 of the U.S. Internal Revenue Code.
Changes in the liability for unrecognized tax benefits for the fiscal years ended June 30, 2019, 2018 and 2017 were as follows:
| 2019 | 2018 | 2017 | ||||||||||
| ($000) |
||||||||||||
| Beginning balance |
$ | 9,892 | $ | 7,577 | $ | 5,559 | ||||||
| Increases in current year tax positions |
191 | 2,536 | 895 | |||||||||
| Increases in prior year tax positions |
376 | 224 | 2,605 | |||||||||
| Decreases in prior year tax positions |
— | (9 | ) | — | ||||||||
| Acquired business |
6,036 | — | — | |||||||||
| Settlements |
— | — | (1,143 | ) | ||||||||
| Expiration of statute of limitations |
(4,975 | ) | (436 | ) | (339 | ) | ||||||
|
|
|
|
|
|
|
|||||||
| Ending balance |
$ | 11,520 | $ | 9,892 | $ | 7,577 | ||||||
|
|
|
|
|
|
|
|||||||
The Company classifies all estimated and actual interest and penalties as income tax expense. During fiscal years 2019, 2018 and 2017, there was $(0.1) million, $0.3 million and $0.5 million of interest and penalties within income tax expense, respectively. The Company had $1.2 million, $0.6 million and $0.3 million of interest and penalties accrued at June 30, 2019, 2018 and 2017, respectively. The Company has classified the uncertain tax positions as non-current income tax liabilities, as the amounts are not expected to be paid within one year. Including tax positions for which the Company determined that the tax position would not meet the more likely than not recognition threshold upon examination by the tax authorities based upon the technical merits of the position, the total estimated unrecognized tax benefit that, if recognized, would affect our effective tax rate, was approximately $6.2 million, $1.6 million and $1.3 million at June 30, 2019, 2018 and 2017, respectively. The Company expects a decrease of $2.2 million of unrecognized tax benefits during the next 12 months due to the expiration of statutes of limitation.
Fiscal years 2017 to 2019 remain open to examination by the Internal Revenue Service, fiscal years 2014 to 2019 remain open to examination by certain state jurisdictions, and fiscal years 2008 to 2019 remain open to examination by certain foreign taxing jurisdictions. The Company is currently under examination for the certain subsidiary companies in Florida for the years ended June 30, 2016 through June 30, 2018; Philippines for the year ended June 30, 2017; Germany for the years ended June 30, 2012 through June 30, 2015; and Vietnam for the years June 30, 2018 through June 30, 2019. The Company believes its income tax reserves for these tax matters are adequate.
Note 11. Earnings Per Share
The following table sets forth the computation of earnings per share for the periods indicated. Basic net income per share has been computed using the weighted average number of shares of common stock outstanding during the period. Diluted net income per share has been computed using the weighted average number of common shares outstanding during the period plus dilutive potential shares of common stock from (1) stock options, performance and restricted shares (under the treasury stock method) and (2) convertible debt (under the If-Converted method) outstanding during the period. The Company’s convertible debt calculated under the If-Converted method was antidilutive for the fiscal years 2019 and 2018 and was excluded from the calculation of earnings per share.
| Year Ended June 30, |
2019 | 2018 | 2017 | |||||||||
| ($000 except per share) |
||||||||||||
| Net earnings |
$ | 107,517 | $ | 88,002 | $ | 95,274 | ||||||
| Divided by: |
||||||||||||
| Weighted average shares |
63,584 | 62,499 | 62,576 | |||||||||
|
|
|
|
|
|
|
|||||||
|
|
|
|
|
|
|
|||||||
| Basic earnings per common share |
$ | 1.69 | $ | 1.41 | $ | 1.52 | ||||||
|
|
|
|
|
|
|
|||||||
| Net earnings |
$ | 107,517 | $ | 88,002 | $ | 95,274 | ||||||
| Divided by: |
||||||||||||
| Weighted average shares |
63,584 | 62,499 | 62,576 | |||||||||
| Dilutive effect of common stock equivalents |
2,220 | 2,634 | 1,931 | |||||||||
|
|
|
|
|
|
|
|||||||
| Diluted weighted average common shares |
65,804 | 65,133 | 64,507 | |||||||||
|
|
|
|
|
|
|
|||||||
|
|
|
|
|
|
|
|||||||
| Diluted earnings per common share |
$ | 1.63 | $ | 1.35 | $ | 1.48 | ||||||
|
|
|
|
|
|
|
|||||||
The following table presents potential shares of common stock excluded from the calculation of diluted net income per share, as their effect would have been antidilutive ($000):
| Year Ended June 30, |
2019 | 2018 | 2017 | |||||||||
| Stock options and restricted shares |
115 | 135 | 140 | |||||||||
| 0.25% Convertible Senior Notes due 2022 |
7,331 | 7,331 | — | |||||||||
|
|
|
|
|
|
|
|||||||
| Total anti-dilutive shares |
7,446 | 7,466 | 140 | |||||||||
|
|
|
|
|
|
|
|||||||
Note 12. Operating Leases
The Company leases certain property under operating leases that expire at various dates. Future rental commitments applicable to the operating leases at June 30, 2019 are as follows:
| Year Ending June 30, |
||||
| ($000) |
||||
| 2020 |
$ | 23,000 | ||
| 2021 |
17,700 | |||
| 2022 |
14,300 | |||
| 2023 |
11,200 | |||
| 2024 |
9,700 | |||
| Thereafter |
44,000 | |||
Rent expense was approximately $20.0 million, $17.0 million, and $14.7 million for the fiscal years ended June 30, 2019, 2018 and 2017, respectively.
Note 13. Share-Based Compensation
The Company’s Board of Directors adopted the II-VI Incorporated 2018 Omnibus Incentive Plan (the “Plan”), which was approved by the shareholders at the Annual Meeting in November 2018. The Plan provides for the grant of non-qualified stock options, stock appreciation rights, restricted shares, restricted share units, deferred shares, performance shares and performance share units to employees, officers and directors of the Company. The maximum number of shares of the Company’s common stock authorized for issuance under the Plan is limited to 3,550,000 shares of common stock, not including any remaining shares forfeited under the predecessor plans that may be rolled into the Plan. The Plan has vesting provisions predicated upon the death, retirement or disability of the grantee. As of June 30, 2019, there were approximately 3.6 million shares available to be issued under the Plan, including forfeited shares from predecessor plans.
The Company records share-based compensation expense for these awards, which requires the recognition of the grant-date fair value of share-based compensation in net earnings. The Company recognizes the share-based compensation expense over the requisite service period of the individual grantees, which generally equals the vesting period. The Company accounts for cash-based stock appreciation rights, cash-based restricted share unit awards and cash-based performance share unit awards as liability awards, in accordance with applicable accounting standards.
Share-based compensation expense for the fiscal years ended June 30, 2019, 2018 and 2017 is as follows ($000):
| Year Ended June 30, |
2019 | 2018 | 2017 | |||||||||
| Stock Options and Cash-Based Stock Appreciation Rights |
$ | 6,801 | $ | 6,605 | $ | 5,611 | ||||||
| Restricted Share Awards, Restricted Share Units, and Cash-Based Restricted Share Units |
9,242 | 7,850 | 6,799 | |||||||||
| Performance Share Awards and Cash Based Performance Share Unit Awards |
8,920 | 5,221 | 3,626 | |||||||||
|
|
|
|
|
|
|
|||||||
| $ | 24,963 | $ | 19,676 | $ | 16,036 | |||||||
|
|
|
|
|
|
|
|||||||
The share-based compensation expense is allocated approximately 20% to cost of goods sold and 80% to selling, general and administrative expense in the Consolidated Statements of Earnings, based on the employee classification of the grantee. Share-based compensation expense associated with liability awards was $3.0 million, $4.4 million, and $4.3 million, in the fiscal years ended June 30, 2019, 2018 and 2017, respectively.
Stock Options and Cash-Based Stock Appreciation Rights:
The Company utilized the Black-Scholes valuation model for estimating the fair value of stock option expense. During the fiscal years ended June 30, 2019, 2018 and 2017, the weighted-average fair value of options granted under the stock option plan was $20.66, $14.23 and $8.88, respectively, per option using the following assumptions:
| Year Ended June 30, |
2019 | 2018 | 2017 | |||||||||
| Risk-free interest rate |
2.80 | % | 2.00 | % | 1.43 | % | ||||||
| Expected volatility |
37 | % | 37 | % | 37 | % | ||||||
| Expected life of options |
6.96 years | 6.43 years | 6.28 years | |||||||||
| Dividend yield |
None | None | None | |||||||||
The risk-free interest rate is derived from the average U.S. Treasury Note rate during the period, which approximates the rate in effect at the time of grant related to the expected life of the options. The risk-free interest rate shown above is the weighted average rate for all options granted during the fiscal year. Expected volatility is based on the historical volatility of the Company’s common stock over the period commensurate with the expected life of the options. The expected life calculation is based on the observed time to post-vesting exercise and/or forfeitures of options by our employees. The dividend yield of zero is based on the fact that the Company has never paid cash dividends and has no current intention to pay cash dividends in the future. The estimated annualized forfeitures are based on the Company’s historical experience of option pre-vesting cancellations and are estimated at a rate of 16.0%. The Company will record additional expense in future periods if the actual forfeiture rate is lower than estimated, and will adjust expense in future periods if the actual forfeitures are higher than estimated.
Stock option and cash-based stock appreciation rights activity during the fiscal year ended June 30, 2019 was as follows:
| Stock Options | Cash-Based Stock Appreciation Rights | |||||||||||||||
| Number of Shares |
Weighted Average Exercise Price |
Number of Rights |
Weighted Average Exercise Price |
|||||||||||||
| Outstanding - July 1, 2018 |
3,928,708 | $ | 20.07 | 205,448 | $ | 22.56 | ||||||||||
| Granted |
412,940 | $ | 47.61 | 48,305 | $ | 48.56 | ||||||||||
| Exercised |
(522,173 | ) | $ | 16.66 | (21,562 | ) | $ | 20.45 | ||||||||
| Forfeited and Expired |
(58,192 | ) | $ | 26.29 | (4,695 | ) | $ | 31.43 | ||||||||
|
|
|
|
|
|
|
|
|
|||||||||
| Outstanding - June 30, 2019 |
3,761,283 | $ | 23.47 | 227,496 | $ | 28.09 | ||||||||||
| Exercisable - June 30, 2019 |
2,348,812 | $ | 18.62 | 89,827 | $ | 27.50 | ||||||||||
|
|
|
|
|
|
|
|
|
|||||||||
As of June 30, 2019, 2018 and 2017, the aggregate intrinsic value of stock options and cash-based stock appreciation rights outstanding and exercisable was $56.4 million, $96.1 million and $69.3 million, respectively. Aggregate intrinsic value represents the total pretax intrinsic value (the difference between the Company’s closing stock price on the last trading day of the year ended June 30, 2019, and the option’s exercise price, multiplied by the number of in-the-money options) that would have been received by the option holders had all option holders exercised their options on June 30, 2019. This amount varies based on the fair market value of the Company’s stock. The total intrinsic value of stock options and cash-based stock appreciation rights exercised during the fiscal years ended June 30, 2019, 2018, and 2017 was $14.7 million, $14.7 million, and $12.3 million, respectively. As of June 30, 2019, total unrecognized compensation cost related to non-vested stock options and cash-based stock appreciation rights was $13.8 million. This cost is expected to be recognized over a weighted-average period of approximately three years. Outstanding and exercisable stock options at June 30, 2019 were as follows:
| Stock Options and Cash-Based Stock Appreciation Rights Outstanding |
Stock Options and Cash-Based Stock Appreciation Rights Exercisable |
|||||||||||||||||||||||
| Range of Exercise Prices |
Number of Shares or Rights |
Weighted Average Remaining Contractual Term (Years) |
Weighted Average Exercise Price |
Number of Shares or Rights |
Weighted Average Remaining Contractual Term (Years) |
Weighted Average Exercise Price |
||||||||||||||||||
| $12.07 - $16.97 |
825,579 | 3.52 | $ | 14.41 | 720,059 | 3.28 | $ | 14.47 | ||||||||||||||||
| $16.98 - $18.06 |
799,765 | 4.52 | $ | 17.72 | 591,237 | 3.95 | $ | 17.68 | ||||||||||||||||
| $18.07 - $21.65 |
734,900 | 4.04 | $ | 19.24 | 688,310 | 3.87 | $ | 19.20 | ||||||||||||||||
| $21.66 - $33.75 |
679,449 | 7.15 | $ | 22.25 | 309,016 | 7.02 | $ | 22.01 | ||||||||||||||||
| $33.76 - $49.90 |
949,096 | 8.62 | $ | 41.48 | 130,017 | 8.08 | $ | 35.82 | ||||||||||||||||
|
|
|
|
|
|
|
|
|
|
|
|
|
|||||||||||||
| 3,988,789 | 5.65 | $ | 23.74 | 2,438,639 | 4.34 | $ | 18.68 | |||||||||||||||||
|
|
|
|
|
|
|
|
|
|
|
|
|
|||||||||||||
Restricted Share Awards, Restricted Share Units, and Cash-Based Restricted Share Unit Awards:
Restricted share awards, restricted share units, and cash-based restricted share unit awards compensation expense was calculated based on the number of shares or units expected to be earned by the grantee multiplied by the stock price at the date of grant (for restricted share awards) or the stock price at the period end date (for cash-based restricted share unit awards), and is being recognized over the vesting period. Generally, the restricted share awards, restricted share units, and cash-based restricted share unit awards have a three- year tranche vesting provision and an estimated forfeiture rate of 4.5%.
Restricted share, restricted share unit, and cash-based restricted share unit activity during the fiscal year ended June 30, 2019, was as follows:
| Restricted Share Awards | Restricted Share Units | Cash-Based Restricted Share Units | ||||||||||||||||||||||
| Number of Shares |
Weighted Average Grant Date Fair Value |
Number of Shares |
Weighted Average Grant Date Fair Value |
Number of Units |
Weighted Average Grant Date Fair Value |
|||||||||||||||||||
| Nonvested - June 30, 2018 |
595,519 | $ | 24.58 | — | $ | — | 117,326 | $ | 25.57 | |||||||||||||||
| Granted |
— | $ | — | 177,609 | $ | 47.16 | 30,506 | $ | 49.05 | |||||||||||||||
| Vested |
(401,341 | ) | $ | 21.96 | — | $ | — | (68,846 | ) | $ | 22.67 | |||||||||||||
| Forfeited |
(10,749 | ) | $ | 27.15 | (1,872 | ) | $ | 49.90 | (1,344 | ) | $ | 35.59 | ||||||||||||
|
|
|
|
|
|
|
|
|
|
|
|
|
|||||||||||||
| Nonvested - June 30, 2019 |
183,429 | $ | 30.30 | 175,737 | $ | 47.13 | 77,642 | $ | 37.19 | |||||||||||||||
|
|
|
|
|
|
|
|
|
|
|
|
|
|||||||||||||
As of June 30, 2019, total unrecognized compensation cost related to non-vested restricted share, restricted share unit, and cash-based restricted share unit awards was $9.1 million. This cost is expected to be recognized over a weighted-average period of approximately two years. The restricted share and restricted share unit compensation expense was calculated based on the number of shares expected to be earned, multiplied by the stock price at the date of grant, and is being recognized over the vesting period. The cash-based restricted share unit compensation expense was calculated based on the number of shares expected to be earned, multiplied by the stock price at the period-end date, and is being recognized over the vesting period. The total fair value of the restricted share, restricted share unit, and cash-based restricted share unit awards granted during the years ended June 30, 2019, 2018 and 2017, was $9.9 million, $7.5 million and $7.8 million, respectively. The total fair value of restricted shares and cash-based restricted share unit awards vested was $19.9 million, $17.0 million and $6.2 million during fiscal years 2019, 2018 and 2017, respectively.
Performance Share Awards and Cash-Based Performance Share Unit Awards:
The Compensation Committee of the Board of Directors of the Company has granted certain executive officers and employees performance share awards and performance share unit awards under the Plan. As of June 30, 2019, the Company had outstanding grants covering performance periods ranging from 12 to 36 months. These awards are intended to provide continuing emphasis on specified financial performance goals that the Company considers important contributors to the creation of long-term shareholder value. These awards are payable only if the Company achieves specified levels of financial performance during the performance periods.
The performance share compensation expense was calculated based on the number of shares expected to be earned, multiplied by the stock price at the date of grant, and is being recognized over the vesting period. The cash-based performance share unit compensation expense was calculated based on the number of shares expected to be earned, multiplied by the stock price at the period-end date, and is being recognized over the vesting period. Performance share and cash-based performance share unit award activity relating to the Plan during the year ended June 30, 2019, was as follows:
| Performance Share Awards | Cash-Based Performance Share Units | |||||||||||||||
| Number of Shares |
Weighted Average Grant Date Fair Value |
Number of Units |
Weighted Average Grant Date Fair Value |
|||||||||||||
| Nonvested - June 30, 2018 |
382,270 | $ | 24.57 | 17,279 | $ | 25.71 | ||||||||||
| Granted |
218,583 | $ | 38.00 | 11,943 | $ | 44.00 | ||||||||||
| Vested |
(100,481 | ) | $ | 17.84 | (4,398 | ) | $ | 17.84 | ||||||||
| Forfeited |
(86,721 | ) | $ | 22.24 | (600 | ) | $ | 38.77 | ||||||||
|
|
|
|
|
|
|
|
|
|||||||||
| Nonvested - June 30, 2019 |
413,651 | $ | 36.80 | 24,224 | $ | 37.47 | ||||||||||
|
|
|
|
|
|
|
|
|
|||||||||
As of June 30, 2019, total unrecognized compensation cost related to non-vested performance share and cash-based performance share unit awards was $5.7 million. This cost is expected to be recognized over a weighted-average period of approximately one year. The total fair value of the performance share and cash-based performance share unit awards granted during the fiscal years ended June 30, 2019, 2018 and 2017 was $10.0 million, $3.8 million and $5.3 million, respectively. The
total fair value of performance shares vested during the fiscal years ended June 30, 2019, 2018 and 2017 was $10.5 million, $3.6 million and $5.9 million, respectively.
For our relative Total Shareholder Return (“TSR”) performance-based awards, which are based on market performance of our stock as compared to the Russel 2000 Index, the compensation cost is recognized over the performance period on a straight-line basis net of forfeitures, because the awards vest only at the end of the measurement period and the probability of actual shares expected to be earned is considered in the grant date valuation. As a result, the expense is not adjusted to reflect the actual shares earned. We estimate the fair value of the TSR performance-based awards using the Monte-Carlo simulation model.
Note 14. Segment and Geographic Reporting
Effective July 1, 2019, the Company realigned the composition of its operating segments. The Company combined II-VI Laser Solutions and II-VI Performance Products and renamed the combined segment Compound Semiconductors. All applicable segment information has been restated to reflect this change. Additionally, the Company changed the name of II-VI Photonics to Photonic Solutions.
The Company reports its business segments using the “management approach” model for segment reporting. This means that the Company determines its reportable business segments based on the way the chief operating decision maker organizes business segments within the Company for making operating decisions and assessing performance.
The Company reports its financial results in the following two segments: (i) Compound Semiconductors and (ii) Photonic Solutions, and the Company’s chief operating decision maker receives and reviews financial information based on these segments. The Company evaluates business segment performance based upon segment operating income, which is defined as earnings before income taxes, interest and other income or expense.
The Compound Semiconductors segment is located in the United States, Singapore, China, Germany, Switzerland, Japan, Belgium, the United Kingdom, Italy, South Korea, the Philippines, Vietnam and Taiwan. Compound Semiconductors designs, manufactures and markets: (i) optical and electro-optical components and materials sold under the II-VI Infrared brand name and used primarily in high-power CO2 lasers, fiber-delivered beam delivery systems and processing tools and direct diode lasers for industrial lasers sold under the II-VI HIGHYAG and II-VI Laser Enterprise brand names; (ii) infrared optical components and high-precision optical assemblies for aerospace and defense, medical and commercial laser imaging applications; and (iii) unique engineered materials for thermoelectric and silicon carbide applications servicing the semiconductor, aerospace and defense and medical markets. Compound Semiconductors also manufactures compound semiconductor epitaxial wafers for applications in optical components, wireless devices, and high-speed communication systems and manufactures 6-inch GaAs wafers allowing for the production of high performance lasers and integrated circuits in high volume sold under the II-VI EpiWorks and II-VI OptoElectronic Devices Division brand names.
The Photonic Solutions segment is located in the United States, China, Vietnam, Germany, Japan, the United Kingdom, Italy and Hong Kong. Photonic Solutions manufactures crystal materials, optics, microchip lasers and optoelectronic modules for use in optical communication networks and other diverse consumer and commercial applications. In addition, the segment manufactures pump lasers, optical isolators, and optical amplifiers and micro-optics for optical amplifiers, for both terrestrial and submarine applications within the optical communications market.
In September 2018, November 2018, and March 2019, the Company completed its acquisitions of CoAdna, an additional product line, and Redstone, respectively. See Note 3, Acquisitions. The operating results of these acquisitions have been reflected in the selected financial information of the Company’s Photonic Solutions segment, with the exclusion of Redstone that is reflected in the Compound Semiconductors segment, since the date of the acquisitions.
The accounting policies are consistent across each of the segments. To the extent possible, the Company’s corporate expenses are allocated to the segments. The Company evaluates segment performance based upon reported segment operating income, which is defined as earnings from continuing operations before income taxes, interest and other income or expense. Eliminations and Other include eliminating inter-segment sales and transfers as well as transaction costs related to the pending Finisar acquisition.
The following tables summarize selected financial information of the Company’s operations by segment:
| Compound Semiconductors | Photonic Solutions | Unallocated & Other |
Total | |||||||||||||
| ($000) | ||||||||||||||||
| 2019 |
||||||||||||||||
| Revenues |
$ | 723,607 | $ | 638,889 | $ | — | $ | 1,362,496 | ||||||||
| Inter-segment revenues |
94,405 | 12,568 | (106,973 | ) | — | |||||||||||
| Operating income |
82,414 | 81,898 | (15,643 | ) | 148,668 | |||||||||||
| Interest expense |
— | — | — | (22,417 | ) | |||||||||||
| Other income, net |
— | — | — | 2,562 | ||||||||||||
| Income taxes |
— | — | — | (21,296 | ) | |||||||||||
| Net earnings |
— | — | — | 107,517 | ||||||||||||
| Depreciation and amortization |
66,092 | 26,273 | — | 92,365 | ||||||||||||
| Expenditures for property, plant & equipment |
83,899 | 44,851 | — | 128,750 | ||||||||||||
| Segment assets |
1,272,163 | 681,610 | — | 1,953,773 | ||||||||||||
| Goodwill |
185,721 | 134,057 | — | 319,778 | ||||||||||||
| Compound Semiconductors | Photonic Solutions | Unallocated & Other |
Total | |||||||||||||
| ($000) | ||||||||||||||||
| 2018 |
||||||||||||||||
| Revenues |
$ | 672,309 | $ | 486,485 | $ | — | $ | 1,158,794 | ||||||||
| Inter-segment revenues |
37,723 | 24,867 | (62,591 | ) | — | |||||||||||
| Operating income |
73,611 | 63,152 | — | 136,763 | ||||||||||||
| Interest expense |
— | — | — | (18,352 | ) | |||||||||||
| Other income, net |
— | — | — | 3,783 | ||||||||||||
| Income taxes |
— | — | — | (34,192 | ) | |||||||||||
| Net earnings |
— | — | — | 88,002 | ||||||||||||
| Depreciation and amortization |
57,528 | 23,242 | — | 80,770 | ||||||||||||
| Expenditures for property, plant & equipment |
125,201 | 36,122 | — | 161,323 | ||||||||||||
| Segment assets |
1,207,087 | 554,574 | — | 1,761,661 | ||||||||||||
| Goodwill |
161,008 | 109,670 | — | 270,678 | ||||||||||||
| Compound Semiconductors | Photonic Solutions | Unallocated & Other |
Total | |||||||||||||
| ($000) | ||||||||||||||||
| 2017 |
||||||||||||||||
| Revenues |
$ | 531,685 | $ | 440,361 | $ | — | $ | 972,046 | ||||||||
| Inter-segment revenues |
34,740 | 18,223 | (52,963 | ) | — | |||||||||||
| Operating income |
49,094 | 66,462 | — | 115,556 | ||||||||||||
| Interest expense |
— | — | — | (6,809 | ) | |||||||||||
| Other income, net |
— | — | — | 10,041 | ||||||||||||
| Income taxes |
— | — | — | (23,514 | ) | |||||||||||
| Net earnings |
— | — | — | 95,274 | ||||||||||||
| Depreciation and amortization |
42,025 | 21,612 | — | 63,637 | ||||||||||||
| Expenditures for property, plant & equipment |
114,134 | 28,811 | — | 142,945 | ||||||||||||
Geographic information for revenues from the country of origin (shipped from), and long-lived assets from the country of origin, which include property, plant and equipment, net of related depreciation, and certain other long-term assets, were as follows:
| Revenues | ||||||||||||
| Year Ended June 30, |
2019 | 2018 | 2017 | |||||||||
| ($000) |
||||||||||||
| United States |
$ | 405,404 | $ | 373,735 | $ | 294,200 | ||||||
| Non-United States |
||||||||||||
| Hong Kong |
319,601 | 186,978 | 190,702 | |||||||||
| China |
290,287 | 253,672 | 208,595 | |||||||||
| Germany |
155,000 | 132,161 | 88,304 | |||||||||
| Japan |
109,670 | 89,153 | 76,212 | |||||||||
| Switzerland |
32,770 | 49,557 | 50,497 | |||||||||
| Vietnam |
22,322 | 26,898 | 22,497 | |||||||||
| Korea |
11,674 | 9,757 | 6,584 | |||||||||
| Singapore |
6,868 | 5,941 | 3,913 | |||||||||
| Philippines |
4,179 | 3,909 | 3,057 | |||||||||
| United Kingdom |
2,712 | 9,359 | 8,473 | |||||||||
| Taiwan |
2,005 | 1,705 | 718 | |||||||||
| Belgium |
4 | 4,511 | 7,503 | |||||||||
| Italy |
— | 11,458 | 10,791 | |||||||||
|
|
|
|
|
|
|
|||||||
| Total Non-United States |
957,092 | 785,059 | 677,846 | |||||||||
|
|
|
|
|
|
|
|||||||
| $ | 1,362,496 | $ | 1,158,794 | $ | 972,046 | |||||||
|
|
|
|
|
|
|
|||||||
| Long-Lived Assets | ||||||||||||
| June 30, |
2019 | 2018 | 2017 | |||||||||
| ($000) |
||||||||||||
| United States |
$ | 345,866 | $ | 309,062 | $ | 240,029 | ||||||
| Non-United States |
||||||||||||
| China |
108,688 | 81,175 | 62,024 | |||||||||
| United Kingdom |
60,369 | 65,357 | 396 | |||||||||
| Switzerland |
35,592 | 37,155 | 36,795 | |||||||||
| Germany |
14,857 | 14,876 | 15,323 | |||||||||
| Vietnam |
11,656 | 10,042 | 8,272 | |||||||||
| Philippines |
7,793 | 6,628 | 6,115 | |||||||||
| Hong Kong |
5,032 | 2,818 | 1,914 | |||||||||
| Other |
1,190 | 598 | 704 | |||||||||
|
|
|
|
|
|
|
|||||||
| Total Non-United States |
245,177 | 218,649 | 131,543 | |||||||||
|
|
|
|
|
|
|
|||||||
| $ | 591,043 | $ | 527,711 | $ | 371,572 | |||||||
|
|
|
|
|
|
|
|||||||
Note 15. Fair Value of Financial Instruments
The FASB defines fair value as the exchange price that would be received for an asset or paid to transfer a liability (an exit price) in the principal or most advantageous markets for the asset and liability in an orderly transaction between market participants at the measurement date. The Company estimates fair value of its financial instruments utilizing an established three-level hierarchy in accordance with U.S. GAAP. The hierarchy is based upon the transparency of inputs to the valuation of an asset or liability as of the measurement date as follows:
| • | Level 1 – Valuation is based upon unadjusted quoted prices for identical assets or liabilities in active markets. |
| • | Level 2 – Valuation is based upon quoted prices for similar assets and liabilities in active markets, or other inputs that are observable for the asset or liability, either directly or indirectly, for substantially the full term of the financial instruments. |
| • | Level 3 – Valuation is based upon other unobservable inputs that are significant to the fair value measurements. |
The classification of fair value measurements within the hierarchy is based upon the lowest level of input that is significant to the measurement.
At June 30, 2019, the Company had foreign currency forward contracts recorded at fair value. The fair values of these instruments were measured using valuations based upon quoted prices for similar assets and liabilities in active markets (Level 2) and are valued by reference to similar financial instruments, adjusted for credit risk and restrictions and other terms specific to the contracts.
The Company has entered into earnout arrangements in conjunction with specified acquisitions, as discussed in Note 3, that provide additional cash earnout opportunities based upon achievement of certain agreed upon financial and operational targets. The fair values of the contingent earnout arrangements and the net put option were measured using valuations based upon other unobservable inputs that are significant to the fair value measurement (Level 3).
The fair values of these contingent earnout arrangements and the net put option (discussed in Note 4) were measured using valuations based on other unobservable inputs that are significant to the fair value measurement (Level 3).
The Company estimated the fair value of the Notes based on quoted market prices as of the last trading day prior to June 30, 2019; however, the Notes have only a limited trading volume and, as such, this fair value estimate is not necessarily the value at which the Notes could be retired or transferred. The Company concluded that this fair value measurement should be categorized within Level 2. The carrying value of the convertible notes is net of unamortized discount and issuance costs. See Note 9 for details on the Company’s debt facilities. The fair value and carrying value of the convertible notes were as follows at June 30, 2019 ($000):
| Fair Value | Carrying Value | |||||||
| Convertible notes |
$ | 365,700 | $ | 301,141 | ||||
The following tables provide a summary by level of the fair value of financial instruments that are measured on a recurring basis as of June 30, 2019 and 2018 ($000):
| Fair Value Measurements at June 30, 2019 Using: | ||||||||||||||||
| June 30, 2019 | Quoted Prices in Active Markets for Identical Assets (Level 1) |
Significant Other Observable Inputs (Level 2) |
Significant Unobservable Inputs (Level 3) |
|||||||||||||
| Liabilities: |
||||||||||||||||
| Foreign currency forward contracts |
$ | 139 | $ | — | $ | 139 | $ | — | ||||||||
| Contingent earnout arrangements |
4,397 | — | — | 4,397 | ||||||||||||
| Net put option |
2,024 | — | — | 2,024 | ||||||||||||
| Fair Value Measurements at June 30, 2018 Using: | ||||||||||||||||
| June 30, 2018 |
Quoted Prices in Active Markets for Identical Assets (Level 1) |
Significant Other Observable Inputs (Level 2) |
Significant Unobservable Inputs (Level 3) |
|||||||||||||
| Assets: |
||||||||||||||||
| Foreign currency forward contracts |
$ | 121 | $ | — | $ | 121 | $ | — | ||||||||
| Liabilities: |
||||||||||||||||
| Contingent earnout arrangements |
5,405 | — | — | 5,405 | ||||||||||||
| Net put option |
2,024 | — | — | 2,024 | ||||||||||||
The following table presents a reconciliation of the beginning and ending fair value measurements of the Company’s level 3 contingent earnout arrangements related to the Company’s acquisitions and the net put option relating to the purchase of the equity investment in November 2017 ($000):
| Significant Unobservable Inputs (Level 3) |
||||
| Balance at July 1, 2018 |
$ | 7,429 | ||
| Activity: |
||||
| Payments |
(4,524 | ) | ||
| Changes in fair value recorded in other expense (income), net |
(881 | ) | ||
| Other earnout arrangements |
4,397 | |||
|
|
|
|||
| Balance at June 30, 2019 |
$6,421 | |||
|
|
|
|||
The fair values of cash and cash equivalents are considered Level 1 among the fair value hierarchy and approximate fair value because of the short-term maturity of those instruments. The Company’s borrowings include both variable and fixed interest rates, non-interest bearing debt and a capital lease obligation and are considered Level 2 among the fair value hierarchy and accordingly their carrying amounts approximate fair value.
Note 16. Derivative Instruments
The Company, from time to time, purchases foreign currency forward exchange contracts, primarily in Japanese Yen, that permit it to sell specified amounts of these foreign currencies expected to be received from its export sales, for pre-established U.S. dollar amounts at specified dates. These contracts are entered into to limit transactional exposure to changes in currency exchange rates of export sales transactions in which settlement will occur in future periods and which otherwise would expose the Company, on the basis of its aggregate net cash flows in respective currencies, to foreign currency risk.
The Company has recorded the fair value of these contracts in the Company’s financial statements. These contracts had a total notional amount of $17.0 million and $12.0 million at June 30, 2019 and 2018, respectively. As of June 30, 2019, these forward contracts had expiration dates ranging from July 2019 through October 2019, with Japanese Yen denominations individually between 300 million and 645 million Yen. The Company does not account for these contracts as hedges as defined by U.S. GAAP and records the change in the fair value of these contracts in Other expense (income), net in the Consolidated Statements of Earnings as they occur. The fair value measurement takes into consideration foreign currency rates and the current creditworthiness of the counterparties to these contracts, as applicable, and is based upon quoted prices for similar assets and liabilities in active markets, or other inputs that are observable for the asset or liability, either directly or indirectly, for substantially the full term of the financial instruments and thus represents a Level 2 measurement. These contracts are recorded in prepaid and other current assets in the Company’s Consolidated Balance Sheets as of June 30, 2019. The change in the fair value of these contracts for the fiscal year ended June 30, 2019, 2018 and 2017 was insignificant.
Note 17. Employee Benefit Plans
Eligible U.S. employees of the Company participate in a profit sharing retirement plan. Contributions accrued for the plan are made at the discretion of the Company’s board of directors and were $4.6 million, $5.0 million, and $4.3 million for the years ended June 30, 2019, 2018 and 2017, respectively.
On August 18, 2018, the Company adopted the 2018 Employee Stock Purchase Plan (“2018 Plan”) for full time employees who have completed two years of continuous employment with the Company, and the 2018 Plan was approved by the Company’s shareholders at the Company’s Annual Meeting of Shareholders in November 2018. The employee may purchase the Company’s common stock for the lessor of 90% of the fair market value of the shares (i) on the first trading day of the offering period, or (ii) on the purchase date. Offering periods will run from August through January and from February through July each year. The number of shares which may be bought by an employee during each fiscal year is limited to 15% of the employee’s base pay. The 2018 Plan, limits the number of shares of common stock available for purchase to 2,000,000 shares. As of June 30, 2019, there have been no purchases under the 2018 Plan.
Switzerland Defined Benefit Plan
The Company maintains a pension plan covering employees of our Swiss subsidiary (the “Swiss Plan”). Employer and employee contributions are made to the Swiss Plan based on various percentages of salary and wages that vary according to employee age and other factors. Employer contributions to the Swiss Plan for years ended June 30, 2019 and 2018 were $3.0 million and $2.7 million, respectively. Expected employer contributions in fiscal year 2020 are $3.0 million.
The changes in the funded status of the Swiss Plan during the fiscal years ended June 30, 2019 and 2018 were as follows:
| Year Ended June 30, |
2019 | 2018 | ||||||
| Change in projected benefit obligation: |
||||||||
| Projected benefit obligation, beginning of period |
$ | 62,554 | $ | 59,518 | ||||
| Service cost |
3,629 | 3,766 | ||||||
| Interest cost |
528 | 424 | ||||||
| Benefits accumulated, net of benefits paid |
(103 | ) | 1,474 | |||||
| Plan amendments |
— | (4,068 | ) | |||||
| Actuarial (gain) loss on obligation |
6,690 | 1,606 | ||||||
| Participant contributions |
1,557 | 1,415 | ||||||
| Currency translation adjustment |
(1,372 | ) | (1,581 | ) | ||||
|
|
|
|
|
|||||
| Projected benefit obligation, end of period |
$ | 73,483 | $ | 62,554 | ||||
|
|
|
|
|
|||||
| Change in plan assets: |
||||||||
| Plan assets at fair value, beginning of period |
49,034 | 42,990 | ||||||
| Actual return on plan assets |
342 | 1,566 | ||||||
| Employer contributions |
2,965 | 2,731 | ||||||
| Participant contributions |
1,557 | 1,415 | ||||||
| Benefits accumulated, net of benefits paid |
(103 | ) | 1,474 | |||||
| Currency translation adjustment |
(1,076 | ) | (1,142 | ) | ||||
|
|
|
|
|
|||||
| Plan assets at fair value, end of period |
$ | 52,719 | $ | 49,034 | ||||
|
|
|
|
|
|||||
| Amounts recognized in consolidated balance sheets: |
||||||||
| Other non-current assets: |
||||||||
| Deferred tax asset |
$ | 4,392 | $ | 2,859 | ||||
| Other non-current liabilities: |
||||||||
| Underfunded pension liability |
20,764 | 13,520 | ||||||
| Amounts recognized in accumulated other comprehensive income: |
||||||||
| Pension adjustment |
$ | (11,784 | ) | $ | 2,846 | |||
| Accumulated benefit obligation, end of period |
$ | 69,682 | $ | 59,800 | ||||
Net periodic pension cost associated with the Swiss Plan included the following components:
| Year Ended June 30, |
2019 | 2018 | 2017 | |||||||||
| Service cost |
$ | 3,629 | $ | 3,766 | $ | 3,689 | ||||||
| Interest cost |
528 | 424 | 163 | |||||||||
| Expected return on plan assets |
951 | 849 | (742 | ) | ||||||||
| Net actuarial loss and prior service credit |
185 | 203 | 594 | |||||||||
|
|
|
|
|
|
|
|||||||
| Net periodic pension cost |
$ | 5,293 | $ | 5,242 | $ | 3,704 | ||||||
|
|
|
|
|
|
|
|||||||
The projected and accumulated benefit obligations for the Swiss Plan were calculated as of June 30, 2019 and 2018 using the following assumptions:
| June 30, |
2019 | 2018 | ||||||
| Discount rate |
0.5 | % | 0.9 | % | ||||
| Salary increase rate |
2.0 | % | 2.0 | % | ||||
The net periodic pension cost for the Swiss Plan was calculated during the fiscal years ended June 30, 2019, 2018, and 2017 using the following assumptions:
| Year Ended June 30, |
2019 | 2018 | 2017 | |||||||||
| Discount rate |
0.9 | % | 0.8 | % | 0.3 | % | ||||||
| Salary increase rate |
2.0 | % | 2.0 | % | 2.0 | % | ||||||
| Expected return on plan assets |
2.0 | % | 2.0 | % | 2.0 | % | ||||||
The discount rate is based on assumed pension benefit maturity and estimates developed using the rate of return and yield curves for high quality Swiss corporate and government bonds. The salary increase rate is based on our best assessment for on-going increases over time. The expected long-term rate of return on plan assets is based on the expected asset allocation, taking into consideration historical long-term rates of return for the relevant asset categories.
As is customary with Swiss pension plans, the assets of the plan are invested in a collective fund with multiple employers. We have no investment authority over the assets of the plan, which are held and invested by a Swiss insurance company. The investment strategy of the Swiss Plan is managed by an independent asset manager with the objective of achieving a consistent long-term return which will provide sufficient funding for future pension obligations while limiting risk.
The Swiss Plan is legally separate from II-VI, as are the assets of the plan. As of June 30, 2019, the Swiss Plan’s asset allocation was as follows (all of which are categorized as Level 2 in the fair value hierarchy):
| June 30, |
2019 | 2018 | ||||||
| Fixed income investments |
12.0 | % | 12.0 | % | ||||
| Equity investments |
50.0 | % | 50.0 | % | ||||
| Real estate |
28.0 | % | 31.0 | % | ||||
| Cash |
7.0 | % | 4.0 | % | ||||
| Other |
3.0 | % | 3.0 | % | ||||
|
|
|
|
|
|||||
| 100.0 | % | 100.0 | % | |||||
|
|
|
|
|
|||||
Estimated future benefit payments under the Swiss Plan are estimated to be as follows:
| Year Ending June 30, |
||||
| ($000) |
||||
| 2020 |
$ | 3,400 | ||
| 2021 |
2,900 | |||
| 2022 |
3,000 | |||
| 2023 |
3,300 | |||
| 2024 |
5,100 | |||
| Next five years |
$ | 24,300 | ||
Note 18. Other Accrued Liabilities
The components of other accrued liabilities were as follows:
| June 30, |
2019 | 2018 | ||||||
| ($000) |
||||||||
| Contract liabilities |
$ | 10,390 | $ | 3,384 | ||||
| Warranty reserve |
4,478 | 4,679 | ||||||
| Earnout arrangements |
1,861 | 5,405 | ||||||
| Other accrued liabilities |
33,215 | 29,511 | ||||||
|
|
|
|
|
|||||
| $ | 49,944 | $ | 42,979 | |||||
|
|
|
|
|
|||||
Note 19. Commitments and Contingencies
The Company has purchase commitments for materials and supplies as part of the ordinary conduct of business. A portion of the commitments are long-term and are based on minimum purchase requirements. Certain short-term raw material purchase commitments have a variable price component which is based on market pricing at the time of purchase. Due to the proprietary nature of some of the Company’s materials and processes, certain contracts may contain liquidated damage provisions for early termination. The Company does not believe that a significant amount of liquidated damages are reasonably likely to be incurred under these commitments based upon historical experience and current expectations. The Company also has commitments relating to earnout arrangements on its acquisitions of $4.4 million. Total future commitments are as follows:
| Year Ending June 30, |
||||
| ($000) |
||||
| 2020 |
$ | 32,048 | ||
| 2021 |
4,964 | |||
| 2022 |
— | |||
| 2023 |
— | |||
| 2024 |
— | |||
Note 20. Share Repurchase Programs
In August 2017, in conjunction with the Company’s offering and sale of the Notes, the Company’s Board of Directors authorized the Company to purchase up to $50 million of its common stock with a portion of the net proceeds received from the offering and sale of the Notes. The shares that were purchased by the Company pursuant to this authorization were retained as treasury stock and are available for general corporate purposes. The Company purchased 1,414,900 shares of its common stock for approximately $49.9 million pursuant to this authorization in fiscal 2018.
In August 2014, the Company’s Board of Directors authorized the Company to purchase up to $50 million of its common stock through a share repurchase program (the “Program”) that calls for shares to be purchased in the open market or in private transactions from time to time. The Program has no expiration and may be suspended or discontinued at any time. Shares purchased by the Company are retained as treasury stock and available for general corporate purposes. During the fiscal year ended June 30, 2019, the Company purchased 50,000 shares of its common stock for $1.6 million under this program. The Company did not repurchase shares pursuant to this Program during the fiscal years ended June 30, 2018 and 2017. As of June 30, 2019, the Company has cumulatively purchased 1,366,587 shares of its common stock pursuant to the Program for approximately $20.7 million. The dollar value of shares as of June 30, 2019 that may yet be purchased under the Program is approximately $29.3 million.
Note 21. Accumulated Other Comprehensive Income (Loss)
The changes in accumulated other comprehensive income (“AOCI”) by component, net of tax, for the years ended June 30, 2019, 2018, and 2017 were as follows ($000):
| Foreign Currency Translation Adjustment |
Defined Benefit Pension Plan |
Total Accumulated Other Comprehensive Income |
||||||||||
| AOCI - June 30, 2016 |
$ | (6,185 | ) | $ | (7,832 | ) | $ | (14,017 | ) | |||
| Other comprehensive income (loss) before reclassifications |
(2,275 | ) | 1,920 | (355 | ) | |||||||
| Amounts reclassified from AOCI |
— | 594 | 594 | |||||||||
|
|
|
|
|
|
|
|||||||
| Net current-period other comprehensive income | (2,275 | ) | 2,514 | 239 | ||||||||
|
|
|
|
|
|
|
|||||||
| AOCI - June 30, 2017 |
(8,460 | ) | (5,318 | ) | (13,778 | ) | ||||||
|
|
|
|
|
|
|
|||||||
| Other comprehensive income (loss) before reclassifications |
7,152 | 2,643 | 9,795 | |||||||||
| Amounts reclassified from AOCI |
— | 203 | 203 | |||||||||
|
|
|
|
|
|
|
|||||||
| Net current-period other comprehensive income | 7,152 | 2,846 | 9,998 | |||||||||
|
|
|
|
|
|
|
|||||||
| AOCI - June 30, 2018 |
$ | (1,308 | ) | $ | (2,472 | ) | $ | (3,780 | ) | |||
|
|
|
|
|
|
|
|||||||
| Other comprehensive income (loss) before reclassifications |
(14,319 | ) | (6,307 | ) | (20,626 | ) | ||||||
| Amounts reclassified from AOCI |
— | 185 | 185 | |||||||||
|
|
|
|
|
|
|
|||||||
| Net current-period other comprehensive income | (14,319 | ) | (6,122 | ) | (20,441 | ) | ||||||
|
|
|
|
|
|
|
|||||||
| AOCI - June 30, 2019 |
$ | (15,627 | ) | $ | (8,594 | ) | $ | (24,221 | ) | |||
|
|
|
|
|
|
|
|||||||
Note 22. Capital Lease
During fiscal 2017, the Company’s OptoElectronic Devices subsidiary entered into a capital lease related to a building in Warren, New Jersey. The following table shows the future minimum lease payments due under the non-cancelable capital lease $0:
| Fiscal Year Ending June 30, |
Amount | |||
| 2020 |
$ | 2,355 | ||
| 2021 |
2,419 | |||
| 2022 |
2,486 | |||
| 2023 |
2,554 | |||
| 2024 |
2,624 | |||
| Thereafter |
22,116 | |||
|
|
|
|||
| Total minimum lease payments |
$ | 34,554 | ||
| Less amount representing interest |
10,193 | |||
|
|
|
|||
| Present value of capitalized payments |
$ | 24,361 | ||
|
|
|
|||
The current and long-term portion of the capital lease obligation was recorded in other accrued liabilities and other liabilities, respectively, in the Company’s Consolidated Balance Sheets as of June 30, 2019 and 2018. The present value of the minimum capital lease payments at inception was $25.0 million recorded in Property, Plant & Equipment, net, in the Company’s Consolidated Balance Sheet, with associated depreciation being recorded over the 15-year life of the lease. During the fiscal year ended June 30, 2019, the Company recorded $1.7 million of depreciation expense associated with the capital leased asset. The accumulated depreciation on the capital lease asset was $4.2 million as June 30, 2019.
Quarterly Financial Data (unaudited)
Fiscal Year 2019
| Quarter Ended |
September 30, 2018 |
December 31, 2018 |
March 31, 2019 |
June 30, 2019 |
||||||||||||
| ($000, except per share) | ||||||||||||||||
| 2019 |
||||||||||||||||
| Net revenues |
$ | 314,433 | $ | 342,839 | $ | 342,496 | $ | 362,728 | ||||||||
| Cost of goods sold |
190,526 | 211,333 | 215,212 | 224,076 | ||||||||||||
| Internal research and development |
33,171 | 33,764 | 36,026 | 36,202 | ||||||||||||
| Selling, general and administrative |
53,523 | 58,136 | 60,128 | 61,731 | ||||||||||||
| Interest expense |
5,584 | 5,580 | 5,647 | 5,606 | ||||||||||||
| Other expense (income) - net |
(713 | ) | (701 | ) | (1,532 | ) | 384 | |||||||||
|
|
|
|
|
|
|
|
|
|||||||||
| Earnings before income taxes |
32,342 | 34,727 | 27,015 | 34,729 | ||||||||||||
| Income taxes |
6,193 | 6,025 | 2,377 | 6,701 | ||||||||||||
| Net Earnings |
$ | 26,149 | $ | 28,702 | $ | 24,638 | $ | 28,028 | ||||||||
|
|
|
|
|
|
|
|
|
|||||||||
| Basic earnings per share |
$ | 0.41 | $ | 0.45 | $ | 0.39 | $ | 0.44 | ||||||||
|
|
|
|
|
|
|
|
|
|||||||||
| Diluted earnings per share |
$ | 0.40 | $ | 0.44 | $ | 0.38 | $ | 0.43 | ||||||||
|
|
|
|
|
|
|
|
|
|||||||||
Fiscal Year 2018
| Quarter Ended |
September 30, 2017 |
December 31, 2017 |
March 31, 2018 |
June 30, 2018 |
||||||||||||
| ($000, except per share) | ||||||||||||||||
| 2018 |
||||||||||||||||
| Net revenues |
$ | 261,503 | $ | 281,470 | $ | 294,746 | $ | 321,075 | ||||||||
| Cost of goods sold |
155,530 | 172,075 | 176,521 | 192,465 | ||||||||||||
| Internal research and development |
25,575 | 27,779 | 30,625 | 32,896 | ||||||||||||
| Selling, general and administrative |
50,624 | 49,130 | 53,121 | 55,690 | ||||||||||||
| Interest expense |
3,645 | 4,644 | 5,014 | 5,049 | ||||||||||||
| Other expense (income) - net |
(770 | ) | (2,026 | ) | (1,755 | ) | 768 | |||||||||
|
|
|
|
|
|
|
|
|
|||||||||
| Earnings before income taxes |
26,899 | 29,868 | 31,220 | 34,207 | ||||||||||||
| Income taxes |
5,758 | 20,272 | 1,122 | 7,040 | ||||||||||||
| Net Earnings |
$ | 21,141 | $ | 9,596 | $ | 30,098 | $ | 27,167 | ||||||||
|
|
|
|
|
|
|
|
|
|||||||||
|
|
||||||||||||||||
|
|
|
|
|
|
|
|
|
|||||||||
| Basic earnings per share |
$ | 0.34 | $ | 0.15 | $ | 0.48 | $ | 0.44 | ||||||||
|
|
|
|
|
|
|
|
|
|||||||||
|
|
||||||||||||||||
|
|
|
|
|
|
|
|
|
|||||||||
| Diluted earnings per share |
$ | 0.32 | $ | 0.15 | $ | 0.45 | $ | 0.42 | ||||||||
|
|
|
|
|
|
|
|
|
|||||||||
SCHEDULE II
II-VI INCORPORATED AND SUBSIDIARIES
VALUATION AND QUALIFYING ACCOUNTS
YEARS ENDED JUNE 30, 2019, 2018, AND 2017
(IN THOUSANDS OF DOLLARS)
| Balance at Beginning of Year |
Charged to Expense |
Charged to Other Accounts |
Deduction from Reserves |
Balance at End of Year |
||||||||||||||||||||||||
| YEAR ENDED JUNE 30, 2019: |
||||||||||||||||||||||||||||
| Allowance for doubtful accounts |
$ | 837 | $ | 548 | $ | — | $ | (92 | ) | (1) | $ | 1,293 | ||||||||||||||||
| Warranty reserves |
$ | 4,679 | $ | 4,185 | $ | — | $ | (4,386 | ) | $ | 4,478 | |||||||||||||||||
| Deferred tax asset valuation allowance |
$ | 21,797 | $ | (1,607 | ) | $ | — | $ | — | $ | 20,190 | |||||||||||||||||
| YEAR ENDED JUNE 30, 2018: |
||||||||||||||||||||||||||||
| Allowance for doubtful accounts |
$ | 1,314 | $ | (129 | ) | $ | — | $ | (348 | ) | (1) | $ | 837 | |||||||||||||||
| Warranty reserves |
$ | 4,546 | $ | 3,821 | $ | — | $ | (3,688 | ) | $ | 4,679 | |||||||||||||||||
| Deferred tax asset valuation allowance |
$ | 42,562 | $ | (4,602 | ) | $ | (16,163 | ) | (2) | $ | — | $ | 21,797 | |||||||||||||||
| YEAR ENDED JUNE 30, 2017: |
||||||||||||||||||||||||||||
| Allowance for doubtful accounts |
$ | 2,016 | $ | (134 | ) | $ | — | $ | (568 | ) | (1) | $ | 1,314 | |||||||||||||||
| Warranty reserves |
$ | 3,908 | $ | 4,850 | $ | — | $ | (4,212 | ) | $ | 4,546 | |||||||||||||||||
| Deferred tax asset valuation allowance |
$ | 42,641 | $ | (79 | ) | $ | — | $ | — | $ | 42,562 | |||||||||||||||||
| (1) | Primarily relates to write-offs of accounts receivable. |
| (2) | Primarily relates to the Company’s deferred taxes on the conversion feature of the convertible debt. |