Attached files
| file | filename |
|---|---|
| 8-K - 8-K - HOME BANCSHARES INC | homb-8k_20200630.htm |
HOMB CCFG Fireside Chat 30 June 2020
Forward Looking Statement This presentation may contain forward-looking statements regarding the Company’s plans, expectations, goals and outlook for the future. Statements in this presentation that are not historical facts should be considered forward-looking statements within the meaning of the Private Securities Litigation Reform Act of 1995. Forward-looking statements of this type speak only as of the date of this presentation. By nature, forward-looking statements involve inherent risk and uncertainties. Various factors could cause actual results to differ materially from those contemplated by the forward-looking statements. These factors include, but are not limited to, the following: economic conditions, credit quality, interest rates, loan demand, disruptions and uncertainties in our business and operations as a result of the ongoing coronavirus pandemic, the ability to successfully integrate new acquisitions, legislative and regulatory changes and risks associated with current and future regulations, technological changes and cybersecurity risks, competition from other financial institutions, changes in the assumptions used in making the forward-looking statements, and other factors described in reports we file with the Securities and Exchange Commission (the “SEC”), including those factors set forth in our Annual Report on Form 10-K for the year ended December 31, 2019 filed with the SEC on February 26, 2020
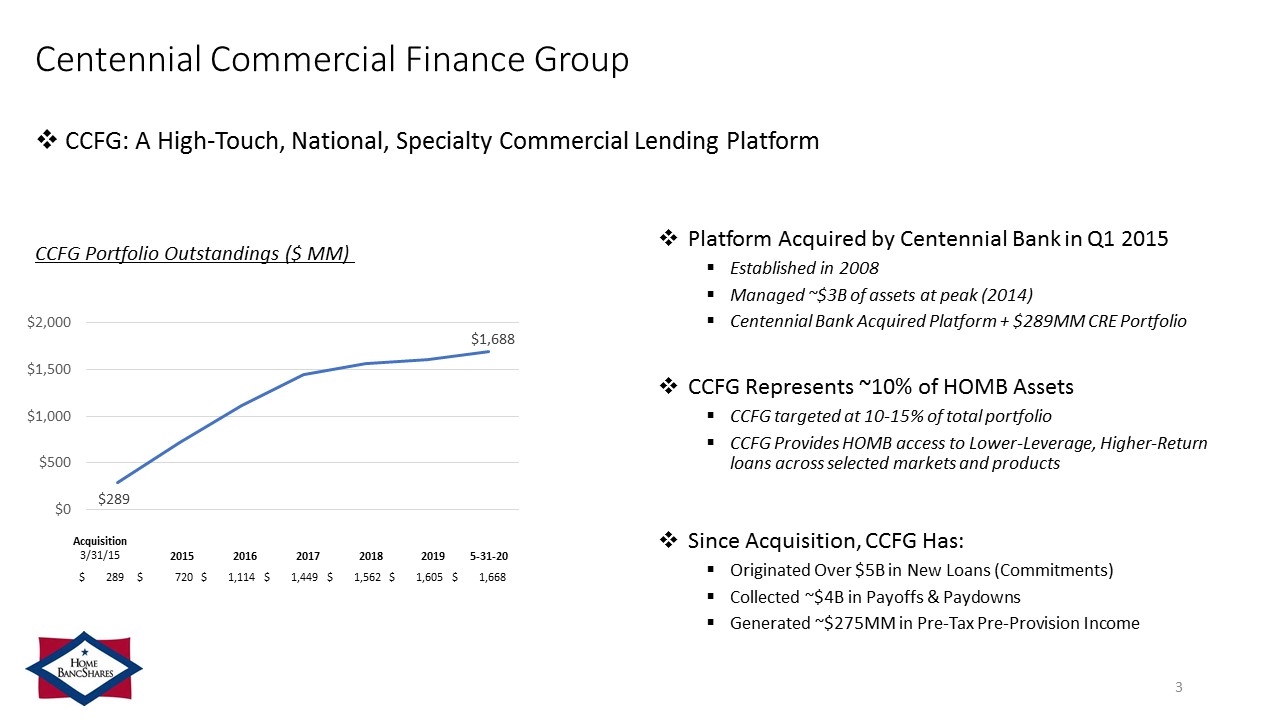
Centennial Commercial Finance Group Platform Acquired by Centennial Bank in Q1 2015 Established in 2008 Managed ~$3B of assets at peak (2014) Centennial Bank Acquired Platform + $289MM CRE Portfolio CCFG Represents ~10% of HOMB Assets CCFG targeted at 10-15% of total portfolio CCFG Provides HOMB access to Lower-Leverage, Higher-Return loans across selected markets and products Since Acquisition, CCFG Has: Originated Over $5B in New Loans (Commitments) Collected ~$4B in Payoffs & Paydowns Generated ~$275MM in Pre-Tax Pre-Provision Income CCFG Portfolio Outstandings ($ MM) Acquisition 3/31/15 2015 2016 2017 2018 2019 5-31-20 $ 289 $ 720 $ 1,114 $ 1,449 $ 1,562 $ 1,605 $ 1,668 CCFG: A High-Touch, National, Specialty Commercial Lending Platform
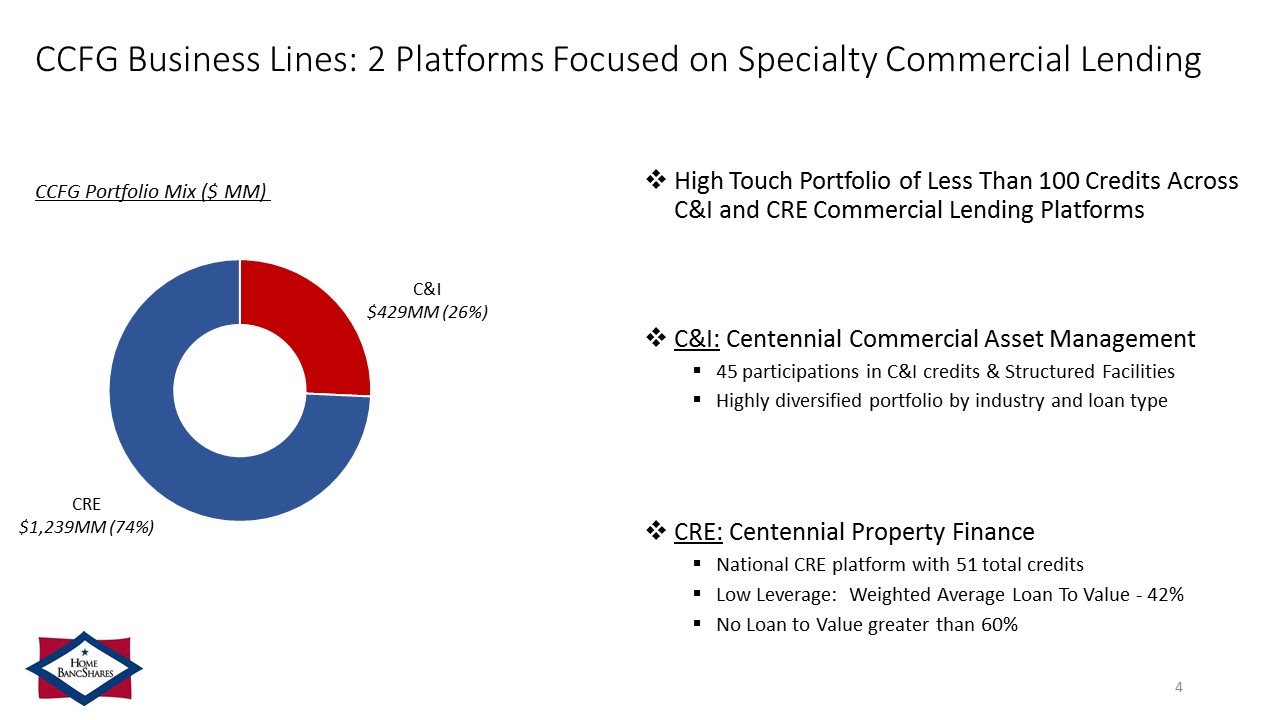
CCFG Business Lines: 2 Platforms Focused on Specialty Commercial Lending High Touch Portfolio of Less Than 100 Credits Across C&I and CRE Commercial Lending Platforms C&I: Centennial Commercial Asset Management 45 participations in C&I credits & Structured Facilities Highly diversified portfolio by industry and loan type CRE: Centennial Property Finance National CRE platform with 51 total credits Low Leverage: Weighted Average Loan To Value - 42% No Loan to Value greater than 60% CCFG Portfolio Mix ($ MM) C&I $429MM (26%) CRE $1,239MM (74%)
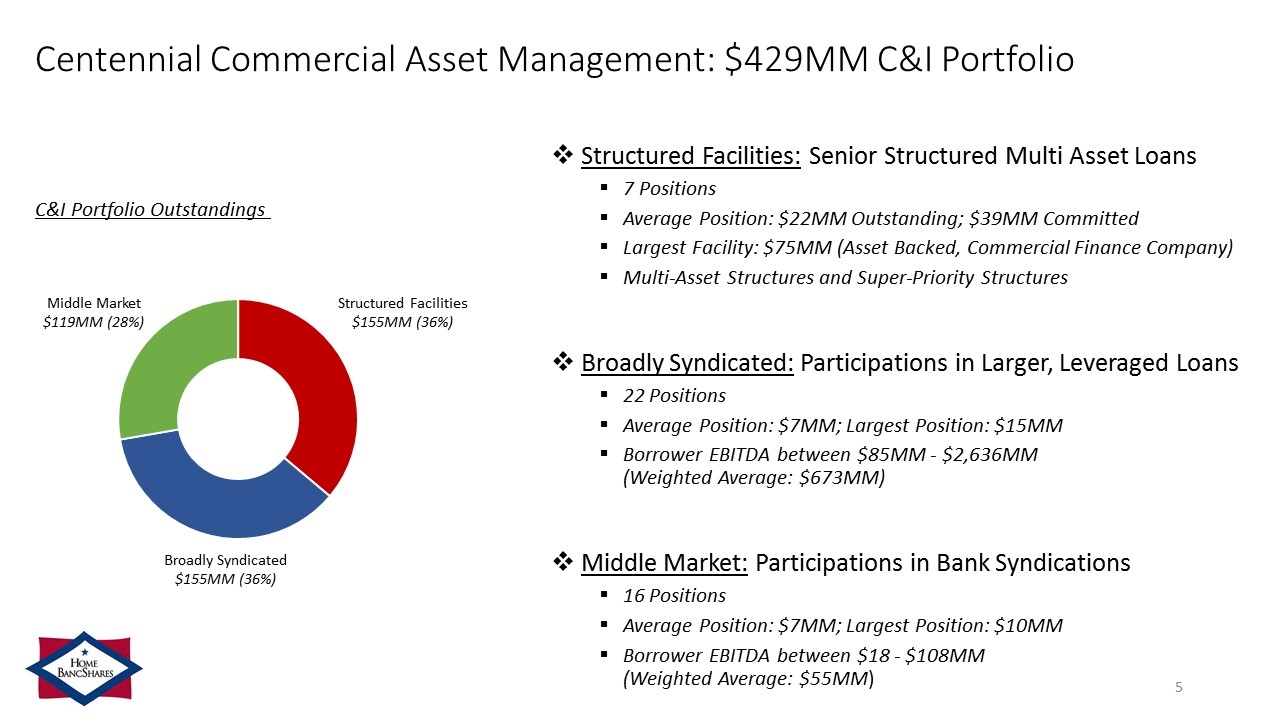
Centennial Commercial Asset Management: $429MM C&I Portfolio Structured Facilities: Senior Structured Multi Asset Loans 7 Positions Average Position: $22MM Outstanding; $39MM Committed Largest Facility: $75MM (Asset Backed, Commercial Finance Company) Multi-Asset Structures and Super-Priority Structures Broadly Syndicated: Participations in Larger, Leveraged Loans 22 Positions Average Position: $7MM; Largest Position: $15MM Borrower EBITDA between $85MM - $2,636MM (Weighted Average: $673MM) Middle Market: Participations in Bank Syndications 16 Positions Average Position: $7MM; Largest Position: $10MM Borrower EBITDA between $18 - $108MM (Weighted Average: $55MM) C&I Portfolio Outstandings Middle Market $119MM (28%) Structured Facilities $155MM (36%) Broadly Syndicated $155MM (36%)
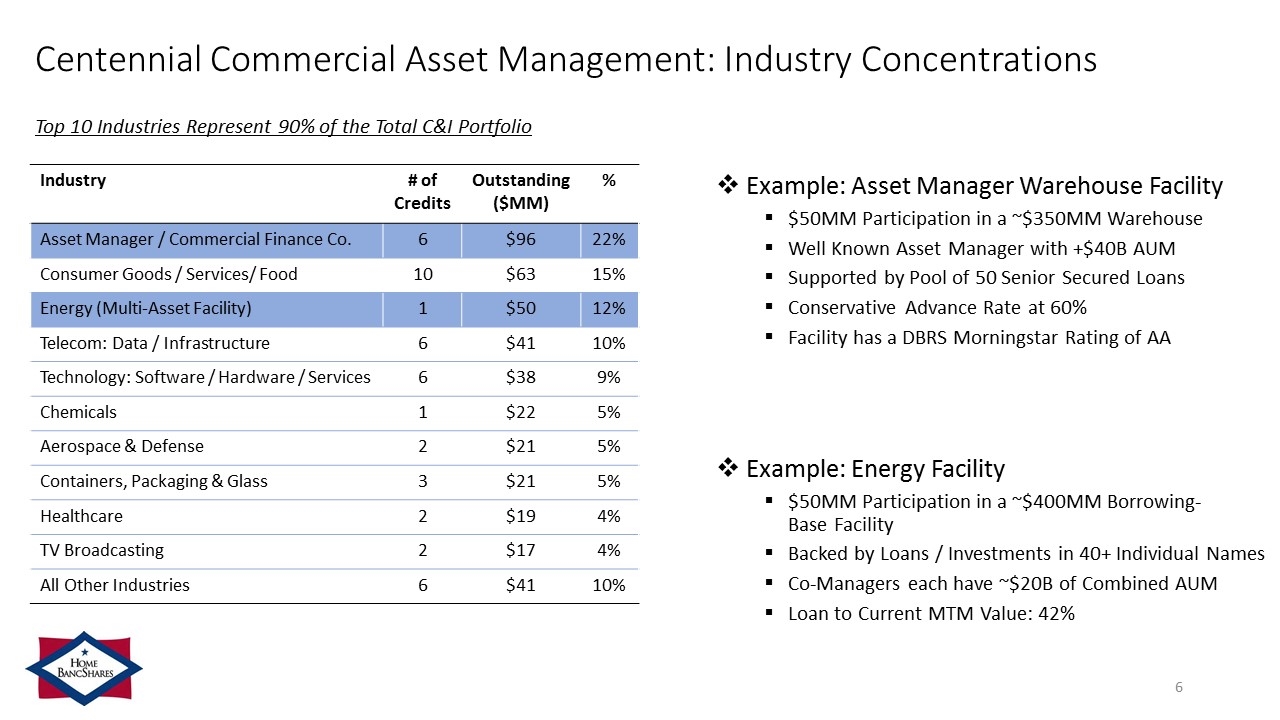
Centennial Commercial Asset Management: Industry Concentrations Top 10 Industries Represent 90% of the Total C&I Portfolio Industry # of Credits Outstanding ($MM) % Asset Manager / Commercial Finance Co. 6 $96 22% Consumer Goods / Services/ Food 10 $63 15% Energy (Multi-Asset Facility) 1 $50 12% Telecom: Data / Infrastructure 6 $41 10% Technology: Software / Hardware / Services 6 $38 9% Chemicals 1 $22 5% Aerospace & Defense 2 $21 5% Containers, Packaging & Glass 3 $21 5% Healthcare 2 $19 4% TV Broadcasting 2 $17 4% All Other Industries 6 $41 10% Example: Asset Manager Warehouse Facility $50MM Participation in a ~$350MM Warehouse Well Known Asset Manager with +$40B AUM Supported by Pool of 50 Senior Secured Loans Conservative Advance Rate at 60% Facility has a DBRS Morningstar Rating of AA Example: Energy Facility $50MM Participation in a ~$400MM Borrowing- Base Facility Backed by Loans / Investments in 40+ Individual Names Co-Managers each have ~$20B of Combined AUM Loan to Current MTM Value: 42%
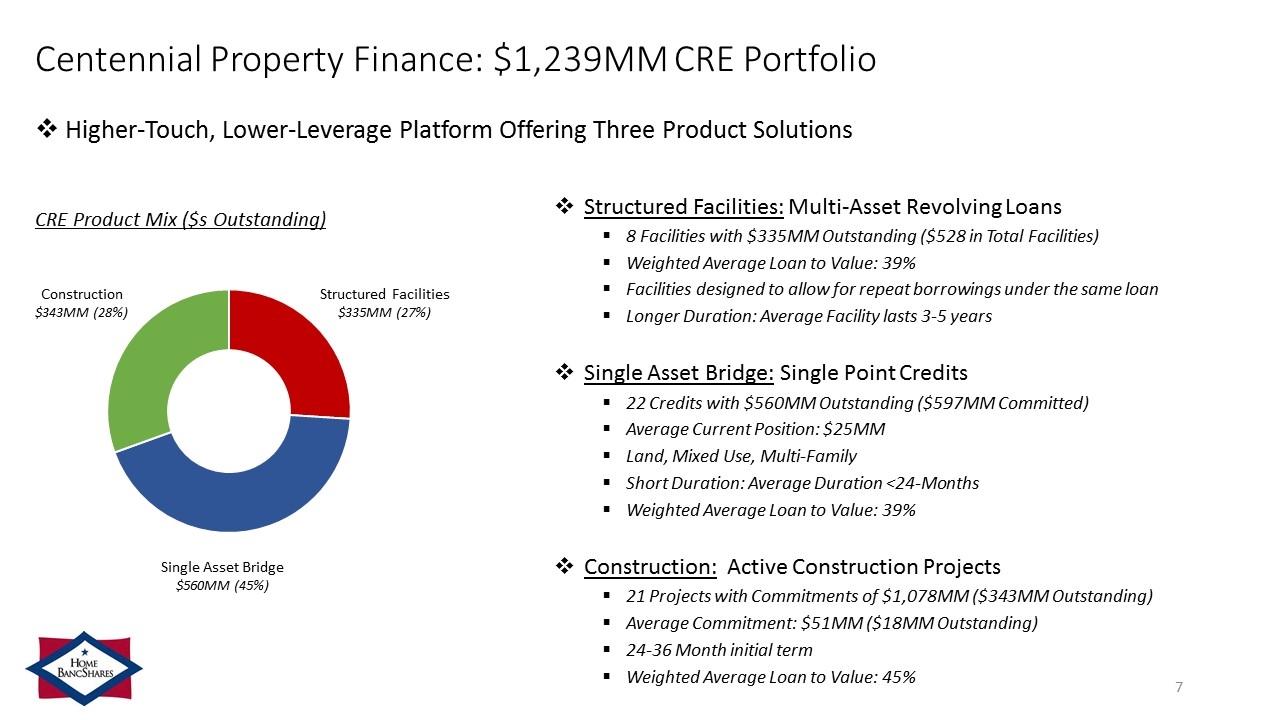
Centennial Property Finance: $1,239MM CRE Portfolio Structured Facilities: Multi-Asset Revolving Loans 8 Facilities with $335MM Outstanding ($528 in Total Facilities) Weighted Average Loan to Value: 39% Facilities designed to allow for repeat borrowings under the same loan Longer Duration: Average Facility lasts 3-5 years Single Asset Bridge: Single Point Credits 22 Credits with $560MM Outstanding ($597MM Committed) Average Current Position: $25MM Land, Mixed Use, Multi-Family Short Duration: Average Duration <24-Months Weighted Average Loan to Value: 39% Construction: Active Construction Projects 21 Projects with Commitments of $1,078MM ($343MM Outstanding) Average Commitment: $51MM ($18MM Outstanding) 24-36 Month initial term Weighted Average Loan to Value: 45% CRE Product Mix ($s Outstanding) Construction $343MM (28%) Structured Facilities $335MM (27%) Single Asset Bridge $560MM (45%) Higher-Touch, Lower-Leverage Platform Offering Three Product Solutions
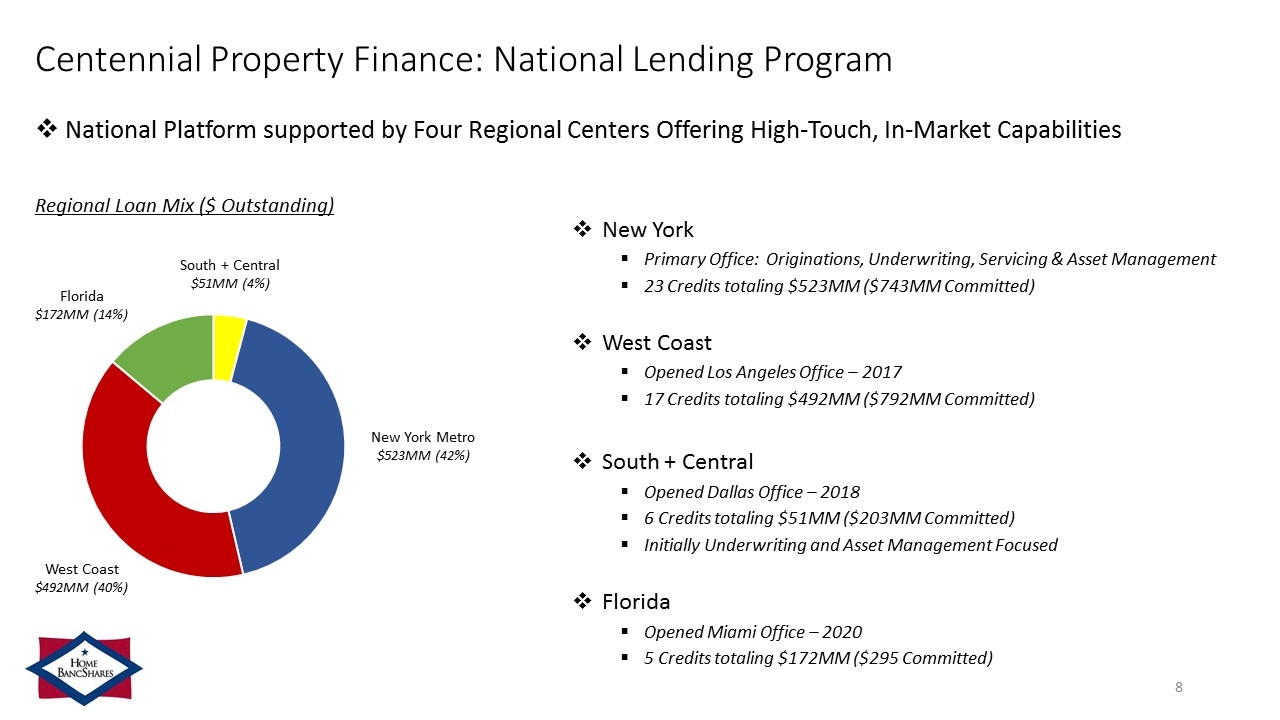
Centennial Property Finance: National Lending Program New York Primary Office: Originations, Underwriting, Servicing & Asset Management 23 Credits totaling $523MM ($743MM Committed) West Coast Opened Los Angeles Office – 2017 17 Credits totaling $492MM ($792MM Committed) South + Central Opened Dallas Office – 2018 6 Credits totaling $51MM ($203MM Committed) Initially Underwriting and Asset Management Focused Florida Opened Miami Office – 2020 5 Credits totaling $172MM ($295 Committed) Regional Loan Mix ($ Outstanding) Florida $172MM (14%) New York Metro $523MM (42%) West Coast $492MM (40%) South + Central $51MM (4%) National Platform supported by Four Regional Centers Offering High-Touch, In-Market Capabilities
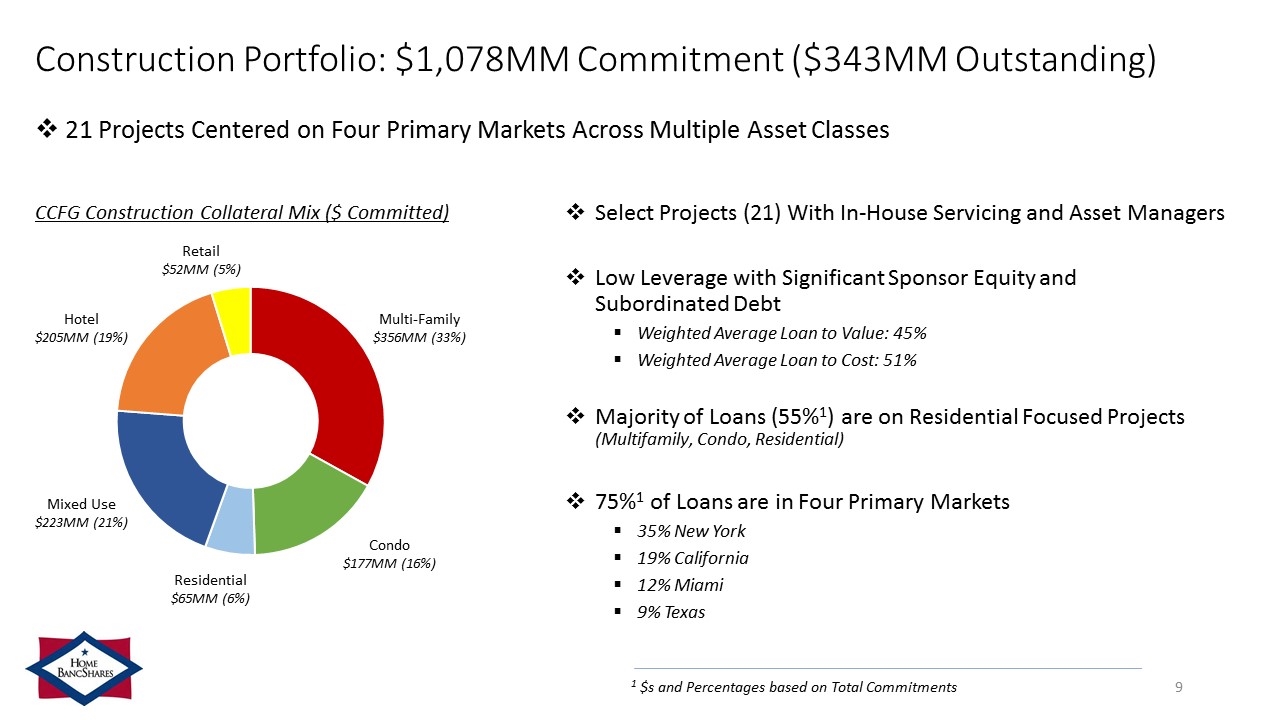
Construction Portfolio: $1,078MM Commitment ($343MM Outstanding) Select Projects (21) With In-House Servicing and Asset Managers Low Leverage with Significant Sponsor Equity and Subordinated Debt Weighted Average Loan to Value: 45% Weighted Average Loan to Cost: 51% Majority of Loans (55%1) are on Residential Focused Projects (Multifamily, Condo, Residential) 75%1 of Loans are in Four Primary Markets 35% New York 19% California 12% Miami 9% Texas CCFG Construction Collateral Mix ($ Committed) Hotel $205MM (19%) Multi-Family $356MM (33%) Mixed Use $223MM (21%) Condo $177MM (16%) Residential $65MM (6%) Retail $52MM (5%) 1 $s and Percentages based on Total Commitments 21 Projects Centered on Four Primary Markets Across Multiple Asset Classes
Contact Information Corporate Headquarters Home BancShares, Inc. 719 Harkrider Street, Suite 100 P.O. Box 966 Conway, AR 72033 Financial Information Donna Townsell Director of Investor Relations (501) 328-4625 Website www.homebancshares.com
NASDAQ: HOMB | June 2020 www.homebancshares.com
