Attached files
| file | filename |
|---|---|
| EX-23 - EX-23.2 - Sunnova Energy International Inc. | d875054dex232.htm |
| EX-21 - EX-21.1 - Sunnova Energy International Inc. | d875054dex211.htm |
| EX-10 - EX-10.8 - Sunnova Energy International Inc. | d875054dex108.htm |
| EX-10 - EX-10.7 - Sunnova Energy International Inc. | d875054dex107.htm |
| EX-10 - EX-10.6 - Sunnova Energy International Inc. | d875054dex106.htm |
| EX-10 - EX-10.3.1 - Sunnova Energy International Inc. | d875054dex1031.htm |
| EX-10 - EX-10.2.7 - Sunnova Energy International Inc. | d875054dex1027.htm |
| EX-10 - EX-10.2.6 - Sunnova Energy International Inc. | d875054dex1026.htm |
| EX-5 - EX-5.1 - Sunnova Energy International Inc. | d875054dex51.htm |
| EX-4 - EX-4.12 - Sunnova Energy International Inc. | d875054dex412.htm |
| EX-4 - EX-4.11 - Sunnova Energy International Inc. | d875054dex411.htm |
| EX-4 - EX-4.4 - Sunnova Energy International Inc. | d875054dex44.htm |
| EX-4 - EX-4.2.1 - Sunnova Energy International Inc. | d875054dex421.htm |
| EX-1 - EX-1.1 - Sunnova Energy International Inc. | d875054dex11.htm |
Table of Contents
As filed with the Securities and Exchange Commission on June 29, 2020.
Registration No. 333-
UNITED STATES
SECURITIES AND EXCHANGE COMMISSION
Washington, D.C. 20549
FORM S-1
REGISTRATION STATEMENT
Under
The Securities Act of 1933
Sunnova Energy International Inc.
(Exact name of Registrant as specified in its charter)
| Delaware | 4931 | 30-1192746 | ||
| (State or other jurisdiction of incorporation or organization) |
(Primary Standard Industrial Classification Code Number) |
(I.R.S. Employer Identification Number) |
20 East Greenway Plaza, Suite 540
Houston, Texas 77046
(281) 985-9904
(Address, including zip code, and telephone number, including area code, of Registrant’s principal executive offices)
Walter A. Baker
Executive Vice President, General Counsel and Secretary
Sunnova Energy International Inc.
20 East Greenway Plaza, Suite 540
Houston, Texas 77046
(281) 985-9904
(Name, address, including zip code, and telephone number, including area code, of agent for service)
Copies to:
| Joshua Davidson Travis J. Wofford Baker Botts L.L.P. 910 Louisiana Street Houston, TX 77002 (713) 229-1234 |
David P. Oelman E. Ramey Layne Vinson & Elkins L.L.P. 1001 Fannin Street Houston, TX 77002 (713) 758-2222 |
Approximate date of commencement of proposed sale to the public: As soon as practicable after this Registration Statement becomes effective.
If any of the securities being registered on this Form are to be offered on a delayed or continuous basis pursuant to Rule 415 under the Securities Act, check the following box: ☐
If this Form is filed to register additional securities for an offering pursuant to Rule 462(b) under the Securities Act, please check the following box and list the Securities Act Registration Statement number of the earlier effective Registration Statement for the same offering. ☐
If this Form is a post-effective amendment filed pursuant to Rule 462(c) under the Securities Act, check the following box and list the Securities Act Registration Statement number of the earlier effective Registration Statement for the same offering. ☐
If this Form is a post-effective amendment filed pursuant to Rule 462(d) under the Securities Act, check the following box and list the Securities Act Registration Statement number of the earlier effective Registration Statement for the same offering. ☐
Indicate by check mark whether the Registrant is a large accelerated filer, an accelerated filer, a non-accelerated filer, smaller reporting company, or an emerging growth company. See the definitions of “large accelerated filer,” “accelerated filer,” “smaller reporting company,” and “emerging growth company” in Rule 12b-2 of the Exchange Act.
| Large accelerated filer | ☐ | Accelerated filer | ☐ | |||
| Non-accelerated filer | ☒ | Smaller reporting company | ☐ | |||
| Emerging growth company | ☐ |
If an emerging growth company, indicate by check mark if the Registrant has elected not to use the extended transition period for complying with any new or revised financial accounting standards provided pursuant to Section 7(a)(2)(B) of the Securities Act. ☐
CALCULATION OF REGISTRATION FEE
|
| ||||||||
| Title of each Class of Securities to be Registered |
Shares to be Registered |
Proposed Offering Price |
Maximum Offering Price(2) |
Amount of Registration Fee | ||||
| Common Stock, $0.0001 per share |
9,200,000(1) | $19.57 | $180,044,000(1) | $23,369.71 | ||||
|
| ||||||||
|
| ||||||||
| (1) | Includes (i) 6,847,975 in outstanding shares of common stock offered by certain of the selling stockholders, (ii) 1,152,025 shares of common stock to be issued pursuant to the conversion of $15.4 million aggregate principal amount of convertible notes held by certain of the selling stockholders and (iii) an additional 1,200,000 shares of our common stock that the underwriters have the option to purchase from certain of the selling stockholders. |
| (2) | Estimated solely for the purpose of calculating the registration fee in accordance with Rule 457(c) of the Securities Act of 1933, as amended. The proposed maximum offering price per share and proposed maximum aggregate offering price are based on the average high and low sales prices of the Registrant’s common stock on June 22, 2020 as reported on the New York Stock Exchange. |
The Registrant hereby amends this Registration Statement on such date or dates as may be necessary to delay its effective date until the Registrant shall file a further amendment which specifically states that this Registration Statement shall thereafter become effective in accordance with Section 8(a) of the Securities Act of 1933 or until the Registration Statement shall become effective on such date as the Securities and Exchange Commission, acting pursuant to said Section 8(a), may determine.
Table of Contents
The information in this preliminary prospectus is not complete and may be changed. These securities may not be sold until the Registration Statement filed with the Securities and Exchange Commission is effective. This preliminary prospectus is not an offer to sell nor does it seek an offer to buy these securities in any jurisdiction where the offer or sale is not permitted.
Subject to Completion. Dated June 29, 2020.
8,000,000 Shares of Common Stock

This prospectus covers the offer and resale of 8,000,000 shares of common stock of Sunnova Energy International Inc. (“SEI”) by the selling stockholders identified on page 136 of this prospectus. A portion of these shares are issuable upon conversion of our 9.75% convertible senior notes due 2025 (“9.75% convertible senior notes”) that we previously issued to certain of the selling stockholders. We will not receive any proceeds from the sale of the shares offered by this prospectus or upon the conversion of the 9.75% convertible senior notes.
Our common stock is listed on the New York Stock Exchange (the “NYSE”) under the symbol “NOVA.” On June 26, 2020, the last reported sale price of our common stock on the NYSE was $18.85.
To the extent that the underwriters sell more than 8,000,000 shares of common stock, the underwriters have a 30-day option to purchase up to an additional 1,200,000 shares of common stock from certain of the selling stockholders at the public offering price less underwriting discounts and commissions. We are not offering any shares of our common stock under this prospectus and we will not receive any proceeds from the sale of shares of our common stock by the selling stockholders.
See the section titled “Risk Factors” beginning on page 17 of this prospectus to read about risks you should consider before buying shares of our common stock.
Neither the Securities and Exchange Commission (the “SEC”) nor any state securities commission has approved or disapproved of these securities or determined if this prospectus is truthful or complete. Any representation to the contrary is a criminal offense.
| Price to Public |
Underwriting Discounts and Commissions (1) |
Proceeds to Selling Stockholders (2) |
||||||||||
| Per share |
$ | $ | $ | |||||||||
| Total |
$ | $ | $ | |||||||||
| (1) | See the section titled “Underwriting” for additional information regarding compensation payable to the underwriters. |
| (2) | We have agreed to pay all offering expenses, other than underwriting discounts and commissions, for the selling stockholders incurred in connection with the sale by the selling stockholders. |
The underwriters expect to deliver the shares of common stock against payment therefor on or about , 2020.
| J.P. Morgan | BofA Securities | Credit Suisse | Goldman Sachs & Co. LLC |
The date of this prospectus is , 2020
Table of Contents
| Page | ||||
| 1 | ||||
| 17 | ||||
| 69 | ||||
| 71 | ||||
| 72 | ||||
| 73 | ||||
| 74 | ||||
| MANAGEMENT’S DISCUSSION AND ANALYSIS OF FINANCIAL CONDITION AND RESULTS OF OPERATIONS |
80 | |||
| 119 | ||||
| 135 | ||||
| 136 | ||||
| 139 | ||||
| 146 | ||||
| MATERIAL U.S. FEDERAL INCOME TAX CONSEQUENCES TO NON-U.S. HOLDERS OF OUR COMMON STOCK |
148 | |||
| INVESTMENT IN SUNNOVA ENERGY INTERNATIONAL INC. BY EMPLOYEE BENEFIT PLANS |
153 | |||
| 155 | ||||
| 164 | ||||
| 165 | ||||
| 166 | ||||
We have not, and the selling stockholders and the underwriters have not, authorized anyone to provide any information or make any representations other than those contained in this prospectus or in any free writing prospectus prepared by or on behalf of us. We, the selling stockholders and the underwriters take no responsibility for, and can provide no assurance as to the reliability of, any other information that others may give you. The selling stockholders are offering to sell, and seeking offers to buy, shares of our common stock only under circumstances and in jurisdictions where it is lawful to do so. The information contained in this prospectus is accurate only as of the date of this prospectus, regardless of the time of delivery of this prospectus or of any sale of our common stock.
For investors outside of the United States: Neither we nor any of the selling stockholders or the underwriters have done anything that would permit this offering or possession or distribution of this prospectus in any jurisdiction where action for that purpose is required, other than in the United States. Persons outside the United States who come into possession of this prospectus must inform themselves about, and observe any restrictions relating to, this offering and the distribution of this prospectus outside of the United States.
This prospectus contains forward-looking statements that are subject to a number of risks and uncertainties, many of which are beyond our control. Please read the section titled “Risk Factors” on page 17 and the section titled “Cautionary Language Regarding Forward-Looking Statements” in this prospectus.
i
Table of Contents
This summary does not contain all of the information you should consider before investing in our common stock. You should read this entire prospectus carefully, including the sections titled “Risk Factors,” “Management’s Discussion and Analysis of Financial Condition and Results of Operations” and “Cautionary Language Regarding Forward-Looking Statements” and read our consolidated financial statements and the related notes included in our Annual Report on Form 10-K for the year ended December 31, 2019 and Quarterly Report on Form 10-Q for the quarter ended March 31, 2020 before making an investment decision. The information presented in this prospectus assumes, unless otherwise indicated, that the underwriters do not exercise their option to purchase additional shares of common stock from certain of the selling stockholders. Unless the context otherwise requires, the terms “Registrant,” “Sunnova,” the “company,” “we,” “us” and “our” or like terms in this prospectus refer to Sunnova Energy Corporation and its subsidiaries, our predecessor for accounting purposes, when used in a historical context (periods prior to July 29, 2019, the closing date of our initial public offering), and to SEI and its subsidiaries when used in the present tense or prospectively (on or after July 29, 2019, the closing date of our initial public offering).
Sunnova Energy International Inc.
Our Business
We are a leading residential solar and energy storage service provider, serving more than 85,000 customers in more than 20 United States (“U.S.”) states and territories. Our goal is to be the leading provider of clean, affordable and reliable energy for consumers, and we operate with a simple mission: to power energy independence so that homeowners have the freedom to live life uninterrupted. We were founded to deliver customers a better energy service at a better price; and, through our solar and solar plus energy storage service offerings, we are disrupting the traditional energy landscape and the way the 21st century customer generates and consumes electricity.
We have a differentiated residential solar dealer model in which we partner with local dealers who originate, design and install our customers’ solar energy systems and energy storage systems on our behalf. Our focus on our dealer model enables us to leverage our dealers’ specialized knowledge, connections and experience in local markets to drive customer origination while providing our dealers with access to high quality products at competitive prices as well as technical oversight and expertise. We believe this structure provides operational flexibility, reduced exposure to labor shortages and lower fixed costs relative to our peers, furthering our competitive advantage.
We offer customers products to power their homes with affordable solar energy. We are able to offer savings and storage opportunities to most customers compared to utility-based retail rates with little to no up-front expense to the customer, and we are able to provide energy resiliency and reliability to our solar plus energy storage customers. Our solar service agreements take the form of a lease, power purchase agreement (a “PPA”) or loan. The initial term of our solar service agreements is typically either 10 or 25 years. Service is an integral part of our agreements and includes operations and maintenance, monitoring, repairs and replacements, equipment upgrades, on-site power optimization for the customer (for both supply and demand), the ability to efficiently switch power sources among the solar panel, grid and energy storage system, as appropriate, and diagnostics. During the life of the contract we have the opportunity to integrate related and evolving home servicing and monitoring technologies to upgrade the flexibility and reduce the cost of our customers’ energy supply.
In the case of leases and PPAs, we also currently receive tax benefits and other incentives from federal, state and local governments, a portion of which we finance through tax equity, non-recourse
1
Table of Contents
debt structures and hedging arrangements in order to fund our upfront costs, overhead and growth investments. We have an established track record of attracting capital from diverse sources. From our inception through March 31, 2020, we have raised more than $5.5 billion in total capital commitments from equity, debt and tax equity investors.
In addition to providing ongoing service as a standard component of our solar service agreements, we also offer Sunnova Protect Services, which provides ongoing energy services to customers who purchased their solar energy system through unaffiliated third parties. Under these arrangements, we agree to provide monitoring, maintenance and repair services to these customers for the life of the service contract they sign with us. We believe the quality and scope of our comprehensive energy service offerings, whether to customers that obtained their solar energy system through us or through another party, is a key differentiator between us and our competitors.
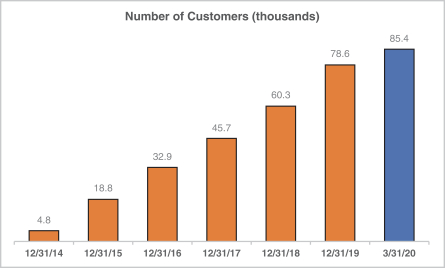
We commenced operations in January 2013 and began providing solar energy services under our first solar energy system in April 2013. Since then, our brand, innovation and focused execution have driven significant growth in our market share and in the number of customers on our platform. We operate one of the largest fleets of residential solar energy systems in the U.S., comprising more than 625 megawatts of generation capacity and serving more than 85,000 customers. We define number of customers to include each customer that is party to an in-service solar service agreement. The following chart illustrates the growth in our number of customers from December 31, 2015 through March 31, 2020.
Our Customer Value Proposition
Our customer value proposition includes:
| • | A better energy service at a better price. Our residential solar service agreements offer customers low-cost, clean solar energy along with comprehensive customer service and system maintenance over the lifetime of their contract with us. We generally price our solar service agreements lower than utility-provided electricity, offering customers the opportunity to reduce their overall electric utility bill. The initial price or energy rate is fixed (often coupled with a price escalator at the customer’s option), providing predictable prices over the entire 10 or |
2
Table of Contents
| 25-year term of the solar service agreements. We believe this provides the customer valuable protection against unpredictable increases in utility rates. We also offer energy storage solutions to those customers who are looking for energy resiliency and reliability. In addition, we monitor, maintain and service the system over the life of the contract, ensuring that customers benefit from a better energy service, generally at a better price over the life of their relationship with us. |
| • | Best-in-class customer service. All Sunnova solar service agreements include comprehensive servicing solutions designed to ensure maximum performance and a high-quality customer experience. Our solar service agreements provide remote monitoring, maintenance and warranty coverage and services for the entire contract term. The majority of our solar service agreements contain a production guarantee to help customers capture the savings they expect. Our digital monitoring platforms allow customers to monitor the performance of their systems, and we have a staff of bilingual, well-trained professionals on-call to respond to customer questions and concerns. We believe that our customer service is a critical component of our value proposition and we pride ourselves on the experience we provide. In addition to the customers that we service and finance through lease, loans and PPAs, we also offer service-only contracts to customers who have non-Sunnova solar energy systems installed, but do not have the benefit of a comprehensive service relationship. We believe this focus on service differentiates us from other solar providers and facilitates long-term, active relationships with our customers. |
| • | Greater resiliency and independence from the grid. Our energy storage systems increase customers’ independence from the centralized utility and provide on-site backup power when there is a grid outage due to storms, wildfires, other natural disasters and other power failures. In addition, variable electricity prices, known as time-of-use rates, can make it more profitable to sell solar energy to the grid rather than consume it, allowing customers to save money. This combination of increased energy resilience and independence from the grid is a strong incentive for customers to adopt solar and energy storage. |
| • | Reliable, clean power. Our solar and energy storage services allow customers to reduce their environmental footprint by buying clean, affordable and reliable energy. In addition to being a more sustainable energy option than centralized grid-provided energy predominantly powered by fossil fuels, our service offerings are also well-positioned to meet the evolving needs of energy consumers. |
| • | Flexible financing solutions. We offer an array of financing solutions to provide solar and storage services to customers at minimal or no upfront cost. Our solar and solar plus energy storage contracts include leases, PPAs and loans. These flexible solutions allow us to tailor our offerings to meet customers’ needs: we can offer them a fixed payment plan per month to provide predictability, or a contract where monthly payments vary with solar production levels. All of our financing options are Sunnova-branded, and we manage all billing and collections in-house. |
Our Competitive Strengths
Our key competitive strengths include:
| • | Focus on long-term customer relationships. We serve as the primary point of contact for our customers over the duration of their solar service agreements. This direct, long-term relationship with customers drives our focused efforts to provide excellent customer service both directly and through our dealers by providing them with access to high quality components |
3
Table of Contents
| and system designs. We believe that by providing an excellent customer experience from the outset, we are well-positioned to meet the evolving needs of our energy consumers, including energy storage systems today and the potential ability to integrate home automation, electric vehicle charging and other home technology solutions in the future. |
| • | Local dealer model provides operational flexibility and lower fixed costs. We believe our network of approximately 190 local, independent dealers and sub-dealers as of March 31, 2020 provides us with competitive advantages in originating new customer contracts and servicing systems. Our dealer model facilitates our entry into new markets by enabling us to develop relationships with existing local businesses and leveraging their local knowledge and sourcing new sales leads. Similarly, we can quickly refocus our origination efforts and capital deployment strategy to different markets in response to changing dynamics and regulatory developments. We believe our differentiated dealer model enables us to have lower fixed costs and reduced fixed overhead expenses relative to our peers who bear the burden of local market origination, as well as sales, marketing and installation costs, although use of our dealer model means we do not have direct control over certain costs related to our business. |
| • | Mutually beneficial partnership with our dealers. Attracting the best dealers in the business to partner with us has been one of our principal goals since we began operating. We have successfully developed and built our dealer network by offering a compelling value proposition. We have a suite of branding, marketing and technology tools and products to support our dealers’ origination efforts at attractive unit economics. In turn, our dealers benefit from being able to sell a Sunnova-branded solar service agreement that is backed by our best-in-class customer service and proven financing track record. We also have multi-year exclusivity arrangements with several key dealers, under which these dealers will generally not sell solar energy systems for any other company. For certain other dealers, substantially all of the solar service agreements originated by such dealers are Sunnova agreements, although they are under no exclusivity arrangement. We instill trust in our dealers and do not compete with them in their local markets. |
| • | Stable and diversified business model. Our business model is underpinned by contracted cash flows, geographic diversification and proven technology. Our assets are supported by long-term contracted cash flows, with most of our solar service agreements having an initial term of either 10 or 25 years with an opportunity for customers to renew for up to an additional 10 years via two five-year renewal periods. Our stringent customer credit approval policies have resulted in limited defaults in customer payments on our solar service agreements. As of March 31, 2020, our customers had, at the time of signing the solar service agreement, an average FICO score of 739. In addition, we believe our diversification across geographies and equipment manufacturers contributes to the overall stability of our business. As of March 31, 2020, approximately 25%, 25% and 13% of our solar energy systems were located in New Jersey, California, and Puerto Rico, respectively, with our total reach spanning more than 20 U.S. states and territories, reducing the adverse impact on our business of adverse climate, regulatory or economic conditions in any one jurisdiction. Additionally, we have a broad range of suppliers for our solar energy and energy storage system components, which tends to reduce warranty concentration and component and supply risk. |
| • | Demonstrated access to diversified funding sources. We have financed the capital investment required for solar energy system and energy storage system installations from a broad range of sources and investors, including large institutional investors, private equity sponsors and limited foreign investment. Our relationships with, and access to, these investors have allowed us to raise more than $5.5 billion in total capital commitments from equity, debt and tax equity investors. Our diversified access to capital and long-term relationships with |
4
Table of Contents
| multiple funding sources have enabled us to retain significant assets on our balance sheet, without the need to sell assets to raise cash. We believe that our strong balance sheet and access to capital provides us with a competitive advantage. However, we may not be able to access sources of capital due to general market conditions, market perception of our business or the renewable energy industry as a whole. |
| • | Focused and experienced management team. Our CEO and founder has always led our company with a focused and consistent goal of providing reliable and affordable solar energy through best-in-class customer service. Our management team’s long-term focus and commitment underpin everything we do. In addition, our management team has substantial experience in the renewable energy and power sectors and was among the pioneers of the distributed solar industry, providing the team a strong understanding of dealer networks and the associated benefits of the dealer network model. Our CEO and founder has founded two prior successful residential solar businesses, and our management team has multi-disciplinary experience in sales, marketing, legal and project finance with an average of over 20 years in management roles across a variety of both public and private companies. We believe that our combination of experience and focus on our mission and customers provides us with a lasting competitive advantage. |
Our Growth Strategies
Our chief objective is to be a primary provider of clean, affordable and reliable energy for consumers. In order to accomplish this objective, we intend to:
| • | Accelerate growth in underpenetrated markets and expand our geographic footprint. We believe the total market opportunity for residential solar services remains significantly under-penetrated, reaching less than 3% of the 84 million single-family, detached homes in the U.S. The flexibility and reach of our dealer model, coupled with our scalable technology platform, allow us to increase market penetration and enter new markets quickly and efficiently. We plan to strengthen our existing relationships and identify new dealers to accelerate our growth. We will seek to enter new markets and geographies over time, both in the U.S. and internationally, where climate, demand for residential solar energy, and regulatory policies position solar energy as an economically compelling alternative to centralized electric utilities. |
| • | Further strengthen our dealer relationships with support platform and technology suite. Our operations department supports our dealer network and is used to sell additional complementary services to our customer base and directly facilitate sales for our dealers. Additionally, our cloud-based technology suite standardizes and simplifies the design, installation and customer contract processes, and ongoing training and field support provides cost-efficient operations. Finally, dealers are able to leverage our economies of scale to procure equipment through our supply chain relationships. |
| • | Continued deployment of energy storage systems to customers. We believe that integrated energy storage systems enhance the reliability, resiliency and predictability of home solar energy in certain markets, increasing the overall value proposition to consumers. We expect customer demand for Sunnova SunSafe, our solar plus energy storage product, to increase over time. We also expect increased requests by our customers that we retrofit their existing solar energy systems with energy storage arising out of a demand for greater resiliency. In addition, we expect that customers will continue to look for holistic solutions to their solar and storage needs and, as a result, we have partnered with Generac, a leading global designer and manufacturer of energy technology solutions, to provide our customers |
5
Table of Contents
| with greater flexibility to install and size their storage capacity, empowering our customers to power their energy independence. |
| • | Broaden and enhance service offerings. In addition to providing ongoing monitoring and service as a standard component of our solar service agreements, we also offer our service-only product, Sunnova Protect, as a standalone product to consumers who have obtained their solar energy systems through unaffiliated third parties. Of the approximate 2.4 million homes that utilize solar energy systems, we estimate that approximately 900,000 are not covered by a service plan. We believe there is significant market demand for long-term protection plans for customers who have chosen to finance or purchase systems rather than lease them, and we will strive to capture a significant share of this market. We believe the quality and scope of our service offerings through Sunnova Protect fulfill the need for active, comprehensive management to monitor system function and optimize performance. We plan to expand our energy product and industry-leading service offerings in the home to provide further cost savings to our customers and optimize the performance of existing solar energy systems. |
Recent Developments
In May 2020, we amended the revolving credit facility associated with one of our financing subsidiaries that owns certain tax equity funds to, among other things, (a) increase the aggregate commitment amount from $200.0 million to $390.0 million and (b) increase the unused line fee on such committed amounts. In June 2020, we further amended that facility to, among other things, (a) increase the aggregate commitment amount from $390.0 million to $437.5 million and (b) increase the unused line fee on such committed amounts. In May 2020, we admitted a tax equity investor with a total capital commitment of $75.0 million.
In May 2020, we issued and sold an aggregate principal amount of $130.0 million of our 9.75% convertible senior notes in a private placement at an issue price of 95%, for an aggregate purchase price of $123.5 million. The 9.75% convertible senior notes mature in April 2025 unless earlier redeemed, repurchased or converted. We granted the investors of the 9.75% convertible senior notes an option to purchase up to an additional $60.0 million aggregate principal amount of 9.75% convertible senior notes on the same terms and conditions, and the investors exercised this option and completed the purchase of such additional notes on June 12, 2020. We also entered into privately negotiated exchanges with a small number of institutional investors in our 7.75% convertible senior notes due January 2027 (“7.75% convertible senior notes”) whereby such investors exchanged all $55.0 million aggregate principal amount outstanding of our 7.75% convertible senior notes for an equal principal amount of our 9.75% convertible senior notes.
In June 2020, one of our subsidiaries issued $135.9 million in aggregate principal amount of Series 2020-A Class A solar loan-backed notes and $22.6 million in aggregate principal amount of Series 2020-A Class B solar loan-backed notes. The notes bear interest at an annual rate of 2.98% and 7.25% for the Class A and Class B notes, respectively.
Market Opportunity
The number of residential solar energy systems in the U.S. is expected to increase from approximately 2.2 million in 2018 to an estimated 5.4 million in 2024, representing a 16% compounded annual growth rate. Even in light of this rapid growth, the residential solar market remains significantly under-penetrated, reaching less than 3% of the 84 million single-family, detached homes in the U.S.
6
Table of Contents
The following trends have increased solar energy demand from homeowners in a growing number of markets, and are expected to continue to do so:
| • | Rising utility-based electricity rates; |
| • | Declining cost of a residential solar system; |
| • | Availability of financing for residential solar service providers at an attractive cost of capital; |
| • | Declining cost of energy storage due to improvements in technology; |
| • | Increasing consumer demand for energy storage systems to provide temporary power during power outages due to natural disasters; |
| • | Increasing consumer demand for environmentally-friendly products, including power sourced from renewable energy; and |
| • | Governmental policies and incentives, such as net metering, federal tax credits, accelerated depreciation, renewable portfolio standards (“RPS”) on utilities and solar renewable energy certificates (“SRECs”). |
Key Financial and Operational Metrics
We regularly review a number of metrics, including the following key operational and financial metrics, to evaluate our business, measure our performance and liquidity, identify trends affecting our business, formulate our financial projections and make strategic decisions.
| As of March 31, 2020 |
As of December 31, | |||||||||||||||||||
| 2019 | 2018 | 2017 | ||||||||||||||||||
| Number of customers |
|
85,400 | 78,600 | 60,300 | 45,700 | |||||||||||||||
| Three Months Ended March 31, |
Year Ended December 31, | |||||||||||||||||||
| 2020 | 2019 | 2019 | 2018 | 2017 | ||||||||||||||||
| Weighted average number of customers |
81,900 | 62,000 | 68,500 | 53,400 | 38,800 | |||||||||||||||
| Three Months Ended March 31, |
Year Ended December 31, | |||||||||||||||||||
| 2020 | 2019 | 2019 | 2018 | 2017 | ||||||||||||||||
| (in thousands) |
||||||||||||||||||||
| Net loss |
$ | (77,004 | ) | $ | (35,496 | ) | $ | (133,434 | ) | $ | (68,409 | ) | $ | (90,182 | ) | |||||
| Adjusted EBITDA(1) |
$ | 6,190 | $ | 8,068 | $ | 48,297 | $ | 41,119 | $ | 23,404 | ||||||||||
| Interest income from customer notes receivable |
$ | 4,372 | $ | 2,328 | $ | 11,588 | $ | 6,147 | $ | 3,003 | ||||||||||
| Principal proceeds from customer notes receivable, net of related revenue |
$ | 6,378 | $ | 3,429 | $ | 20,044 | $ | 6,812 | $ | 2,360 | ||||||||||
| (1) | Adjusted EBITDA is a financial measure that is not calculated or presented in accordance with generally accepted accounting principles in the U.S. (“GAAP”). See “—Summary Consolidated Financial and Operational Data—Non-GAAP Reconciliation” for information regarding our use of this non-GAAP financial measure and reconciliation of such measure to its most directly comparable GAAP equivalent. |
7
Table of Contents
Risk Factors
Investing in our common stock involves risks that relate to, among other things, our business, our dealers, market factors, governmental policies and regulation, competition, the pace of technological innovations, the credit risk of our customers, our ability to raise financing and the level of our indebtedness. You should carefully consider the risks described under the section titled “Risk Factors” on page 17 in evaluating an investment in our common stock.
Corporate Information
Our principal executive offices are located at 20 East Greenway Plaza, Suite 540, Houston, TX 77046, and our telephone number is (281) 985-9904. Our website address is www.sunnova.com. Information contained on, or that can be accessed through, our website does not constitute part of this prospectus and inclusions of our website address in this prospectus are inactive textual references only.
The Sunnova design logo, “Sunnova” and our other registered or common law trademarks, service marks or trade names appearing in this prospectus are the property of Sunnova Energy Corporation. Other trademarks and trade names referred to in this prospectus are the property of their respective owners. This prospectus contains references to our trademarks and service marks and to those belonging to other entities. Solely for convenience, trademarks and trade names referred to in this prospectus, including logos, artwork and other visual displays, may appear without the ® or TM symbols, but such references are not intended to indicate in any way that we will not assert, to the fullest extent under applicable law, our rights or the rights of the applicable licensor to these trademarks and trade names. We do not intend our use or display of other entities’ trade names, trademarks or service marks to imply a relationship with, or endorsement or sponsorship of us by, any other entity.
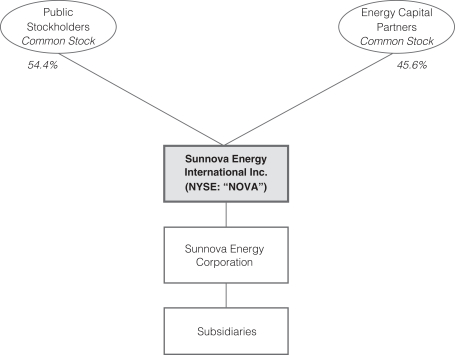
Our Corporate Structure
Sunnova Energy Corporation was incorporated in Delaware on October 22, 2012. SEI, the issuer in this offering, was incorporated in Delaware on April 1, 2019 to enable Sunnova Energy Corporation to implement a holding company organizational structure, to be effected by a merger conducted pursuant to Section 251(g) of the General Corporation Law of the State of Delaware (the “DGCL”) that occurred simultaneously with the closing of our initial public offering (the “IPO”).
On July 24, 2019, SEI priced its IPO of 14,000,000 shares of its common stock at a public offering price of $12.00 per share and on July 25, 2019 SEI’s shares of common stock began trading on the NYSE under the symbol “NOVA”. The IPO closed on July 29, 2019. On August 19, 2019, we issued and sold an additional 865,267 shares of our common stock at a public offering price of $12.00 per share pursuant to the underwriters’ option to purchase additional shares.
In connection with our IPO we decreased the total number of outstanding shares with a 1 for 2.333 reverse stock split effective July 29, 2019 (the “Reverse Stock Split”). All current and past period amounts stated herein have given effect to the Reverse Stock Split.
8
Table of Contents
The following chart summarizes our organizational structure and equity ownership immediately prior to this offering, including by Energy Capital Partners. This chart is provided for illustrative purposes only and does not represent all legal entities affiliated with, or obligations of, our company. See the section titled “Initial Public Offering and Recapitalization Transactions” in our Annual Report on Form 10-K for the year ended December 31, 2019 for more information regarding our recapitalization and reorganization in connection with our IPO. See “—Principal and Selling Stockholders” for additional information regarding beneficial ownership of our common stock.
9
Table of Contents
THE OFFERING
| Common stock offered to the public by the selling stockholders |
8,000,000 shares (9,200,000 shares, if the underwriters exercise in full their option to purchase additional shares of our common stock from certain of the selling stockholders). |
| Underwriters’ option |
To the extent that the underwriters sell more than 8,000,000 shares of common stock, the underwriters have a 30-day option to purchase up to an additional 1,200,000 shares of common stock from certain of the selling stockholders at the public offering price less underwriting discounts and commissions. |
| Common stock to be outstanding immediately after this offering(1)(2) |
85,192,457 shares. |
| Use of proceeds |
We will not receive any of the proceeds from the sale of our common stock by the selling stockholders. See the sections titled “Use of Proceeds” and “Principal and Selling Stockholders” for additional information. |
| NYSE trading symbol |
“NOVA” |
| Risk Factors |
Please read the section titled “Risk Factors” on page 17 for a discussion of risks that you should consider before investing in our common stock. |
(1) Includes 1,152,025 shares of our common stock that will be issued upon conversion of approximately $15.4 million aggregate principal amount of our 9.75% convertible senior notes for resale in this offering by certain of the selling stockholders.
(2) Excludes the following:
| • | 4,143,604 shares of our common stock issuable upon the exercise of outstanding options to purchase shares of our common stock; and |
| • | 5,209,158 shares of our common stock reserved for future issuance under our 2019 Long-Term Incentive Plan. |
| • | 17,010,296 shares of our common stock issuable upon the conversion of approximately $229.6 million aggregate principal amount of our 9.75% convertible senior notes that will remain outstanding after this offering. |
Except as otherwise indicated and except as set forth in our consolidated financial statements included in our Annual Report on Form 10-K for the year ended December 31, 2019, our Quarterly Report on Form 10-Q for the quarter ended March 31, 2020 and information derived therefrom, all information in this prospectus assumes:
| • | the conversion of approximately $15.4 million aggregate principal amount of our 9.75% convertible senior notes into 1,152,025 shares of common stock for resale by certain of the selling stockholders in this offering; |
| • | there will be no exercise of outstanding stock options subsequent to the date hereof; and |
| • | there will be no exercise by the underwriters of their option to purchase up to 1,200,000 additional shares of our common stock from certain of the selling stockholders. |
10
Table of Contents
SUMMARY CONSOLIDATED FINANCIAL AND OPERATIONAL DATA
The following summary consolidated financial data should be read in conjunction with “Management’s Discussion and Analysis of Financial Condition and Results of Operations” included elsewhere in this prospectus and our consolidated financial statements and related notes thereto included in our Annual Report on Form 10-K for the year ended December 31, 2019 and Quarterly Report on Form 10-Q for the quarter ended March 31, 2020. Our historical results are not necessarily indicative of our future results. The summary consolidated financial data in this section are not intended to replace our consolidated financial statements and related notes thereto included in our Annual Report on Form 10-K for the year ended December 31, 2019 and Quarterly Report on Form 10-Q for the quarter ended March 31, 2020 and are qualified in their entirety by our consolidated financial statements and related notes thereto included elsewhere therein.
Sunnova Energy International Inc. was incorporated on April 1, 2019 and had limited historical financial operating results prior to the IPO. Following the IPO, SEI became the sole stockholder of Sunnova Energy Corporation. As a result, SEI consolidates the financial results of Sunnova Energy Corporation and its subsidiaries. For periods prior to the completion of the IPO, the following table shows selected consolidated historical financial data of our accounting predecessor, Sunnova Energy Corporation and its subsidiaries, including SEI.
| Three Months Ended March 31, |
Year Ended December 31, | |||||||||||||||||||
| 2020 | 2019 | 2019 | 2018 | 2017 | ||||||||||||||||
| (Unaudited) | ||||||||||||||||||||
| (in thousands, except share and per share amounts) | ||||||||||||||||||||
| Consolidated Statements of Operations Data: |
||||||||||||||||||||
| Revenue |
$ | 29,829 | $ | 26,715 | $ | 131,556 | $ | 104,382 | $ | 76,856 | ||||||||||
| Operating expenses: |
||||||||||||||||||||
| Cost of revenue—depreciation |
12,986 | 9,653 | 43,536 | 34,710 | 25,896 | |||||||||||||||
| Cost of revenue—other |
1,043 | 652 | 3,877 | 2,007 | 1,444 | |||||||||||||||
| Operations and maintenance |
2,219 | 2,254 | 8,588 | 14,035 | 4,994 | |||||||||||||||
| General and administrative |
27,893 | 18,681 | 97,986 | 67,430 | 54,863 | |||||||||||||||
| Other operating expense (income) |
(6 | ) | (18 | ) | (161 | ) | (70 | ) | 14 | |||||||||||
|
|
|
|
|
|
|
|
|
|
|
|||||||||||
| Total operating expenses, net |
44,135 | 31,222 | 153,826 | 118,112 | 87,211 | |||||||||||||||
|
|
|
|
|
|
|
|
|
|
|
|||||||||||
| Operating loss |
(14,306 | ) | (4,507 | ) | (22,270 | ) | (13,730 | ) | (10,355 | ) | ||||||||||
| Interest expense, net |
67,318 | 31,661 | 108,024 | 51,582 | 59,847 | |||||||||||||||
| Interest expense, net—affiliates |
— | 1,822 | 4,098 | 9,548 | 23,177 | |||||||||||||||
| Interest income |
(4,620 | ) | (2,494 | ) | (12,483 | ) | (6,450 | ) | (3,197 | ) | ||||||||||
| Loss on extinguishment of long-term debt, net—affiliates |
— | — | 10,645 | — | — | |||||||||||||||
| Other (income) expense |
— | — | 880 | (1 | ) | — | ||||||||||||||
|
|
|
|
|
|
|
|
|
|
|
|||||||||||
| Loss before income tax |
(77,004 | ) | (35,496 | ) | (133,434 | ) | (68,409 | ) | (90,182 | ) | ||||||||||
| Income tax |
— | — | — | — | — | |||||||||||||||
|
|
|
|
|
|
|
|
|
|
|
|||||||||||
| Net loss |
(77,004 | ) | (35,496 | ) | (133,434 | ) | (68,409 | ) | (90,182 | ) | ||||||||||
| Net income (loss) attributable to redeemable noncontrolling interests |
(5,929 | ) | 3,018 | 10,917 | 5,837 | 903 | ||||||||||||||
|
|
|
|
|
|
|
|
|
|
|
|||||||||||
| Net loss attributable to stockholders |
$ | (71,075 | ) | $ | (38,514 | ) | $ | (144,351 | ) | $ | (74,246 | ) | $ | (91,085 | ) | |||||
|
|
|
|
|
|
|
|
|
|
|
|||||||||||
| Net loss per share attributable to stockholders—basic and diluted |
$ | (0.85 | ) | $ | (5.87 | ) | $ | (4.14 | ) | $ | (15.74 | ) | $ | (14.05 | ) | |||||
| Weighted average common shares outstanding—basic and diluted |
84,001,151 | 8,635,527 | 40,797,976 | 8,634,477 | 8,632,936 | |||||||||||||||
11
Table of Contents
| Three Months Ended March 31, |
Year Ended December 31, | |||||||||||||||||||
| 2020 | 2019 | 2019 | 2018 | 2017 | ||||||||||||||||
| (Unaudited, in thousands, except per customer amounts) |
||||||||||||||||||||
| Cash Flow Data: |
||||||||||||||||||||
| Net cash used in operating activities |
$ | (58,112 | ) | (24,430 | ) | $ | (170,262 | ) | $ | (11,570 | ) | $ | (48,967 | ) | ||||||
| Net cash used in investing activities |
(184,315 | ) | (92,680 | ) | $ | (568,316 | ) | $ | (348,849 | ) | $ | (289,133 | ) | |||||||
| Net cash provided by financing activities |
261,372 | 109,351 | $ | 801,823 | $ | 365,687 | $ | 369,893 | ||||||||||||
|
|
|
|
|
|
|
|
|
|
|
|||||||||||
| Net increase (decrease) in cash and restricted cash |
$ | 18,945 | $ | (7,759 | ) | $ | 63,245 | $ | 5,268 | $ | 31,793 | |||||||||
|
|
|
|
|
|
|
|
|
|
|
|||||||||||
| Other Financial Data:(1) |
||||||||||||||||||||
| Adjusted EBITDA |
$ | 6,190 | $ | 8,068 | $ | 48,297 | $ | 41,119 | $ | 23,404 | ||||||||||
| Interest income from customer notes receivable |
$ | 4,372 | $ | 2,328 | $ | 11,588 | $ | 6,147 | $ | 3,003 | ||||||||||
| Principal proceeds from customer notes receivable, net of related revenue |
$ | 6,378 | $ | 3,429 | $ | 20,044 | $ | 6,812 | $ | 2,360 | ||||||||||
| Adjusted Operating Cash Flow |
$ | (20,070 | ) | $ | (15,930 | ) | $ | 6,417 | $ | (10,565 | ) | $ | (41,710 | ) | ||||||
| Adjusted Operating Expense |
$ | 23,639 | $ | 18,647 | $ | 83,259 | $ | 63,264 | $ | 53,452 | ||||||||||
| Adjusted Operating Expense per weighted average customer |
$ | 289 | $ | 301 | $ | 1,215 | $ | 1,185 | $ | 1,378 | ||||||||||
| (1) | Adjusted EBITDA, Adjusted Operating Cash Flow, Adjusted Operating Expense and Adjusted Operating Expense per weighted average customer are not financial measures calculated or presented in accordance with GAAP. See “—Non-GAAP Reconciliation” for information regarding our use of these non-GAAP financial measures and reconciliations of each such measure to its most directly comparable GAAP equivalent. |
| As of March 31, 2020 |
As of December 31, | |||||||||||||||
| 2019 | 2018 | 2017 | ||||||||||||||
| (Unaudited) | ||||||||||||||||
| (in thousands) |
||||||||||||||||
| Consolidated Balance Sheet Data: |
||||||||||||||||
| Total current assets |
$ | 279,956 | $ | 274,320 | $ | 89,533 | $ | 81,277 | ||||||||
| Property and equipment, net |
$ | 1,884,576 | $ | 1,745,060 | $ | 1,328,457 | $ | 1,113,073 | ||||||||
| Total assets |
$ | 2,682,180 | $ | 2,487,067 | $ | 1,665,085 | $ | 1,328,788 | ||||||||
| Long-term debt, net (excluding debt with affiliates) |
$ | 1,511,555 | $ | 1,346,419 | $ | 872,249 | $ | 723,697 | ||||||||
| Total liabilities |
$ | 1,847,733 | $ | 1,668,827 | $ | 1,078,287 | $ | 919,015 | ||||||||
| Total stockholders’ equity |
$ | 592,020 | $ | 645,935 | $ | 501,118 | $ | 371,183 | ||||||||
Non-GAAP Reconciliation:
Adjusted EBITDA. We define Adjusted EBITDA as net income (loss) plus net interest expense, depreciation and amortization expense, income tax expense, financing deal costs, natural disaster losses and related charges, net, amortization of payments to dealers for exclusivity and other bonus arrangements, legal settlements and excluding the effect of certain non-recurring items we do not consider to be indicative of our ongoing operating performance such as, but not limited to, costs of our IPO, losses on unenforceable contracts, losses on extinguishment of long-term debt, realized and unrealized gains and losses on fair value option instruments and other non-cash items such as non-cash compensation expense, asset retirement obligation (“ARO”) accretion expense and provision for current expected credit losses. We began recognizing current expected credit losses in the first quarter of 2020 as a result of the adoption of Accounting Standards Update No. 2016-13. Financial Statements—Credit Losses.
12
Table of Contents
Adjusted EBITDA is a non-GAAP financial measure we use as a performance measure. We believe investors and securities analysts also use Adjusted EBITDA in evaluating our operating performance. This measurement is not recognized in accordance with GAAP and should not be viewed as an alternative to GAAP measures of performance. The GAAP measure most directly comparable to Adjusted EBITDA is net income (loss). The presentation of Adjusted EBITDA should not be construed to suggest our future results will be unaffected by non-cash or non-recurring items. In addition, our calculation of Adjusted EBITDA is not necessarily comparable to Adjusted EBITDA as calculated by other companies.
We believe Adjusted EBITDA is useful to management, investors and analysts in providing a measure of core financial performance adjusted to allow for comparisons of results of operations across reporting periods on a consistent basis. These adjustments are intended to exclude items that are not indicative of the ongoing operating performance of the business. Adjusted EBITDA is also used by our management for internal planning purposes, including our consolidated operating budget, and by our board of directors in setting performance-based compensation targets. Adjusted EBITDA should not be considered an alternative to but viewed in conjunction with GAAP results, as we believe it provides a more complete understanding of ongoing business performance and trends than GAAP measures alone. Adjusted EBITDA has limitations as an analytical tool, and you should not consider it in isolation or as a substitute for analysis of our results as reported under GAAP.
| Three Months Ended March 31, |
Year Ended December 31, | |||||||||||||||||||
| 2020 | 2019 | 2019 | 2018 | 2017 | ||||||||||||||||
| (Unaudited, in thousands) |
||||||||||||||||||||
| Reconciliation of Net Loss to Adjusted EBITDA: |
||||||||||||||||||||
| Net loss |
$ | (77,004 | ) | $ | (35,496 | ) | $ | (133,434 | ) | $ | (68,409 | ) | $ | (90,182 | ) | |||||
| Interest expense, net |
67,318 | 31,661 | 108,024 | 51,582 | 59,847 | |||||||||||||||
| Interest expense, net—affiliates |
— | 1,822 | 4,098 | 9,548 | 23,177 | |||||||||||||||
| Interest income |
(4,620 | ) | (2,494 | ) | (12,483 | ) | (6,450 | ) | (3,197 | ) | ||||||||||
| Depreciation expense |
14,946 | 11,012 | 49,340 | 39,290 | 29,482 | |||||||||||||||
| Amortization expense |
9 | 5 | 29 | 133 | 133 | |||||||||||||||
|
|
|
|
|
|
|
|
|
|
|
|||||||||||
| EBITDA |
649 | 6,510 | 15,574 | 25,694 | 19,260 | |||||||||||||||
| Non-cash compensation expense |
2,690 | 387 | 10,512 | 3,410 | 1,495 | |||||||||||||||
| ARO accretion expense |
489 | 313 | 1,443 | 1,183 | 704 | |||||||||||||||
| Financing deal costs |
116 | 119 | 1,161 | 1,902 | 336 | |||||||||||||||
| Natural disaster losses and related charges, net |
31 | — | 54 | 8,217 | 1,034 | |||||||||||||||
| IPO costs |
— | 739 | 3,804 | 563 | — | |||||||||||||||
| Loss on unenforceable contracts |
— | — | 2,381 | — | — | |||||||||||||||
| Loss on extinguishment of long-term debt, net—affiliates |
— | — | 10,645 | — | — | |||||||||||||||
| Unrealized loss on fair value option instruments |
— | — | 150 | — | — | |||||||||||||||
| Realized loss on fair value option instruments |
— | — | 730 | — | — | |||||||||||||||
| Amortization of payments to dealers for exclusivity and other bonus arrangements |
351 | — | 583 | — | — | |||||||||||||||
| Legal settlements |
— | — | 1,260 | 150 | 575 | |||||||||||||||
| Provision for current expected credit losses |
1,864 | — | — | — | — | |||||||||||||||
|
|
|
|
|
|
|
|
|
|
|
|||||||||||
| Adjusted EBITDA |
$ | 6,190 | $ | 8,068 | $ | 48,297 | $ | 41,119 | $ | 23,404 | ||||||||||
|
|
|
|
|
|
|
|
|
|
|
|||||||||||
13
Table of Contents
Adjusted Operating Cash Flow. We define Adjusted Operating Cash Flow as net cash used in operating activities plus principal proceeds from customer notes receivable, financed insurance payments and distributions to redeemable noncontrolling interests less derivative breakage fees from financing structure changes, payments to dealers for exclusivity and other bonus arrangements, net inventory and prepaid inventory (sales) purchases and payments of non-capitalized costs related to our IPO. Adjusted Operating Cash Flow is a non-GAAP financial measure we use as a liquidity measure. This measurement is not recognized in accordance with GAAP and should not be viewed as an alternative to GAAP measures of liquidity. The GAAP measure most directly comparable to Adjusted Operating Cash Flow is net cash used in operating activities. We believe Adjusted Operating Cash Flow is a supplemental financial measure useful to management, analysts, investors, lenders and rating agencies as an indicator of our ability to internally fund origination activities, service or incur additional debt and service our contractual obligations. We believe investors and analysts will use Adjusted Operating Cash Flow to evaluate our liquidity and ability to service our contractual obligations. However, Adjusted Operating Cash Flow has limitations as an analytical tool because it does not account for all future expenditures and financial obligations of the business or reflect unforeseen circumstances that may impact our future cash flows, all of which could have a material effect on our financial condition and results from operations. In addition, our calculations of Adjusted Operating Cash Flow are not necessarily comparable to liquidity measures presented by other companies. Investors should not rely on these measures as a substitute for any GAAP measure, including net cash used in operating activities.
| Three Months Ended March 31, |
Year Ended December 31, | |||||||||||||||||||
| 2020 | 2019 | 2019 | 2018 | 2017 | ||||||||||||||||
| (Unaudited, in thousands) |
||||||||||||||||||||
| Reconciliation of Net Cash Used in Operating Activities to Adjusted Operating Cash Flow: |
||||||||||||||||||||
| Net cash used in operating activities |
$ | (58,112 | ) | $ | (24,430 | ) | $ | (170,262 | ) | $ | (11,570 | ) | $ | (48,967 | ) | |||||
| Principal proceeds from customer notes receivable |
6,940 | 3,757 | 21,604 | 7,715 | 2,816 | |||||||||||||||
| Financed insurance payments |
(2,398 | ) | — | (4,672 | ) | — | — | |||||||||||||
| Derivative breakage fees from financing structure changes |
31,122 | 3,428 | 12,080 | (17,793 | ) | 2,833 | ||||||||||||||
| Distributions to redeemable noncontrolling interests |
(1,373 | ) | (3,652 | ) | (7,559 | ) | (2,017 | ) | (294 | ) | ||||||||||
| Payments to dealers for exclusivity and other bonus arrangements |
5,344 | 2,000 | 31,733 | — | — | |||||||||||||||
| Net Inventory and prepaid inventory (sales) purchases |
(1,593 | ) | 2,967 | 118,549 | 13,100 | 1,902 | ||||||||||||||
| Payments of non-capitalized costs related to IPO |
— | — | 4,944 | — | — | |||||||||||||||
|
|
|
|
|
|
|
|
|
|
|
|||||||||||
| Adjusted Operating Cash Flow |
$ | (20,070 | ) | $ | (15,930 | ) | $ | 6,417 | $ | 10,565 | $ | (41,710 | ) | |||||||
|
|
|
|
|
|
|
|
|
|
|
|||||||||||
14
Table of Contents
Adjusted Operating Expense. We define Adjusted Operating Expense as total operating expense less depreciation and amortization expense, financing deal costs, natural disaster losses and related charges, net, amortization of payments to dealers for exclusivity and other bonus arrangements, legal settlements and excluding the effect of certain non-recurring items we do not consider to be indicative of our ongoing operating performance such as, but not limited to, costs of our IPO, losses on unenforceable contracts and other non-cash items such as non-cash compensation expense, ARO accretion expense and provision for current expected credit losses. Adjusted Operating Expense is a non-GAAP financial measure we use as a performance measure. We believe investors and securities analysts will also use Adjusted Operating Expense in evaluating our performance. This measurement is not recognized in accordance with GAAP and should not be viewed as an alternative to GAAP measures of performance. The GAAP measure most directly comparable to Adjusted Operating Expense is total operating expense. We believe Adjusted Operating Expense is a supplemental financial measure useful to management, analysts, investors, lenders and rating agencies as an indicator of the efficiency of our operations between reporting periods. Adjusted Operating Expense should not be considered an alternative to but viewed in conjunction with GAAP total operating expense, as we believe it provides a more complete understanding of our performance than GAAP measures alone. Adjusted Operating Expense has limitations as an analytical tool and you should not consider it in isolation or as a substitute for analysis of our results as reported under GAAP, including total operating expense.
| Three Months Ended March 31, |
Year Ended December 31, | |||||||||||||||||||
| 2020 | 2019 | 2019 | 2018 | 2017 | ||||||||||||||||
| (Unaudited, in thousands, except per customer data) |
||||||||||||||||||||
| Reconciliation of Total Operating Expense, Net to Adjusted Operating Expense: |
||||||||||||||||||||
| Total operating expense, net |
$ | 44,135 | $ | 31,222 | $ | 153,826 | $ | 118,112 | $ | 87,211 | ||||||||||
| Depreciation expense |
(14,946 | ) | (11,012 | ) | (49,340 | ) | (39,290 | ) | (29,482 | ) | ||||||||||
| Amortization expense |
(9 | ) | (5 | ) | (29 | ) | (133 | ) | (133 | ) | ||||||||||
| Non-cash compensation expense |
(2,690 | ) | (387 | ) | (10,512 | ) | (3,410 | ) | (1,495 | ) | ||||||||||
| ARO accretion expense |
(489 | ) | (313 | ) | (1,443 | ) | (1,183 | ) | (704 | ) | ||||||||||
| Financing deal costs |
(116 | ) | (119 | ) | (1,161 | ) | (1,902 | ) | (336 | ) | ||||||||||
| Natural disaster losses and related charges, net |
(31 | ) | — | (54 | ) | (8,217 | ) | (1,034 | ) | |||||||||||
| IPO costs |
— | (739 | ) | (3,804 | ) | (563 | ) | — | ||||||||||||
| Loss on unenforceable contracts |
— | — | (2,381 | ) | — | — | ||||||||||||||
| Amortization of payments to dealers for exclusivity and other bonus arrangements |
(351 | ) | — | (583 | ) | — | — | |||||||||||||
| Legal settlements |
— | — | (1,260 | ) | (150 | ) | (575 | ) | ||||||||||||
| Provision for current expected credit losses |
(1,864 | ) | — | — | — | — | ||||||||||||||
|
|
|
|
|
|
|
|
|
|
|
|||||||||||
| Adjusted Operating Expense |
$ | 23,639 | $ | 18,647 | $ | 83,259 | $ | 63,264 | $ | 53,452 | ||||||||||
|
|
|
|
|
|
|
|
|
|
|
|||||||||||
| Adjusted Operating Expense per weighted average customer |
$ | 289 | $ | 301 | $ | 1,215 | $ | 1,185 | $ | 1,378 | ||||||||||
|
|
|
|
|
|
|
|
|
|
|
|||||||||||
15
Table of Contents
Operational Metrics
We regularly review a number of metrics, including the following key operational and financial metrics, to evaluate our business, measure our performance and liquidity, identify trends affecting our business, formulate our financial projections and make strategic decisions. For additional information about our key operational metrics, including their definitions, calculation and limitations, see “Management’s Discussion and Analysis of Financial Condition and Results of Operations—Key Financial and Operational Metrics.”
| As of March 31, 2020 |
As of December 31, | |||||||||||||||
| 2019 | 2018 | 2017 | ||||||||||||||
| Number of customers |
85,400 | 78,600 | 60,300 | 45,700 | ||||||||||||
| Three Months Ended March 31, |
Year Ended December 31, |
|||||||||||||||||||
| 2020 | 2019 | 2019 | 2018 | 2017 | ||||||||||||||||
| Weighted average number of customers (excluding loan agreements) |
70,100 | 55,300 | 60,100 | 49,200 | 37,000 | |||||||||||||||
| Weighted average number of customers with loan agreements |
11,800 | 6,700 | 8,400 | 4,200 | 1,800 | |||||||||||||||
|
|
|
|
|
|
|
|
|
|
|
|||||||||||
| Weighted average number of customers |
81,900 | 62,000 | 68,500 | 53,400 | 38,800 | |||||||||||||||
|
|
|
|
|
|
|
|
|
|
|
|||||||||||
| As of March 31, 2020 |
As of December 31, | |||||||||||||||
| 2019 | 2018 | 2017 | ||||||||||||||
| (Unaudited, in millions) |
||||||||||||||||
| Estimated gross contracted customer value |
$ | 2,035 | $ | 1,879 | $ | 1,476 | $ | 1,127 | ||||||||
16
Table of Contents
Investing in our common stock involves a high degree of risk. You should carefully consider the risks described below together with all of the other information included in this prospectus before deciding to invest in our common stock. If any of the following risks actually occur, they may materially and adversely affect our business, financial condition, cash flows and results of operations. In this event, the trading price of our common stock could decline, and you could lose all or part of your investment in us. We may experience additional risks and uncertainties not currently known to us; or, as a result of developments occurring in the future, conditions that we currently deem to be immaterial may also materially and adversely affect our business, financial condition, cash flows and results of operations.
Risks Related to Our Business
Historically, we have incurred operating and net losses and we may be unable to achieve or sustain profitability in the future.
We incurred operating losses of $14.3 million, $22.3 million and $13.7 million and net losses of $77.0 million, $133.4 million and $68.4 million for the three months ended March 31, 2020 and the years ended December 31, 2019 and 2018, respectively. These historical operating and net losses were due to a number of factors, including increased expenses to fund our growth and related financing needs. We expect to incur significant expenses as we finance the expansion of our operations and implement additional internal systems and infrastructure to support our growth. In addition, as a public company, we incur significant additional legal, accounting and other expenses we did not incur as a private company. We do not know whether our revenue will grow rapidly enough to absorb these costs. Our ability to achieve profitability depends on a number of factors, including:
| • | growing our customer base and originating new solar service agreements on economic terms; |
| • | maintaining or lowering our cost of capital; |
| • | reducing operating costs by optimizing our operations and maintenance processes; |
| • | maximizing the benefits of our dealer network; |
| • | finding additional tax equity investors and other sources of institutional capital; and |
| • | the continued availability of various governmental incentives for the solar industry. |
Even if we do achieve profitability, we may be unable to sustain or increase our profitability in the future.
The ongoing Coronavirus Disease (“COVID-19”) pandemic could adversely affect our business, financial condition and results of operations.
The ongoing COVID-19 pandemic continues to be a rapidly evolving situation. The COVID-19 pandemic and efforts to respond to it have resulted in widespread adverse impacts on the global economy and on our employees, customers, dealers and other parties with whom we have business relations. We have experienced some resulting disruptions to our business operations as the COVID-19 pandemic has continued to spread through the states and U.S. territories in which we operate. For example, social distancing guidelines, stay-at-home orders and similar government measures associated with the COVID-19 pandemic, as well as actions by individuals to reduce their potential exposure to the virus, contributed to a decline in origination, with new contract origination, net of cancellations, declining in each of March and April 2020. This decline reflects an inability by our dealers to perform in-person sales calls based on the stay-at-home orders in some locations. A significant or extended decline in new contract origination may have a material adverse effect on our business, cash flows, liquidity, financial condition and results of operations.
17
Table of Contents
We and our dealers have modified certain business and workforce practices (including those related to new contract origination, installation and servicing of solar energy systems and employee work locations) to conform to government restrictions and best practices encouraged by governmental and regulatory authorities. Such modifications have allowed our dealers to continue to install and us to continue to service solar energy systems, but may also disrupt our operations, impede productivity or otherwise be ineffective in the future. If there are additional outbreaks of the COVID-19 virus or other viruses or more stringent health and safety guidelines are adopted, our and our dealers’ ability to continue performing installations and service calls may be adversely impacted.
Our future success also depends on our ability to raise capital from third-party investors and commercial sources. In the initial weeks of the COVID-19 pandemic we saw access to capital markets reduced generally. If we are unable to regain access to the capital markets or are unable to raise funds through our tax equity and warehouse financing transactions at competitive terms, it would adversely impact both our ability to finance the deployment of our solar energy systems and energy storage systems and may have a material adverse effect on our business, cash flows, liquidity, financial condition and results of operations.
There is considerable uncertainty regarding the extent to which the COVID-19 virus will continue to spread and the extent and duration of governmental and other measures implemented to try to slow the spread of the COVID-19 virus, such as large-scale travel bans and restrictions, border closures, quarantines, shelter-in-place orders and business and government shutdowns. Restrictions of this nature have caused, and may continue to cause, us and our dealers to experience operational delays and may cause milestones or deadlines relating to our exclusivity arrangements to be missed. To date, we have not received notices from our dealers regarding performance delays resulting from the COVID-19 pandemic. However, worsening economic conditions could result in such outcomes over time, which would impact our future financial performance. Further, the effects of the economic downturn associated with the COVID-19 pandemic, and other economic factors, may increase unemployment and reduce consumer credit ratings and credit availability, which may adversely affect new customer origination and our existing customers’ ability to make payments on their solar service agreements. Periods of high unemployment and a lack of availability of credit may lead to increased delinquency and default rates. If existing economic conditions continue for a prolonged period of time or worsen, delinquencies on solar service agreements could increase, which would also negatively impact our future financial performance and the price of our common stock. Finally, if supply chains become significantly disrupted due to additional outbreaks of the COVID-19 virus or other viruses or more stringent health and safety guidelines are implemented, our ability to install and service solar energy systems could become adversely impacted.
We cannot predict the full impact the COVID-19 pandemic or the significant disruption and volatility currently being experienced in the capital markets will have on our business, cash flows, liquidity, financial condition and results of operations at this time due to numerous uncertainties. The ultimate impact will depend on future developments, including, among other things, the ultimate geographic spread and duration of the COVID-19 virus, the depth and duration of the economic downturn and other economic effects of the COVID-19 pandemic, the consequences of governmental and other measures designed to prevent the spread of the COVID-19 virus, actions taken by governmental authorities, customers, dealers and other third parties, our ability and the ability of our customers, potential customers and dealers to adapt to operating in a changed environment and the timing and extent to which normal economic and operating conditions resume.
18
Table of Contents
Certain of our key operational metrics, including estimated gross contracted customer value, are based on various assumptions and estimates we make over an extended period of time. Actual experience may vary materially from these estimates and assumptions and therefore undue reliance should not be placed on these metrics.
Our key operational metrics include a number of assumptions and estimates we make over an extended period of time (up to 35 years) and may not prove accurate. In calculating estimated gross contracted customer value, we estimate projected monthly customer payments over the remaining life of our solar service agreements, which are typically 25 years in length with an opportunity for customers to renew for up to an additional 10 years, and from the future sale of related SRECs. These estimated future cash flows depend on various factors including but not limited to solar service agreement type, contracted rates, customer loss rates, expected sun hours and the projected production capacity of the solar equipment installed. Additionally, in calculating estimated gross contracted customer value we also estimate cash distributions to tax equity fund investors and operating, maintenance and administrative expenses associated with the solar service agreements, including expenses related to accounting, reporting, audit, insurance, maintenance and repairs over the remaining life of our solar service agreements.
Furthermore, in calculating estimated gross contracted customer value, we discount our future net cash flows at 6% based on industry practice and the interest rate on certain recent securitizations. This discount rate might not be the most appropriate discount rate based on interest rates in effect from time to time and industry or company-specific risks associated with these cash flows and the appropriate discount rate for these estimates may change in the future due to the level of inflation, rising interest rates, our cost of capital, customer default rates and consumer demand for solar energy systems, among other things. We also assume customer losses of 0% in calculating these metrics even though we expect to have some minimal level of customer losses over the life of our contracts. To illustrate the way in which actual results may change, we present sensitivities around the discount rate and the rate of customer losses, although these sensitivities may not capture the most appropriate discount rate or the rate of customer losses we will experience. For a discussion of estimated gross contracted customer value and the related discount rate, see “Management’s Discussion and Analysis of Financial Condition and Results of Operations—Key Financial and Operational Metrics—Estimated Gross Contracted Customer Value”.
PricewaterhouseCoopers LLP has not audited, reviewed, examined, compiled nor applied agreed-upon procedures with respect to these operational metrics or their components. The estimates discussed above are based on a combination of assumptions that may prove to be inaccurate over time. Such inaccuracies could be material, particularly given the estimates relate to cash flows up to 35 years in the future.
If our allowance for credit losses is not enough to cover actual credit losses from our customer notes receivable portfolio, our results of operations and financial condition could be negatively affected.
We maintain an allowance for credit losses, which is a reserve that represents our best estimate of actual credit losses we may experience in our existing customer notes receivable portfolio. The level of the allowance reflects our continuing evaluation of factors including the financial asset type, customer credit rating, contractual term, vintage, volume and trends in delinquencies, nonaccruals, write-offs and present economic, political and regulatory conditions. The determination of the appropriate level of the allowance for credit losses inherently involves subjectivity in our modeling and requires us to make estimates of current credit risks and future trends, all of which may undergo material changes or vary from our historical experience. Deterioration in economic conditions affecting our customers, new information regarding existing loans and other factors, both within and outside of
19
Table of Contents
our control, may require an increase in the allowance for credit losses. Furthermore, if write-offs in future periods exceed the allowance for credit losses, we will need to increase the allowance for credit losses in future periods. Any increases in the allowance for credit losses will result in an increase in net loss and could have a material adverse effect on our business, financial condition and results of operations.
We adopted Accounting Standards Update No. 2016-13, Financial Instruments-Credit Losses, in January 2020, which requires entities to use a forward-looking expected loss approach, referred to as the current expected credit loss methodology in place of the previously-used incurred loss model. This resulted in an increase to the allowance for credit losses of $9.9 million. In future periods, current expected credit losses may result in increased reserves during or in advance of an economic downturn. If we are required to materially increase our level of allowance for credit losses for any reason, such increase could have a material adverse effect on our business, financial condition and results of operations.
Our growth strategy depends on the continued origination of solar service agreements by us and our dealers.
Our growth strategy depends on the continued origination of solar service agreements by us and our dealers. We may be unable to originate additional solar service agreements and related solar energy systems and energy storage systems in the numbers or at the pace we currently expect for a variety of reasons, including, among other things, the following:
| • | demand for solar energy systems and energy storage systems failing to develop sufficiently or taking longer than expected to develop; |
| • | residential solar energy technology being available at economically attractive prices as a result of factors outside of our control, including utility prices not rising as quickly as anticipated; |
| • | issues related to identifying, engaging, contracting, compensating and maintaining relationships with dealers and the negotiation of dealer agreements; |
| • | issues related to financing, construction, permitting, the environment, governmental approvals and the negotiation of solar service agreements; |
| • | a reduction in government incentives or adverse changes in policy and laws for the development or use of solar energy, including net metering, SRECs and tax credits; |
| • | other government or regulatory actions that could impact our business model; |
| • | negative developments in public perception of the solar energy industry; and |
| • | competition from other solar companies and energy technologies, including the emergence of alternative renewable energy technologies. |
If the challenges of originating solar service agreements and related solar energy systems and energy storage systems increase, our pool of available opportunities may be limited, which could have a material adverse effect on our business, financial condition, cash flows and results of operations.
If sufficient additional demand for residential solar energy systems does not develop or takes longer to develop than we anticipate, our ability to originate solar service agreements may decrease.
The distributed residential solar energy market is at a relatively early stage of development in comparison to fossil fuel-based electricity generation. If additional demand for distributed residential solar energy systems fails to develop sufficiently or takes longer to develop than we anticipate, we may be unable to originate additional solar service agreements and related solar energy systems and
20
Table of Contents
energy storage systems to grow our business. In addition, demand for solar energy systems and energy storage systems in our targeted markets may not develop to the extent we anticipate. As a result, we may be unsuccessful in broadening our customer base through origination of solar service agreements and related solar energy systems and energy storage systems within our current markets or in new markets we may enter.
Many factors may affect the demand for solar energy systems, including the following:
| • | availability, substance and magnitude of solar support programs including government targets, subsidies, incentives, RPS and residential net metering rules; |
| • | the relative pricing of other conventional and non-renewable energy sources, such as natural gas, coal, oil and other fossil fuels, wind, utility-scale solar, nuclear, geothermal and biomass; |
| • | performance, reliability and availability of energy generated by solar energy systems compared to conventional and other non-solar renewable energy sources; |
| • | availability and performance of energy storage technology, the ability to implement such technology for use in conjunction with solar energy systems and the cost competitiveness such technology provides to customers as compared to costs for those customers reliant on the conventional electrical grid; and |
| • | general economic conditions and the level of interest rates. |
The residential solar energy industry is constantly evolving, which makes it difficult to evaluate our prospects. We cannot be certain if historical growth rates reflect future opportunities or whether growth anticipated by us will be realized. The failure of distributed residential solar energy to achieve, or its being significantly delayed in achieving, widespread adoption could have a material adverse effect on our business, financial condition and results of operations.
If we fail to manage our operations and growth effectively, we may be unable to execute our business plan, maintain high levels of customer service or adequately address competitive challenges.
We have experienced significant growth in recent periods measured by our number of customers and we intend to continue our efforts to expand our business within existing and new markets. This growth has placed, and any future growth may place, a strain on our management, operational and financial infrastructure. Our growth requires our management to devote a significant amount of time and effort to maintain and expand our relationships with customers, dealers and other third parties, attract new customers and dealers, arrange financing for our growth and manage our expansion into additional markets.
In addition, our current and planned operations, personnel, information technology and other systems and procedures might be inadequate to support our future growth and may require us to make additional unanticipated investments in our infrastructure. Our success and ability to further scale our business will depend, in part, on our ability to manage these changes in a cost-effective and efficient manner.
If we cannot manage our operations and growth, we may be unable to meet our expectations regarding growth, opportunity and financial targets, take advantage of market opportunities, execute our business strategies, meet our tax equity financing commitments or respond to competitive pressures. This could also result in declines in quality or customer satisfaction, increased costs, difficulties in introducing new offerings or other operational difficulties. Any failure to effectively manage our operations and growth could adversely impact our reputation, business, financial condition, cash flows and results of operations.
21
Table of Contents
A material reduction in the retail price of electricity charged by electric utilities or other retail electricity providers would harm our business, financial condition and results of operations.
Decreases in the retail price of electricity from electric utilities or from other retail electric providers, including other renewable energy sources such as larger-scale solar energy systems, could make our offerings less economically attractive. The price of electricity from utilities could decrease as a result of:
| • | the construction of a significant number of new power generation plants, whether generated by natural gas, nuclear power, coal or renewable energy; |
| • | the construction of additional electric transmission and distribution lines; |
| • | a reduction in the price of natural gas or other natural resources as a result of increased supply due to new drilling techniques or other technological developments, a relaxation of associated regulatory standards or broader economic or policy developments; |
| • | less demand for electricity due to energy conservation technologies and public initiatives to reduce electricity consumption or to recessionary economic conditions; and |
| • | development of competing energy technologies that provide less expensive energy. |
A reduction in electric utilities’ rates or changes to peak hour pricing policies or rate design (such as the adoption of a fixed or flat rate) could also make our offerings less competitive with the price of electricity from the electrical grid. If the cost of energy available from electric utilities or other providers were to decrease relative to solar energy generated from residential solar energy systems or if similar events impacting the economics of our offerings were to occur, we may have difficulty attracting new customers or existing customers may default or seek to terminate, cancel or otherwise avoid the obligations under their solar service agreements. For example, large utilities in California have started transitioning customers to time-of-use rates and also have adopted a shift in the peak period for time-of-use rates to later in the day. Unless grandfathered under a different rate, residential customers with solar energy systems are required to take service under time-of-use rates with the later peak period. Moving utility customers to time-of-use rates or the shift in the timing of peak rates for utility-generated electricity to include times of day when solar energy generation is less efficient or non-operable could also make our offerings less competitive. Time-of-use rates could also result in higher costs for our customers whose electricity requirements are not fully met by our offerings during peak periods.
Additionally, the price of electricity from utilities may grow less quickly than the escalator feature in certain of our solar service agreements, which could also make our solar energy systems less competitive with the price of electricity from the electrical grid and result in a material adverse effect on our business, financial condition and results of operations.
Our growth is dependent on our dealer network and our failure to retain or replace existing dealers or to grow our dealer network could adversely impact our business. In addition, one of our dealers currently accounts for approximately half of our recently added customers.
Our dealer network is an integral component of our business strategy and serves as the means by which we are able to originate solar service agreements and related solar energy systems and energy storage systems in existing and prospective markets. Poor performance by our dealers in originating solar service agreements could have a material adverse effect on our business, financial condition and results of operations. We have in the past had disputes and litigation with certain of our dealers over their performance.
As we grow, particularly in new jurisdictions, we will need to expand our dealer network. We are subject to significant competition for the recruitment and retention of dealers from our competitors and
22
Table of Contents
we may not be able to recruit new or replacement dealers in the future. We compete for our dealers with other solar service providers primarily based on the amount and timing of payments for originating solar service agreements, financial ability and our suite of technology tools.
Most of our dealers are not restricted in their ability to work with our competitors and are not obligated to continue working with us. In the past, some of our dealers have chosen to work with competitors of ours or terminated their relationships with us and dealers may reduce or terminate their work with us in the future. The departure of a significant number of our dealers for any reason, or the failure to replace departing dealers in the event of such departures, could reduce our potential origination opportunities and could have a material adverse effect on our business, financial condition and results of operations. As we develop and expand our Sunnova Protect services, dealers may view us as a competitor and choose to end their relationship with us.
Additionally, dependence on any one dealer or small group of dealers further concentrates our exposure to risks related to termination of the dealer arrangement, poor service provided by such dealer, the deterioration in financial condition of the dealer and other risks inherent in such a relationship. For the three months ended March 31, 2020 and the years ended December 31, 2019 and December 31, 2018, Trinity Solar, Inc. (“Trinity”) accounted for approximately 30%, 41% and 52% of our originations for such periods, respectively. Although we have entered into a four-year exclusivity agreement with Trinity, pursuant to which Trinity may only originate solar service agreements for us, there are various exceptions to this obligation. For a discussion of exclusivity arrangements with certain of our dealers, see “Business—Our Relationships with Our Dealers”.
If we or our dealers fail to hire and retain a sufficient number of employees and service providers in key functions, our growth and our ability to timely complete customer projects and successfully manage customer accounts would be constrained.
To support our growth, we and our dealers need to hire, train, deploy, manage and retain a substantial number of skilled employees, engineers, installers, electricians and sales and project finance specialists. Competition for qualified personnel in our industry has increased substantially, particularly for skilled personnel involved in the installation of solar energy systems. We and our dealers also compete with the homebuilding and construction industries for skilled labor. These industries are cyclical and when participants in these industries seek to hire additional workers, it puts upward pressure on our and our dealers’ labor costs. Companies with whom our dealers compete to hire installers may offer compensation or incentive plans that certain installers may view as more favorable. As a result, our dealers may be unable to attract or retain qualified and skilled installation personnel. The further unionization of our industry’s labor force or the homebuilding and construction industries’ labor forces, either in response to the COVID-19 pandemic or otherwise, could also increase our dealers’ labor costs. Shortages of skilled labor could significantly delay a project or otherwise increase our dealers’ costs. Further, we need to continue to increase the training of our customer service team to provide high-end account management and service to homeowners before, during and following the point of installation of our solar energy systems. Identifying and recruiting qualified personnel and training them requires significant time, expense and attention. It can take several months before a new customer service team member is fully trained and productive at the standards we have established. If we are unable to hire, develop and retain talented customer service or other personnel, we may not be able to grow our business.
We need to obtain substantial additional financing arrangements to provide working capital and growth capital and if financing is not available to us on acceptable terms when needed, our ability to continue to grow our business would be materially adversely impacted.
Distributed residential solar power is a capital-intensive business that relies heavily on the availability of debt and equity financing sources to fund solar energy system purchase, design,
23
Table of Contents
engineering and other capital expenditures. From our inception through March 31, 2020, we have raised more than $5.5 billion in total capital commitments from equity, debt and tax equity investors.
Our future success depends on our ability to raise capital from third-party investors and commercial sources, such as banks and other lenders, on competitive terms to help finance the deployment of our solar energy systems. We seek to minimize our cost of capital in order to improve profitability and maintain the price competitiveness of the electricity produced by, the payments for and the cost of our solar energy systems. We rely on access to capital, including through tax equity financing and indebtedness in the form of debt facilities and asset-backed securities, to cover the costs related to bringing our solar energy systems and energy storage systems in service, although our customers ultimately bear responsibility for those costs pursuant to our solar service agreements.
To meet the capital needs of our growing business, we will need to obtain additional debt or equity financing from current and new investors. If any of our current debt or equity investors decide not to invest in us in the future for any reason, or decide to invest at levels inadequate to support our anticipated needs or materially change the terms under which they are willing to provide future financing, we will need to identify new investors and financial institutions to provide financing and negotiate new financing terms. In addition, our ability to obtain additional financing through the asset-backed securities market or other secured debt markets is subject to our having sufficient assets eligible for securitization as well as our ability to obtain appropriate credit ratings. If we are unable to raise additional capital in a timely manner, our ability to meet our capital needs and fund future growth may be limited.
Delays in obtaining financing could cause delays in expansion in existing markets or entering into new markets and hiring additional personnel. Any future delays in capital raising could similarly cause us to delay deployment of a substantial number of solar energy systems for which we have signed solar service agreements with customers. Our future ability to obtain additional financing depends on banks’ and other financing sources’ continued confidence in our business model and the renewable energy industry as a whole. It could also be impacted by the liquidity needs of such financing sources themselves. We face intense competition from a variety of other companies, technologies and financing structures for such limited investment capital. If we are unable to continue to offer a competitive investment profile, we may lose access to these funds or they may only be available to us on terms less favorable than those received by our competitors. For example, if we experience higher customer default rates than we currently experience, it could be more difficult or costly to attract future financing. Any inability to secure financing could lead us to cancel planned installations, impair our ability to accept new customers or increase our borrowing costs, any of which would have a material adverse effect on our business, financial condition and results of operations.
Our ability to provide our solar service offerings to homeowners on an economically viable basis depends in part on our ability to finance these solar energy systems with tax equity investors that depend on particular tax and other benefits.
Historically, there have been a limited number of investors that generate sufficient profits and possess the requisite financial sophistication to benefit from the tax benefits our tax equity vehicles provide, and a lack of depth in this market may limit our ability to complete such tax equity financing. Potential investors seeking tax-advantaged financing must remain satisfied the structures we offer qualify for the tax benefits associated with solar energy systems available to these investors, which depends both on the investors’ assessment of tax law and the absence of any unfavorable interpretations of that law. Changes in existing law and interpretations by the Internal Revenue Service (“IRS”) and the courts could reduce the willingness of tax equity investors to invest in tax equity vehicles associated with these solar energy system investments or cause these investors to require a larger allocation of customer payments. We are not certain this type of financing will continue to be
24
Table of Contents
available to us as the legal and regulatory landscape may shift in a manner that reduces or eliminates the attractiveness of such financing opportunities. For example, the federal government currently provides business investment tax credits under Section 48(a) (the “Section 48(a) ITC”) of the U.S. Internal Revenue Code of 1986, as amended (the “Code”), and a step down of Section 48(a) ITCs is scheduled to occur from 2020 to 2023. Additionally, we may be unable to identify investors interested in engaging in this type of financing with us. As of March 31, 2020, we have created seven tax equity vehicles to which investors such as banks and other large financial investors have committed to invest approximately $449.5 million. The undrawn committed capital for these tax equity vehicles as of March 31, 2020 is approximately $23.7 million. We plan to continue to form new tax equity vehicles as long as existing tax law and regulations make such financing attractive. See “—Risks Related to Regulations—Our business currently depends in part on the availability of rebates, tax credits and other financial incentives. The expiration, elimination or reduction of these rebates, credits or incentives or our ability to monetize them could adversely impact our business”.
The contractual terms in certain of our tax equity vehicle documents impose conditions on our ability to draw on financing commitments from the tax equity investors, including if an event occurs that could reasonably be expected to have a material adverse effect on the tax equity vehicle or on us. The terms and conditions of our tax equity vehicles can vary and may require us to alter our products, services or product mix. If we do not satisfy such conditions due to events related to our business or a specific tax equity vehicle or developments in our industry or otherwise, and as a result we are unable to draw on existing commitments, it could have a material adverse effect on our business, financial condition, results of operations and liquidity. In addition to our inability to draw on the investors’ commitments, we may incur financial penalties for non-performance, including delays in the installation process and interconnection to the power grid of solar energy systems and other factors. Based on the terms of the tax equity vehicle agreements, we will either reimburse a portion of the tax equity investor’s capital or pay the tax equity investor a non-performance fee.
Under the terms of certain of our tax equity vehicles, we may be required to make payments to the tax equity investors if certain tax benefits allocated to such tax equity investors are not realized as expected. Our financial condition may be adversely impacted if a tax equity vehicle is required to make any tax-related payments.
Our tax equity vehicles require that, prior to a date which is at least five years after the last project was placed in service, the tax equity investor receives substantially all the non-cash value attributable to the solar energy systems; however, we receive a majority of the cash distributions. In the event the tax equity investor has tax liability as a result of its investment and the cash distributions payable to the tax equity investor are not sufficient to pay such tax liability, the amount of distributions payable to us will be reduced. The amounts of potential tax liability (and the potential for a reduced distribution to us) depend on the tax benefits that accrue to such investors from the tax equity vehicles’ activities and may be impacted by changes in tax law.
Additionally, we may have payment obligations to our tax equity investors under indemnity obligations contained in those financings. See “—Risks Related to Taxation—If the IRS or the U.S. Treasury Department makes a determination that the fair market value of our solar energy systems is materially lower than what we have reported in our tax equity vehicles’ tax returns, we may have to pay significant amounts to our tax equity vehicles, our tax equity investors and/or the U.S. government. Such determinations could have a material adverse effect on our business and financial condition” and “—Risks Related to Taxation—If our solar energy systems either cease to be qualifying property or undergo certain changes in ownership within five years of the applicable placed in service date, we may have to pay significant amounts to our tax equity vehicles, our tax equity investors and/or the U.S. government. Such recapture could have a material adverse effect on our business and financial condition”.
25
Table of Contents
Due to uncertainties associated with estimating the timing and amounts of cash distributions and allocations of tax benefits to such investors, we cannot determine the potential impact on our cash flows under current or future arrangements. Any significant reductions in the cash we expect to receive from these structures could adversely affect our financial condition.
We enter into securitization structures, warehouse financings and other debt financings that may limit our ability to access the cash of our subsidiaries and include acceleration events that, if triggered, could adversely impact our financial condition.
Since April 2017, we have pooled and transferred eligible solar energy systems and the related asset receivables into six special purpose entities, which sold solar asset-backed notes and solar loan-backed notes to institutional investors, the net proceeds of which were distributed to us. We intend to monetize additional solar energy systems in the future through contributions to new special purposes entities for cash. There is a risk the institutional investors that have purchased the notes issued by these special purpose entities will be unwilling to make further investments in our solar energy systems at attractive prices. Although the creditors of these special purpose entities have no recourse to our other assets except as expressly set forth in the terms of the notes, the special purpose entities are typically required to maintain a liquidity reserve account, a reserve account for inverter replacements as well as, in certain cases, reserve accounts to finance purchase option/withdrawal right exercises, storage system replacement or payment of liquidated damages for the benefit of the lenders under the applicable series of notes, each of which are funded from initial deposits or cash flows to the levels specified therein.
The securitization structures, warehouse financings and other debt financings often include certain other features designed to protect investors. The primary feature relates to the availability and adequacy of cash flows in the pool of assets to meet contractual requirements, the insufficiency of which triggers an early repayment of the indebtedness. We refer to this as “early amortization” which may be based on, among other things, a debt service coverage ratio falling or remaining below certain levels. In the event of an early amortization, the notes issuer would be required to repay the affected indebtedness using available collections received from the asset pool. An early amortization event would impair our liquidity and may require us to utilize other available contingent liquidity or rely on alternative funding sources, which may not be available at the time. Certain of the securitizations, warehouse financings and other debt financings also contain a “cash trap” feature, which requires excess cash flow to be held in an account based on, among other things, a debt service coverage ratio falling or remaining below certain levels. If the cash trap conditions are not cured within a specified period, then the cash in the cash trap account must be applied to repay the indebtedness. If the cash trap conditions are timely cured, the cash is either released back to the borrower or used to repay the indebtedness at the borrower’s option. The indentures of our securitizations also typically contain customary events of default for solar securitizations that may entitle the noteholders to take various actions, including the acceleration of amounts due and foreclosure on the issuer’s assets. Any significant payments we may be required to make as a result of these arrangements could adversely affect our financial condition. See “Management’s Discussion and Analysis of Financial Condition and Results of Operations—Liquidity and Capital Resources—Financing Arrangements”.
Servicing our existing debt requires a significant amount of cash. We may not have sufficient cash flow from our business to timely pay our interest and principal obligations and may be forced to take other actions to satisfy our payment obligations.
As of March 31, 2020, our total indebtedness was approximately $1.6 billion and the available borrowing capacity under our credit facilities was approximately $43.6 million. Our ability to make scheduled payments of the principal of, to pay interest on or to refinance our indebtedness depends on our future performance, which is subject to economic, financial, competitive and other factors beyond
26
Table of Contents
our control. Our business may not generate cash flow from operations sufficient to service our debt and make necessary capital expenditures to operate our business. If we are unable to generate such cash flow, we may be required to adopt one or more alternatives, such as slowing or ceasing the origination of new solar service agreements, selling assets, restructuring debt or obtaining additional debt and equity capital on terms that may be onerous or highly dilutive. Our ability to timely repay or otherwise refinance our indebtedness will depend on the capital markets and our financial condition at such time. We may not be able to engage in any of these activities or engage in these activities on desirable terms, which could result in a default on our debt obligations.
Furthermore, we and our subsidiaries expect to incur additional debt in the future, subject to the restrictions contained in our debt instruments. Increases in our existing debt obligations would further heighten the debt related risk discussed above. In addition, we may not be able to enter into new debt instruments on acceptable terms or at all. If we were unable to satisfy financial covenants and other terms under existing or new instruments, or obtain waivers or forbearance from our lenders, or if we were unable to obtain refinancing or new financings for our working capital, equipment and other needs on acceptable terms if and when needed, our business would be adversely affected.
We are exposed to the credit risk of our customers.
Our customers purchase solar energy or lease solar energy systems from us pursuant to one of two types of long-term contracts: a PPA or a lease. The PPA and lease terms are typically for 25 years. In addition, under our loan agreements the customer finances the purchase of a solar energy system and we agree to operate and maintain the solar energy system throughout the 25-year term of the agreement. Our solar service agreements require the customer to make monthly payments to us throughout the term of the contract, unless prepaid. Because we have long-term, contractual relationships with our customers, we are subject to the credit risk of our customers and screen our customers based upon their credit rating in an attempt to mitigate the risk of customer default. As of March 31, 2020, the average FICO® score of our customers was 739 at the time of signing the solar service agreement. The accuracy of independent third-party information provided to the credit reporting agency cannot be verified. A FICO® score purports only to be a measurement of the relative degree of risk a borrower represents to a lender, i.e., a borrower with a higher score may be less likely to default in payment than a borrower with a lower score.
As of March 31, 2020, approximately 0.8% of our customers were in default under their solar service agreements. However, as we grow our business, the risk of customer defaults may increase as credit scores are dynamic and may deteriorate over a 25-year period. During an economic downturn, including as a result of the COVID-19 pandemic, the risk of customer defaults may increase. In addition, our customers may assign their solar service agreements to other customers who have lower credit scores or we may enter into new solar service agreements in the future with customers who have lower credit scores than our current customers. In addition, future developments, including competition from other renewables, could decrease the attractiveness of our current contracts. Although our solar service agreements grant us the ability to terminate the agreement with the customer and repossess the defaulting customers’ solar energy system in certain circumstances, enforcement of these rights under the solar service agreement may be difficult, expensive and time-consuming.
Restrictive covenants in certain of our debt agreements could limit our growth and our ability to finance our operations, fund our capital needs, respond to changing conditions and engage in other business activities that may be in our best interests.
Our debt agreements impose operating and financial restrictions on us. These restrictions limit our ability and that of our subsidiaries to, among other things:
| • | incur or guarantee additional indebtedness or issue certain types of equity securities; |
27
Table of Contents
| • | make investments or loans; |
| • | create liens; |
| • | consummate mergers and similar fundamental changes; |
| • | declare or pay dividends or distributions on, repurchase or redeem our equity interests or make other restricted payments; |
| • | make investments in unrestricted subsidiaries; |
| • | enter into transactions with affiliates; and |
| • | sell, transfer or otherwise convey certain assets or use the proceeds of asset sales. |
We may be prevented from taking advantage of business opportunities that arise because of the limitations imposed on us by the restrictive covenants under certain of our debt agreements. The restrictions contained in the covenants could:
| • | limit our ability to plan for or react to market conditions, to meet capital needs or otherwise to restrict our activities or business plan; and |
| • | adversely affect our ability to finance our operations, enter into acquisitions or divestitures to engage in other business activities that would be in our interest. |
A breach of any of these covenants or our inability to comply with the required financial ratios or financial condition tests could result in a default under our debt agreements that, if not cured or waived, could result in acceleration of all indebtedness outstanding thereunder and cross-default rights under our other debt. In addition, in the event of an event of default under one of the credit facilities, the affected lenders could foreclose on the collateral securing such credit facility and require repayment of all borrowings outstanding thereunder. If the amounts outstanding under the credit facilities or any of our other indebtedness were to be accelerated, our assets may not be sufficient to repay in full the amounts owed to the lenders or to our other debt holders.
Rising interest rates may adversely impact our business.
Rising interest rates will increase our cost of capital. Our future success depends on our ability to raise capital from investors and obtain secured lending to help finance the deployment of our solar service agreements. As a result, rising interest rates may have an adverse impact on our ability to offer attractive pricing on our solar service agreements to our customers.
The majority of our cash flows to date have been from solar service agreements monetized under various tax equity fund structures and secured lending arrangements. One of the components of this monetization is the present value of the payment streams from customers who enter into these long-term solar service agreements. If the rate of return required by capital providers, including debt providers, rises as a result of a rise in interest rates, it will reduce the present value of the customer payment stream and consequently reduce the total value derived from this type of monetization. Any measures we could take to mitigate the impact of rising interest rates on our ability to secure third-party financing could ultimately have an adverse impact on the value proposition we offer our customers or our profitability.
The phase-out of the London Interbank Offered Rate (“LIBOR”) may adversely affect a portion of our outstanding debt.
LIBOR is scheduled to be phased out by the end of 2021. It is unclear whether new methods of determining LIBOR will be established such that it continues to exist after 2021, or if alternative floating borrowing rates will be adopted. Changes in the method of determining LIBOR, or the replacement of
28
Table of Contents
LIBOR with an alternative floating borrowing rate, may adversely affect our borrowing costs. Certain of our debt instruments have interest rates that are LIBOR based and will not have matured prior to the phase-out of LIBOR. We cannot predict the effect of the potential changes to LIBOR or the establishment and use of alternative floating borrowing rates on the portion of our outstanding debt that is LIBOR based. Challenges in changing to a different borrowing rate may result in less favorable pricing on certain of our debt instruments and could have an adverse effect on our financial results and cash flows.
Our business has benefited from the declining cost of solar energy system components and our business may be harmed to the extent the cost of such components stabilize or increase in the future.
Our business has benefited from the declining cost of solar energy system components and to the extent such costs stabilize, decline at a slower rate or increase, our future growth rate may be negatively impacted. The declining cost of solar energy system components and the raw materials necessary to manufacture them has been a key driver in the price of solar energy systems we own, the prices charged for electricity and customer adoption of solar energy. Solar energy system component and raw material prices may not continue to decline at the same rate as they have over the past several years or at all. In addition, growth in the solar industry and the resulting increase in demand for solar energy system components and the raw materials necessary to manufacture them may also put upward pressure on prices. An increase of solar energy system components and raw materials prices could slow our growth and cause our business and results of operations to suffer. Further, the cost of solar energy system components and raw materials has increased and could increase in the future due to tariff penalties, duties, the loss of or changes in economic governmental incentives or other factors. See “—Increases in the cost of our solar energy systems due to tariffs imposed by the U.S. government could have a material adverse effect on our business, financial condition and results of operations”.
We do not directly control certain costs related to our business, which could put us at a disadvantage relative to companies who have a vertically integrated business model.
We do not have direct control over the costs our suppliers charge for the components of our solar energy systems and energy storage systems or the costs to our dealers of installing and marketing such products. This may lead us to charge higher prices for our solar energy systems and energy storage systems than our competitors with a vertically integrated business model, causing us to be unable to maintain or increase market share.
We may be unsuccessful in introducing new service and product offerings, including our distributed energy storage services and energy storage management systems.
We intend to introduce new offerings of services and products to both new and existing customers in the future, including battery-based distributed energy storage services and energy storage management systems, home automation products and additional home technology solutions. We may be unsuccessful in significantly broadening our customer base through the addition of these services and products within our current markets or in new markets we may enter. Additionally, we may not be successful in generating substantial revenue from any additional services and products we may introduce in the future and may decline to initiate new product and service offerings.
We face competition from centralized electric utilities, retail electric providers, independent power producers and renewable energy companies.
The solar energy and renewable energy industries are both highly competitive and continually evolving as participants strive to distinguish themselves within their markets and compete with large
29
Table of Contents
centralized electric utilities. We believe our primary competitors are the centralized electric utilities that supply electricity to our potential customers. We compete with these centralized electric utilities primarily based on price (cents per kilowatt hour (“kWh”)), predictability of future prices (by providing pre-determined annual price escalations) and the ease by which customers can switch to electricity generated by our solar energy systems. If we cannot offer compelling value to our customers based on these factors, our business may not grow.
Centralized electric utilities generally have substantially greater financial, technical, operational and other resources than we do. As a result, these competitors may be able to devote more resources to the research, development, promotion and sale of their products or services or respond more quickly to evolving industry standards and changes in market conditions than we can. Centralized electric utilities could also offer other value-added products or services that could help them to compete with us even if the cost of electricity they offer is higher than ours. In addition, a majority of utilities’ sources of electricity is non-solar, which may allow utilities to sell electricity more cheaply than electricity generated by our solar energy systems. Centralized electric utilities could also offer customers the option of purchasing electricity obtained from renewable energy resources, including solar, which would compete with our offerings.
We also compete with retail electric providers and independent power producers not regulated like centralized electric utilities but which have access to the centralized utilities’ electricity transmission and distribution infrastructure pursuant to state, territorial and local pro-competition and consumer choice policies. These retail electric providers and independent power producers are able to offer customers electricity supply-only solutions that are competitive with our solar energy system options on both price and usage of renewable energy technology while avoiding the long-term agreements and physical installations our current business model requires. This may limit our ability to acquire new customers, particularly those who wish to avoid long-term agreements or have an aesthetic or other objection to putting solar panels on their roofs.
We also compete with solar companies with vertically integrated business models, including sales, financing, engineering, manufacturing, installation, maintenance and monitoring services. If the integrated approach of our competitors is successful, it may limit our ability to originate solar energy systems. Many of our vertically integrated competitors are larger than we are. As a result, these competitors may be able to devote more resources to the research, development, promotion and sale of their products or services or respond more quickly to evolving industry standards and changes in market conditions than we can. Solar companies with vertically integrated business models could also offer other value-added products or services that could help them to compete with us.
In addition, we compete with other solar companies who sell or finance products directly to consumers, inclusive of programs like Property-Assessed Clean Energy financing programs established by local governments. For example, we face competition from solar installation businesses that seek financing from external parties or utilize competitive loan products or state and local programs.
We also compete with solar companies with business models similar to our own, some of which are marketed to potential customers by our dealers. Some of these competitors specialize in the distributed residential solar energy market and some may provide energy at lower costs than we do. Some of our competitors offer or may offer similar services and products as we do, such as leases, PPAs and direct outright sales of and consumer loan products for solar energy systems. Many of our competitors also have significant brand name recognition and have extensive knowledge of our target markets.
We also compete with solar companies that offer community solar products and utility companies that provide renewable power purchase programs. Some customers might choose to subscribe to a
30
Table of Contents
community solar project or renewable subscriber programs instead of installing a solar energy system on their home, which could affect our sales. Additionally, some utility companies (and some utility-like entities, such as community choice aggregators in California) have generation portfolios that are increasingly renewable in nature. In California, for example, due to recent legislation, utility companies and community choice aggregators in that state are required to have generation portfolios comprised of 60% renewable energy by 2030 and state regulators are planning for utility companies and community choice aggregators to sell 100% greenhouse gas free electricity to retail customers by 2045. As utility companies offer increasingly renewable portfolios to retail customers, those customers might be less inclined to install a solar energy system at their home, which could adversely affect our growth.
We have historically provided our services only to residential customers and do not currently intend to expand to commercial, industrial or governmental customers. We compete with companies who sell solar energy systems and services in the commercial, industrial and government markets, in addition to the residential market, in the U.S. and foreign markets. There is intense competition in the residential solar energy sector in the markets in which we operate. As new entrants continue to enter into these markets, we may be unable to grow or maintain our operations and we may be unable to compete with companies that earn revenue in both the residential market and non-residential markets. Further, because we provide our services exclusively to residential customers, we have a less diverse market presence and are more exposed to potential adverse changes in the residential market than our competitors that sell solar energy systems and services in the commercial, industrial, government and utility markets.
As the solar industry grows and evolves, we will also face new competitors and technologies who are not currently in the market. Our industry is characterized by low technological barriers to entry and well-capitalized companies, including utilities and integrated energy companies, could choose to enter the market and compete with us. Our failure to adapt to changing market conditions and to compete successfully with existing or new competitors will limit our growth and will have a material adverse effect on our business, financial condition and results of operations.
Developments in technology or improvements in distributed solar energy generation and related technologies or components may materially adversely affect demand for our offerings.
Significant developments in technology, such as advances in distributed solar power generation, energy storage solutions such as batteries, energy storage management systems, the widespread use or adoption of fuel cells for residential or commercial properties or improvements in other forms of distributed or centralized power production may materially and adversely affect demand for our offerings and otherwise affect our business. Future technological advancements may result in reduced prices to consumers or more efficient solar energy systems than those available today, either of which may result in current customer dissatisfaction. We may not be able to adopt these new technologies as quickly as our competitors or on a cost-effective basis.
Due to the length of our solar service agreements, the solar energy system deployed on a customer’s residence may be outdated prior to the expiration of the term of the related solar service agreement, reducing the likelihood of renewal of our solar service agreement at the end of the applicable term and possibly increasing the occurrence of customers seeking to terminate or cancel their solar service agreements or defaults. If current customers become dissatisfied with the price they pay for their solar energy system under our solar service agreements relative to prices that may be available in the future or if customers become dissatisfied by the output generated by their solar energy systems relative to future solar energy system production capabilities, or both, this may lead to customers seeking to terminate or cancel their solar service agreements or higher rates of customer default and have an adverse effect on our business, financial condition and results of operations. Additionally, recent technological advancements may impact our business in ways we do not currently
31
Table of Contents
anticipate. Any failure by us to adopt or have access to new or enhanced technologies or processes, or to react to changes in existing technologies, could result in product obsolescence or the loss of competitiveness of and decreased consumer interest in our solar energy services, which could have a material adverse effect on our business, financial condition and results of operations.
The value of our solar energy systems at the end of the associated term of the lease or PPA may be lower than projected, which may adversely affect our financial performance and valuation.
We depreciate the costs of our solar energy systems over their estimated useful life of 35 years. At the end of the initial term (typically 25 years) of the lease or PPA, customers may choose to purchase their solar energy systems, ask us to remove the solar energy system at our cost or renew their lease or PPA. Homeowners may choose to not renew or purchase for any reason, such as pricing, decreased energy consumption, relocation of residence, switching to a competitor product or technological obsolescence of the solar energy system. We are also contractually obligated to remove, store and reinstall the solar energy systems, typically for a nominal fee, if customers need to replace or repair their roofs. Furthermore, it is difficult to predict how future environmental regulations may affect the costs associated with the removal, disposal or recycling of our solar energy systems. If the residual value of the solar energy systems is less than we expect at the end of the customer contract, after giving effect to any associated removal and redeployment costs, we may be required to accelerate the recognition of all or some of the remaining unamortized costs. This could materially impair our future results of operations.
We and our dealers depend on a limited number of suppliers of solar energy system components and technologies to adequately meet demand for our solar energy systems. Due to the limited number of suppliers in our industry, the acquisition of any of these suppliers by a competitor or any shortage, delay, price change, imposition of tariffs or duties or other limitation in our or our dealers’ ability to obtain components or technologies we use could result in sales and installation delays, cancelations and loss of customers.
We rely on our dealers to install solar energy systems and energy storage systems, each of whom has direct supplier arrangements. Our dealers purchase solar panels, inverters, energy storage systems and other system components and instruments from a limited number of suppliers, approved by us, making us susceptible to quality issues, shortages and price changes. For the three months ended March 31, 2020, Hanwha Q-Cells and LONGi Solar Technology (U.S.), Inc (“Longi”) supplied approximately 54% and 15%, respectively, of our solar photovoltaic panels installed and no other supplier represented more than 10% of our solar photovoltaic panels installed. For the year ended December 31, 2019, Hanwha Q-Cells and Yingli Green Energy supplied approximately 50% and 17%, respectively, of our solar photovoltaic panels installed and no other supplier represented more than 10% of our solar photovoltaic panels installed. Yingli Green Energy is currently undergoing a restructuring of its debt. There is no guarantee Yingli Green Energy will honor its existing warranty coverage or will continue to supply us with solar photovoltaic panels in the future following the completion of this restructuring. For the three months ended March 31, 2020, Enphase Energy, Inc. and SolarEdge Technologies Inc. accounted for approximately 69% and 31%, respectively, of the inverters used in our solar energy system installations and no other supplier represented more than 10% of our inverters used in our solar energy systems installations. For the year ended December 31, 2019, Enphase Energy, Inc. and SolarEdge Technologies Inc. accounted for approximately 58% and 42%, respectively, of the inverters used in our solar energy system installations. For the three months ended March 31, 2020 and the year ended December 31, 2019, Tesla, Inc. accounted for 100% of our energy storage system purchases and no other supplier represented more than 10% of energy storage systems installed. If one or more of the suppliers we and our dealers rely upon to meet anticipated demand ceases or reduces production due to its financial condition, acquisition by a competitor or otherwise, is unable to increase production as industry demand increases or is otherwise unable to allocate sufficient production to us and our dealers, it may be difficult to quickly identify alternative suppliers or to qualify alternative products on commercially
32
Table of Contents
reasonable terms and our ability and the ability of our dealers to satisfy this demand may be adversely affected. There are a limited number of suppliers of solar energy system components, instruments and technologies. While we believe there are other sources of supply for these products available, a dealer’s need to transition to a new supplier may result in additional costs and delays in originating solar service agreements and deploying our related solar energy systems or energy storage systems, which in turn may result in additional costs and delays in our acquisition of such solar service agreements and related solar energy systems and energy storage systems. These issues could have a material adverse effect on our business, financial condition and results of operations.
There have also been periods of industry-wide shortages of key components and instruments, including batteries and inverters, in times of rapid industry growth. The manufacturing infrastructure for some of these components has a long lead-time, requires significant capital investment and relies on the continued availability of key commodity materials, potentially resulting in an inability to meet demand for these components. The solar industry is currently experiencing rapid growth and, as a result, shortages of key components or instruments, including solar panels, may be more likely to occur, which in turn may result in price increases for such components. Even if industry-wide shortages do not occur, suppliers may decide to allocate key components or instruments with high demand or insufficient production capacity to more profitable customers, customers with long-term supply agreements or customers other than us, our dealers or other third parties from whom we may originate solar energy systems and our ability to originate solar service agreements and related solar energy systems and energy storage systems may be reduced as a result.
During January 2020, COVID-19 surfaced in Wuhan, China. In an effort to halt the outbreak, the Chinese government has placed significant restrictions on travel within China and closed certain businesses, including solar manufacturers, in numerous provinces, and governments and other parties outside of China have halted or sharply curtailed the movement of people, goods and services to and from China. The substantial majority of our inverters, as well as other goods used in our business, are sourced from China. If the impacts of the COVID-19 outbreak, including the accompanying travel restrictions and business closures, continue for an extended period of time or worsen, the supply and pricing of our inverters and other goods and therefore the ability of our dealers to install new solar energy systems could be adversely affected. The extent of the impact of COVID-19 on our business and operations will depend on, among other factors, the ultimate geographic spread of the virus, the duration and severity of the outbreak, travel restrictions and business closures imposed in China or other countries, the ability of our suppliers to increase their production of goods in jurisdictions other than China, our ability to contract for supply from other sources on acceptable terms and the willingness of our lenders to permit us to switch suppliers.
Increases in the cost of our solar energy systems due to tariffs imposed by the U.S. government could have a material adverse effect on our business, financial condition and results of operations.
China is a major producer of solar cells and other solar products. Certain solar cells, modules, laminates and panels from China are subject to various U.S. antidumping and countervailing duty rates, depending on the exporter supplying the product, imposed by the U.S. government as a result of determinations that the U.S. was materially injured as a result of such imports being sold at less than fair value and subsidized by the Chinese government. While historically our dealers have purchased a number of these products from manufacturers in China, currently such purchases are immaterial and sourced from manufacturers in other jurisdictions. If these alternative sources are no longer available on competitive terms in the future, we and our dealers may seek to purchase these products from manufacturers in China. In addition, tariffs on solar cells, modules and inverters in China may put upwards pressure on prices of these products in other jurisdictions from which our dealers currently purchase equipment, which could reduce our ability to offer competitive pricing to potential customers.
33
Table of Contents
The antidumping and countervailing duties discussed above are subject to annual review and may be increased or decreased. Furthermore, under Section 301 of the Trade Act of 1974, the Office of the United States Trade Representative (the “USTR”) imposed tariffs on $200 billion worth of imports from China, including inverters and certain alternating current modules and non-lithium-ion batteries, effective September 24, 2018. In May 2019, the tariffs were increased from 10% to 25% and may be raised by the USTR in the future. Since these tariffs impact the purchase price of the solar products, these tariffs raise the cost associated with purchasing these solar products from China and reduce the competitive pressure on providers of solar cells not subject to these tariffs.
In addition, on January 22, 2018, the President of the U.S. announced, effective February 7, 2018, the imposition of a global 30% ad valorem tariff, with certain qualifications and exceptions, on certain imported solar cells and modules, which steps down by five percentage points each year over the next three years and then phases out in 2022. Since such actions increase the cost of imported solar products, to the extent we or our dealers use imported solar products or domestic producers are able to raise their prices for their solar products, the overall cost of the solar energy systems will increase, which could reduce our ability to offer competitive pricing in certain markets.
We cannot predict what additional actions the U.S. may adopt with respect to tariffs or other trade regulations or what actions may be taken by other countries in retaliation for such measures. If additional measures are imposed or other negotiated outcomes occur, our ability or the ability of our dealers to purchase these products on competitive terms or to access specialized technologies from other countries could be further limited, which could adversely affect our business, financial condition and results of operations.
Warranties provided by the manufacturers of equipment for our assets and maintenance obligations of our dealers may be limited by the ability of a supplier and/or dealer to satisfy its warranty or performance obligations or by the expiration of applicable time or liability limits, which could reduce or void the warranty protections or may be limited in scope or magnitude of liabilities and thus, the warranties and maintenance obligations may be inadequate to protect us.
We agree to maintain the solar energy systems and energy storage systems installed on our customers’ homes during the length of the term of our solar service agreements, which is typically 25 years. We are exposed to any liabilities arising from the solar energy systems’ failure to operate properly and are generally under an obligation to ensure each solar energy system remains in good condition during the term of the agreement. We are the beneficiary of the panel manufacturers’ warranty coverage, typically of 10 years for material and workmanship and 25 years for performance, the inverter manufacturers’ warranty coverage, typically from 10 to 25 years and the energy storage manufacturers’ warranty coverage, typically of 10 years. Furthermore, our dealers provide warranties as to their workmanship. In the event that such warranty providers or dealers file for bankruptcy, cease operations or otherwise become unable or unwilling to fulfill their warranty or maintenance obligations, we may not be adequately protected by such warranties or maintenance obligations. Even if such warranty or maintenance providers or dealers fulfill their obligations, the warranty or maintenance obligations may not be sufficient to protect us against all of our losses. In addition, our warranties are of limited duration, ranging from one year, in the case of certain solar energy system and transformer warranties, to 25 years, in the case of certain panel performance warranties, after the date each equipment item is delivered or commissioned, although the useful life of our solar energy systems is 35 years. These warranties are subject to liability and other limits. If we seek warranty protection and a warranty provider is unable or unwilling to perform its warranty obligations, or if a dealer is unable or unwilling to perform its maintenance obligations, whether as a result of its financial condition or otherwise, or if the term of the warranty or maintenance obligation has expired or a liability limit has been reached, there may be a reduction or loss of protection for the affected assets, which could have a material adverse effect on our business, financial condition and results of operations.
34
Table of Contents
Our failure to accurately predict future liabilities related to material quality or performance expenses could result in unexpected volatility in our financial condition. Because of the long estimated useful life of our solar energy systems, we have been required to make assumptions and apply judgments regarding a number of factors, including our anticipated rate of warranty claims and the durability, performance and reliability of our solar energy systems. We made these assumptions based on the historic performance of similar solar energy systems or on accelerated life cycle testing. Our assumptions could prove to be materially different from the actual performance of our solar energy systems, causing us to incur substantial expense to repair or replace defective solar energy systems in the future or to compensate customers for solar energy systems that do not meet their performance guarantees. Equipment defects, serial defects or operational deficiencies also would reduce our revenue from solar service agreements because the customer payments under such agreements are dependent on solar energy system production or would require us to make refunds under performance guarantees. Any widespread product failures or operating deficiencies may damage our market reputation and adversely impact our financial results. For further discussion of these potential charges and related proposals, see “Management’s Discussion and Analysis of Financial Condition and Results of Operations—Components of Results of Operations.”
Our operating results and our ability to grow may fluctuate from quarter to quarter and year to year, which could make our future performance difficult to predict and could cause our operating results for a particular period to fall below expectations.
Our quarterly and annual operating results and our ability to grow are difficult to predict and may fluctuate significantly in the future. We have experienced seasonal and quarterly fluctuations in the past and expect to experience such fluctuations in the future. In addition to the other risks described in this “Risk Factors” section, the following factors could cause our operating results to fluctuate:
| • | expiration or initiation of any governmental rebates or incentives; |
| • | significant fluctuations in customer demand for our solar energy services, solar energy systems and energy storage systems; |
| • | our dealers’ ability to complete installations in a timely manner; |
| • | our and our dealers’ ability to gain interconnection permission for an installed solar energy system from the relevant utility; |
| • | the availability and costs of suitable financing; |
| • | the amount, timing of sales and potential decreases in value of SRECs; |
| • | our ability to continue to expand our operations and the amount and timing of expenditures related to this expansion; |
| • | announcements by us or our competitors of significant acquisitions, strategic partnerships, joint ventures or capital-raising activities or commitments; |
| • | changes in our pricing policies or terms or those of our competitors, including centralized electric utilities; |
| • | actual or anticipated developments in our competitors’ businesses, technology or the competitive landscape; and |
| • | natural disasters or other weather or meteorological conditions. |
For these or other reasons, the results of any prior quarterly or annual periods should not be relied upon as indications of our future performance.
35
Table of Contents
If we are unable to make acquisitions on economically acceptable terms, our future growth would be limited, and any acquisitions we may make may reduce, rather than increase, our cash flows.
We may make acquisitions of solar energy systems, energy storage systems and related businesses and joint ventures. The consummation and timing of any future acquisitions will depend upon, among other things, whether we are able to:
| • | identify attractive acquisition candidates; |
| • | negotiate acceptable purchase agreements; |
| • | obtain any required governmental or third party consents; |
| • | obtain financing for these acquisitions on economically acceptable terms, which may be more difficult at times when the capital markets are less accessible; and |
| • | outbid any competing bidders. |
Additionally, any acquisition involves potential risks, including, among other things:
| • | mistaken assumptions about assets, revenues and costs of the acquired company, including synergies and potential growth; |
| • | an inability to secure adequate customer commitments to use the acquired systems or facilities; |
| • | an inability to successfully integrate the assets or businesses we acquire; |
| • | coordinating geographically disparate organizations, systems and facilities; |
| • | the assumption of unknown liabilities for which we are not indemnified or for which our indemnity is inadequate; |
| • | mistaken assumptions about the acquired company’s suppliers or dealers or other vendors; |
| • | the diversion of management’s and employees’ attention from other business concerns; |
| • | unforeseen difficulties operating in new geographic areas and business lines; |
| • | customer or key employee losses at the acquired business; and |
| • | poor quality assets or installation. |
If we consummate any future acquisitions, our capitalization, results of operations and future growth may change significantly and our stockholders will not have the opportunity to evaluate the economic, financial and other relevant information that we will consider in deciding to engage in these future acquisitions, which may not improve our results of operations or cash flow to the extent we projected.
The solar energy systems we own or may originate have a limited operating history and may not perform as we expect.
Many of the solar energy systems we currently own or may originate in the future have not commenced operations, have recently commenced operations or otherwise have a limited operating history. Of the solar energy systems we owned as of March 31, 2020, 21%, 17% and 15% were placed into service in 2019, 2018 and 2017, respectively. The ability of our solar energy systems to perform as we expect will also be subject to risks inherent in newly constructed renewable energy assets, including breakdowns and outages, latent defects, equipment that performs below our expectations, system failures and outages. As a result, our assumptions and estimates regarding the performance of these solar energy systems are, and will be, made without the benefit of a meaningful operating history, which may impair our ability to accurately assess the potential profitability of the solar energy systems and, in turn, our results of operations, financial condition and cash flows.
36
Table of Contents
The cost of maintenance or repair of solar energy systems or energy storage systems throughout the term of the associated solar service agreement or the removal of solar energy systems at the end of the term of the associated solar service agreement may be higher than projected today and adversely affect our financial performance and valuation.
If we incur repair and maintenance costs on our solar energy systems or energy storage systems after the individual component warranties have expired and if they then fail or malfunction, we will be liable for the expense of repairing these solar energy systems or energy storage systems without a chance of recovery from our suppliers. In addition, we typically bear the cost of removing the solar energy systems at the end of the term of the lease or PPA if the customer does not renew his or her agreement or elect to purchase the solar energy system at the end of its term. Furthermore, it is difficult to predict how future environmental regulations may affect the costs associated with the repair, removal, disposal or recycling of our solar energy systems. This could materially impair our future operating results.
Problems with performance of our solar energy systems may cause us to incur expenses, may lower the value of our solar energy systems and may damage our market reputation and adversely affect our business.
Our long-term leases and loan agreements contain a performance guarantee in favor of the customer. Solar service agreements with performance guarantees require us to provide a bill credit (or in limited cases, refund money) to the customer if the solar energy system fails to generate the minimum amount of electricity, as specified in the solar service agreement, in a given term, beginning with the first three year period after execution of the solar service agreement and annually thereafter. We may also suffer financial losses associated with such credit and refunds if significant performance guarantee payments are triggered. For a description of our performance guarantee obligations, see “Management’s Discussion and Analysis of Financial Condition and Results of Operations— Components of Results of Operations—Revenue”.
We and our dealers are subject to risks associated with installation and other contingencies.
Our dealers design and install solar energy systems and energy storage systems on our behalf. Because the solar service agreement is entered into between us and the customer, we may be liable to our customers for any damage our dealers cause to our customers’ homes, belongings or property during the installation of our solar energy systems and energy storage systems or otherwise.
For example, dealers may penetrate our customers’ roofs during the installation process and we may incur liability for the failure to adequately weatherproof such penetrations following the completion of installation of solar energy systems. In addition, because our solar energy systems and energy storage systems are high-voltage energy systems, we may incur liability for a dealer’s failure to comply with electrical standards and manufacturer recommendations. Furthermore, prior to obtaining permission to operate our solar energy systems and energy storage systems, the solar energy systems and energy storage systems must pass various inspections. Any delay in passing, or inability to pass, such inspections, would adversely affect our results of operations. Because our profit on a particular solar service agreement and related solar energy system and energy storage system, if applicable, is based in part on assumptions as to the ongoing cost of the related solar energy system and energy storage system, if applicable, cost overruns, delays or other execution issues may cause us to not achieve our expected results or cover our costs for that solar service agreement and related solar energy system and energy storage systems, if applicable.
37
Table of Contents
Product liability claims against us or accidents could result in adverse publicity and potentially significant monetary damages.
It is possible our solar energy systems or energy storage systems could injure our customers or other third parties or our solar energy systems or energy storage systems could cause property damage as a result of product malfunctions, defects, improper installation, fire or other causes. Any product liability claim we face could be expensive to defend and may divert management’s attention. The successful assertion of product liability claims against us could result in potentially significant monetary damages, potential increases in insurance expenses, penalties or fines, subject us to adverse publicity, damage our reputation and competitive position and adversely affect sales of solar energy systems or energy storage systems. In addition, product liability claims, injuries, defects or other problems experienced by other companies in the residential solar industry could lead to unfavorable market conditions to the industry as a whole and may have an adverse effect on our ability to expand our portfolio of solar service agreements and related solar energy systems and energy storage systems, thus affecting our business, financial condition and results of operations.
Inflation could result in decreased value from future contractual payments and higher expenses for labor and equipment, which, in turn, could adversely impact our reputation, business, financial condition, cash flows and results of operations.
Any future increase in inflation may adversely affect our costs, including our dealers’ cost of labor and equipment, and may result in a decrease in value in our future contractual payments. Many of our solar service agreements, which generally have a term of 25 years, do not contain any pricing escalators. The pricing escalators we do have may not keep pace with inflation, which would result in the agreement yielding decreased value over time. These factors could adversely impact our reputation, business, financial condition, cash flows and results of operations.
We are not able to insure against all potential risks and we may become subject to higher insurance premiums.
We are exposed to numerous risks inherent in the operation of solar energy systems and energy storage systems, including equipment failure, manufacturing defects, natural disasters such as hurricanes, fires and earthquakes, terrorist attacks, sabotage, vandalism and environmental risks. Furthermore, components of our solar energy systems and energy storage systems, such as panels, inverters and batteries, could be damaged by severe weather, such as tsunamis, hurricanes, tornadoes, hailstorms or lightning. If our solar energy systems or energy storage systems are damaged in the event of a natural disaster beyond our control, losses could be outside the scope of insurance policies or exceed insurance policy limits and we could incur unforeseen costs that could harm our business and financial condition. We may also incur significant additional costs in taking actions in preparation for, or in reaction to, such events.
Our insurance policies also cover legal and contractual liabilities arising out of bodily injury, personal injury or property damage to third parties and are subject to policy limits. We also maintain coverage for physical damage to our solar energy assets.
However, such policies do not cover all potential losses and coverage is not always available in the insurance market on commercially reasonable terms. In addition, we may have disagreements with our insurers on the amount of our recoverable damages and the insurance proceeds received for any loss of, or any damage to, any of our assets may be claimed by lenders under our financing arrangements or otherwise may not be sufficient to restore the loss or damage without a negative impact on our results of operations. Furthermore, the receipt of insurance proceeds may be delayed, requiring us to use cash or incur financing costs in the interim. To the extent we experience covered
38
Table of Contents
losses under our insurance policies, the limit of our coverage for potential losses may be decreased or the insurance rates we have to pay increased. Furthermore, the losses insured through commercial insurance are subject to the credit risk of those insurance companies. While we believe our commercial insurance providers are currently creditworthy, we cannot assure you such insurance companies will remain so in the future.
We may not be able to maintain or obtain insurance of the type and amount we desire at reasonable rates. The insurance coverage we do obtain may contain large deductibles or fail to cover certain risks or all potential losses. In addition, our insurance policies are subject to annual review by our insurers and may not be renewed on similar or favorable terms, including coverage, deductibles or premiums, or at all. If a significant accident or event occurs for which we are not fully insured or we suffer losses due to one or more of our insurance carriers defaulting on their obligations or contesting their coverage obligations, it could have a material adverse effect on our business, financial condition and results of operations.
We typically bear the risk of loss and the cost of maintenance, repair and removal on solar energy systems that are owned by our subsidiaries and included in securitization and tax equity vehicles.
We typically bear the risk of loss and are generally obligated to cover the cost of maintenance, repair and removal for any solar energy system we sell to subsidiaries and include in securitization and tax equity vehicles. At the time we enter into a tax equity or securitization transaction, we enter into a maintenance services agreement where we agree to operate and maintain the solar energy system for a fixed fee calculated to cover our future expected maintenance costs. If our solar energy systems require an above-average amount of repairs or if the cost of repairing the solar energy systems were higher than our estimate, we would need to perform such repairs without additional compensation. If our solar energy systems are damaged as the result of a natural disaster beyond our control, losses could exceed or be excluded from our insurance policy limits and we could incur unforeseen costs that could harm our business and financial condition. We may also incur significant costs for taking other actions in preparation for, or in reaction to, such events. We purchase property insurance with industry standard coverage and limits approved by an investor’s third-party insurance advisors to hedge against such risk, but such coverage may not cover our losses.
Certain of our solar energy systems are located in, and we conduct business in, Puerto Rico and weakness in the fiscal health of the government and PREPA, the damage caused by Hurricane Maria, a series of earthquakes which affected the island in December 2019 and early 2020 and potential tax increases that may increase our cost of conducting business in Puerto Rico, create uncertainty that may adversely impact us. In addition, we are subject to administrative proceedings instituted by the Puerto Rico Energy Bureau.
Puerto Rico is a significant market for our business, representing 13% and 14% of our solar energy systems as of March 31, 2020 and 2019, respectively, and 12% and 14% of our solar energy systems as of December 31, 2019 and 2018, respectively, and has suffered from economic difficulties in recent years. As a result of the continued weakness of the Puerto Rico economy, liquidity constraints and a lack of market access, the credit ratings of the Puerto Rico government’s general obligation bonds and guaranteed bonds, as well as the ratings of most of the Puerto Rico public corporations, including the Puerto Rico Electric Power Authority (“PREPA”), have been lowered to non-investment grade by Moody’s, S&P and Fitch Ratings.
Puerto Rico has also enacted certain measures that could increase the cost of solar energy systems. In 2015, the Puerto Rico government increased the sales and use tax on repair and maintenance services on tangible personal property that are not capital expenditures, such as the repair and maintenance of solar energy systems, from 7% to 11.5%. As of October 1, 2015, most
39
Table of Contents
services became subject to a 4% or 11.5% sales and use tax, as applicable, except for limited exceptions such as certain leases of solar energy generating equipment which became exempt during 2019. Although leases are currently exempt from such sales and use tax, should that exemption expire or additional taxes be imposed, the tax increase may impose greater costs on our future and current customers, which may hinder our future origination efforts and adversely impact our business, financial condition, results of operations and future growth. Future changes in Puerto Rico tax law could affect our tax position and adversely impact our business.
In September 2017, Hurricanes Irma and Maria made landfall in Puerto Rico, causing catastrophic damage to Puerto Rico’s infrastructure, homes and businesses, including its communication systems and transportation networks, and disrupting the markets in which we operate. Following Hurricane Maria, all of Puerto Rico was left without electrical power and other basic utility and infrastructure services (such as water, communications, ports and other transportation networks) were severely curtailed. Many of our solar energy systems located in Puerto Rico were damaged in the hurricanes. Further, Puerto Rico’s electrical grid, which is necessary to operate solar energy systems that were not paired with energy storage systems, was damaged. There was intermittent or reduced electrical grid operation during the fourth quarter of 2017 and the first quarter of 2018. During this period, many of our solar energy systems produced reduced levels or no power and therefore generated reduced or no revenue and cash receipts, even where solar energy systems remained functional. Although power has been restored, many residents left Puerto Rico following the storm. In many cases, Puerto Rico residents who abandoned their properties suspended payments to us under their solar service agreements.
In December 2019 and early 2020, a series of earthquakes affected the southern and southwest parts of the island, causing widespread outages and damage, including to the Costa Sur power facility, which provides close to 25% of the electricity distributed in Puerto Rico and could remain offline for up to a year. PREPA has informed customers that with the absence of the Costa Sur power facility, it may not have enough reserve capacity to supply demand, which may lead to blackouts and brownouts during that period. Solar energy systems installed in areas affected by the earthquakes that are not paired with an energy storage system are likely to generate lower levels of power or no power at all. In addition, structures with installed solar energy systems that were damaged by the earthquakes may be demolished or abandoned if such structures are not repairable. Moreover, Puerto Rico could also experience additional emigration of people, many of whom might cease payments under their solar service agreements. We cannot predict whether or not these events will have a material adverse impact on our operations at this time.
Although Puerto Rico had already suffered from economic difficulties in recent years, the hurricanes, the earthquakes and the COVID-19 pandemic have caused significant additional disruption to the island’s economic activity. The continued weakness of the Puerto Rico economy has strained the fiscal health of the government, creating significant uncertainty that could adversely impact us. Moreover, the future financial condition and prospects of PREPA are uncertain, which could negatively impact the availability and the reliability of Puerto Rico’s electrical grid and adversely impact our operations on the island.
While we do not currently contract directly with the Puerto Rico government or PREPA, continued weakness in the Puerto Rico economy or the failure of the Puerto Rico government to manage its fiscal challenges in an orderly manner could result in policy decisions we do not anticipate and may directly or indirectly adversely impact our business, financial condition and results of operations. For example, PREPA’s creditor workout process, similar to bankruptcy, as well as proposed public-private partnerships and the potential privatization of PREPA’s assets remain ongoing, each of which have been subject to delay due to the COVID-19 pandemic. It is unclear at this time what impact any debt restructuring agreements entered into in PREPA’s workout process, the implementation of public-private partnerships or privatization transactions or any related changes to the public policy and
40
Table of Contents
regulatory framework for PREPA and Puerto Rico’s electrical grid and solar generation may have on our customers and solar energy systems.
The Puerto Rico Energy Bureau has instituted administrative proceedings regarding customer complaints about our Puerto Rican operations, the operations of some of our dealers in Puerto Rico and certain Sunnova policies and procedures relating to contract disclosures and invoice disputes in Puerto Rico. At this time, we are unable to determine whether the Puerto Rico Energy Bureau will seek penalties against us in the future in connection with these proceedings or require a change in our practices and procedures. Based on this matter, the U.S. Better Business Bureau listed Sunnova as not accredited. We have not experienced a material impact as a result of the listing.
Our business is concentrated in certain markets, putting us at risk of region-specific disruptions.
As of March 31, 2020, approximately 25%, 25% and 13% of our solar energy systems were located in New Jersey, California and Puerto Rico, respectively. In addition, we expect much of our near-term future growth to occur in these same markets, further concentrating our customer base and operational infrastructure. Accordingly, our business and results of operations are particularly susceptible to adverse economic, regulatory, political, weather and other conditions in such markets and in other markets that may become similarly concentrated. See “—We are not able to insure against all potential risks and we may become subject to higher insurance premiums” and “—Certain of our solar energy systems are located in, and we conduct business in, Puerto Rico and weakness in the fiscal health of the government and PREPA, the damage caused by Hurricane Maria, a series of earthquakes which affected the island in December 2019 and early 2020 and potential tax increases that may increase our cost of conducting business in Puerto Rico, create uncertainty that may adversely impact us. In addition, we are subject to administrative proceedings instituted by the Puerto Rico Energy Bureau”. Any of these conditions, even if only in one such market, could have a material adverse effect on our business, financial condition and results of operations. In addition, all of our current solar energy systems are located in the U.S. and its territories, which makes us particularly susceptible to adverse changes in U.S. tax laws. See “—Risks Related to Taxation—Recent tax legislation and future changes in law could adversely affect our business.” For a discussion of expenses related to Hurricane Maria and the California wildfires in October 2017 and November 2018, see the section titled “Management’s Discussion and Analysis of Financial Condition and Results of Operations—Components of Results of Operations—Operations and Maintenance Expense.”
Dealer and marketplace confidence in our liquidity and long-term business prospects is important for building and maintaining our business.
Our financial condition, operating results and business prospects may suffer materially if we are unable to establish and maintain confidence about our liquidity and business prospects among dealers, consumers and within our industry. Our dealer network is an integral component of our business strategy and serves as the means by which we are able to rapidly and successfully expand within existing and prospective markets. Dealers and other third parties will be less likely to enter into dealer agreements with us or originate new solar service agreements if they are uncertain we will be able to make payments on time, our business will succeed or our operations will continue for many years.
Our solar energy systems and energy storage systems require ongoing maintenance and support. If we were to reduce operations, even years from now, buyers of our solar energy systems and energy storage systems from years earlier might have difficulty having us provide or arrange repairs or other services to our and their solar energy systems and energy storage systems, which remain our responsibility under the terms of our solar service agreements. As a result, consumers may be less likely to enter into solar service agreements with us if they are uncertain our business will succeed or our operations will continue for many years.
41
Table of Contents
Accordingly, in order to build and maintain our business, we must maintain confidence among dealers, customers and other parties in our liquidity and long-term business prospects. We may not succeed in our efforts to build this confidence.
Damage to our brand and reputation or change or loss of use of our brand could harm our business and results of operations.
We depend significantly on our reputation for high-quality products, excellent customer service and the brand name “Sunnova” to attract new customers and grow our business. If we fail to continue to deliver our solar energy systems or energy storage systems within the planned timelines, if our offerings do not perform as anticipated or if we damage any of our customers’ properties or delay or cancel projects, our brand and reputation could be significantly impaired. Future technological improvements may allow us to offer lower prices or offer new technology to new customers; however, technical limitations in our current solar energy systems and energy storage systems may prevent us from offering such lower prices or new technology to our existing customers. The inability of our current customers to benefit from technological improvements could cause our existing customers to lower the value they perceive our existing products offer and impair our brand and reputation.
In addition, given the sheer number of interactions our personnel or dealers operating on our behalf have with customers and potential customers, it is inevitable that some customers’ and potential customers’ interactions with our company or dealers operating on our behalf will be perceived as less than satisfactory. This has led to instances of customer complaints, some of which have affected our digital footprint on rating websites and social media platforms. If we cannot manage our hiring and training processes to avoid or minimize these issues to the extent possible, our reputation may be harmed and our ability to attract new customers would suffer.
In addition, if we were to no longer use, lose the right to continue to use or if others use the “Sunnova” brand, we could lose recognition in the marketplace among customers, suppliers and dealers, which could affect our business, financial condition, results of operations and would require financial and other investment and management attention in new branding, which may not be as successful.
The installation and operation of solar energy systems and energy storage systems depends heavily on suitable solar and meteorological conditions. If meteorological conditions are unexpectedly unfavorable, the electricity production from our solar energy systems may be substantially below our expectations and our ability to timely deploy new solar energy systems and energy storage systems may be adversely impacted.
The energy produced and the revenue and cash receipts generated by a solar energy system depend on suitable solar, atmospheric and weather conditions, all of which are beyond our control. Our economic model and projected returns on our solar energy systems require achievement of certain production results from our systems and, in some cases, we guarantee these results to our consumers. If the solar energy systems underperform for any reason, our business could suffer. For example, the amount of revenue we recognize in a given period from our PPAs and the amount of our obligations under the performance guarantees of our solar service agreements are dependent in part on the amount of energy generated by solar energy systems under such solar service agreements. As a result, revenue derived from our standard PPAs is impacted by seasonally shorter daylight hours in winter months. In addition, the ability of our dealers to install solar energy systems and energy storage systems is impacted by weather. For example, the ability to install solar energy systems and energy storage systems during the winter months in the Northeastern U.S. is limited. Such solar, atmospheric and weather conditions can delay the timing of when solar energy systems and energy storage systems can be installed and when we can originate and begin to generate revenue from solar energy systems. This may increase our expenses and decrease revenue and cash receipts in the relevant periods. Furthermore, prevailing weather patterns could materially change in the future, making it
42
Table of Contents
harder to predict the average annual amount of sunlight striking each location where we install a solar energy system and energy storage system. This could make our solar energy systems less economical overall or make individual solar energy systems less economical. Any of these events or conditions could harm our business, financial condition and results of operations.
The loss of one or more members of our senior management or key employees may adversely affect our ability to implement our strategy.
We depend on our experienced management team and the loss of one or more key executives could have a negative impact on our business. In particular, we are dependent on the services of our founder and CEO, William J. Berger. We also depend on our ability to retain and motivate key employees and attract qualified new employees. None of our key executives are bound by employment agreements for any specific term. We may be unable to replace key members of our management team and key employees if we lose their services. Integrating new employees into our team could prove disruptive to our operations, require substantial resources and management attention and ultimately prove unsuccessful. An inability to attract and retain sufficient managerial personnel who have critical industry experience and relationships could limit or delay our strategic efforts, which could have a material adverse effect on our business, financial condition and results of operations.
The requirements of being a public company may strain our resources, divert management’s attention and affect our ability to attract and retain qualified board members and officers.
As a public company, we are subject to the reporting requirements of the Securities Exchange Act of 1934, as amended (the “Exchange Act”), the listing requirements of the NYSE and other applicable securities rules and regulations. Complying with these rules and regulations has increased and will continue to increase our legal and financial compliance costs, make some activities more difficult, time-consuming or costly and increase demand on our systems and resources. The Exchange Act requires, among other things, that we file annual, quarterly and current reports with respect to our business and operating results and maintain effective disclosure controls and procedures and internal control over financial reporting. To maintain and, if required, improve our disclosure controls and procedures and internal control over financial reporting to meet this standard, significant resources and management oversight may be required. As a result, management’s attention may be diverted from other business concerns which could harm our business and operating results. Although we have already hired additional employees to comply with these requirements, we may need to hire more employees in the future which will increase our costs and expenses.
As a public company, our director and officer liability insurance expense increased significantly and we may be required to accept reduced coverage or incur substantially higher costs to maintain coverage. These factors could also make it more difficult for us to attract and retain qualified executive officers and members of our board of directors, particularly to serve on our audit committee.
Our inability to protect our intellectual property could adversely affect our business. We may also be subject to intellectual property rights claims by third parties, which are extremely costly to defend, could require us to pay significant damages and could limit our ability to use certain technologies.
Any failure to protect our proprietary rights adequately could result in our competitors offering similar residential solar technology or energy storage services more quickly than anticipated, potentially resulting in the loss of some of our competitive advantage and a decrease in our revenue which would adversely affect our business prospects, financial condition and operating results. Our success depends, at least in part, on our ability to protect our core technology and intellectual property. We rely on intellectual property laws, primarily a combination of copyright and trade secret laws in the U.S., as well as license agreements and other contractual provisions, to protect our proprietary technology and brand. We cannot be certain our agreements and other contractual provisions will not
43
Table of Contents
be breached, including a breach involving the use or disclosure of our trade secrets or know-how, or that adequate remedies will be available in the event of any breach. In addition, our trade secrets may otherwise become known or lose trade secret protection.
We cannot be certain our products and our business do not or will not violate the intellectual property rights of a third party. Third parties, including our competitors, may own patents or other intellectual property rights that cover aspects of our technology or business methods. Such parties may claim we have misappropriated, misused, violated or infringed third-party intellectual property rights and if we gain greater recognition in the market, we face a higher risk of being the subject of claims we have violated others’ intellectual property rights. Any claim we violated a third party’s intellectual property rights, whether with or without merit, could be time-consuming, expensive to settle or litigate and could divert our management’s attention and other resources, all of which could adversely affect our business, results of operations, financial condition and cash flows. If we do not successfully settle or defend an intellectual property claim, we could be liable for significant monetary damages and could be prohibited from continuing to use certain technology, business methods, content or brands. To avoid a prohibition, we could seek a license from third parties, which could require us to pay significant royalties, increasing our operating expenses. If a license is not available at all or not available on commercially reasonable terms, we may be required to develop or license a non-violating alternative, either of which could adversely affect our business, results of operations, financial condition and cash flows.
We currently use or plan to use software that is licensed under “open source”, “free” or other similar licenses that may subject us to liability or require us to release the source code of our proprietary software to the public.
We currently use open source software that is licensed under “open source”, “free” or other similar licenses. Open source software is made available to the general public on an “as-is” basis under the terms of a non-negotiable license. If we fail to comply with these licenses, we may be subject to certain conditions, including requirements that we offer our services that incorporate the open source software for no cost, we make available source code for modifications or derivative works we create based upon incorporating or using the open source software and we license such modifications or alterations under the terms of the particular open source license. We do not plan to integrate our proprietary software with this open source software in ways that would require the release of the source code of our proprietary software to the public. However, our use and distribution of open source software may entail greater risks than use of third-party commercial software. Our authorized developers may contribute to this open source software community but they will be prohibited from providing any proprietary process or proprietarily developed source code of ours. Open source licensors generally do not provide warranties or other contractual protections regarding infringement claims or the quality of the code. In addition, if we combine our proprietary software with open source software in a certain manner, we could, under certain open source licenses, be required to release the source code of our proprietary software to the public. This would allow our competitors to create similar offerings with lower development effort and time. We may also face claims alleging noncompliance with open source license terms or infringement or misappropriation of proprietary software.
These claims could result in litigation, require us to purchase a costly license or require us to devote additional research and development resources to change our software, any of which would have a negative effect on our business and operating results. In addition, if the license terms for open source software that we use change, we may be forced to re-engineer our technology platform or incur additional costs.
Although we monitor our use of open source software to avoid subjecting our technology platform to unintended conditions, few courts have interpreted open source licenses and there is a risk these
44
Table of Contents
licenses could be construed in a way that could impose unanticipated conditions or restrictions on our business. We cannot guarantee we have incorporated open source software in our software in a manner that will not subject us to liability or in a manner consistent with our current policies and procedures.
We may be subject to interruptions or failures in our information technology systems.
We rely on information technology systems and infrastructure to support our business. Any of these systems may be susceptible to damage or interruption due to fire, floods, power loss, telecommunication failures, usage errors by employees, computer viruses, cyberattacks or other security breaches or similar events. A compromise of our information technology systems or those with which we interact could harm our reputation and expose us to regulatory actions and claims from customers and other persons, any of which could adversely affect our business, financial condition, cash flows and results of operations. If our information systems are damaged, fail to work properly or otherwise become unavailable, we may incur substantial costs to repair or replace them and we may experience a loss of critical information, customer disruption and interruptions or delays in our ability to perform essential functions.
Disruptions to our solar monitoring systems could negatively impact our revenues and increase our expenses.
Our ability to accurately charge our customers for the energy produced by our solar energy systems primarily depends on the cellular connection for the related monitoring system, which we are responsible for maintaining in a functional state so that we may receive data regarding the solar energy systems’ production from their residences. We could incur significant expenses or disruptions of our operations in connection with failures of our solar monitoring systems, including failures of such connections, that would prevent us from accurately monitoring solar energy production. In addition, sophisticated hardware and operating system software and applications we procure from third parties may contain defects in design or manufacture, including “bugs” and other problems that could unexpectedly interfere with the operation of our solar energy systems or energy storage systems. The costs to us to eliminate or alleviate viruses and bugs, or any problems associated with failures of our cellular connections could be significant. We have in the past experienced periods where some of our cellular connections have been unavailable and, as a result, we have been forced to estimate the production of their solar energy systems. Such estimates may prove inaccurate and could cause us to underestimate the power being generated by our solar energy systems and undercharge our customers, thereby harming our results of operations.
Any unauthorized access to or disclosure or theft of personal information we gather, store or use could harm our reputation and subject us to claims or litigation.
We receive, store and use personal information of our customers, including names, addresses, e-mail addresses, credit information, credit card and financial account information and other housing and energy use information. We also store information of our dealers, including employee, financial and operational information. We rely on the availability of data collected from our customers and our dealers in order to manage our business and market our offerings. We take certain steps in an effort to protect the security, integrity and confidentiality of the personal information we collect, store or transmit, but there is no guarantee inadvertent or unauthorized use or disclosure will not occur or third parties will not gain unauthorized access to this information despite our efforts. We also rely on third-party suppliers or vendors to host certain of the systems we use. Although we take precautions to provide for disaster recovery, our ability to recover systems or data may be expensive and may interfere with our normal operations. Also, although we obtain assurances from such third parties, they will use reasonable safeguards to secure their systems, we may be adversely affected by unavailability
45
Table of Contents
of their systems or unauthorized use or disclosure or our data maintained in such systems. Because techniques used to obtain unauthorized access or sabotage systems change frequently and generally are not identified until they are launched against a target, we, our suppliers or vendors and our dealers may be unable to anticipate these techniques or to implement adequate preventative or mitigation measures.
Cyberattacks in particular are becoming more sophisticated and include, but are not limited to, malicious software, attempts to gain unauthorized access to data and other electronic security breaches that could lead to disruptions in critical systems, disruption of our customers’ operations, loss or damage to our data delivery systems, unauthorized release of confidential or otherwise protected information, corruption of data and increased costs to prevent, respond to or mitigate cybersecurity events. In addition, certain cyber incidents, such as advanced persistent threats, may remain undetected for an extended period.
Unauthorized use, disclosure of or access to any personal information maintained by us or on our behalf, whether through breach of our systems, breach of the systems of our suppliers, vendors or dealers by an unauthorized party or through employee or contractor error, theft or misuse or otherwise, could harm our business. If any such unauthorized use, disclosure of or access to such personal information were to occur, our operations could be seriously disrupted and we could be subject to demands, claims and litigation by private parties and investigations, related actions and penalties by regulatory authorities.
In addition, we could incur significant costs in notifying affected persons and entities and otherwise complying with the multitude of federal, state and local laws and regulations relating to the unauthorized access to, use of or disclosure of personal information. Finally, any perceived or actual unauthorized access to, use of or disclosure of such information could harm our reputation, substantially impair our ability to expand our portfolio of solar service agreements and related solar energy systems and energy storage systems and have an adverse impact on our business, financial condition and results of operations.
Our business is subject to complex and evolving U.S. laws and regulations regarding privacy and data protection (“data protection laws”). Many of these laws and regulations are subject to change and uncertain interpretation and could result in claims, increased cost of operations or otherwise harm our business.
The regulatory environment surrounding data privacy and protection is constantly evolving and can be subject to significant change. New data protection laws, including recent California legislation which affords California consumers an array of new rights, including the right to be informed about what kinds of personal data companies have collected and why it was collected, pose increasingly complex compliance challenges and potentially elevate our costs. Complying with varying jurisdictional requirements could increase the costs and complexity of compliance and violations of applicable data protection laws can result in significant penalties. Any failure, or perceived failure, by us to comply with applicable data protection laws could result in proceedings or actions against us by governmental entities or others, subject us to significant fines, penalties, judgments and negative publicity, require us to change our business practices, increase the costs and complexity of compliance and adversely affect our business. As noted above, we are also subject to the possibility of security and privacy breaches, which themselves may result in a violation of these laws.
We may become involved in the future in legal proceedings that could adversely affect our business.
We may, from time to time, be involved in litigation and claims, such as those relating to employees, customers, our dealers or other third parties with whom we contract, including consumer
46
Table of Contents
claims and class action lawsuits. In the ordinary course of business, we have disputes with dealers and customers. In general, litigation claims or regulatory proceedings can be expensive and time consuming to bring or defend against, may result in the diversion of management attention and resources from our business and business goals and could result in injunctions or other equitable relief, settlements, penalties, fines or damages that could significantly affect our results of operations and the conduct of our business. It is impossible to predict with certainty whether any resulting liability would have a material adverse effect on our financial position, results of operations or cash flows.
We intend to expand our operations to include international activities, which will subject us to a number of risks.
Our long-term strategic plans include international expansion, including expansion into jurisdictions that have characteristics similar to those in which we currently operate. Risks inherent to international operations include the following:
| • | the inability to work successfully with dealers with local expertise to originate international solar service agreements; |
| • | multiple, conflicting and changing laws and regulations, including export and import laws and regulations, economic sanctions laws and regulations, tax laws and regulations, environmental regulations, labor laws and other government requirements, approvals, permits and licenses; |
| • | laws and legal systems less developed or less predictable than those in the U.S.; |
| • | changes in general economic and political conditions in the jurisdictions where we operate, including changes in government incentives relating to power generation and solar electricity; |
| • | political and economic instability, including wars, acts of terrorism, political unrest, boycotts, curtailments of trade and other business restrictions; |
| • | difficulties and costs in recruiting and retaining individuals skilled in international business operations; |
| • | international business practices may conflict with U.S. customs or legal requirements, including anti-bribery and corruption regulations; |
| • | financial risks, such as longer sales and payment cycles and greater difficulty collecting accounts receivable or executing self-help remedies, if necessary; |
| • | deficient or unreliable records relating to real property ownership; |
| • | potentially lower margins due to a lower average income level; |
| • | fluctuations in currency exchange rates relative to the U.S. dollar; and |
| • | the inability to obtain, maintain or enforce intellectual property rights, including inability to apply for or register material trademarks in foreign countries, which could make it easier for competitors to capture increased market position. |
Doing business in foreign markets requires us to be able to respond to rapid changes in market, legal and political conditions in these countries. The success of our business will depend, in part, on our ability to succeed in differing legal, regulatory, economic, social and political environments. We may not be able to develop and implement policies and strategies that will be effective in each location where we do business.
Our future operations may subject us to risks associated with currency fluctuations.
Our future international operations may subject us to risks relating to currency fluctuations. Foreign currencies periodically experience rapid and/or large fluctuations in value against the U.S.
47
Table of Contents
dollar. A weakened U.S. dollar could increase the cost of procurement of raw materials, by our suppliers, from foreign jurisdictions and operating expenses in foreign locations, which could have a material adverse effect on our business and results of operations. Our planned international expansion further subjects us to currency risk.
Since the price at which we originate solar energy systems from our dealers is generated in U.S. dollars, we are mostly insulated from currency fluctuations. However, since suppliers of our dealers often incur a significant amount of their costs by purchasing raw materials and generating operating expenses in foreign currencies, if the value of the U.S. dollar depreciates significantly or for a prolonged period of time against these other currencies, this may cause those suppliers to raise the prices they charge us and our dealers, which in turn could harm our business and results of operations. Although the value of the U.S. dollar has been high relative to other currencies in recent periods, there is no guarantee this trend will continue.
Our actual financial results may differ materially from any guidance we may publish from time to time.
We may, from time to time, provide guidance regarding our future performance that represents our management’s estimates as of the date such guidance is provided. Any such guidance would be based upon a number of assumptions with respect to future business decisions (some of which may change) and estimates, while presented with numerical specificity, are inherently subject to significant business, economic and competitive uncertainties and contingencies (many of which are beyond our control). Guidance is necessarily speculative in nature and it can be expected some or all the assumptions that inform such guidance will not materialize or will vary significantly from actual results. Our ability to meet any forward-looking guidance is impacted by a number of factors including, but not limited to, the number of our solar energy systems sold versus leased, changes in installation costs, the availability of additional financing on acceptable terms, changes in the retail prices of traditional utility-generated electricity, the availability of rebates, tax credits and other incentives, changes in policies and regulations including net metering and interconnection limits or caps, the availability of solar panels, inverters, batteries and other raw materials, as well as the other risks to our business described in this “Risk Factors” section. Accordingly, our guidance is only an estimate of what management believes is realizable as of the date such guidance is provided. Actual results may vary from such guidance and the variations may be material. Investors should also recognize the reliability of any forecasted financial data diminishes the farther into the future the data is forecast. In light of the foregoing, investors should not place undue reliance on our financial guidance and should carefully consider any guidance we may publish in context.
Terrorist or cyberattacks against centralized utilities could adversely affect our business.
Assets owned by utilities such as substations and related infrastructure have been physically attacked in the past and will likely be attacked in the future. These facilities are often protected by limited security measures, such as perimeter fencing. Any such attacks may result in interruption to electricity flowing on the grid and consequently interrupt service to our solar energy systems not combined with an energy storage system, which could adversely affect our operations. Furthermore, cyberattacks, whether by individuals or nation states, against utility companies could severely disrupt their business operations and result in loss of service to customers, which would adversely affect our operations.
48
Table of Contents
Risks Related to Regulations
We are not currently regulated as an electric public utility under applicable law but may be subject to regulation as an electric utility in the future.
We are not currently regulated as an electric public utility in the U.S. under applicable national, state or other local regulatory regimes where we conduct business. As a result, we are not currently subject to the various federal, state and local standards, restrictions and regulatory requirements applicable to centralized public utilities. Any federal, state or local regulations that cause us to be treated as an electric utility or to otherwise be subject to a similar regulatory regime of commission-approved operating tariffs, rate limitations and related mandatory provisions, could place significant restrictions on our ability to operate our business and execute our business plan by prohibiting, restricting or otherwise regulating our sale of electricity. If we were subject to the same state or federal regulatory authorities as centralized electric utilities in the U.S. and its territories or if new regulatory bodies were established to oversee our business in the U.S. and its territories or in foreign markets we enter, our operating costs would materially increase or we might have to change our business in ways that could have a material adverse effect on our business, financial condition and results of operations.
While we are not regulated as extensively as an electric public utility, we are subject to certain utility-like regulations in California, New York and Puerto Rico. In New York, distributed energy providers are subject to regulation by the New York Public Service Commission (the “NYPSC”) with respect to customer interactions (including contracting and marketing) and are required to comply with the NYPSC’s Uniform Business Practices. In connection with approving the Uniform Business Practices, the NYPSC also established an oversight framework under which it could impose other regulatory requirements on distributed energy providers. In Puerto Rico, we are subject to regulation as an electric power company by the Puerto Rico Energy Bureau and are required to comply with certain filing, certification, reporting and annual fee requirements. Regulation by the Puerto Rico Energy Bureau as an electric power company does not currently subject us to centralized utility-like regulation or require the Puerto Rico Energy Bureau’s approval of our charges to customers. In California, the California Public Utilities Commission (“CPUC”) issued an order approving several consumer protection measures for solar customers, including a requirement for solar providers to provide customers with the California Solar Consumer Protection Guide, which provides customers with information regarding the selection of a contractor, solar financing, bill savings estimates, net energy metering and electric rates, low-income options and related matters. The CPUC order also requires the investor-owned utilities in California to adopt procedures to verify during the interconnection process that the customer received the California Solar Consumer Protection Guide and that the solar provider is licensed, and to collect and report on complaints regarding solar providers. If we become subject to new, additional regulatory requirements in California, New York or Puerto Rico or other jurisdictions adopt regulatory requirements similar to California, New York or Puerto Rico, our operating costs would materially increase or we might have to change our business in ways that could have a material adverse effect on our business, financial condition and results of operations.
Electric utility policies and regulations, including those affecting electric rates, may present regulatory and economic barriers to the purchase and use of solar energy systems that may significantly reduce demand for electricity from our solar energy systems and adversely impact our ability to originate new solar service agreements.
Federal, state and local government regulations and policies concerning the electric utility industry, utility rates and rate structures and internal policies and regulations promulgated by electric utilities, heavily influence the market for electricity generation products and services. These regulations
49
Table of Contents
and policies often relate to electricity pricing. Policies and regulations that promote renewable energy and distributed energy generation have been challenged by centralized electric utilities and questioned by those in government and others arguing for less governmental spending and involvement in the energy market. To the extent such views are reflected in government policies and regulations, the changes in such policies and regulations could adversely affect our business, financial condition and results of operations.
Furthermore, the current administration has made public statements regarding overturning or modifying policies of, or regulations enacted by, the prior administration that placed limitations on coal and gas electric generation, mining and/or exploration. Any effort to overturn federal and state laws, regulations or policies that are supportive of solar energy generation or that remove costs or other limitations on other types of energy generation that compete with solar energy projects could materially and adversely affect our business.
In the U.S., governmental authorities and state public service commissions that determine utility rates, rate structures and the terms and conditions of electric service continuously modify these regulations and policies. These regulations and policies could result in a significant reduction in the potential demand for electricity from our solar energy systems and could deter customers from entering into solar service agreements with us.
With regard to rates, customers with residential solar energy systems may currently pay or be subject in the future to increased charges due to increased rates or changes in rate design and structures. Utilities in certain jurisdictions may assess fees which apply only to customers with distributed generation systems, including residential solar energy systems or impose charges on solar customers which are significantly higher than comparable charges billed to non-solar customers.
These fees may include demand, stand-by or departing load charges or monthly minimum charges. Certain jurisdictions may permit utilities to change their rate design and structures which could result in charges that would disproportionately impact customers with solar energy systems. For example, a reduction in the number of tiers of residential rates could result in increased charges for lower-demand customers, including many solar customers, by moving them to a new rate tier with higher rates. It could also result in lower charges for higher-demand customers, who may then become less incentivized to consider solar energy to meet their electricity needs. Similarly, a change in rate design to recover more costs from fixed charges as opposed to variable charges (i.e. “decoupled” rates, by which the utility’s revenue requirement is “decoupled” from its level of electricity sales in designing rates) may have the same effect. Additionally, depending on the region, electricity generated by solar energy systems competes most effectively with the most expensive retail rates for electricity from the electrical grid, rather than the less expensive average price of electricity. Modifications to the centralized electric utilities’ peak hour pricing policies or rate design could make our current product offerings less competitive with the price of electricity from the electrical grid. A shift in the timing of peak rates for utility-generated electricity to include times of day when solar energy generation is less efficient or non-operable could make our solar energy systems less competitive and reduce demand for our product offerings. Time-of-use rates could also result in higher costs for solar customers whose electricity requirements are not fully met by the solar energy system during peak periods.
Utilities in California, New Jersey and Puerto Rico, among other states and jurisdictions, have proposed or received approval by state regulators for such rate measures as described in this risk factor. Any such changes affecting rates could increase our customers’ cost to use our solar energy systems and make our service and product offerings less desirable, thereby harming our business, financial condition and results of operations. The imposition of any such rate measures could limit the ability of distributed residential solar power companies to compete with the price of electricity generated by centralized electric utilities, which may reduce the number of solar energy systems
50
Table of Contents
installed in those jurisdictions. Additionally, any such unaccounted for increases in the fees or charges applicable to existing customer agreements may increase the cost of energy to those customers and result in an increased rate of defaults, terminations or cancelations under our solar service agreements. In addition, changes to government or internal utility regulations and policies that favor centralized electric utilities could reduce our competitiveness and cause a significant reduction in demand for our product offerings.
Any of the foregoing results could limit our ability to expand our portfolio of solar service agreements and related solar energy systems and energy storage systems or harm our business, financial condition and results of operations.
We rely on net metering and related policies to offer competitive pricing to our customers in most of our current markets and changes to net metering policies may significantly reduce demand for electricity from residential solar energy systems.
Net metering is one of several key policies that have enabled the growth of distributed generation solar energy systems in the U.S., providing significant value to customers for electricity generated by their residential solar energy systems but not directly consumed on-site. Net metering allows a homeowner to pay his or her local electric utility for power usage net of production from the solar energy system or other distributed generation source. Homeowners receive a credit for the energy an interconnected solar energy system generates in excess of that needed by the home to offset energy purchases from the centralized utility made at times when the solar energy system is not generating sufficient energy to meet the customer’s demand. In many markets, this credit is equal to the residential retail rate for electricity and in other markets, such as Hawaii and Nevada, the rate is less than the retail rate and may be set, for example, as a percentage of the retail rate or based upon a valuation of the excess electricity. In some states and utility territories, customers are also reimbursed by the centralized electric utility for net excess generation on a periodic basis.
Net metering programs have been subject to legislative and regulatory scrutiny in some states and territories including, but not limited to, New Jersey, California, Arizona, Nevada, Connecticut, Maine, Kentucky, Puerto Rico and Guam. These jurisdictions, by statute, regulation, administrative order or a combination thereof, have recently adopted or are considering new restrictions and additional changes to net metering programs either on a state-wide basis or within specific utility territories. Many of these measures were introduced and supported by centralized electric utilities. These measures vary by jurisdiction and may include a reduction in the rates or value of the credits customers are paid or receive for the power they deliver back to the electrical grid, caps or limits on the aggregate installed capacity of generation in a state or utility territory eligible for net metering, expiration dates for and phasing out of net metering programs, replacement of net metering programs with alternative programs that may provide less compensation and limits on the capacity size of individual distributed generation systems which can qualify for net metering. Net metering and related policies concerning distributed generation also received attention from federal legislators and regulators.
In New Jersey, the Board of Public Utilities (“BPU”) has the option under state law of limiting participation in the retail rate net metering program if the aggregate capacity of owned and operating systems reaches 5.8% of total annual kWh sold in the state. As of March 31, 2020, that threshold had not yet been reached. On September 22, 2017, the BPU opened a generic proceeding to review the state of the solar market in New Jersey and solicit input from stakeholders in the industry and convene public hearings across the state. The BPU held hearings and received public comments, but no rule or policy changes have been proposed by the BPU to date.
In California, the CPUC issued an order in 2016 retaining retail-based net metering credits for residential customers of California’s major utilities as part of Net Energy Metering 2.0 (“NEM 2.0”).
51
Table of Contents
Under NEM 2.0, new distributed generation customers receive the retail rate for electricity exported to the grid, less certain non-bypassable fees. Customers under NEM 2.0 also are subject to interconnection charges and time-of-use rates. Existing customers who receive service under the prior net metering program, as well as new customers under the NEM 2.0 program, are grandfathered for a period of 20 years. It is expected the CPUC will begin review of its net metering policies in 2020 to develop Net Energy Metering 3.0 (“NEM 3.0”) with the goal of implementing NEM 3.0 in 2021. Proceedings on distributed energy policy and utility rates before the CPUC could also result in changes that affect customers with distributed generation systems.
In Puerto Rico, legislation enacted in April 2019 would require the Public Service Regulatory Board’s Energy Bureau to undertake a study of net metering to be completed within five years and may result in revisions to the net metering rules based on the study’s findings. However, no changes can be made to retail net metering for five years after the date the legislation was enacted. Meanwhile, “true” net metering will continue to apply, meaning the credit for energy exported by net metering clients will equal the value of such energy under the rate applicable to those clients and accordingly, their charges will be based on their net consumption. Customers subject to this regime would be grandfathered for a period of 20 years from the date of their net metering agreements.
Net metering customers in Puerto Rico may be impacted by transition charges and other requirements contemplated in the DRSA between PREPA and its creditors submitted on May 3, 2019, which is currently pending before the U.S. District Court for the District of Puerto Rico. If approved by the court and implemented as proposed, these transition charges will be assessed on all customers at a rate of 2.768 c/kWh, which is set to increase periodically until eventually reaching 4.552 c/kWh in fiscal year 2044. For customers grandfathered prior to the DRSA’s implementation date, the transition charge will equal the transition charge rate multiplied by the customer’s average net consumption over the previous 24 months, after accounting for a three month lag time. For non-grandfathered customers, the monthly transition charge will equal the greater of either (a) the transition charge rate multiplied by the monthly average of the customer’s gross consumption over the past 24 months or (b) the transition charge rate multiplied by the customer’s net consumption in the given month. Non-grandfathered customers also will be required to comply with certain notice requirements and will also be responsible for the costs associated with installing a revenue grade meter to measure “behind the meter” generation.
In Guam, the Consolidated Commission on Utilities (“CCU”) adopted a resolution in 2018 recommending retail rate net metering for customers of the Guam Power Authority (“GPA”) be replaced with a “buy all/sell all” or similar program that provides for compensation to homeowners at a lower, avoided cost rate. The GPA is a public corporation that provides electricity in Guam and is overseen by the CCU and regulated by the Guam Public Utilities Commission (“GPUC”). In 2019, the GPUC, who has the authority to approve or reject the CCU’s recommendations, rejected the resolution and instead voted to cap participation in the net metering program from 1,000 customers to 261 megawatts, which represents 10% of the GPA system’s peak power demand. The GPA has also proposed to eliminate the option for customers to roll over any excess net metering credits to the next year or receive a payment for excess credits remaining at the end of the year. Instead, the GPA proposes that any unused credits would be surrendered to the utility. The GPA also proposes that new customers be required to install a battery in order to qualify for net metering credits from solar generation. These proposals have not been acted upon by the GPUC.
In other jurisdictions, replacing net metering with a “value of distributed energy”, “feed-in”, or “sell-all/ buy-all” tariff is also being considered or has been adopted. Under a “value of distributed energy” tariff, the customer would be compensated at a rate that accounts for the electricity, capacity, environmental and other attributes provided by distributed generation to the grid and the electricity
52
Table of Contents
market. Under a “feed-in” or “sell-all/ buy-all” tariff, all the solar energy system’s generation is exported to the grid and purchased by the utility at an established rate and the customer is required to purchase all of its electricity requirements from the utility at the retail rate. In New York, the NYPSC adopted a “value of distributed energy” policy but grandfathered existing net metering customers and continuing net metering for new residential customers interconnected before January 1, 2021 for a period of 20 years. Residential customers otherwise still eligible for net metering may also elect to be compensated under a “value of distributed energy” tariff. New solar customers interconnecting after January 1, 2021 will be subject to a “value of distributed energy” tariff and potentially a monthly fixed fee. Compensation for those customers covered by a “value of solar” tariff varies and may not favorably compare to that provided by net metering.
Net metering and related policies concerning distributed generation also received attention from federal legislators and regulators. For example, in April 2020, the New England Ratepayers Association petitioned the Federal Energy Regulatory Commission (“FERC”) to declare its exclusive federal jurisdiction over distributed generation, including residential solar, and to establish new federal customer compensation rates for excess energy in lieu of state net metering programs. Parties have filed comments with FERC both in support of and opposition to the petition. The formal comment period for this proceeding closed on June 15, 2020, and the petition is pending before FERC. Changes in federal law, including those made by statute, regulation, rule or order, could negatively affect net metering or other related policies which otherwise promote and support solar energy and enhance the economic viability of distributed residential solar.
If net metering caps in certain jurisdictions are reached while they are still in effect, if the value of the credit that customers receive for net metering is significantly reduced, if net metering is discontinued or replaced by a different regime which values solar energy at a lower rate or if other limits or restrictions on net metering are imposed, current and future customers may be unable to recognize the same level of cost savings associated with net metering. The absence of favorable net metering policies or of net metering entirely, or the imposition of new charges that only or disproportionately impact customers that use net metering would likely significantly limit customer demand for distributed residential solar energy systems and the electricity they generate and result in an increased rate of defaults, terminations or cancelations under customer agreements. Our ability to lease, finance and sell our solar energy systems and services or sell the electricity generated from our solar energy systems may be adversely impacted by the failure to expand existing limits on the amount of net metering in states that have implemented it, the failure to adopt a net metering policy where it currently is not in place or reductions in the amount or value of credit customers receive through net metering. This could adversely impact our ability to expand our portfolio of solar service agreements and related solar energy systems and energy storage systems, our business, financial condition and results of operations.
Additionally, distributed residential solar customers in certain jurisdictions may be subject to higher charges from centralized electric utilities than non-solar customers and such charges should be evaluated together with the net metering policies in place. If such charges are imposed, the cost savings associated with switching to solar energy may be significantly reduced and our ability to expand our portfolio of solar service agreements and related solar energy systems and energy storage systems and compete with centralized electric utilities could be impacted.
For further discussion of these potential charges and related proposals, see “—Electric utility policies and regulations, including those affecting electric rates, may present regulatory and economic barriers to the purchase and use of solar energy systems that may significantly reduce demand for electricity from our solar energy systems and adversely impact our ability to originate new solar service agreements”.
53
Table of Contents
Our business currently depends in part on the availability of rebates, tax credits and other financial incentives. The expiration, elimination or reduction of these rebates, credits or incentives or our ability to monetize them could adversely impact our business.
Our business depends in part on current government policies that promote and support solar energy and enhance the economic viability of distributed residential solar. Revenues from SRECs constituted approximately 15% of our revenues for the three months ended March 31, 2020 and 29%, 29% and 32% of our revenues for the years ended December 31, 2019, 2018 and 2017, respectively. U.S. federal, state and local governments established various incentives and financial mechanisms to reduce the cost of solar energy and to accelerate the adoption of solar energy. These incentives come in various forms, including rebates, tax credits and other financial incentives such as payments for renewable energy credits associated with renewable energy generation, exclusion of solar energy systems from property tax assessments or other taxes and system performance payments. However, these programs may expire on a particular date, end when the allocated funding is exhausted or be reduced or terminated as solar energy adoption rates increase. For example, in New Jersey, the legacy SREC program was closed to new registrants on May 1, 2020 and replaced with the Transitional Renewable Energy Credits (“TREC”) program. The TREC program sets the value of TRECs at a fixed price $91.20 per megawatt hour for residential systems, which is lower than the current market-based price of SRECs. The TREC program is intended to be an interim transitional program that will be in place until New Jersey adopts a long term successor program. The value of SRECs in a market tends to decrease over time as the supply of SREC-producing solar energy systems installed in that market increases. If we overestimate the future value of these incentives, it could adversely impact our business, results of operations and financial results. See “Business—Government Incentives”.
A loss or reduction in such incentives could decrease the attractiveness of new solar energy systems to customers, which could adversely impact our business and our access to capital. We also enter into hedges related to expected production of SRECs through forward contracts that require us to physically deliver the SRECs upon settlement. These arrangements may, depending on the instruments used and the level of additional hedges involved, limit any potential upside from SREC production increases. We may be exposed to potential economic loss should a counterparty be unable or unwilling to perform their obligations under the terms of a hedging agreement. In addition, we are exposed to risks related to changes in interest rates and may engage in hedging activities to mitigate related volatility. We may fail to properly hedge these SRECs or may fail to do so economically, which may also adversely affect our results of operations.
The economics of purchasing a solar energy system and energy storage system are also improved by eligibility for accelerated depreciation, also known as the modified accelerated cost recovery system (“MACRS”), which allows for the depreciation of equipment according to an accelerated schedule set forth by the IRS. This accelerated schedule allows a taxpayer, such as us and investors in tax equity financing arrangements, to recognize the depreciation of tangible solar property on a five-year basis even though the useful life of such property is generally greater than five years. We benefit from accelerated depreciation on the solar energy systems and energy storage systems we own. To the extent these policies are changed in a manner that reduces the incentives that benefit our business, we may experience reduced revenues and reduced economic returns, experience increased financing costs and encounter difficulty obtaining financing.
The federal government currently provides business investment tax credits under Section 48 and residential energy credits under Section 25D (the “Section 25D Credit”) of the Code. Section 48(a) of the Code allows taxpayers to claim an investment tax credit equal to 30% of the qualified expenditures for certain commercially owned solar energy systems that began construction before 2020 if placed in service before 2024. The Section 48(a) ITC percentage decreases to 26% of the basis of a solar energy system that begins construction during 2020, 22% for 2021 and 10% if construction begins after
54
Table of Contents
2021 or if the solar energy system is placed into service after 2023. In June 2018, the IRS provided guidance as to when construction is considered to begin for such purposes, including the 5% ITC Safe Harbor that may apply when a taxpayer pays or incurs (or in certain cases, a contractor of the taxpayer pays or incurs) 5% or more of the costs of a solar energy system before the end of the applicable year (the “5% ITC Safe Harbor”). For installations in 2020, we have purchased substantially all the inverters that will be deployed under our lease and PPA agreements that we expect will allow the related solar energy systems to qualify for the 30% Section 48(a) ITC by satisfying the 5% ITC Safe Harbor. There can be no assurances our solar energy systems that incorporate such inventory will be successful in claiming the 5% ITC Safe Harbor and therefore qualify for a higher Section 48(a) ITC.
We would be able to claim the Section 48(a) ITC when available for solar energy systems we originate under lease agreements or PPAs based on our ownership of the solar energy system at the time it is placed in service. We are also able to claim the Section 48(a) ITC for energy storage systems installed in conjunction with solar energy systems as long as they are only charged by on-site solar. A reduced Section 48(a) ITC may be available for energy storage systems charged in part from sources other than on-site solar as long as the energy storage systems are charged at least 75% by on-site solar.
Section 25D of the Code allows an individual to claim a 26% federal tax credit with respect to a residential solar energy system that is owned by the homeowner. As a result, the Section 25D Credit is claimed by customers who purchase solar energy systems. This 26% rate is scheduled to be reduced to 22% for solar energy systems placed in service during 2021. This credit is scheduled to expire effective January 1, 2022. The Section 25D Credit reduces the cost of consumer ownership of solar energy systems, such as under the loan program.
The Section 48(a) ITC has been a significant driver of the financing supporting the adoption of residential solar energy systems in the U.S. and the Section 25D Credit has been a significant driver of consumer demand for ownership of solar energy systems. The reduction in, or expiration of, these tax credits will likely impact the attractiveness of residential solar and could harm our business. For example, we expect the expiration of the Section 25D Credit will increase the cost of consumer ownership of solar energy systems, such as under the loan program.
The scheduled reductions in the Section 48(a) ITC could adversely impact our financing structures that monetize a substantial portion of such Section 48(a) ITC and provide financing for our solar energy systems, including if solar energy systems that incorporate our inventory are unsuccessful in claiming the 5% ITC Safe Harbor and therefore fail to qualify for a higher Section 48(a) ITC. To the extent we have a reduced ability to raise tax equity as a result of this reduction or an inability to continue to monetize such benefits in our financing arrangements, the rate of growth of installations of our residential solar energy systems and our ability to maintain such solar energy systems could be negatively impacted. In addition, future changes in existing law and interpretations by the IRS or the courts with respect to certain matters, including but not limited to, treatment of the Section 48(a) ITC, the 5% ITC Safe Harbor and our financing arrangements and the taxation of business entities including the deductibility of interest expense could affect the amount tax equity investors are willing to invest, which could reduce our access to capital. See “Business—Government Incentives”.
In addition, the tax legislation signed into law on December 22, 2017, commonly known as the “Tax Cuts and Jobs Act” (the “2017 Tax Act”), as modified by the Coronavirus Aid, Relief, and Economic Security (“CARES”) Act signed into law on March 27, 2020, contains several provisions that may significantly impact the attractiveness of tax benefits to tax equity investors. See “—Risks Related to Taxation—Recent tax legislation and future changes in law could adversely affect our business”. The 2017 Tax Act reduced the highest marginal corporate tax rate from 35% to 21%, which caused MACRS to have less value to investors and may result in investors having less interest in Section 48(a) ITCs. The 2017 Tax Act also added a base erosion and anti-abuse tax (“BEAT”)
55
Table of Contents
provision that imposes a minimum tax on certain multinational corporations and only 80% of the value of such corporation’s Section 48(a) ITCs can be applied to reduce such corporation’s BEAT liability. Beginning in 2026, no amount of Section 48(a) ITCs can be applied to offset BEAT liability. The BEAT provision generally applies to corporations that are part of a group with at least $500 million of applicable annual gross receipts and that make certain payments to related foreign persons. Accordingly, the BEAT provision could reduce the incentive for certain investors to invest in tax equity financing arrangements and could materially impact financing sources in the solar industry. Any such impact could materially and adversely affect our business. The 2017 Tax Act also generally prohibited the carryback of NOLs and limited the utilization of NOLs to 80% of taxable income. The CARES Act temporarily modified the NOL utilization percentage by removing the 80% limitation and allowed for a 5-year carryback. Either, or both, of these changes could have an adverse effect on our business.
Applicable authorities may adjust or decrease incentives from time to time or include provisions for minimum domestic content requirements or other requirements to qualify for these incentives. Reductions in, eliminations or expirations of or additional application requirements for governmental incentives could adversely impact our results of operations and ability to compete in our industry by increasing our cost of capital, causing distributed residential solar power companies to increase the prices of their energy and solar energy systems and reducing the size of our addressable market. In addition, this would adversely impact our ability to attract investment partners and lenders and our ability to expand our portfolio of solar service agreements and related solar energy systems and energy storage systems.
Our business depends in part on the regulatory treatment of third-party owned solar energy systems.
Our lease and PPA agreements are third-party ownership arrangements. Retail sales of electricity by third parties such as us face regulatory challenges in some states and jurisdictions, including states and jurisdictions we intend to enter where the laws and regulatory policies have not historically embraced competition to the service provided by the vertically integrated centralized electric utility. Some of the principal challenges pertain to whether third-party owned solar energy systems qualify for the same levels of rebates or other non-tax incentives available for customer-owned solar energy systems, whether third-party owned solar energy systems are eligible at all for these incentives and whether third-party owned solar energy systems are eligible for net metering and the associated significant cost savings. Furthermore, in some states and utility territories third parties are limited in the way they may deliver solar to their customers. In jurisdictions such as Arizona, Kentucky, North Carolina, Utah and Los Angeles, California, laws have been interpreted to prohibit the sale of electricity pursuant to PPAs, leading distributed residential solar energy system providers to use leases in lieu of PPAs, in addition to customer ownership. These regulatory constraints may, for example, give rise to various property tax issues. See “Risks Related to Taxation”. Changes in law and reductions in, eliminations of or additional requirements for, benefits such as rebates, tax incentives and favorable net metering policies decrease the attractiveness of new solar energy systems to distributed residential solar power companies and the attractiveness of solar energy systems to customers, which could reduce our acquisition opportunities. Such a loss or reduction could also adversely impact our access to capital and reduce our willingness to pursue solar energy systems due to higher operating costs or lower revenues from leases and PPAs.
Technical and regulatory limitations regarding the interconnection of solar energy systems to the electrical grid may significantly reduce our ability to sell electricity from our solar energy systems in certain markets or delay interconnections and customer in-service dates, harming our growth rate and customer satisfaction.
Technical and regulatory limitations regarding the interconnection of solar energy systems to the electrical grid may curb or slow our growth in key markets. Utilities throughout the country follow different rules and regulations regarding interconnection and regulators or utilities have or could cap or
56
Table of Contents
limit the amount of solar energy that can be interconnected to the grid. Our solar energy systems do not provide power to homeowners until they are interconnected to the grid.
With regard to interconnection limits, the FERC, in promulgating the first form of small generator interconnection procedures, recommended limiting customer-sited intermittent generation resources, such as our solar energy systems, to a certain percentage of peak load on a given electrical feeder circuit. Similar limits have been adopted by many states as a de facto standard and could constrain our ability to market to customers in certain geographic areas where the concentration of solar installations exceeds this limit.
Furthermore, in certain areas, we benefit from policies that allow for expedited or simplified procedures related to connecting solar energy systems and energy storage systems to the electrical grid. We also are required to obtain interconnection permission for each solar energy system from the local utility. In many states and territories, by statute, regulations or administrative order, there are standardized procedures for interconnecting distributed residential solar energy systems and related energy storage systems to the electric utility’s local distribution system. However, approval from the local utility could be delayed as a result of a backlog of requests for interconnection or the local utility could seek to limit the number of customer interconnections or the amount of solar energy on the grid. In some states, such as New Jersey and Massachusetts, certain utilities such as municipal utilities or electric cooperatives are exempt from certain interconnection requirements. If expedited or simplified interconnection procedures are changed or cease to be available, if interconnection approvals from the local utility are delayed or if the local utility seeks to limit interconnections, this could decrease the attractiveness of new solar energy systems and energy storage systems to distributed residential solar power companies, including us, and the attractiveness of solar energy systems and energy storage systems to customers. Delays in interconnections could also harm our growth rate and customer satisfaction scores. Such limitations or delays could also adversely impact our access to capital and reduce our willingness to pursue solar energy systems and energy storage systems due to higher operating costs or lower revenues from solar service agreements. Such limitations would negatively impact our business, results of operations, future growth and cash flows.
As adoption of solar distributed generation rises, along with the increased operation of utility-scale solar generation (such as in key markets including California), the amount of solar energy being contributed to the electrical grid may surpass the capacity anticipated to be needed to meet aggregate demand. Some centralized public utilities claim in less than five years, solar generation resources may reach a level capable of producing an over-generation situation, which may require some existing solar generation resources to be curtailed to maintain operation of the electrical grid. In the event such an over-generation situation were to occur, this could also result in a prohibition on the addition of new solar generation resources. The adverse effects of such a curtailment or prohibition without compensation could adversely impact our business, results of operations, future growth and cash flows.
We and our dealers are subject to risks associated with construction, regulatory compliance and other contingencies.
We utilize our growing dealer network to market, design, construct and install solar energy systems and energy storage systems in each of the markets in which we operate. The marketing and installation of solar energy systems and energy storage systems is subject to oversight and regulation in accordance with national, state and local laws and ordinances relating to consumer protection, building, fire and electrical codes, professional codes, safety, environmental protection, utility interconnection, metering and related matters. We also rely on certain of our dealers and third-party contractors to obtain and maintain permits and professional licenses, including as contractors, and other authorizations from various regulatory authorities and abide by their respective conditions and
57
Table of Contents
requirements in many of the jurisdictions in which we operate. A failure by us to obtain necessary permits or encounter delays in obtaining or renewing such permits or to use properly licensed dealers and third-party contractors could adversely affect our operations in those jurisdictions. Furthermore, we may become subject to similar regulatory requirements in some jurisdictions in which we operate. It is difficult and costly to track the requirements of every authority with jurisdiction over our operations and our solar energy systems. Separately, we are subject to regulations and potential liability under the Resource Conservation and Recovery Act and the Comprehensive Environmental Response, Compensation, and Liability Act related to the disposal of wastes generated in connection with our operations. Regulatory authorities may impose new government regulations or utility policies, change existing government regulations or utility policies, may seek expansive interpretations of existing regulations or policies pertaining to our services or solar energy systems and energy storage systems or may initiate associated investigations or enforcement actions or impose penalties or reject solar energy systems and energy storage systems. Any of these factors may result in regulatory and/or civil litigation, significant additional expenses to us or our customers, cause delays in our or our dealers’ ability to originate solar service agreement or install or interconnect solar energy systems and energy storage systems or cause other harm to our business. As a result, this could cause a significant reduction in demand for our services and solar energy systems and energy storage systems or otherwise adversely affect our business, financial condition and results of operations.
Compliance with occupational safety and health requirements and best practices can be costly and noncompliance with such requirements may result in potentially significant monetary penalties, operational delays and adverse publicity.
The installation and ongoing operations and maintenance of solar energy systems and energy storage systems requires individuals hired by us, our dealers or third-party contractors, potentially including our employees, to work at heights with complicated and potentially dangerous electrical systems. The evaluation and modification of buildings as part of the installation process requires these individuals to work in locations that may contain potentially dangerous levels of asbestos, lead, mold or other materials known or believed to be hazardous to human health. There is substantial risk of serious injury or death if proper safety procedures are not followed. Our operations are subject to regulation under the U.S. Occupational Safety and Health Act (“OSHA”), the U.S. Department of Transportation (“DOT”) regulations and equivalent state and local laws. Changes to OSHA or DOT requirements, or stricter interpretation or enforcement of existing laws or regulations, could result in increased costs. If we fail to comply with applicable OSHA or DOT regulations, even if no work-related serious injury or death occurs, we may be subject to civil or criminal enforcement and be required to pay substantial penalties, incur significant capital expenditures or suspend or limit operations. Because individuals hired by us or on our behalf to perform installation and ongoing operations and maintenance of our solar energy systems and energy storage systems, including our dealers and third-party contractors, are compensated on a per project basis, they are incentivized to work more quickly than installers compensated on an hourly basis. While we have not experienced a high level of injuries to date, this incentive structure may result in higher injury rates than others in the industry and could accordingly expose us to increased liability. Individuals hired by or on behalf of us may have workplace accidents and receive citations from OSHA regulators for alleged safety violations, resulting in fines. Any such accidents, citations, violations, injuries or failure to comply with industry best practices may subject us to adverse publicity, damage our reputation and competitive position and adversely affect our business.
A failure to comply with laws and regulations relating to interactions by us or our dealers with current or prospective residential customers could result in negative publicity, claims, investigations and litigation and adversely affect our financial performance.
Our business substantially focuses on solar service agreements and transactions with residential customers. We and our dealers must comply with numerous federal, state and local laws and
58
Table of Contents
regulations that govern matters relating to interactions with residential consumers, including those pertaining to consumer protection, marketing and sales, privacy and data security, consumer financial and credit transactions, mortgages and refinancings, home improvement contracts, warranties and various means of customer solicitation. These laws and regulations are dynamic and subject to potentially differing interpretations and various federal, state and local legislative and regulatory bodies may initiate investigations, expand current laws or regulations, or enact new laws and regulations regarding these matters. Changes in these laws or regulations or their interpretation could dramatically affect how we and our dealers do business, acquire customers and manage and use information collected from and about current and prospective customers and the costs associated therewith. We and our dealers strive to comply with all applicable laws and regulations relating to interactions with residential customers. It is possible, however, these requirements may be interpreted and applied in a manner inconsistent from one jurisdiction to another and may conflict with other rules or the practices of us or our dealers.
Although we require our dealers to meet our consumer compliance requirements and provide regular training to help them do so, we do not control our dealers and their suppliers or their business practices. Accordingly, we cannot guarantee they follow ethical business practices such as fair wage practices and compliance with environmental, safety and other local laws. A lack of demonstrated compliance could lead us to seek alternative dealers or suppliers, which could increase our costs and have a negative effect on our business and prospects for growth. Violation of labor or other laws by our dealers or suppliers or the divergence of a dealer or supplier’s labor or other practices from those generally accepted as ethical in the U.S. or other markets in which we do or intend to do business could also attract negative publicity for us and harm our business.
Violations of anti-bribery, anti-corruption and/or international trade laws to which we are subject could have a material adverse effect on our business operations, financial position and results of operations.
We are subject to laws concerning our business operations and marketing activities in the U.S. and its territories where we conduct business. Further, we are subject to the U.S. Foreign Corrupt Practices Act, which generally prohibits companies and their intermediaries from making improper payments to non-U.S. government officials for the purpose of obtaining or retaining business. We currently only operate in the U.S. and its territories. However, in the future we may conduct business outside of the U.S. and operate in parts of the world that experienced governmental corruption to some degree and, in certain circumstances, strict compliance with anti-bribery laws may conflict with local customs and practices. In addition, due to the level of regulation in our industry, our entry into new jurisdictions through internal growth or acquisitions requires substantial government contact where norms can differ from U.S. standards. Additionally, we regularly interact with domestic municipalities and municipal-owned centralized electric utilities. We will consider our interactions with these domestic governmental bodies when designing our policies and procedures and conducting training designed to facilitate compliance with domestic and international anti-bribery laws. Although we believe these policies and procedures will mitigate the risk of violations of such laws, our employees, dealers and agents may take actions in violation of our policies and anti-bribery laws. Any such violation, even if prohibited by our policies, could subject us to criminal or civil penalties or other sanctions, which could have a material adverse effect on our business, financial condition, cash flows and reputation.
Violations of export control and/or economic sanctions laws and regulations to which we are subject could have a material adverse effect on our business operations, financial position and results of operations.
Our products may be subject to export control regulations, including the Export Administration Regulations administered by the U.S. Department of Commerce’s Bureau of Industry and Security. We
59
Table of Contents
are also subject to foreign assets control and economic sanctions regulations administered by the U.S. Department of the Treasury’s Office of Foreign Assets Control, which restrict or prohibit our ability to transact with certain foreign countries, individuals and entities. We currently only operate in the U.S. and its territories. However, export control regulations may restrict our ability to exchange technical information with foreign manufacturers and suppliers and economic sanctions regulations may restrict our ability to source from certain suppliers. In addition, in the future we may conduct business outside of the U.S. We will consider these scenarios when designing our policies and procedures and conducting training designed to facilitate compliance with U.S. export control and economic sanctions laws and regulations. Although we believe these policies and procedures will mitigate the risk of violations of such laws, our employees, dealers and agents may take actions in violation of our policies or these laws. Any such violation, even if prohibited by our policies, could subject us to criminal or civil penalties or other sanctions, which could have a material adverse effect on our business, financial condition, cash flows and reputation.
Risks Related to This Offering and Our Common Stock
We do not intend to pay, and our credit facilities currently prohibit us from paying, cash dividends on our common stock and, consequently, your only opportunity to achieve a return on your investment is if the price of our common stock appreciates.
We do not plan to declare dividends on shares of our common stock in the foreseeable future. Additionally, we are currently prohibited from making any cash dividends pursuant to the terms of certain of our credit facilities. Consequently, your only opportunity to achieve a return on your investment in us will be if you sell your common stock at a price greater than you paid for it. There is no guarantee the price of our common stock that will prevail in the market will ever exceed the price you paid for it.
The market price of our common stock could be materially adversely affected by sales of substantial amounts of our common stock in the public markets, including sales by Energy Capital Partners (“ECP”) and other selling stockholders.
As of March 31, 2020, ECP owned approximately 45.6% of our common stock and pro forma for the offering will own 37.0% (or 35.6% if the underwriters exercise in full their option to purchase additional shares of our common stock from certain of the selling stockholders). Sales by ECP or other large stockholders or the perception that such sales might occur could have a material adverse effect on the price of our common stock or could impair our ability to obtain capital through an offering of equity securities.
An active, liquid and orderly trading market for our common stock may not develop and the price of our common stock is volatile and may decline in value.
An active, liquid and orderly trading market for our common stock may not develop. Active, liquid and orderly trading markets usually result in less price volatility and more efficiency in carrying out investors’ purchase and sale orders. The market price for our common stock has experienced substantial price volatility in the past and may remain volatile in the future.
The market price of our common stock may also be influenced by many factors, some of which are beyond our control, including:
| • | public reaction to our press releases, announcements and filings with the SEC; |
| • | our operating and financial performance; |
60
Table of Contents
| • | fluctuations in broader securities market prices and volumes, particularly among securities of technology and solar companies; |
| • | changes in market valuations of similar companies; |
| • | departures of key personnel; |
| • | commencement of or involvement in litigation; |
| • | variations in our quarterly results of operations or those of other technology and solar companies; |
| • | changes in general economic conditions, financial markets or the technology and solar industries; |
| • | announcements by us or our competitors of significant acquisitions or other transactions; |
| • | changes in accounting standards, policies, guidance, interpretations or principles; |
| • | speculation in the press or investment community; |
| • | actions by our stockholders; |
| • | the failure of securities analysts to cover our common stock or changes in their recommendations and estimates of our financial performance; |
| • | future sales of our common stock; and |
| • | the other factors described in these “Risk Factors”. |
If securities or industry analysts do not publish research or reports about our business, or if they issue an adverse or misleading opinion regarding our common stock, our common stock price and trading volume could decline.
The trading market for our common stock is influenced by the research and reports that industry or securities analysts publish about us or our business. If one or more of the analysts currently covering our common stock ceases coverage of us, the trading price for our common stock would be negatively impacted. If any of the analysts who cover us issue an adverse or misleading opinion regarding us, our business model, our intellectual property or our common stock performance, or if our operating results fail to meet the expectations of analysts, our common stock price would likely decline. If one or more of these analysts cease coverage of us or fail to publish reports on us regularly, we could lose visibility in the financial markets, which in turn could cause our common stock price or trading volume to decline.
If we fail to comply with the reporting requirements under the Exchange Act or maintain adequate internal control over financial reporting in accordance with Section 404 of the Sarbanes-Oxley Act, it could result in late or non-compliant filings or inaccurate financial reporting and have a negative impact on the price of our common stock or our business.
Effective internal controls are necessary for us to provide timely, reliable financial reporting and prevent fraud. Our accounting predecessor was not a public company and was not required to comply with the reporting requirements of the Exchange Act, or with the standards adopted by the Public Company Accounting Oversight Board in compliance with the requirements of Section 404 of the Sarbanes-Oxley Act regarding internal controls over financial reporting. As a public company, we are required to report our financial results on the timeline and in the form prescribed by the Exchange Act and to evaluate and report on our internal control over financial reporting. This requires management to certify financial and other information in our quarterly and annual reports and provide an annual management report on the effectiveness of internal control over financial reporting.
61
Table of Contents
Though we will be required to disclose material changes made in our internal controls and procedures on a quarterly basis, we will not be required to make our first annual assessment of our internal control over financial reporting pursuant to Section 404 until the year following our first annual report required to be filed with the SEC. Pursuant to the Jumpstart Our Business Startups Act, our independent registered public accounting firm will not be required to attest to the effectiveness of our internal control over financial reporting until the year following our first annual report required to be filed with the SEC. We cannot assure you we will not in the future have material weaknesses or significant deficiencies. Material weaknesses and significant deficiencies may exist when we report on the effectiveness of our internal control over financial reporting as required by reporting requirements under Section 404 of the Sarbanes-Oxley Act of 2002, or the Sarbanes-Oxley Act.
The process of documenting and further developing our internal controls to become compliant with Section 404 will take a significant amount of time and effort to complete and will require significant attention of management. Completing implementation of new controls, documentation of our internal control system and financial processes, remediation of control deficiencies and management testing of internal controls will require substantial effort by us. We may experience higher than anticipated operating expenses, as well as increased independent auditor and other fees and expenses during the implementation of these changes and thereafter.
Certain of our directors have significant duties with, and spend significant time serving, entities that may compete with us in seeking business opportunities and, accordingly, may have conflicts of interest in allocating time or pursuing business opportunities.
Certain of our directors, who are responsible for managing the direction of our operations and acquisition activities, hold positions of responsibility with other entities whose businesses are similar to our business. The existing positions held by these directors may give rise to fiduciary or other duties in conflict with the duties they owe to us. These directors may become aware of business opportunities that may be appropriate for presentation to us as well as to the other entities with which they are or may become affiliated. Due to these existing and potential future affiliations, they may present potential business opportunities to other entities prior to presenting them to us, which could cause additional conflicts of interest. They may also decide certain opportunities are more appropriate for other entities with which they are affiliated and as a result, they may elect not to present those opportunities to us. These conflicts may not be resolved in our favor.
Conflicts of interest could arise in the future between us, on the one hand, and any of our stockholders and its affiliates and affiliated funds and its and their current and future portfolio companies on the other hand, concerning, among other things, potential competitive business activities or business opportunities.
Conflicts of interest could arise in the future between us, on the one hand, and any of our stockholders and its affiliates and affiliated funds and its and their current and future portfolio companies, on the other hand, concerning, among other things, potential competitive business activities or business opportunities. For example, certain of our existing investors and their affiliated funds may invest in companies that operate in the traditional energy industry and solar and other renewable industries. As a result, our existing investors and their affiliates’ and affiliated funds’ current and future portfolio companies which they control may now, or in the future, directly or indirectly, compete with us for investment or business opportunities.
Our governing documents provide that our stockholders and their affiliates and affiliated funds are not restricted from owning assets or engaging in businesses that compete directly or indirectly with us and will not have any duty to refrain from engaging, directly or indirectly, in the same or similar business activities or lines of business as us, including those business activities or lines of business
62
Table of Contents
deemed to be competing with us, or doing business with any of our clients, customers or vendors. In particular, subject to the limitations of applicable law, our certificate of incorporation, among other things:
| • | permits stockholders or their affiliates and affiliated funds and our non-employee directors to conduct business that competes with us and to make investments in any kind of property in which we may make investments; and |
| • | provides that if any of our stockholders or any of its affiliates who is also one of our non-employee directors becomes aware of a potential business opportunity, transaction or other matter, they will have no duty to communicate or offer that opportunity to us. |
Our stockholders or their affiliates or affiliated funds may become aware, from time to time, of certain business opportunities (such as acquisition opportunities) and may direct such opportunities to other businesses in which they have invested, in which case we may not become aware of or otherwise have the ability to pursue such opportunity. Further, such businesses may choose to compete with us for these opportunities, possibly causing these opportunities to not be available to us or causing them to be more expensive for us to pursue. In addition, our stockholders or their affiliates and affiliated funds may dispose of their interests in energy infrastructure or other renewable companies or other assets in the future, without any obligation to offer us the opportunity to purchase any of those assets. As a result, our renouncing our interest and expectancy in any business opportunity that may be from time to time presented to any of our stockholders or their affiliates and affiliated funds could adversely impact our business or prospects if attractive business opportunities are procured by such parties for their own benefit rather than for ours.
In any of these matters, the interests of our existing stockholders and their affiliates and affiliated funds may differ or conflict with the interests of our other shareholders. Any actual or perceived conflicts of interest with respect to the foregoing could have an adverse impact on the trading price of our common stock.
Control of our common stock by current stockholders is expected to remain significant.
Currently, our key stockholders directly and indirectly beneficially own a majority of our outstanding common stock. As a result, these affiliates have the ability to exercise significant influence over matters submitted to our stockholders for approval, including the election and removal of directors, amendments to our certificate of incorporation and bylaws and the approval of any business combination. This concentration of ownership may also have the effect of delaying or preventing a change of control of our company or discouraging others from making tender offers for our shares, which could prevent our stockholders from receiving an offer premium for their shares.
So long as the key stockholders continue to control a significant amount of our common stock, they will continue to be able to strongly influence all matters requiring stockholder approval, regardless of whether or not other stockholders believe a potential transaction is in their own best interests. In any of these matters, the interests of the key stockholders may differ or conflict with the interests of our other stockholders. In addition, certain of the key stockholders may, from time to time, acquire interests in businesses that directly or indirectly compete with our business, as well as businesses that are significant existing or potential customers. Certain of the key stockholders may acquire or seek to acquire assets we seek to acquire and, as a result, those acquisition opportunities may not be available to us or may be more expensive for us to pursue. Moreover, this concentration of stock ownership may also adversely affect the trading price of our common stock to the extent investors perceive a disadvantage in owning stock of a company with controlling stockholders.
63
Table of Contents
Provisions of our charter documents and Delaware law may inhibit a takeover, which could limit the price investors might be willing to pay in the future for our common stock.
Our charter documents authorize our board of directors to issue preferred stock without stockholder approval and, relatedly, may have the effect of delaying or preventing an acquisition of us or a merger in which we are not the surviving company and may otherwise prevent or slow changes in our board of directors and management. In addition, some provisions of our certificate of incorporation, amended and restated bylaws and stockholders’ agreement could make it more difficult for a third party to acquire control of us, even if the change of control would be beneficial to our stockholders, including:
| • | limitations on changes of control and business combinations; |
| • | limitations on the removal of directors; |
| • | limitations on the ability of our stockholders to call special meetings; |
| • | establishing advance notice provisions for stockholder proposals and nominations for elections to the board of directors to be acted upon at meetings of stockholders; |
| • | providing that the board of directors is expressly authorized to adopt, or to alter or repeal our bylaws; and |
| • | establishing advance notice and certain information requirements for nominations for election to our board of directors or for proposing matters that can be acted upon by stockholders at stockholder meetings. |
These provisions could discourage an acquisition of us or other change in control transactions and thereby negatively affect the price that investors might be willing to pay in the future for our common stock.
Our second amended and restated certificate of incorporation designates the Court of Chancery of the State of Delaware and, to the extent enforceable, the federal district courts of the United States of America as the sole and exclusive forum for certain types of actions and proceedings that may be initiated by our stockholders, which could limit our stockholders’ ability to obtain a favorable judicial forum for disputes with us or our directors, officers, employees or agents.
Our second amended and restated certificate of organization provides that, unless we consent in writing to the selection of an alternative forum, the sole and exclusive forum for (a) any derivative action or proceeding brought on our or our stockholders’ behalf, (b) any action asserting a claim of breach of a fiduciary duty owed by any of our current or former directors, officers, employees, agents and stockholders to us or our stockholders, (c) any action asserting a claim arising pursuant to any provision of the Delaware General Corporation Law, our second amended and restated certificate of incorporation or our second amended and restated bylaws, (d) any action as to which the Delaware General Corporation Law confers jurisdiction to the Court of Chancery of the State of Delaware, or (e) any other action asserting a claim that is governed by the internal affairs doctrine shall be the Court of Chancery of the State of Delaware. Our second amended and restated certificate of incorporation also provides that, to the fullest extent permitted by applicable law, the federal district courts of the U.S. are the exclusive forum for resolving any complaint asserting a cause of action arising under the Securities Act, subject to and contingent upon a final adjudication in the State of Delaware of the enforceability of such exclusive forum provision.
Notwithstanding the foregoing, the exclusive forum provision does not apply to suits brought to enforce any liability or duty created by the Exchange Act or any other claim for which the federal courts have exclusive jurisdiction. Any person or entity purchasing or otherwise acquiring an interest in any
64
Table of Contents
shares of our capital stock shall be deemed to have notice of and to have consented to the forum provisions in our second amended and restated certificate of incorporation. These choice-of-forum provisions may limit a stockholder’s ability to bring a claim in a judicial forum that he, she or it believes to be favorable for disputes with us or our directors, officers or other employees, which may discourage such lawsuits. Alternatively, if a court were to find these provisions of our second amended and restated certificate of incorporation inapplicable or unenforceable with respect to one or more of the specified types of actions or proceedings, we may incur additional costs associated with resolving such matters in other jurisdictions, which could materially adversely affect our business, financial condition and results of operations and result in a diversion of the time and resources of our management and board of directors. For example, the Court of Chancery of the State of Delaware recently determined a provision stating that U.S. federal district courts are the exclusive forum for resolving any complaint asserting a cause of action arising under the Securities Act is not enforceable.
Future issuances or sales of our common stock in the public market or otherwise, or the perception that such sales may occur, could reduce our stock price, and any additional capital raised by us through the sale of equity or convertible securities may dilute your ownership in us.
We may raise additional capital through the issuance of equity or debt in the future. In that event, the ownership of our existing stockholders would be diluted and the value of the stockholders’ equity in common stock could be reduced. If we raise more equity capital from the sale of common stock, institutional or other investors may negotiate terms more favorable than the current prices of our common stock. If we issue debt securities, the holders of the debt would have a claim to our assets that would be prior to the rights of stockholders until the debt is paid. Interest on these debt securities would increase costs and could negatively impact operating results.
In accordance with Delaware law and the provisions of our charter documents, we may issue preferred stock that ranks senior in right of dividends, liquidation or voting to our common stock. The issuance by us of such preferred stock may (a) reduce or eliminate the amount of cash available for payment of dividends to our holders of common stock, (b) diminish the relative voting strength of the total shares of common stock outstanding as a class, or (c) subordinate the claims of our holders of common stock to our assets in the event of our liquidation. Our second amended and restated certificate of incorporation does not provide stockholders the pre-emptive right to buy shares from us. As a result, stockholders will not have the automatic ability to avoid dilution in their percentage ownership of us.
We cannot predict the size of future issuances of our common stock (including by conversion of our convertible notes) or securities convertible into common stock or the effect, if any, that future issuances and sales of shares of our common stock will have on the market price of our common stock. Issuances or sales of substantial amounts of our common stock (including shares issued in connection with an acquisition), or the perception that such issuances or sales could occur, may adversely affect prevailing market prices of our common stock.
The underwriters of this offering may waive or release parties to the lock-up agreements entered into in connection with this offering, which could adversely affect the price of our common stock.
We, the selling stockholders, QSIP LP and each of our directors and executive officers have entered or will enter into lock-up agreements with respect to their common stock, pursuant to which they are subject to certain resale restrictions for a period of 90 days following the date of this prospectus subject to certain exceptions. The underwriters, at any time and without notice, may release all or any portion of the common stock subject to the foregoing lock-up agreements. If the restrictions under the lock-up agreements are waived, then common stock will be available for sale into the public markets, which could cause the market price of our common stock to decline and impair our ability to raise capital.
65
Table of Contents
Risks Related to Taxation
Our ability to use net operating loss carryforwards (“NOLs”) and tax credit carryforwards to offset future income taxes is subject to limitation and the amount of such carryforwards may be subject to challenge or reduction.
As of March 31, 2020, we had approximately $1.0 billion of U.S. federal NOLs, a portion of which will begin to expire in 2032 and approximately $255.7 million of U.S. federal tax credit carryforwards, which begin to expire in 2033. Utilization of our NOLs and tax credit carryforwards depends on many factors, including having current or future taxable income, which cannot be assured. In addition, Section 382 of the Code generally imposes an annual limitation on the amount of NOLs that may be used to offset taxable income by a corporation that has undergone an “ownership change” (as determined under Section 382). An ownership change generally occurs if one or more stockholders (or groups of stockholders, including one or more groups of public stockholders) that are each deemed to own at least 5% of our stock increase their ownership percentage by more than 50 percentage points over their lowest ownership percentage during a rolling three-year period. Similar rules under Section 383 of the Code impose an annual limitation on the amount of tax credit carryforwards, including carryforwards of Section 48(a) ITCs, that may be used to offset U.S. federal income taxes.
We experienced an ownership change under Sections 382 and 383 of the Code prior to our IPO that subjected our NOLs and tax credit carryforwards existing at that time to limitations under those sections. Another ownership change could occur as a result of transactions that increase the ownership percentage of any of our 5% stockholders during a rolling three-year period, including redemptions of our stock, sales of our stock by other deemed 5% stockholders or issuances of stock by us, whether in our IPO, additional public offerings or otherwise. If such another ownership change occurs with respect to our stock, our ability to utilize NOLs and tax credit carryforwards may be subject to further limitation under Sections 382 and 383 of the Code. The application of the aforementioned limitations may cause U.S. federal income taxes to be paid by us earlier than they otherwise would be paid if such limitations were not in effect and could cause such NOLs and tax credit carryforwards to expire unused, in each case reducing or eliminating the benefit of such NOLs and tax credit carryforwards. To the extent we are not able to offset our future taxable income with our NOLs or offset future taxes with our tax credit carryforwards, this would adversely affect our operating results and cash flows if we have taxable income in the future. These same risks can arise in the context of state income and franchise tax given many states conform to federal law and rely on federal authority for determining state NOLs.
Furthermore, the IRS or other tax authorities could successfully challenge one or more tax positions we take, such as the classification of assets under the income tax depreciation rules or the characterization of expenses for income tax purposes, which could reduce the NOLs we generate and/or are able to use.
Our tax positions are subject to challenge by the relevant tax authority.
Our federal and state tax positions may be challenged by the relevant tax authority. The process and costs, including potential penalties for nonpayment of disputed amounts, of contesting such challenges, administratively or judicially, regardless of the merits, could be material. Future tax audits or challenges by tax authorities to our tax positions may result in a material increase in our estimated future income tax or other tax liabilities, which would negatively impact our financial condition.
For example, many of our solar energy systems are located in states or territories that exempt such assets from state, territorial and local sales and property taxes. We believe these solar energy systems are and should continue to be exempt from certain state, territorial and local sales and
66
Table of Contents
property taxes; however, some of our solar energy systems are located in certain jurisdictions where the applicability of these exemptions to solar energy systems is the subject of ongoing litigation and possible legislative change or else the jurisdiction’s law is uncertain regarding the effect on property and sales tax exemptions of certain complex business reorganizations undergone by us and our subsidiaries. As such, some tax authorities could challenge the availability of these exemptions. If our solar energy systems are determined to be subject to state, territorial or local sales or property taxes, it could negatively impact our financial condition.
Recent tax legislation and future changes in law could adversely affect our business.
The 2017 Tax Act significantly changed the Code, including the taxation of U.S. corporations, by, among other things, reducing the U.S. corporate income tax rate, accelerating the expensing of certain capital expenditures, adopting elements of a territorial tax system and introducing certain anti-base erosion provisions. Further, the 2017 Tax Act generally (a) limits our annual deductions for interest expense to no more than 30% of our “adjusted taxable income” (plus 100% of our business interest income) for the year and (b) permits us to offset only 80% (rather than 100%) of our taxable income with any NOLs we generate after 2017 with an indefinite carryforward. Since the enactment of the 2017 Tax Act, NOLs generally could not be carried back but could be carried forward indefinitely.
The CARES Act changed the Code by temporarily relaxing the 2017 Tax Act limitations in certain respects. The CARES Act temporarily removes the 80% NOL limitation, reinstating it for tax years beginning after 2020, and permits eligible taxpayers to carry back NOLs five years to claim refunds on prior tax returns. In eligible tax years, corporate taxpayers may use NOLs to fully offset taxable income, rather than 80% of taxable income. The combined impact on NOL utilization may reduce the demand for tax equity and may adversely impact our business.
The 2017 Tax Act is unclear in certain respects and will require interpretations and implementing regulations by the IRS and the legislation could be subject to potential amendments and technical corrections, any of which could lessen or increase certain adverse impacts of the legislation. As states elect to conform (or else have rolling conformity) to the Code, such interpretations, regulations, amendments and corrections (including those promulgated by state authorities) could likewise affect our state income and franchise tax obligations. Any of the foregoing changes arising from the 2017 Tax Act, as well as other changes in law not mentioned herein, could adversely impact our business. Furthermore, any future changes in law could affect our tax position and adversely impact our business.
If the IRS or the United States Treasury Department makes a determination that the fair market value of our solar energy systems is materially lower than what we have reported in our tax equity vehicles’ tax returns, we may have to pay significant amounts to our tax equity vehicles, our tax equity investors and/or the U.S. government. Such determinations could have a material adverse effect on our business and financial condition.
The basis of our solar energy systems we report in our tax equity vehicles’ tax returns to claim the Section 48(a) ITC is based on the appraised fair market value of our solar energy systems. The IRS continues to scrutinize fair market value determinations industry-wide. We are not aware of any IRS audits or results of audits related to our appraisals or fair market value determinations of any of our tax equity vehicles. If as part of an examination the IRS were to review the fair market value we used to establish our basis for claiming Section 48(a) ITCs and successfully assert the Section 48(a) ITCs previously claimed should be reduced, we would owe certain of our tax equity vehicles or our tax equity investors an amount equal to 30% of each investor’s share of the difference between the fair market value used to establish our basis for claiming Section 48(a) ITCs and the adjusted fair market value determined by the IRS, plus any costs and expenses associated with a challenge to that fair market
67
Table of Contents
value, plus a gross up to pay for additional taxes. We could also be subject to tax liabilities, including interest and penalties, based on our share of claimed Section 48(a) ITCs. To date, we have not been required to make such payments under any of our tax equity vehicles. We have obtained insurance coverage with respect to certain losses that may be incurred should the Section 48(a) ITCs previously claimed with respect to our tax equity vehicles be reduced. Any such losses could be outside the scope of these insurance policies or exceed insurance policy limits and we could incur unforeseen costs that could harm our business and financial condition.
If our solar energy systems either cease to be qualifying property or undergo certain changes in ownership within five years of the applicable placed in service date, we may have to pay significant amounts to our tax equity vehicles, our tax equity investors and/or the U.S. government. Such recapture could have a material adverse effect on our business and financial condition.
The Section 48(a) ITCs are subject to recapture under the Code if a solar energy system either ceases to be qualifying property or undergoes certain changes in ownership within five years of its placed in service date. The amount of Section 48(a) ITCs subject to recapture decreases by 20% of the claimed amount on each anniversary of a solar energy system’s placed in service date. If such a recapture event were to occur, we could owe certain of our tax equity vehicles or our tax equity investors an amount equal to such vehicles’ or investors’ share of the Section 48(a) ITCs that were recaptured. We could also be subject to tax liabilities, including interest and penalties, based on our share of recaptured Section 48(a) ITCs. To date, none of the Section 48(a) ITCs claimed with respect to our solar energy systems have been recaptured. Any such recapture could have a material adverse effect on our business and financial condition.
68
Table of Contents
CAUTIONARY LANGUAGE REGARDING FORWARD-LOOKING STATEMENTS
This prospectus contains forward-looking statements within the meaning of Section 27A of the Securities Act of 1933, as amended (the “Securities Act”). These statements generally relate to future events or our future financial or operating performance. Actual outcomes and results may differ materially from what is expressed or forecast in such forward-looking statements. In some cases, you can identify these statements because they contain words such as “may,” “will,” “likely,” “should,” “expect,” “anticipate,” “could,” “contemplate,” “target,” “future,” “plan,” “believe,” “intend,” “goal,” “seek,” “estimate,” “project,” “target,” “predict,” “potential,” “continue” or the negative of these words or other similar terms or expressions that concern our expectations, strategy, plans or intentions. Forward-looking statements contained in this prospectus include, but are not limited to, statements about:
| • | the effects of the COVID-19 pandemic on our business and operations, results of operations and financial position; |
| • | federal, state and local statutes, regulations and policies; |
| • | determinations of the IRS of the fair market value of our solar energy systems; |
| • | the price of centralized utility-generated electricity and electricity from other sources and technologies; |
| • | technical and capacity limitations imposed by operators of the power grid; |
| • | the availability of tax rebates, credits and incentives, including changes to the rates of, or expiration of, federal tax credits and the availability of related safe harbors; |
| • | our need and ability to raise capital to finance the installation and acquisition of distributed residential solar energy systems, refinance existing debt or otherwise meet our liquidity needs; |
| • | our expectations concerning relationships with third parties, including the attraction, retention and continued existence of our dealers; |
| • | our ability to manage our supply chains and distribution channels and the impact of natural disasters and other events beyond our control, such as the COVID-19 pandemic; |
| • | our ability to retain or upgrade current customers, further penetrate existing markets or expand into new markets; |
| • | our investment in our platform and new product offerings and the demand for and expected benefits of our platform and product offerings; |
| • | the ability of our solar energy systems, energy storage systems or other product offerings to operate or deliver energy for any reason, including if interconnection or transmission facilities on which we rely become unavailable; |
| • | our ability to maintain our brand and protect our intellectual property and customer data; |
| • | our ability to manage the cost of solar energy systems, energy storage systems and our service offerings; |
| • | the willingness of and ability of our dealers and suppliers to fulfill their respective warranty and other contractual obligations; |
| • | our expectations regarding litigation and administrative proceedings; and |
| • | our ability to renew or replace expiring, cancelled or terminated solar service agreements at favorable rates or on a long-term basis. |
We caution you that the foregoing list may not contain all of the forward-looking statements made in this prospectus.
You should not rely upon forward-looking statements as predictions of future events. We have based the forward-looking statements contained in this prospectus primarily on our current
69
Table of Contents
expectations and projections about future events and trends that we believe may affect our business, financial condition, results of operations and prospects. The outcome of the events described in these forward-looking statements is subject to risks, uncertainties and other factors described in the section titled “Risk Factors” in this prospectus. Moreover, we operate in a very competitive and rapidly changing environment. New risks and uncertainties emerge from time to time, and it is not possible for us to predict all risks and uncertainties that could have an impact on the forward-looking statements contained in this prospectus. We cannot assure you that the results, events and circumstances reflected in the forward-looking statements will be achieved or occur, and actual results, events or circumstances could differ materially from those described in the forward-looking statements.
The forward-looking statements made in this prospectus relate only to events as of the date on which the statements are made. We undertake no obligation to update any forward-looking statements made in this prospectus to reflect events or circumstances after the date of this prospectus or to reflect new information or the occurrence of unanticipated events, except as required by law. We may not actually achieve the plans, intentions or expectations disclosed in our forward-looking statements, and you should not place undue reliance on our forward-looking statements. Our forward-looking statements do not reflect the potential impact of any future acquisitions, mergers, dispositions, joint ventures or investments we may make.
Forward-looking statements are based on management’s current expectations and assumptions, and are subject to inherent uncertainties, risks and changes in circumstances that are difficult to predict. As a result, actual results could differ materially from those indicated in these forward-looking statements.
In addition, statements that “we believe” and similar statements reflect our beliefs and opinions on the relevant subject. These statements are based upon information available to us as of the date of this prospectus, and while we believe such information forms a reasonable basis for such statements, such information may be limited or incomplete, and our statements should not be read to indicate that we have conducted an exhaustive inquiry into, or review of, all potentially available relevant information. These statements are inherently uncertain and investors are cautioned not to unduly rely upon these statements.
70
Table of Contents
We obtained the industry, market and competitive position data used throughout this prospectus from our own internal estimates as well as from independent industry publications and research, surveys and studies conducted by third parties or other publicly available information. Industry publications, studies and surveys generally state that they have been obtained from sources believed to be reliable, although they do not guarantee the accuracy or completeness of such information and such information involves a number of assumptions and limitations. We have not commissioned, nor are we affiliated with, any of the independent industry sources we utilized. While we believe our internal company research is reliable and the market definitions are appropriate, neither such research nor these definitions have been verified by any independent source. Estimates of historical growth rates in the markets where we operate are not necessarily indicative of future growth rates in such markets. While we are not aware of any misstatements regarding the market, industry or similar data presented herein, such data involve risks and uncertainties and are subject to change based on various factors, including those discussed under the sections titled “Cautionary Language Regarding Forward-Looking Statements” and “Risk Factors” in this prospectus.
71
Table of Contents
Table of Contents
We currently intend to retain all available funds and any future earnings for use in the operation of our business and do not expect to pay any dividends on our capital stock in the foreseeable future. Any future determination to declare dividends will be made at the discretion of our board of directors, subject to applicable laws, and will depend on a number of factors, including our financial condition, results of operations, capital requirements, contractual restrictions, general business conditions and other factors that our board of directors may deem relevant. In addition, the terms of our borrowing arrangements contain restrictions on payments of dividends, and we may also enter into other borrowing arrangements in the future that will restrict our ability to declare or pay cash dividends on our capital stock.
73
Table of Contents
SELECTED CONSOLIDATED FINANCIAL AND OPERATIONAL DATA
The following selected consolidated financial data should be read in conjunction with “Management’s Discussion and Analysis of Financial Condition and Results of Operations” included elsewhere in this prospectus and our consolidated financial statements and related notes thereto included in our Annual Report on Form 10-K for the year ended December 31, 2019 and our Quarterly Report on Form 10-Q for the quarter ended March 31, 2020. Our historical results are not necessarily indicative of our future results. The selected consolidated financial data in this section are not intended to replace our consolidated financial statements and related notes thereto included in our Annual Report on Form 10-K for the year ended December 31, 2019 and our Quarterly Report on Form 10-Q for the quarter ended March 31, 2020 and are qualified in their entirety by our consolidated financial statements and related notes thereto included elsewhere therein.
Sunnova Energy International Inc. was incorporated on April 1, 2019 and had limited historical financial operating results prior to the IPO. Following the IPO, SEI became the sole stockholder of Sunnova Energy Corporation. As a result, SEI consolidates the financial results of Sunnova Energy Corporation and its subsidiaries. For periods prior to the completion of the IPO, the following table shows selected consolidated historical financial data of our accounting predecessor, Sunnova Energy Corporation and its subsidiaries, including SEI.
| Three Months Ended March 31, |
Year Ended December 31, | |||||||||||||||||||
| 2020 | 2019 | 2019 | 2018 | 2017 | ||||||||||||||||
| (Unaudited) | ||||||||||||||||||||
| (in thousands, except per share amounts) | ||||||||||||||||||||
| Consolidated Statements of Operations Data: |
||||||||||||||||||||
| Revenue |
$ | 29,829 | $ | 26,715 | $ | 131,556 | $ | 104,382 | $ | 76,856 | ||||||||||
| Operating expenses: |
||||||||||||||||||||
| Cost of revenue—depreciation |
12,986 | 9,653 | 43,536 | 34,710 | 25,896 | |||||||||||||||
| Cost of revenue—other |
1,043 | 652 | 3,877 | 2,007 | 1,444 | |||||||||||||||
| Operations and maintenance |
2,219 | 2,254 | 8,588 | 14,035 | 4,994 | |||||||||||||||
| General and administrative |
27,893 | 18,681 | 97,986 | 67,430 | 54,863 | |||||||||||||||
| Other operating expense (income) |
(6 | ) | (18 | ) | (161 | ) | (70 | ) | 14 | |||||||||||
|
|
|
|
|
|
|
|
|
|
|
|||||||||||
| Total operating expenses, net |
44,135 | 31,222 | 153,826 | 118,112 | 87,211 | |||||||||||||||
|
|
|
|
|
|
|
|
|
|
|
|||||||||||
| Operating loss |
(14,306 | ) | (4,507 | ) | (22,270 | ) | (13,730 | ) | (10,355 | ) | ||||||||||
| Interest expense, net |
67,318 | 31,661 | 108,024 | 51,582 | 59,847 | |||||||||||||||
| Interest expense, net—affiliates |
— | 1,822 | 4,098 | 9,548 | 23,177 | |||||||||||||||
| Interest income |
(4,620 | ) | (2,494 | ) | (12,483 | ) | (6,450 | ) | (3,197 | ) | ||||||||||
| Loss on extinguishment of long-term debt, net—affiliates |
— | — | 10,645 | — | — | |||||||||||||||
| Other (income) expense |
— | — | 880 | (1 | ) | — | ||||||||||||||
|
|
|
|
|
|
|
|
|
|
|
|||||||||||
| Loss before income tax |
(77,004 | ) | (35,496 | ) | (133,434 | ) | (68,409 | ) | (90,182 | ) | ||||||||||
| Income tax |
— | — | — | — | — | |||||||||||||||
|
|
|
|
|
|
|
|
|
|
|
|||||||||||
| Net loss |
(77,004 | ) | (35,496 | ) | (133,434 | ) | (68,409 | ) | (90,182 | ) | ||||||||||
| Net income (loss) attributable to redeemable noncontrolling interests |
(5,929 | ) | 3,018 | 10,917 | 5,837 | 903 | ||||||||||||||
|
|
|
|
|
|
|
|
|
|
|
|||||||||||
| Net loss attributable to stockholders |
$ | (71,075 | ) | $ | (38,514 | ) | $ | (144,351 | ) | $ | (74,246 | ) | $ | (91,085 | ) | |||||
|
|
|
|
|
|
|
|
|
|
|
|||||||||||
| Net loss per share attributable to stockholders—basic and diluted |
$ | (0.85 | ) | $ | (5.87 | ) | $ | (4.14 | ) | $ | (15.74 | ) | $ | (14.05 | ) | |||||
| Weighted average common shares outstanding—basic and diluted |
84,001,151 | 8,635,527 | 40,797,976 | 8,634,477 | 8,632,936 | |||||||||||||||
74
Table of Contents
| Three Months Ended March 31, |
Year Ended December 31, | |||||||||||||||||||
| 2020 | 2019 | 2019 | 2018 | 2017 | ||||||||||||||||
| (Unaudited, in thousands, except for per customer amounts) |
||||||||||||||||||||
| Cash Flow Data: |
||||||||||||||||||||
| Net cash used in operating activities |
$ | (58,112 | ) | $ | (24,430 | ) | $ | (170,262 | ) | $ | (11,570 | ) | $ | (48,967 | ) | |||||
| Net cash used in investing activities |
(184,315 | ) | (92,680 | ) | $ | (568,316 | ) | $ | (348,849 | ) | $ | (289,133 | ) | |||||||
| Net cash provided by financing activities |
261,372 | 109,351 | $ | 801,823 | $ | 365,687 | $ | 369,893 | ||||||||||||
|
|
|
|
|
|
|
|
|
|
|
|||||||||||
| Net increase (decrease) in cash and restricted cash |
$ | 18,945 | $ | (7,759 | ) | $ | 63,245 | $ | 5,268 | $ | 31,793 | |||||||||
|
|
|
|
|
|
|
|
|
|
|
|||||||||||
| Other Financial Data:(1) |
||||||||||||||||||||
| Adjusted EBITDA |
$ | 6,190 | $ | 8,068 | $ | 48,297 | $ | 41,119 | $ | 23,404 | ||||||||||
| Interest income from customer notes receivable |
$ | 4,372 | $ | 2,328 | $ | 11,588 | $ | 6,147 | $ | 3,003 | ||||||||||
| Principal proceeds from customer notes receivable, net of related revenue |
$ | 6,378 | $ | 3,429 | $ | 20,044 | $ | 6,812 | $ | 2,360 | ||||||||||
| Adjusted Operating Cash Flow |
$ | (20,070 | ) | $ | (15,930 | ) | $ | 6,417 | $ | (10,565 | ) | $ | (41,710 | ) | ||||||
| Adjusted Operating Expense |
$ | 23,639 | $ | 18,647 | $ | 83,259 | $ | 63,264 | $ | 53,452 | ||||||||||
| Adjusted Operating Expense per weighted average customer |
$ | 289 | $ | 301 | $ | 1,215 | $ | 1,185 | $ | 1,378 | ||||||||||
| (1) | Adjusted EBITDA, Adjusted Operating Cash Flow, Adjusted Operating Expense and Adjusted Operating Expense per weighted average customer are not financial measures calculated or presented in accordance with GAAP. See “—Non-GAAP Reconciliation” for information regarding our use of these non-GAAP financial measures and reconciliations of each such measure to its most directly comparable GAAP equivalent. |
| As of March 31, 2020 |
As of December 31, | |||||||||||||||
| 2019 | 2018 | 2017 | ||||||||||||||
| (Unaudited) | ||||||||||||||||
| (in thousands) |
||||||||||||||||
| Consolidated Balance Sheet Data: |
||||||||||||||||
| Total current assets |
$ | 279,956 | $ | 274,320 | $ | 89,533 | $ | 81,277 | ||||||||
| Property and equipment, net |
$ | 1,884,576 | $ | 1,745,060 | $ | 1,328,457 | $ | 1,113,073 | ||||||||
| Total assets |
$ | 2,682,180 | $ | 2,487,067 | $ | 1,665,085 | $ | 1,328,788 | ||||||||
| Long-term debt, net (excluding debt with affiliates) |
$ | 1,511,555 | $ | 1,346,419 | $ | 872,249 | $ | 723,697 | ||||||||
| Total liabilities |
$ | 1,847,733 | $ | 1,668,827 | $ | 1,078,287 | $ | 919,015 | ||||||||
| Total stockholders’ equity |
$ | 592,020 | $ | 645,935 | $ | 501,118 | $ | 371,183 | ||||||||
Non-GAAP Reconciliation:
Adjusted EBITDA. We define Adjusted EBITDA as net income (loss) plus net interest expense, depreciation and amortization expense, income tax expense, financing deal costs, natural disaster losses and related charges, net, amortization of payments to dealers for exclusivity and other bonus arrangements, legal settlements and excluding the effect of certain non-recurring items we do not consider to be indicative of our ongoing operating performance such as, but not limited to, costs of our IPO, losses on unenforceable contracts, losses on extinguishment of long-term debt, realized and unrealized gains and losses on fair value option instruments and other non-cash items such as non-cash compensation expense, ARO accretion expense and provision for current expected credit losses. We began recognizing current expected credit losses in the first quarter of 2020 as a result of the adoption of Accounting Standards Update No. 2016-13, Financial Instruments—Credit Losses.
75
Table of Contents
Adjusted EBITDA is a non-GAAP financial measure we use as a performance measure. We believe investors and securities analysts also use Adjusted EBITDA in evaluating our operating performance. This measurement is not recognized in accordance with GAAP and should not be viewed as an alternative to GAAP measures of performance. The GAAP measure most directly comparable to Adjusted EBITDA is net income (loss). The presentation of Adjusted EBITDA should not be construed to suggest our future results will be unaffected by non-cash or non-recurring items. In addition, our calculation of Adjusted EBITDA is not necessarily comparable to Adjusted EBITDA as calculated by other companies.
We believe Adjusted EBITDA is useful to management, investors and analysts in providing a measure of core financial performance adjusted to allow for comparisons of results of operations across reporting periods on a consistent basis. These adjustments are intended to exclude items that are not indicative of the ongoing operating performance of the business. Adjusted EBITDA is also used by our management for internal planning purposes, including our consolidated operating budget, and by our board of directors in setting performance-based compensation targets. Adjusted EBITDA should not be considered an alternative to but viewed in conjunction with GAAP results, as we believe it provides a more complete understanding of ongoing business performance and trends than GAAP measures alone. Adjusted EBITDA has limitations as an analytical tool, and you should not consider it in isolation or as a substitute for analysis of our results as reported under GAAP.
| Three Months Ended March 31, |
Year Ended December 31, |
|||||||||||||||||||
| 2020 | 2019 | 2019 | 2018 | 2017 | ||||||||||||||||
| (Unaudited, in thousands) |
||||||||||||||||||||
| Reconciliation of Net Loss to Adjusted EBITDA: |
||||||||||||||||||||
| Net loss |
$ | (77,004 | ) | $ | (35,496 | ) | $ | (133,434 | ) | $ | (68,409 | ) | $ | (90,182 | ) | |||||
| Interest expense, net |
67,318 | 31,661 | 108,024 | 51,582 | 59,847 | |||||||||||||||
| Interest expense, net—affiliates |
— | 1,822 | 4,098 | 9,548 | 23,177 | |||||||||||||||
| Interest income |
(4,620 | ) | (2,494 | ) | (12,483 | ) | (6,450 | ) | (3,197 | ) | ||||||||||
| Depreciation expense |
14,946 | 11,012 | 49,340 | 39,290 | 29,482 | |||||||||||||||
| Amortization expense |
9 | 5 | 29 | 133 | 133 | |||||||||||||||
|
|
|
|
|
|
|
|
|
|
|
|||||||||||
| EBITDA |
649 | 6,510 | 15,574 | 25,694 | 19,260 | |||||||||||||||
| Non-cash compensation expense |
2,690 | 387 | 10,512 | 3,410 | 1,495 | |||||||||||||||
| ARO accretion expense |
489 | 313 | 1,443 | 1,183 | 704 | |||||||||||||||
| Financing deal costs |
116 | 119 | 1,161 | 1,902 | 336 | |||||||||||||||
| Natural disaster losses and related charges, net |
31 | — | 54 | 8,217 | 1,034 | |||||||||||||||
| IPO costs |
— | 739 | 3,804 | 563 | — | |||||||||||||||
| Loss on unenforceable contracts |
— | — | 2,381 | — | — | |||||||||||||||
| Loss on extinguishment of long-term debt, net—affiliates |
— | — | 10,645 | — | — | |||||||||||||||
| Unrealized loss on fair value option instruments |
— | — | 150 | — | — | |||||||||||||||
| Realized loss on fair value option instruments |
— | — | 730 | — | — | |||||||||||||||
| Amortization of payments to dealers for exclusivity and other bonus arrangements |
351 | — | 583 | — | — | |||||||||||||||
| Legal settlements |
— | — | 1,260 | 150 | 575 | |||||||||||||||
| Provision for current expected credit losses |
1,864 | — | — | — | — | |||||||||||||||
|
|
|
|
|
|
|
|
|
|
|
|||||||||||
| Adjusted EBITDA |
$ | 6,190 | $ | 8,068 | $ | 48,297 | $ | 41,119 | $ | 23,404 | ||||||||||
|
|
|
|
|
|
|
|
|
|
|
|||||||||||
76
Table of Contents
Adjusted Operating Cash Flow. We define Adjusted Operating Cash Flow as net cash used in operating activities plus principal proceeds from customer notes receivable, financed insurance payments and distributions to redeemable noncontrolling interests less derivative breakage fees from financing structure changes, payments to dealers for exclusivity and other bonus arrangements, net inventory and prepaid inventory (sales) purchases and payments of non-capitalized costs related to our IPO. Adjusted Operating Cash Flow is a non-GAAP financial measure we use as a liquidity measure. This measurement is not recognized in accordance with GAAP and should not be viewed as an alternative to GAAP measures of liquidity. The GAAP measure most directly comparable to Adjusted Operating Cash Flow is net cash used in operating activities. We believe Adjusted Operating Cash Flow is a supplemental financial measure useful to management, analysts, investors, lenders and rating agencies as an indicator of our ability to internally fund origination activities, service or incur additional debt and service our contractual obligations. We believe investors and analysts will use Adjusted Operating Cash Flow to evaluate our liquidity and ability to service our contractual obligations. However, Adjusted Operating Cash Flow has limitations as an analytical tool because it does not account for all future expenditures and financial obligations of the business or reflect unforeseen circumstances that may impact our future cash flows, all of which could have a material effect on our financial condition and results from operations. In addition, our calculations of Adjusted Operating Cash Flow are not necessarily comparable to liquidity measures presented by other companies. Investors should not rely on these measures as a substitute for any GAAP measure, including net cash used in operating activities.
| Three Months Ended March 31, |
Year Ended December 31, |
|||||||||||||||||||
| 2020 | 2019 | 2019 | 2018 | 2017 | ||||||||||||||||
| (Unaudited, in thousands) |
||||||||||||||||||||
| Reconciliation of Net Cash Used in Operating Activities to Adjusted Operating Cash Flow: |
||||||||||||||||||||
| Net cash used in operating activities |
$ | (58,112 | ) | $ | (24,430 | ) | $ | (170,262 | ) | $ | (11,570 | ) | $ | (48,967 | ) | |||||
| Principal proceeds from customer notes receivable |
6,940 | 3,757 | 21,604 | 7,715 | 2,816 | |||||||||||||||
| Financed insurance payments |
(2,398 | ) | — | (4,672 | ) | — | — | |||||||||||||
| Derivative breakage fees from financing structure changes |
31,122 | 3,428 | 12,080 | (17,793 | ) | 2,833 | ||||||||||||||
| Distributions to redeemable noncontrolling interests |
(1,373 | ) | (3,652 | ) | (7,559 | ) | (2,017 | ) | (294 | ) | ||||||||||
| Payments to dealers for exclusivity and other bonus arrangements |
5,344 | 2,000 | 31,733 | — | — | |||||||||||||||
| Net Inventory and prepaid inventory (sales) purchases |
(1,593 | ) | 2,967 | 118,549 | 13,100 | 1,902 | ||||||||||||||
| Payments of non-capitalized costs related to IPO |
— | — | 4,944 | — | — | |||||||||||||||
|
|
|
|
|
|
|
|
|
|
|
|||||||||||
| Adjusted Operating Cash Flow |
$ | (20,070 | ) | $ | (15,930 | ) | $ | 6,417 | $ | 10,565 | $ | (41,710 | ) | |||||||
|
|
|
|
|
|
|
|
|
|
|
|||||||||||
Adjusted Operating Expense. We define Adjusted Operating Expense as total operating expense less depreciation and amortization expense, financing deal costs, natural disaster losses and related charges, net, amortization of payments to dealers for exclusivity and other bonus arrangements, legal settlements and excluding the effect of certain non-recurring items we do not consider to be indicative of our ongoing operating performance such as, but not limited to, costs of our IPO, losses on unenforceable contracts and other non-cash items such as non-cash compensation expense, ARO accretion expense and provision for current expected credit losses. Adjusted Operating Expense is a non-GAAP financial measure we use as a performance measure. We believe investors
77
Table of Contents
and securities analysts will also use Adjusted Operating Expense in evaluating our performance. This measurement is not recognized in accordance with GAAP and should not be viewed as an alternative to GAAP measures of performance. The GAAP measure most directly comparable to Adjusted Operating Expense is total operating expense. We believe Adjusted Operating Expense is a supplemental financial measure useful to management, analysts, investors, lenders and rating agencies as an indicator of the efficiency of our operations between reporting periods. Adjusted Operating Expense should not be considered an alternative to but viewed in conjunction with GAAP total operating expense, as we believe it provides a more complete understanding of our performance than GAAP measures alone. Adjusted Operating Expense has limitations as an analytical tool and you should not consider it in isolation or as a substitute for analysis of our results as reported under GAAP, including total operating expense.
| Three Months Ended March 31, |
Year Ended December 31, |
|||||||||||||||||||
| 2020 | 2019 | 2019 | 2018 | 2017 | ||||||||||||||||
| (Unaudited, in thousands except per customer data) |
||||||||||||||||||||
| Reconciliation of Total Operating Expense, Net to Adjusted Operating Expense: |
||||||||||||||||||||
| Total operating expense, net |
$ | 44,135 | $ | 31,222 | $ | 153,826 | $ | 118,112 | $ | 87,211 | ||||||||||
| Depreciation expense |
(14,946 | ) | (11,012 | ) | (49,340 | ) | (39,290 | ) | (29,482 | ) | ||||||||||
| Amortization expense |
(9 | ) | (5 | ) | (29 | ) | (133 | ) | (133 | ) | ||||||||||
| Non-cash compensation expense |
(2,690 | ) | (387 | ) | (10,512 | ) | (3,410 | ) | (1,495 | ) | ||||||||||
| ARO accretion expense |
(489 | ) | (313 | ) | (1,443 | ) | (1,183 | ) | (704 | ) | ||||||||||
| Financing deal costs |
(116 | ) | (119 | ) | (1,161 | ) | (1,902 | ) | (336 | ) | ||||||||||
| Natural disaster losses and related charges, net |
(31 | ) | — | (54 | ) | (8,217 | ) | (1,034 | ) | |||||||||||
| IPO costs |
— | (739 | ) | (3,804 | ) | (563 | ) | — | ||||||||||||
| Loss on unenforceable contracts |
— | — | (2,381 | ) | — | — | ||||||||||||||
| Amortization of payments to dealers for exclusivity and other bonus arrangements |
(351 | ) | — | (583 | ) | — | — | |||||||||||||
| Legal settlements |
— | — | (1,260 | ) | (150 | ) | (575 | ) | ||||||||||||
| Provision for current expected credit losses |
(1,864 | ) | — | — | — | — | ||||||||||||||
|
|
|
|
|
|
|
|
|
|
|
|||||||||||
| Adjusted Operating Expense |
$ | 23,639 | $ | 18,647 | $ | 83,259 | $ | 63,264 | $ | 53,452 | ||||||||||
|
|
|
|
|
|
|
|
|
|
|
|||||||||||
| Adjusted Operating Expense per weighted average customer |
$ | 289 | $ | 301 | $ | 1,215 | $ | 1,185 | $ | 1,378 | ||||||||||
|
|
|
|
|
|
|
|
|
|
|
|||||||||||
Operational Metrics
We regularly review a number of metrics, including the following key operational and financial metrics, to evaluate our business, measure our performance and liquidity, identify trends affecting our business, formulate our financial projections and make strategic decisions. For additional information about our key operational metrics, including their definitions, calculation and limitations, see “Management’s Discussion and Analysis of Financial Condition and Results of Operations—Key Financial and Operational Metrics.”
| As of March 31, 2020 |
As of December 31, | |||||||||||||||
| 2019 | 2018 | 2017 | ||||||||||||||
| Number of customers |
85,400 | 78,600 | 60,300 | 45,700 | ||||||||||||
78
Table of Contents
| Three Months Ended March, 31 |
Year Ended December 31, |
|||||||||||||||||||
| 2020 | 2019 | 2019 | 2018 | 2017 | ||||||||||||||||
| Weighted average number of customers (excluding loan agreements) |
70,100 | 55,300 | 60,100 | 49,200 | 37,000 | |||||||||||||||
| Weighted average number of customers with loan agreements) |
11,800 | 6,700 | 8,400 | 4,200 | 1,800 | |||||||||||||||
|
|
|
|
|
|
|
|
|
|
|
|||||||||||
| Weighted average number of customers |
81,900 | 62,00 | 68,500 | 53,400 | 38,800 | |||||||||||||||
|
|
|
|
|
|
|
|
|
|
|
|||||||||||
| As of March 31, 2020 |
As of December 31, | |||||||||||||||
| 2019 | 2018 | 2017 | ||||||||||||||
| (Unaudited, in millions) |
||||||||||||||||
| Estimated gross contracted customer value |
$ | 2,035 | $ | 1,879 | $ | 1,476 | $ | 1,127 | ||||||||
79
Table of Contents
MANAGEMENT’S DISCUSSION AND ANALYSIS OF FINANCIAL CONDITION AND RESULTS OF OPERATIONS
The following discussion and analysis contain forward-looking statements that are subject to risks, uncertainties and assumptions. Our actual results and timing of selected events may differ materially from those anticipated in these forward-looking statements as a result of many factors, including but not limited to those discussed under “Cautionary Language Regarding Forward-Looking Statements”, “Risk Factors” and elsewhere in this prospectus. Moreover, we operate in a very competitive and rapidly changing environment and new risks emerge from time to time. It is not possible for our management to predict all risks, nor can we assess the impact of all factors on our business or the extent to which any factor, or combination of factors, may cause actual results to differ materially from those contained in any forward-looking statements we may make. In light of these risks, uncertainties and assumptions, the forward-looking events and circumstances discussed in this prospectus, our Annual Report on Form 10-K for the year ended December 31, 2019 and our Quarterly Report on Form 10-Q for the quarter ended March 31, 2020 may not occur and actual results could differ materially and adversely from those anticipated or implied in the forward-looking statements. Unless the context otherwise requires, the terms “Sunnova,” “the Company,” “we,” “us” and “our” refer to SEI and its consolidated subsidiaries.
Company Overview
We are a leading residential solar and energy storage service provider, serving more than 85,000 customers in more than 20 U.S. states and territories. Our goal is to be the leading provider of clean, affordable and reliable energy for consumers, and we operate with a simple mission: to power energy independence so that homeowners have the freedom to live life uninterrupted. We were founded to deliver customers a better energy service at a better price; and, through our solar and solar plus energy storage service offerings, we are disrupting the traditional energy landscape and the way the 21st century customer generates and consumes electricity.
We have a differentiated residential solar dealer model in which we partner with local dealers who originate, design and install our customers’ solar energy systems and energy storage systems on our behalf. Our focus on our dealer model enables us to leverage our dealers’ specialized knowledge, connections and experience in local markets to drive customer origination while providing our dealers with access to high quality products at competitive prices as well as technical oversight and expertise. We believe this structure provides operational flexibility, reduced exposure to labor shortages and lower fixed costs relative to our peers, furthering our competitive advantage.
We offer customers products to power their homes with affordable solar energy. We are able to offer savings and storage opportunities to most customers compared to utility-based retail rates with little to no up-front expense to the customer, and we are able to provide energy resiliency and reliability to our solar plus energy storage customers. Our solar service agreements take the form of a lease, PPA or loan. The initial term of our solar service agreements is typically either 10 or 25 years. Service is an integral part of our agreements and includes operations and maintenance, monitoring, repairs and replacements, equipment upgrades, on-site power optimization for the customer (for both supply and demand), the ability to efficiently switch power sources among the solar panel, grid and energy storage system, as appropriate, and diagnostics. During the life of the contract we have the opportunity to integrate related and evolving home servicing and monitoring technologies to upgrade the flexibility and reduce the cost of our customers’ energy supply.
In the case of leases and PPAs, we also currently receive tax benefits and other incentives from federal, state and local governments, a portion of which we finance through tax equity, non-recourse debt structures and hedging arrangements in order to fund our upfront costs, overhead and growth investments. We have an established track record of attracting capital from diverse sources. From our inception through March 31, 2020, we have raised more than $5.5 billion in total capital commitments from equity, debt and tax equity investors.
80
Table of Contents
In addition to providing ongoing service as a standard component of our solar service agreements, we also offer Sunnova Protect Services, which provides ongoing energy services to customers who purchased their solar energy system through unaffiliated third parties. Under these arrangements, we agree to provide monitoring, maintenance and repair services to these customers for the life of the service contract they sign with us. We believe the quality and scope of our comprehensive energy service offerings, whether to customers that obtained their solar energy system through us or through another party, is a key differentiator between us and our competitors.
We commenced operations in January 2013 and began providing solar energy services under our first solar energy system in April 2013. Since then, our brand, innovation and focused execution have driven significant rapid growth in our market share and in the number of customers on our platform. We operate one of the largest fleets of residential solar energy systems in the U.S., comprising more than 625 megawatts of generation capacity and serving more than 85,000 customers.
Recent Developments
COVID-19 Pandemic
The ongoing COVID-19 pandemic has resulted in widespread adverse impacts on the global economy and on our employees, customers, dealers and other parties with whom we have business relations. Our first priority in our response to this pandemic has been the health and safety of our employees, customers and dealers. To that end, we quickly implemented preventative measures to minimize unnecessary risk of exposure. We have experienced some resulting disruptions to our business operations as the COVID-19 pandemic has continued to spread through the states and U.S. territories in which we operate.
Social distancing guidelines, stay-at-home orders and similar government measures associated with the COVID-19 pandemic, as well as actions by individuals to reduce their potential exposure to the virus, contributed to a decline in origination, with new contract origination, net of cancellations, declining in each of March and April 2020. This decline reflects an inability by our dealers to perform in-person sales calls based on the stay-at-home orders in some locations. To adjust to these government measures, our dealers have expanded the use of digital tools and origination channels and created new methods that offset restrictions on their ability to meet with potential new customers in-person in certain areas. Such efforts drove an increase in new contract origination, net of cancellations in May 2020, which exceeded the number of new contracts originated, net of cancellations, in February 2020. Our dealers have expanded the use of digital tools and origination channels and created new methods that offset restrictions on their ability to meet with potential new customers in-person in certain areas. Such efforts drove an increase in contract origination in recent weeks. We expect the use of websites, video conferencing and other virtual tools as part of our origination process to expand widely and contribute to our future growth. However, a significant or extended decline in new contract origination because the COVID-19 pandemic precludes a return to in-person sales, because dealers are unable to adjust to virtual sales methods or because such methods prove to be less successful with potential customers, may have a material adverse effect on our business, cash flows, liquidity, financial condition and results of operations. Regardless, any impact to our total number of customers or our financial results based on reduced levels of new contract origination will largely be delayed until the third quarter of 2020.
The service and installation of solar energy systems has continued during the COVID-19 pandemic. This reflects residential solar services’ designation as an essential service in all of our service territories. In order to adhere to all applicable state and federal health and safety guidelines, we and our dealers have moved to a contact-free process for installers and service technicians. In addition, certain regulators and local utilities have begun accepting electronic submissions for permits and inspections are now being performed in many locations through video calls and other electronic means. We expect our dealers’ ability to install and our ability to service solar energy systems will continue in this manner. However, if there are additional outbreaks of the COVID-19 virus or more
81
Table of Contents
stringent health and safety guidelines are adopted, our and our dealers’ ability to continue performing installations and service calls may be adversely impacted.
Throughout the COVID-19 pandemic, we have seen minimal impact to our supply chain as our technicians and dealers have largely been able to successfully procure the equipment needed to service and install solar energy systems. We have established a geographically diverse group of suppliers, which helps ensure our dealers and customers have access to affordable and effective solar energy and storage options despite potential trade, geopolitical or event-driven risks. Further, we implemented a strategy in 2019, as a result of which the equipment necessary to install and service a significant majority of solar energy systems for the duration of 2020 is already available to us. Currently, we do not anticipate an inability to source parts for our solar energy systems or energy storage systems. However, if supply chains become significantly disrupted due to additional outbreaks of the COVID-19 virus or more stringent health and safety guidelines are implemented, our ability to install and service solar energy systems could become adversely impacted.
As part of our preventative measures to minimize unnecessary risk of exposure and prevent infection, in the early weeks after declaration of the COVID-19 pandemic we implemented a work-from-home policy for employees in our Houston headquarters. In May 2020, we adopted a return to operations policy that permits employees to return to the office in stages. All employees are required to follow strict social distancing and health safety guidelines in conformity with the restrictions and best practices encouraged by the Centers for Disease Control and Prevention, the World Health Organization and other governmental and regulatory authorities. Throughout the COVID-19 pandemic, our call center has remained open and properly staffed to meet our customers’ needs. If a customer requires a visit from a service technician, those technicians are available and in almost all cases can complete the service without entering the customer’s home. We are continuing to address concerns to protect the health and safety of our employees and those of our customers and dealers, and this includes changes to comply with health-related guidelines as they are modified and supplemented.
There is considerable uncertainty regarding the extent to which the COVID-19 virus will continue to spread and the extent and duration of governmental and other measures implemented to try to slow the spread of the COVID-19 virus, such as large-scale travel bans and restrictions, border closures, quarantines, shelter-in-place orders and business and government shutdowns. Restrictions of this nature have caused, and may continue to cause, us and our dealers to experience operational delays and may cause milestones or deadlines relating to our exclusivity arrangements to be missed. To date, we have not received notices from our dealers regarding performance delays resulting from the COVID-19 pandemic. However, worsening economic conditions could result in such outcomes over time, which would impact our future financial performance. Further, the effects of the economic downturn associated with the COVID-19 pandemic, and other economic factors, may increase unemployment and reduce consumer credit ratings and credit availability, which may adversely affect new customer origination and our existing customers’ ability to make payments on their solar service agreements. Periods of high unemployment and a lack of availability of credit may lead to increased delinquency and default rates. We have not experienced a significant increase in default or delinquency rates to date. However, if existing economic conditions continue for a prolonged period of time or worsen, delinquencies on solar service agreements could increase, which would also negatively impact our future financial performance.
As of the date of this prospectus, our efforts to respond to the challenges presented by the conditions described above to minimize the impacts to our business have yielded encouraging results. However, our future success also depends on our ability to raise capital from third-party investors and commercial sources. In the initial weeks of the COVID-19 pandemic we saw access to capital markets reduced generally. Although the capital markets have not returned to full strength we have since been able to raise funding during this challenging time. We have recently closed one additional tax equity
82
Table of Contents
fund, closed one additional securitization, expanded capacity under one of our existing credit facilities and continue to have access to capacity under certain of our existing tax equity funds and warehouse facilities. If we are unable to regain access to the capital markets or are unable to raise funds through our tax equity and warehouse financing transactions at competitive terms, it would adversely impact both our ability to finance the deployment of our solar energy systems and energy storage systems and our future financial performance.
We cannot predict the full impact the COVID-19 pandemic or the significant disruption and volatility currently being experienced in the capital markets will have on our business, cash flows, liquidity, financial condition and results of operations at this time due to numerous uncertainties. The ultimate impact will depend on future developments, including, among other things, the ultimate geographic spread and duration of the COVID-19 virus, the depth and duration of the economic downturn and other economic effects of the COVID-19 pandemic, the consequences of governmental and other measures designed to prevent the spread of the COVID-19 virus, actions taken by governmental authorities, customers, suppliers, dealers and other third parties, our ability and the ability of our customers, potential customers and dealers to adapt to operating in a changed environment and the timing and extent to which normal economic and operating conditions resume. For additional discussion regarding risks associated with the COVID-19 pandemic, see “Risk Factors” elsewhere in this prospectus.
Financing Transactions
In May 2020, we amended the revolving credit facility associated with one of our financing subsidiaries that owns certain tax equity funds to, among other things, (a) increase the aggregate commitment amount from $200.0 million to $390.0 million and (b) increase the unused line fee on such committed amounts. In June 2020, we further amended that facility to, among other things, (a) increase the aggregate commitment amount from $390.0 million to $437.5 million and (b) increase the unused line fee on such committed amounts. In May 2020, we admitted a tax equity investor with a total capital commitment of $75.0 million.
In May 2020, we issued and sold an aggregate principal amount of $130.0 million of our 9.75% convertible senior notes in a private placement at an issue price of 95%, for an aggregate purchase price of $123.5 million. The 9.75% convertible senior notes mature in April 2025 unless earlier redeemed, repurchased or converted. We granted the investors of the 9.75% convertible senior notes an option to purchase up to an additional $60.0 million aggregate principal amount of 9.75% convertible senior notes on the same terms and conditions, and the investors exercised this option and completed the purchase of such additional notes on June 12, 2020. We also entered into privately negotiated exchanges with a small number of institutional investors in our 7.75% convertible senior notes due January 2027 whereby such investors exchanged all $55.0 million aggregate principal amount outstanding of our 7.75% convertible senior notes for an equal principal amount of our 9.75% convertible senior notes.
In June 2020, one of our subsidiaries issued $135.9 million in aggregate principal amount of Series 2020-A Class A solar loan-backed notes and $22.6 million in aggregate principal amount of Series 2020-A Class B solar loan-backed notes. The notes bear interest at an annual rate of 2.98% and 7.25% for the Class A and Class B notes, respectively.
Securitizations
As a source of long-term financing, we securitize qualifying solar energy systems and related solar service agreements into special purpose entities who issue solar asset-backed and solar loan-
83
Table of Contents
backed notes to institutional investors. We also securitize the cash flows generated by the membership interests in certain of our indirect, wholly-owned subsidiaries that are the managing member of a tax equity fund that owns a pool of solar energy systems and related solar service agreements that were originated by one of our wholly-owned subsidiaries. The federal government currently provides business investment tax credits under Section 48(a) and residential energy credits under Section 25D of the Code. We do not securitize the Section 48(a) ITC incentives associated with the solar energy systems as part of these arrangements. We use the cash flows these solar energy systems generate to service the monthly, quarterly or semi-annual principal and interest payments on the notes and satisfy the expenses and reserve requirements of the special purpose entities, with any remaining cash distributed to their sole members, who are typically our indirect wholly-owned subsidiaries. In connection with these securitizations, certain of our affiliates receive a fee for managing and servicing the solar energy systems pursuant to management, servicing, facility administration and asset management agreements. The special purpose entities are also typically required to maintain a liquidity reserve account and a reserve account for equipment replacements and, in certain cases, reserve accounts for financing fund purchase option/withdrawal right exercises or storage system replacement for the benefit of the holders under the applicable series of notes, each of which are funded from initial deposits or cash flows to the levels specified therein. The creditors of these special purpose entities have no recourse to our other assets except as expressly set forth in the terms of the notes. From our inception through March 31, 2020, we have issued $1.2 billion in solar asset-backed and solar loan-backed notes.
Tax Equity Funds
Our ability to offer long-term solar service agreements depends in part on our ability to finance the installation of the solar energy systems by co-investing with tax equity investors such as large banks who value the resulting customer receivables and Section 48(a) ITCs, accelerated tax depreciation and other incentives related to the solar energy systems primarily through structured investments known as “tax equity”. Tax equity investments are generally structured as non-recourse project financings known as “tax equity funds”. In the context of distributed generation solar energy, tax equity investors make contributions upfront or in stages based on milestones in exchange for a share of the tax attributes and cash flows emanating from an underlying portfolio of solar energy systems. In these tax equity funds, the U.S. federal tax attributes offset taxes that otherwise would have been payable on the investors’ other operations. The terms and conditions of each tax equity fund vary significantly by investor and by fund. We continue to negotiate with potential investors to create additional tax equity funds.
In general, our tax equity funds are structured using the “partnership flip” structure. Under partnership flip structures, we and our tax equity investors contribute cash into a partnership. The partnership uses this cash to acquire long-term solar service agreements and solar energy systems developed by us and sells energy from such solar energy systems to customers or directly leases the solar energy systems to customers. We assign these solar service agreements, solar energy systems and related incentives to our tax equity funds in accordance with the criteria of the specific funds. Upon such assignment and the satisfaction of certain conditions precedent, we are able to draw down on the tax equity fund commitments. The conditions precedent to funding vary across our tax equity funds but generally require that we have entered into a solar service agreement with the customer, the customer meets certain credit criteria, the solar energy system is expected to be eligible for the Section 48(a) ITC, we have a recent appraisal from an independent appraiser establishing the fair market value of the solar energy system and the property is in an approved state or territory. All the capital contributed by our tax equity investors into the tax equity funds is, depending on the tax equity fund structure, either paid to us to acquire solar energy systems or distributed to us following our contribution of solar energy systems to the tax equity fund. Some tax equity investors have additional criteria that are specific to those tax equity funds. Once received by us, these proceeds are generally used for working
84
Table of Contents
capital or capital expenditures to develop and deliver solar energy systems. Each tax equity investor agrees to receive a minimum target rate of return, typically on an after-tax basis, which varies by tax equity fund. Prior to receiving a contractual rate of return or a date specified in the contractual arrangements, the tax equity investor receives substantially all of the non-cash value attributable to the solar energy systems, which includes accelerated depreciation and Section 48(a) ITCs, and a significant portion of the value attributable to customer payments; however, we receive a majority of the cash distributions, which are typically paid quarterly. After the tax equity investor receives its contractual rate of return or after the specified date, we receive substantially all of the cash. Under the partnership flip structure, in part owing to the allocation of depreciation benefits to the investor, the investor’s pre-tax return is much lower than the investor’s after-tax return.
We have determined we are the primary beneficiary in these partnership flip structures for accounting purposes. Accordingly, we consolidate the assets and liabilities and operating results of these partnerships in our consolidated financial statements. We recognize the tax equity investors’ share of the net assets of the tax equity funds as redeemable noncontrolling interests in our consolidated balance sheets. These income or loss allocations, reflected in our consolidated statements of operations, may create significant volatility in our reported results of operations, including potentially changing net loss attributable to stockholders to net income attributable to stockholders, or vice versa, from quarter to quarter.
We typically have an option to acquire, and our tax equity investors may have an option to withdraw and require us to purchase, all the equity interests our tax equity investor holds in the tax equity funds approximately six years after the last solar energy system in each tax equity fund is operational. If we or our tax equity investors exercise this option, we are typically required to pay at least the fair market value of the tax equity investor’s equity interest. Following such exercise, we would receive 100% of the customer payments for the remainder of the term of the solar service agreements. From our inception through March 31, 2020, we have received commitments of $449.5 million through the use of tax equity funds, of which an aggregate of $410.7 million has been funded.
Key Financial and Operational Metrics
We regularly review a number of metrics, including the following key operational and financial metrics, to evaluate our business, measure our performance and liquidity, identify trends affecting our business, formulate our financial projections and make strategic decisions.
Number of Customers. We define number of customers to include each customer that is party to an in-service solar service agreement. For our leases, PPAs and loan agreements, in-service means the related solar energy system and, if applicable, energy storage system, must have met all the requirements to begin operation and be interconnected to the electrical grid. For our Sunnova Protect services, in-service means the customer’s solar energy system must have met the requirements to have the service activated. We do not include in our number of customers any customer under a lease, PPA or loan agreement that has reached mechanical completion but has not received permission to operate from the local utility or for whom we have terminated the contract and removed the solar energy system. We also do not include in our number of customers any customer of our Sunnova Protect services that has been in default under his or her solar service agreement in excess of six months. We track the total number of customers as an indicator of our historical growth and our rate of growth from period to period.
| As of March 31, 2020 |
As of December 31, |
|||||||||||
| 2019 | 2018 | |||||||||||
| Number of customers |
85,400 | 78,600 | 60,300 | |||||||||
85
Table of Contents
Weighted Average Number of Customers. We calculate the weighted average number of customers based on the number of months a given customer is in-service during a given measurement period. The weighted average customer count reflects the number of customers at the beginning of a period, plus the total number of new customers added in the period adjusted by a factor that accounts for the partial period nature of those new customers. For purposes of this calculation, we assume all new customers added during a month were added in the middle of that month. We track the weighted average customer count in order to accurately reflect the contribution of the appropriate number of customers to key financial metrics over the measurement period.
| Three Months Ended March 31, |
Year Ended December 31, |
|||||||||||||||||||
| 2020 | 2019 | 2019 | 2018 | 2017 | ||||||||||||||||
| Weighted average number of customers (excluding loan agreements) |
70,100 | 55,300 | 60,100 | 49,200 | 37,000 | |||||||||||||||
| Weighted average number of customers with loan agreements |
11,800 | 6,700 | 8,400 | 4,200 | 1,800 | |||||||||||||||
|
|
|
|
|
|
|
|
|
|
|
|||||||||||
| Weighted average number of customers |
81,900 | 62,000 | 68,500 | 53,400 | 38,800 | |||||||||||||||
|
|
|
|
|
|
|
|
|
|
|
|||||||||||
Adjusted EBITDA. We define Adjusted EBITDA as net income (loss) plus net interest expense, depreciation and amortization expense, income tax expense, financing deal costs, natural disaster losses and related charges, net, amortization of payments to dealers for exclusivity and other bonus arrangements, legal settlements and excluding the effect of certain non-recurring items we do not consider to be indicative of our ongoing operating performance such as, but not limited to, costs of our IPO, losses on unenforceable contracts, losses on extinguishment of long-term debt, realized and unrealized gains and losses on fair value option instruments and other non-cash items such as non-cash compensation expense, ARO accretion expense and provision for current expected credit losses. We began recognizing current expected credit losses in the first quarter of 2020 as a result of the adoption of Accounting Standards Update No. 2016-13, Financial Instruments—Credit Losses.
Adjusted EBITDA is a non-GAAP financial measure we use as a performance measure. We believe investors and securities analysts also use Adjusted EBITDA in evaluating our operating performance. This measurement is not recognized in accordance with GAAP and should not be viewed as an alternative to GAAP measures of performance. The GAAP measure most directly comparable to Adjusted EBITDA is net income (loss). The presentation of Adjusted EBITDA should not be construed to suggest our future results will be unaffected by non-cash or non-recurring items. In addition, our calculation of Adjusted EBITDA is not necessarily comparable to Adjusted EBITDA as calculated by other companies.
We believe Adjusted EBITDA is useful to management, investors and analysts in providing a measure of core financial performance adjusted to allow for comparisons of results of operations across reporting periods on a consistent basis. These adjustments are intended to exclude items that are not indicative of the ongoing operating performance of the business. Adjusted EBITDA is also used by our management for internal planning purposes, including our consolidated operating budget, and by our board of directors in setting performance-based compensation targets. Adjusted EBITDA should not be considered an alternative to but viewed in conjunction with GAAP results, as we believe it provides a more complete understanding of ongoing business performance and trends than GAAP measures alone. Adjusted EBITDA has limitations as an analytical tool, and you should not consider it in isolation or as a substitute for analysis of our results as reported under GAAP.
We use per customer metrics, including Adjusted Operating Expense per weighted average customer (as described below), as an additional way to evaluate our performance. Specifically, we
86
Table of Contents
consider the change in these metrics from period to period as a way to evaluate our performance in the context of changes we experience in the overall customer base. While the Adjusted Operating Expense figure provides a valuable indicator of our overall performance, evaluating this metric on a per unit basis allows for further nuanced understanding by management, investors and analysts of the financial impact of each additional customer.
| Three Months Ended March 31, |
Year Ended December 31, |
|||||||||||||||||||
| 2020 | 2019 | 2019 | 2018 | 2017 | ||||||||||||||||
| (Unaudited, in thousands) |
||||||||||||||||||||
| Reconciliation of Net Loss to Adjusted EBITDA: |
||||||||||||||||||||
| Net loss |
$ | (77,004 | ) | $ | (35,496 | ) | $ | (133,434 | ) | $ | (68,409 | ) | $ | (90,182 | ) | |||||
| Interest expense, net |
67,318 | 31,661 | 108,024 | 51,582 | 59,847 | |||||||||||||||
| Interest expense, net—affiliates |
— | 1,822 | 4,098 | 9,548 | 23,177 | |||||||||||||||
| Interest income |
(4,620 | ) | (2,494 | ) | (12,483 | ) | (6,450 | ) | (3,197 | ) | ||||||||||
| Depreciation expense |
14,946 | 11,012 | 49,340 | 39,290 | 29,482 | |||||||||||||||
| Amortization expense |
9 | 5 | 29 | 133 | 133 | |||||||||||||||
|
|
|
|
|
|
|
|
|
|
|
|||||||||||
| EBITDA |
649 | 6,510 | 15,574 | 25,694 | 19,260 | |||||||||||||||
| Non-cash compensation expense(1) |
2,690 | 387 | 10,512 | 3,410 | 1,495 | |||||||||||||||
| ARO accretion expense |
489 | 313 | 1,443 | 1,183 | 704 | |||||||||||||||
| Financing deal costs |
116 | 119 | 1,161 | 1,902 | 336 | |||||||||||||||
| Natural disaster losses and related charges, net |
31 | — | 54 | 8,217 | 1,034 | |||||||||||||||
| IPO costs |
— | 739 | 3,804 | 563 | — | |||||||||||||||
| Loss on unenforceable contracts |
— | — | 2,381 | — | — | |||||||||||||||
| Loss on extinguishment of long-term debt, net—affiliates |
— | — | 10,645 | — | — | |||||||||||||||
| Unrealized loss on fair value option instruments |
— | — | 150 | — | — | |||||||||||||||
| Realized loss on fair value option instruments |
— | — | 730 | — | — | |||||||||||||||
| Amortization of payments to dealers for exclusivity and other bonus arrangements |
351 | — | 583 | — | — | |||||||||||||||
| Legal settlements |
— | — | 1,260 | 150 | 575 | |||||||||||||||
| Provision for current expected credit losses |
1,864 | — | — | — | — | |||||||||||||||
|
|
|
|
|
|
|
|
|
|
|
|||||||||||
| Adjusted EBITDA |
$ | 6,190 | $ | 8,068 | $ | 48,297 | $ | 41,119 | $ | 23,404 | ||||||||||
|
|
|
|
|
|
|
|
|
|
|
|||||||||||
| (1) | Amount includes non-cash effect of equity-based compensation plans of $2.7 million and $0.3 million for the three months ended March 31, 2020 and 2019, respectively, and $9.2 million, $3.0 million and $1.5 million for the years ended December 31, 2019, 2018 and 2017, respectively, and partial forgiveness of a loan to an executive officer used to purchase our capital stock of $0.1 million, $1.3 million and $0.4 million for the three months ended March 31, 2019 and years ended December 31, 2019 and 2018, respectively. |
Interest Income and Principal Payments from Customer Notes Receivable. Under our loan agreements, the customer obtains financing for the purchase of a solar energy system from us and we agree to operate and maintain the solar energy system throughout the duration of the agreement. Pursuant to the terms of the loan agreement, the customer makes scheduled principal and interest
87
Table of Contents
payments to us and has the option to prepay principal at any time in part or in full. Whereas we typically recognize payments from customers under our leases and PPAs as revenue, we recognize payments received from customers under our loan agreements (a) as interest income, to the extent attributable to earned interest on the contract that financed the customer’s purchase of the solar energy system; (b) as a reduction of a note receivable on the balance sheet, to the extent attributable to a return of principal (whether scheduled or prepaid) on the contract that financed the customer’s purchase of the solar energy system; and (c) as revenue, to the extent attributable to payments for operations and maintenance services provided by us.
While Adjusted EBITDA effectively captures the operating performance of our leases and PPAs, it only reflects the service portion of the operating performance under our loan agreements. We do not consider our types of solar service agreements differently when evaluating our operating performance. In order to present a measure of operating performance that provides comparability without regard to the different accounting treatment among our three types of solar service agreements, we consider interest income from customer notes receivable and principal proceeds from customer notes receivable, net of related revenue, as key performance metrics. We believe these two metrics provide a more meaningful and uniform method of analyzing our operating performance when viewed in light of our other key performance metrics across the three primary types of solar service agreements.
| Three Months Ended March 31, |
Year Ended December 31, |
|||||||||||||||||||
| 2020 | 2019 | 2019 | 2018 | 2017 | ||||||||||||||||
| (Unaudited, in thousands) |
||||||||||||||||||||
| Interest income from customer notes receivable |
$ | 4,372 | $ | 2,328 | $ | 11,588 | $ | 6,147 | $ | 3,003 | ||||||||||
| Principal proceeds from customer notes receivable, net of related revenue |
$ | 6,378 | $ | 3,429 | $ | 20,044 | $ | 6,812 | $ | 2,360 | ||||||||||
88
Table of Contents
Adjusted Operating Cash Flow. We define Adjusted Operating Cash Flow as net cash used in operating activities plus principal proceeds from customer notes receivable, financed insurance payments and distributions to redeemable noncontrolling interests less derivative breakage fees from financing structure changes, payments to dealers for exclusivity and other bonus arrangements, net inventory and prepaid inventory (sales) purchases and payments of non-capitalized costs related to our IPO. Adjusted Operating Cash Flow is a non-GAAP financial measure we use as a liquidity measure. This measurement is not recognized in accordance with GAAP and should not be viewed as an alternative to GAAP measures of liquidity. The GAAP measure most directly comparable to Adjusted Operating Cash Flow is net cash used in operating activities. We believe Adjusted Operating Cash Flow is a supplemental financial measure useful to management, analysts, investors, lenders and rating agencies as an indicator of our ability to internally fund origination activities, service or incur additional debt and service our contractual obligations. We believe investors and analysts will use Adjusted Operating Cash Flow to evaluate our liquidity and ability to service our contractual obligations. However, Adjusted Operating Cash Flow has limitations as an analytical tool because it does not account for all future expenditures and financial obligations of the business or reflect unforeseen circumstances that may impact our future cash flows, all of which could have a material effect on our financial condition and results from operations. In addition, our calculations of Adjusted Operating Cash Flow are not necessarily comparable to liquidity measures presented by other companies. Investors should not rely on these measures as a substitute for any GAAP measure, including net cash used in operating activities.
| Three Months Ended March 31, |
Year Ended December 31, |
|||||||||||||||||||
| 2020 | 2019 | 2019 | 2018 | 2017 | ||||||||||||||||
| (Unaudited, in thousands) |
||||||||||||||||||||
| Reconciliation of Net Cash Used in Operating Activities to Adjusted Operating Cash Flow: |
||||||||||||||||||||
| Net cash used in operating activities |
$ | (58,112 | ) | $ | (24,430 | ) | $ | (170,262 | ) | $ | (11,570 | ) | $ | (48,967 | ) | |||||
| Principal proceeds from customer notes receivable |
6,940 | 3,757 | 21,604 | 7,715 | 2,816 | |||||||||||||||
| Financed insurance payments |
(2,398 | ) | — | (4,762 | ) | — | — | |||||||||||||
| Derivative breakage fees from financing structure changes |
31,122 | 3,428 | 12,080 | (17,793 | ) | 2,833 | ||||||||||||||
| Distributions to redeemable noncontrolling interests |
(1,373 | ) | (3,652 | ) | (7,559 | ) | (2,017 | ) | (294 | ) | ||||||||||
| Payments to dealers for exclusivity and other bonus arrangements |
5,344 | 2,000 | 31,733 | — | — | |||||||||||||||
| Net Inventory and prepaid inventory (sales) purchases |
(1,593 | ) | 2,967 | 118,549 | 13,100 | 1,902 | ||||||||||||||
| Payments of non-capitalized costs related to IPO |
— | — | 4,944 | — | — | |||||||||||||||
|
|
|
|
|
|
|
|
|
|
|
|||||||||||
| Adjusted Operating Cash Flow |
$ | (20,070 | ) | $ | (15,930 | ) | $ | 6,417 | $ | 10,565 | $ | (41,710 | ) | |||||||
|
|
|
|
|
|
|
|
|
|
|
|||||||||||
Adjusted Operating Expense. We define Adjusted Operating Expense as total operating expense less depreciation and amortization expense, financing deal costs, natural disaster losses and related charges, net, amortization of payments to dealers for exclusivity and other bonus arrangements, legal settlements and excluding the effect of certain non-recurring items we do not consider to be indicative of our ongoing operating performance such as, but not limited to, costs of our IPO, losses on unenforceable contracts and other non-cash items such as non-cash compensation expense, ARO accretion expense and provision for current expected credit losses. Adjusted Operating Expense is a non-GAAP financial measure we use as a performance measure. We believe investors
89
Table of Contents
and securities analysts will also use Adjusted Operating Expense in evaluating our performance. This measurement is not recognized in accordance with GAAP and should not be viewed as an alternative to GAAP measures of performance. The GAAP measure most directly comparable to Adjusted Operating Expense is total operating expense. We believe Adjusted Operating Expense is a supplemental financial measure useful to management, analysts, investors, lenders and rating agencies as an indicator of the efficiency of our operations between reporting periods. Adjusted Operating Expense should not be considered an alternative to but viewed in conjunction with GAAP total operating expense, as we believe it provides a more complete understanding of our performance than GAAP measures alone. Adjusted Operating Expense has limitations as an analytical tool and you should not consider it in isolation or as a substitute for analysis of our results as reported under GAAP, including total operating expense.
We use Adjusted Operating Expense per weighted average customer as an additional way to evaluate our performance. Specifically, we consider the change in this metric from period to period as a way to evaluate our performance in the context of changes we experience in the overall customer base. While the Adjusted Operating Expense figure provides a valuable indicator of our overall performance, evaluating this metric on a per customer basis provides a more contextualized understanding of our performance to us, investors and analysts of the financial impact of each additional customer.
| Three Months Ended March 31, |
Year Ended December 31, |
|||||||||||||||||||
| 2020 | 2019 | 2019 | 2018 | 2017 | ||||||||||||||||
| (Unaudited) | ||||||||||||||||||||
| (in thousands, except per customer data) |
||||||||||||||||||||
| Reconciliation of Total Operating Expense, Net to Adjusted Operating Expense: |
||||||||||||||||||||
| Total operating expense, net |
$ | 44,135 | $ | 31,222 | $ | 153,826 | $ | 118,112 | $ | 87,211 | ||||||||||
| Depreciation expense |
(14,946 | ) | (11,012 | ) | (49,340 | ) | (39,290 | ) | (29,482 | ) | ||||||||||
| Amortization expense |
(9 | ) | (5 | ) | (29 | ) | (133 | ) | (133 | ) | ||||||||||
| Non-cash compensation expense |
(2,690 | ) | (387 | ) | (10,512 | ) | (3,410 | ) | (1,495 | ) | ||||||||||
| ARO accretion expense |
(489 | ) | (313 | ) | (1,443 | ) | (1,183 | ) | (704 | ) | ||||||||||
| Financing deal costs |
(116 | ) | (119 | ) | (1,161 | ) | (1,902 | ) | (336 | ) | ||||||||||
| Natural disaster losses and related charges, net |
(31 | ) | — | (54 | ) | (8,217 | ) | (1,034 | ) | |||||||||||
| IPO costs |
— | (739 | ) | (3,804 | ) | (563 | ) | — | ||||||||||||
| Loss on unenforceable contracts |
— | — | (2,381 | ) | — | — | ||||||||||||||
| Amortization of payments to dealers for exclusivity and other bonus arrangements |
(351 | ) | — | (583 | ) | — | — | |||||||||||||
| Legal settlements |
— | — | (1,260 | ) | (150 | ) | (575 | ) | ||||||||||||
| Provision for current expected credit losses |
(1,864 | ) | — | — | — | — | ||||||||||||||
|
|
|
|
|
|
|
|
|
|
|
|||||||||||
| Adjusted Operating Expense |
$ | 23,639 | $ | 18,647 | $ | 83,259 | $ | 63,264 | $ | 53,452 | ||||||||||
|
|
|
|
|
|
|
|
|
|
|
|||||||||||
| Adjusted Operating Expense per weighted average customer |
$ | 289 | $ | 301 | $ | 1,215 | $ | 1,185 | $ | 1,378 | ||||||||||
|
|
|
|
|
|
|
|
|
|
|
|||||||||||
Estimated Gross Contracted Customer Value. We calculate estimated gross contracted customer value as defined below. We believe estimated gross contracted customer value can serve as a useful tool for investors and analysts in comparing the remaining value of our customer contracts to that of our peers.
Estimated gross contracted customer value as of a specific measurement date represents the sum of the present value of the remaining estimated future net cash flows we expect to receive from
90
Table of Contents
existing customers during the initial contract term of our leases and PPAs, which are typically 25 years in length, plus the present value of future net cash flows we expect to receive from the sale of related SRECs, either under existing contracts or in future sales, plus the carrying value of outstanding customer loans on our balance sheet. From these aggregate estimated initial cash flows, we subtract the present value of estimated net cash distributions to redeemable noncontrolling interests and estimated operating, maintenance and administrative expenses associated with the solar service agreements. These estimated future cash flows reflect the projected monthly customer payments over the life of our solar service agreements and depend on various factors including but not limited to solar service agreement type, contracted rates, expected sun hours and the projected production capacity of the solar equipment installed. For the purpose of calculating this metric, we discount all future cash flows at 6%.
The anticipated operating, maintenance and administrative expenses included in the calculation of estimated gross contracted customer value include, among other things, expenses related to accounting, reporting, audit, insurance, maintenance and repairs. In the aggregate, we estimate these expenses are $20 per kilowatt per year initially, with 2% annual increases for inflation, and an additional $81 per year non-escalating expense included for energy storage systems. We do not include maintenance and repair costs for inverters and similar equipment as those are largely covered by the applicable product and dealer warranties for the life of the product, but we do include additional cost for energy storage systems, which are only covered by a 10-year warranty. Expected distributions to tax equity investors vary among the different tax equity funds and are based on individual tax equity fund contract provisions.
Estimated gross contracted customer value is forecasted as of a specific date. It is forward-looking and we use judgment in developing the assumptions used to calculate it. Factors that could impact estimated gross contracted customer value include, but are not limited to, customer payment defaults, or declines in utility rates or early termination of a contract in certain circumstances, including prior to installation. The following table presents the calculation of estimated gross contracted customer value as of March 31, 2020 and December 31, 2019 and 2018, calculated using a 6% discount rate.
| As of March 31, 2020 |
As of December 31, |
|||||||||||
| 2019 | 2018 | |||||||||||
| (Unaudited, in millions) |
||||||||||||
| Estimated gross contracted customer value |
$ | 2,035 | $ | 1,879 | $ | 1,476 | ||||||
91
Table of Contents
Sensitivity Analysis. The calculation of estimated gross contracted customer value and associated operational metrics requires us to make a number of assumptions regarding future revenues and costs which may not prove accurate. Accordingly, we present below a sensitivity analysis with a range of assumptions. We consider a discount rate of 6% to be appropriate based on industry practice and recent transactions that demonstrate a portfolio of residential solar service agreements is an asset class that can be securitized successfully on a long-term basis, with a coupon of less than 6%. The appropriate discount rate for these estimates may change in the future due to the level of inflation, rising interest rates, our cost of capital and consumer demand for solar energy systems. In addition, the table below provides a range of estimated gross contracted customer value amounts if different cumulative customer loss rate assumptions were used. We are presenting this information for illustrative purposes only and as a comparison to information published by our peers.
| Estimated Gross Contracted Customer Value | ||||||||||||
| As of March 31, 2020 | ||||||||||||
| Discount rate | ||||||||||||
| Cumulative customer loss rate |
4% | 6% | 8% | |||||||||
| (Unaudited, in millions) | ||||||||||||
| 5% |
$ | 2,312 | $ | 2,005 | $ | 1,770 | ||||||
| 0% |
$ | 2,351 | $ | 2,035 | $ | 1,794 | ||||||
Significant Factors and Trends Affecting Our Business
Our results of operations and our ability to grow our business over time could be impacted by a number of factors and trends that affect our industry generally, as well as new offerings of services and products we may acquire or seek to acquire in the future. Additionally, our business is concentrated in certain markets, putting us at risk of region-specific disruptions such as adverse economic, regulatory, political, weather and other conditions. See the section titled “Risk Factors” for further discussion of risks affecting our business.
Financing Availability. Our future growth depends, in significant part, on our ability to raise capital from third-party investors on competitive terms to help finance the origination of our solar energy systems under our solar service agreements. We have historically used debt, such as asset-backed and loan-backed securitizations and warehouse facilities, tax equity, preferred equity and other financing strategies to help fund our operations. From our inception through March 31, 2020, we have raised more than $5.5 billion in total capital commitments from equity, debt and tax equity investors. With respect to tax equity, there are a limited number of potential tax equity investors and the competition for this investment capital is intense. The principal tax credit on which tax equity investors in our industry rely is the Section 48(a) ITC. The amount for the Section 48(a) ITC is equal to 30% of the basis of eligible solar property that began construction before 2020 if placed in service before 2024. By statute, the Section 48(a) ITC percentage decreases to 26% for eligible solar property that begins construction during 2020, 22% for 2021 and 10% if construction begins after 2021 or if the property is placed into service after 2023. This reduction in the Section 48(a) ITC will likely reduce our use of tax equity financing in the future unless the Section 48(a) ITC is increased or replaced. IRS guidance includes a 5% ITC Safe Harbor that may apply when a taxpayer (or in certain cases, a contractor) pays or incurs 5% or more of the costs of a solar energy system before the end of the applicable year, even though the solar energy system is not placed in service until after the end of that year. For installations in 2020, we have purchased substantially all the inverters that will be deployed under our lease and PPA agreements that we expect will allow the related solar energy systems to qualify for the 30% Section 48(a) ITC by satisfying the 5% ITC Safe Harbor. We may make further inventory purchases in future periods to extend the availability of each period’s Section 48(a) ITC. Our ability to raise capital from third-party investors is affected by general economic conditions, the state of the capital markets, inflation levels and concerns about our industry or business.
92
Table of Contents
Cost of Solar Energy Systems. Although the solar panel market has seen an increase in supply, upward pressure on prices may occur due to growth in the solar industry, regulatory policy changes, tariffs and duties and an increase in demand. As a result of these developments, we may pay higher prices on imported solar modules, which may make it less economical for us to serve certain markets. Attachment rates for energy storage systems have trended higher while the price to acquire has trended downward making the addition of energy storage systems a potential area of growth for us.
Energy Storage Systems. Our energy storage systems increase our customers’ independence from the centralized utility and provide on-site backup power when there is a grid outage due to storms, wildfires, other natural disasters and general power failures caused by supply or transmission issues. In addition, at times it can be more economic to consume less energy from the grid or, alternatively, to export solar energy back to the grid. Recent technological advancements for energy storage systems allow the energy storage system to adapt to pricing and utility rate shifts by controlling the inflows and outflows of power, allowing customers to increase the value of their solar energy system plus energy storage system. The energy storage system charges during the day, making the energy it stores available to the home when needed. It also features software that can customize power usage for the individual customer, providing backup power, optimizing solar energy consumption versus grid consumption or preventing export to the grid as appropriate. The software is tailored based on utility regulation, economic indicators and grid conditions. The combination of energy control, increased energy resilience and independence from the grid is strong incentive for customers to adopt solar and energy storage. As energy storage systems and their related software features become more advanced, we expect to see increased adoption of energy storage systems.
Government Regulations, Policies and Incentives. Our growth strategy depends in significant part on government policies and incentives that promote and support solar energy and enhance the economic viability of distributed residential solar. These incentives come in various forms, including net metering, eligibility for accelerated depreciation such as MACRS, SRECs, tax abatements, rebates, renewable targets, incentive programs and tax credits, particularly the Section 48(a) ITC and the Section 25D Credit. Policies requiring solar on new homes or new roofs, such as those enacted in California and New York City, also support the growth of distributed solar. The sale of SRECs has constituted a significant portion of our revenue historically. A change in the value of SRECs or changes in other policies or a loss or reduction in such incentives could decrease the attractiveness of distributed residential solar to us, our dealers and our customers in applicable markets, which could reduce our customer acquisition opportunities. Such a loss or reduction could also reduce our willingness to pursue certain customer acquisitions due to decreased revenue or income under our solar service agreements. Additionally, such a loss or reduction may also impact the terms of and availability of third-party financing. If any of these government regulations, policies or incentives are adversely amended, delayed, eliminated, reduced, retroactively changed or not extended beyond their current expiration dates or there is a negative impact from the recent federal law changes or proposals, our operating results and the demand for, and the economics of, distributed residential solar energy may decline, which could harm our business.
Components of Results of Operations
Revenue. We recognize revenue from contracts with customers as we satisfy our performance obligations at a transaction price reflecting an amount of consideration based upon an estimated rate of return. We express this rate of return as the solar rate per kWh in the customer contract. The amount of revenue we recognize does not equal customer cash payments because we satisfy performance obligations ahead of cash receipt or evenly as we provide continuous access on a stand-ready basis to the solar energy system. We reflect the differences between revenue recognition and cash payments received in accounts receivable, other assets or deferred revenue, as appropriate.
93
Table of Contents
PPAs. We have determined solar service agreements under which customers purchase electricity from us should be accounted for as revenue from contracts with customers. We recognize revenue based upon the amount of electricity delivered as determined by remote monitoring equipment at solar rates specified under the contracts. The PPAs generally have a term of 25 years with an opportunity for customers to renew for up to an additional 10 years, via two five-year renewal options.
Lease Agreements. We are the lessor under lease agreements for solar energy systems and energy storage systems, which we account for as revenue from contracts with customers. We recognize revenue on a straight-line basis over the contract term as we satisfy our obligation to provide continuous access to the solar energy system. The lease agreements generally have a term of 25 years with an opportunity for customers to renew for up to an additional 10 years, via two five-year renewal options.
We provide customers under our lease agreements a performance guarantee that each solar energy system will achieve a certain specified minimum solar energy production output. The specified minimum solar energy production output may not be achieved due to natural fluctuations in the weather or equipment failures from exposure and wear and tear outside of our control, among other factors. We determine the amount of guaranteed output based on a number of different factors, including (a) the specific site information relating to the tilt of the panels, azimuth (a horizontal angle measured clockwise in degrees from a reference direction) of the panels, size of the solar energy system and shading on site; (b) the calculated amount of available irradiance (amount of energy for a given flat surface facing a specific direction) based on historical average weather data and (c) the calculated amount of energy output of the solar energy system.
If the solar energy system does not produce the guaranteed production amount, we are required to provide a bill credit or refund a portion of the previously remitted customer payments, where the bill credit or repayment is calculated as the product of (a) the shortfall production amount and (b) the dollar amount (guaranteed rate) per kWh that is fixed throughout the term of the contract. These bill credits or remittances of a customer’s payments, if needed, are payable in January following the end of the first three years of the solar energy system’s placed in service date and then every annual period thereafter. See Note 17, Commitments and Contingencies, to our consolidated financial statements included in our Annual Report on Form 10-K for the year ended December 31, 2019 and Note 13, Commitments and Contingencies, to our unaudited condensed consolidated financial statements included in our Quarterly Report on Form 10-Q for the quarter ended March 31, 2020.
Loan Agreements. We recognize payments received from customers under loan agreements (a) as interest income, to the extent attributable to earned interest on the contract that financed the customer’s purchase of the solar energy system; (b) as a reduction of a note receivable on the balance sheet, to the extent attributable to a return of principal (whether scheduled or prepaid) on the contract that financed the customer’s purchase of the solar energy system; and (c) as revenue, to the extent attributable to payments for operations and maintenance services provided by us. Similar to our lease agreements, we provide customers under our loan agreements a performance guarantee that each solar energy system will achieve a certain specified minimum solar energy production output, which is a significant proportion of its expected output.
Solar Renewable Energy Certificates. Each SREC represents one megawatt hour (1,000 kWh) generated by a solar energy system. We sell SRECs to utilities and other third parties who use the SRECs to meet RPS and can do so with or without the actual electricity associated with the renewable-based generation source. We account for SRECs generated from solar energy systems owned by us, as opposed to those owned by our customers, as governmental incentives with no costs incurred to obtain them and do not consider those SRECs output of the underlying solar energy systems. We classify SRECs as inventory held until sold and delivered to third parties. We enter into economic
94
Table of Contents
hedges with major financial institutions related to expected production of SRECs through forward contracts to partially mitigate the risk of decreases in SREC market rates. The contracts require us to physically deliver the SRECs upon settlement. We recognize the related revenue upon the transfer of the SRECs to the counterparty. The costs related to the sales of SRECs are limited to fees for brokered transactions. Accordingly, the sale of SRECs in a period favorably impacts our operating results for that period.
Other Revenue. Other revenue includes certain state incentives, revenue from the direct sale of energy storage systems to customers and sales of service plans. We recognize revenue from state incentives in the periods in which they are incurred. We recognize revenue from the direct sale of energy storage systems in the period in which the storage components are placed in service. Service plans are available to customers whose solar energy system was not originally sold by Sunnova. We recognize revenue from service plan contracts over the life of the contract, which is typically five years.
Cost of Revenue—Depreciation. Cost of revenue—depreciation represents depreciation on solar energy systems under lease agreements and PPAs that have been placed in service.
Cost of Revenue—Other. Cost of revenue—other represents other items deemed to be a cost of providing the service of selling power to customers or potential customers, such as certain costs to service loan agreements, and costs for filing under the Uniform Commercial Code to maintain title, title searches, credit checks on potential customers at the time of initial contract and other similar costs, typically directly related to the volume of customers and potential customers.
Operations and Maintenance Expense. Operations and maintenance expense represents costs paid to third parties for maintaining and servicing the solar energy systems, property insurance and property taxes. In addition, operations and maintenance expense includes impairments due to natural disaster losses, losses on disposals and other impairments net of insurance proceeds recovered under our business interruption and property damage insurance coverage for natural disasters.
General and Administrative Expense. General and administrative expense represents costs for our employees, such as salaries, bonuses, benefits and all other employee-related costs, including stock-based compensation, professional fees related to legal, accounting, human resources, finance and training, information technology and software services, marketing and communications, travel and rent and other office-related expenses. General and administrative expense also includes depreciation on assets not classified as solar energy systems, including information technology software and development projects, vehicles, furniture, fixtures, computer equipment and leasehold improvements and accretion expense on AROs. We capitalize a portion of general and administrative costs, such as payroll-related costs, that is related to employees who are directly involved in the design, construction, installation and testing of the solar energy systems but not directly associated with a particular asset. We also capitalize a portion of general and administrative costs, such as payroll-related costs, that is related to employees who are directly associated with and devote time to internal information technology software and development projects, to the extent of the time spent directly on the application and development stage of such software project.
Interest Expense, Net. Interest expense, net represents interest on our borrowings under our various debt facilities and amortization of debt discounts and deferred financing costs.
Interest Expense, Net—Affiliates. Interest expense, net—affiliates represents interest expense on our debt facilities, including the amortization of the debt discounts, held by our affiliates.
Interest Income. Interest income represents interest income from the notes receivable under our loan program and income on short term investments with financial institutions.
95
Table of Contents
Income Tax. We account for income taxes under Accounting Standards Codification 740, Income Taxes. As such, we determine deferred tax assets and liabilities based on temporary differences resulting from the different treatment of items for tax and financial reporting purposes. We measure deferred tax assets and liabilities using enacted tax rates expected to apply to taxable income in the years in which those temporary differences are expected to reverse. Additionally, we must assess the likelihood that deferred tax assets will be recovered as deductions from future taxable income. We have a full valuation allowance on our deferred tax assets because we believe it is more likely than not that our deferred tax assets will not be realized. We evaluate the recoverability of our deferred tax assets on a quarterly basis. Currently, there is no provision or benefit for income taxes as we have incurred losses to date.
Net (Loss) Income Attributable to Redeemable Noncontrolling Interests. Net income attributable to redeemable noncontrolling interests represents third-party interests in the net assets of certain consolidated subsidiaries.
Results of Operations—Three Months Ended March 31, 2020 Compared to Three Months Ended March 31, 2019
The following table sets forth our unaudited condensed consolidated statements of operations data for the periods indicated.
| Three Months Ended March 31, |
||||||||||||
| 2020 | 2019 | Change | ||||||||||
| (Unaudited, in thousands) | ||||||||||||
| Revenue |
$ | 29,829 | $ | 26,715 | $ | 3,114 | ||||||
| Operating expense: |
||||||||||||
| Cost of revenue-depreciation |
12,986 | 9,653 | 3,333 | |||||||||
| Cost of revenue-other |
1,043 | 652 | 391 | |||||||||
| Operations and maintenance |
2,219 | 2,254 | (35 | ) | ||||||||
| General and administrative |
27,893 | 18,681 | 9,212 | |||||||||
| Other operating income |
(6 | ) | (18 | ) | 12 | |||||||
|
|
|
|
|
|
|
|||||||
| Total operating expense, net |
44,135 | 31,222 | 12,913 | |||||||||
|
|
|
|
|
|
|
|||||||
| Operating loss |
(14,306 | ) | (4,507 | ) | (9,799 | ) | ||||||
| Interest expense, net |
67,318 | 31,661 | 35,657 | |||||||||
| Interest expense, net-affiliates |
— | 1,822 | (1,822 | ) | ||||||||
| Interest income |
(4,620 | ) | (2,494 | ) | (2,126 | ) | ||||||
|
|
|
|
|
|
|
|||||||
| Loss before income tax |
(77,004 | ) | (35,496 | ) | (41,508 | ) | ||||||
| Income tax |
— | — | — | |||||||||
|
|
|
|
|
|
|
|||||||
| Net loss |
(77,004 | ) | (35,496 | ) | (41,508 | ) | ||||||
| Net income (loss) attributable to redeemable noncontrolling interests |
(5,929 | ) | 3,018 | (8,947 | ) | |||||||
|
|
|
|
|
|
|
|||||||
| Net loss attributable to stockholders |
$ | (71,075 | ) | $ | (38,514 | ) | $ | (32,561 | ) | |||
|
|
|
|
|
|
|
|||||||
96
Table of Contents
Revenue
| Three Months Ended March 31, |
||||||||||||
| 2020 | 2019 | Change | ||||||||||
| (Unaudited, in thousands) | ||||||||||||
| PPA revenue |
$ | 12,633 | $ | 9,612 | $ | 3,021 | ||||||
| Lease revenue |
11,542 | 9,638 | 1,904 | |||||||||
| SREC revenue |
4,363 | 6,592 | (2,229 | ) | ||||||||
| Loan revenue |
599 | 371 | 228 | |||||||||
| Other revenue |
692 | 502 | 190 | |||||||||
|
|
|
|
|
|
|
|||||||
| Total |
$ | 29,829 | $ | 26,715 | $ | 3,114 | ||||||
|
|
|
|
|
|
|
|||||||
Revenue increased by $3.1 million in the three months ended March 31, 2020 compared to the three months ended March 31, 2019 primarily as a result of an increased number of solar energy systems in service. The weighted average number of customers (excluding customers with loan agreements) increased from approximately 55,300 for the three months ended March 31, 2019 to approximately 70,100 for the three months ended March 31, 2020. Excluding SREC revenue and revenue under our loan agreements, on a weighted average number of customers basis, revenue remained relatively flat at $357 per customer for the three months ended March 31, 2019 compared to $355 per customer for the same period in 2020 (1% decrease). SREC revenue decreased by $2.2 million in the three months ended March 31, 2020 compared to the three months ended March 31, 2019 primarily as a result of $2.8 million related to certain forward sales of SRECs in 2019. The fluctuations in SREC revenue from period to period are also affected by the total number of solar energy systems, weather seasonality and hedge and spot prices associated with the timing of the sale of SRECs. On a weighted average number of customers basis, revenues under our loan agreements decreased from $55 per customer for the three months ended March 31, 2019 to $51 per customer for the same period in 2020 (8% decrease) primarily due to market changes.
Cost of Revenue—Depreciation
| Three Months Ended March 31, |
||||||||||||
| 2020 | 2019 | Change | ||||||||||
| (Unaudited, in thousands) | ||||||||||||
| Cost of revenue-depreciation |
$ | 12,986 | $ | 9,653 | $ | 3,333 | ||||||
Cost of revenue-depreciation increased by $3.3 million in the three months ended March 31, 2020 compared to the three months ended March 31, 2019. This increase was primarily driven by an increase in the weighted average number of customers (excluding customers with loan agreements) from approximately 55,300 for the three months ended March 31, 2019 to approximately 70,100 for the three months ended March 31, 2020. On a weighted average number of customers basis, cost of revenue-depreciation increased from $175 per customer for the three months ended March 31, 2019 to $185 per customer for the same period in 2020.
Cost of Revenue—Other
| Three Months Ended March 31, |
||||||||||||
| 2020 | 2019 | Change | ||||||||||
| (Unaudited, in thousands) | ||||||||||||
| Cost of revenue-other |
$ | 1,043 | $ | 652 | $ | 391 | ||||||
97
Table of Contents
Cost of revenue-other increased by $0.4 million in the three months ended March 31, 2020 compared to the three months ended March 31, 2019. This increase was primarily driven by an increase in fees related to filings required under the Uniform Commercial Code to maintain title, title searches and credit checks due to increased activity.
Operations and Maintenance Expense
| Three Months Ended March 31, |
||||||||||||
| 2020 | 2019 | Change | ||||||||||
| (Unaudited, in thousands) | ||||||||||||
| Operations and maintenance |
$ | 2,219 | $ | 2,254 | $ | (35 | ) | |||||
Operations and maintenance expense remained relatively flat at $2.2 million for the three months ended March 31, 2020 compared to $2.3 million for the three months ended March 31, 2019. Operations and maintenance expense per customer, excluding net natural disaster losses, decreased to $31 per customer for the three months ended March 31, 2020 compared to $41 per customer for the three months ended March 31, 2019 as a result of operational efficiencies.
General and Administrative Expense
| Three Months Ended March 31, |
||||||||||||
| 2020 | 2019 | Change | ||||||||||
| (Unaudited, in thousands) | ||||||||||||
| General and administrative |
$ | 27,893 | $ | 18,681 | $ | 9,212 | ||||||
General and administrative expense increased by $9.2 million in the three months ended March 31, 2020 compared to the three months ended March 31, 2019 primarily due to increases in payroll and employee related expenses of $4.4 million due to the hiring of personnel to support growth and non-cash compensation expense, provision for current expected credit losses of $1.9 million, insurance expenses of $1.8 million and consultants, contractors and professional fees of $1.2 million.
Interest Expense, Net
| Three Months Ended March 31, |
||||||||||||
| 2020 | 2019 | Change | ||||||||||
| (Unaudited, in thousands) | ||||||||||||
| Interest expense, net |
$ | 67,318 | $ | 31,661 | $ | 35,657 | ||||||
Interest expense, net increased by $35.7 million in the three months ended March 31, 2020 compared to the three months ended March 31, 2019. This increase was primarily driven by increases in realized loss on interest rate swaps of $28.3 million due to the termination of certain debt facilities in 2020, interest expense of $5.7 million due to an increase in the principal debt balance after entering into new financing arrangements and debt discount amortization of $4.2 million.
Interest Expense, Net-Affiliates
| Three Months Ended March 31, |
||||||||||||
| 2020 | 2019 | Change | ||||||||||
| (Unaudited, in thousands) | ||||||||||||
| Interest expense, net-affiliates |
$ | — | $ | 1,822 | $ | (1,822 | ) | |||||
98
Table of Contents
Interest expense, net-affiliates decreased by $1.8 million in the three months ended March 31, 2020 compared to the three months ended March 31, 2019 primarily due to a decrease in interest expense due to the redemption of the senior secured notes and conversion of the convertible notes in July 2019.
Interest Income
| Three Months Ended March 31, |
||||||||||||
| 2020 | 2019 | Change | ||||||||||
| (Unaudited, in thousands) | ||||||||||||
| Interest income |
$ | 4,620 | $ | 2,494 | $ | 2,126 | ||||||
Interest income increased by $2.1 million in the three months ended March 31, 2020 compared to the three months ended March 31, 2019. This increase was primarily driven by an increase in the weighted average number of customers with loan agreements from approximately 6,700 for the three months ended March 31, 2019 to approximately 11,800 for the three months ended March 31, 2020. On a weighted average number of customers basis, loan interest income increased from $347 per customer for the three months ended March 31, 2019 to $371 per customer for the three months ended March 31, 2020 (7% increase) primarily due to higher average loan storage balances.
Income Tax
We do not have income tax expense or benefit due to pre-tax losses and a full valuation allowance recorded for the three months ended March 31, 2020 and 2019.
Net Income (Loss) Attributable to Redeemable Noncontrolling Interests
Net income (loss) attributable to redeemable noncontrolling interests decreased by $8.9 million for the three months ended March 31, 2020 compared to the three months ended March 31, 2019 primarily due to a loss attributable to redeemable noncontrolling interests from a tax equity fund added in late 2019.
99
Table of Contents
Results of Operations—Year Ended December 31, 2019 Compared to Year Ended December 31, 2018
The following table sets forth our consolidated statements of operations data for the periods indicated.
| Year Ended December 31, |
Change | |||||||||||
| 2019 | 2018 | |||||||||||
| (in thousands) | ||||||||||||
| Revenue |
$ | 131,556 | $ | 104,382 | $ | 27,174 | ||||||
| Operating expense: |
||||||||||||
| Cost of revenue—depreciation |
43,536 | 34,710 | 8,826 | |||||||||
| Cost of revenue—other |
3,877 | 2,007 | 1,870 | |||||||||
| Operations and maintenance |
8,588 | 14,035 | (5,447 | ) | ||||||||
| General and administrative |
97,986 | 67,430 | 30,556 | |||||||||
| Other operating income |
(161 | ) | (70 | ) | (91 | ) | ||||||
|
|
|
|
|
|
|
|||||||
| Total operating expense, net |
153,826 | 118,112 | 35,714 | |||||||||
|
|
|
|
|
|
|
|||||||
| Operating loss |
(22,270 | ) | (13,730 | ) | (8,540 | ) | ||||||
| Interest expense, net |
108,024 | 51,582 | 56,442 | |||||||||
| Interest expense, net—affiliates |
4,098 | 9,548 | (5,450 | ) | ||||||||
| Interest income |
(12,483 | ) | (6,450 | ) | (6,033 | ) | ||||||
| Loss on extinguishment of long-term debt, net—affiliates |
10,645 | — | 10,645 | |||||||||
| Other (income) expense |
880 | (1 | ) | 881 | ||||||||
|
|
|
|
|
|
|
|||||||
| Loss before income tax |
(133,434 | ) | (68,409 | ) | (65,025 | ) | ||||||
| Income tax |
— | — | — | |||||||||
|
|
|
|
|
|
|
|||||||
| Net loss |
(133,434 | ) | (68,409 | ) | (65,025 | ) | ||||||
| Net income attributable to redeemable noncontrolling interests |
10,917 | 5,837 | 5,080 | |||||||||
|
|
|
|
|
|
|
|||||||
| Net loss attributable to stockholders |
$ | (144,351 | ) | $ | (74,246 | ) | $ | (70,105 | ) | |||
|
|
|
|
|
|
|
|||||||
Revenue
| Year Ended December 31, |
||||||||||||
| 2019 | 2018 | Change | ||||||||||
| (in thousands) | ||||||||||||
| PPA revenue |
$ | 48,041 | $ | 38,950 | $ | 9,091 | ||||||
| Lease revenue |
40,191 | 33,079 | 7,112 | |||||||||
| SREC revenue |
38,453 | 30,630 | 7,823 | |||||||||
| Loan revenue |
1,645 | 933 | 712 | |||||||||
| Other revenue |
3,226 | 790 | 2,436 | |||||||||
|
|
|
|
|
|
|
|||||||
| Total |
$ | 131,556 | $ | 104,382 | $ | 27,174 | ||||||
|
|
|
|
|
|
|
|||||||
Revenue increased by $27.2 million in the year ended December 31, 2019 compared to the year ended December 31, 2018 primarily as a result of an increased number of solar energy systems in service. The weighted average number of customers (excluding customers with loan agreements) increased from approximately 49,200 for the year ended December 31, 2018 to approximately 60,100 for the year ended December 31, 2019. Excluding SREC revenue and revenue under our loan agreements, on a weighted average number of customers basis, revenue increased from $1,480 per
100
Table of Contents
customer for the year ended December 31, 2018 to $1,522 per customer for the same period in 2019 (3% increase). The year over year difference in revenue per customer was affected by (a) the market mix of portfolio and relative yields in those markets, (b) weather variability and (c) the impact of Hurricane Maria on Puerto Rico revenues (for which billing was largely curtailed for approximately two months beginning in September 2017 and then gradually increased over time until billing was materially resumed by August 2018). SREC revenue increased by $7.8 million in the year ended December 31, 2019 compared to the year ended December 31, 2018 primarily as a result of an increase in the number of solar energy systems in service, which resulted in additional SREC production, and $3.0 million related to certain forward sales of SRECs. The fluctuations in SREC revenue from period to period are affected by the total number of solar energy systems, weather seasonality and hedge and spot prices associated with the timing of the sale of SRECs. On a weighted average number of customers basis, revenues under our loan agreements decreased from $222 per customer for the year ended December 31, 2018 to $196 per customer for the same period in 2019 (12% decrease) primarily due to market changes.
Cost of Revenue—Depreciation
| Year Ended December 31, |
||||||||||||
| 2019 | 2018 | Change | ||||||||||
| (in thousands) | ||||||||||||
| Cost of revenue—depreciation |
$ | 43,536 | $ | 34,710 | $ | 8,826 | ||||||
Cost of revenue—depreciation increased by $8.8 million in the year ended December 31, 2019 compared to the year ended December 31, 2018. This increase was primarily driven by an increase in the weighted average number of customers (excluding customers with loan agreements) from approximately 49,200 for the year ended December 31, 2018 to approximately 60,100 for the year ended December 31, 2019. On a weighted average number of customers basis, cost of revenue—depreciation remained relatively flat at $705 per customer for the year ended December 31, 2018 compared to $724 per customer for the same period in 2019.
Cost of Revenue—Other
| Year Ended December 31, |
||||||||||||
| 2019 | 2018 | Change | ||||||||||
| (in thousands) | ||||||||||||
| Cost of revenue—other |
$ | 3,877 | $ | 2,007 | $ | 1,870 | ||||||
Cost of revenue—other increased by $1.9 million in the year ended December 31, 2019 compared to the year ended December 31, 2018. This increase was primarily driven by increases in costs related to energy storage systems of $1.2 million as a result of the introduction of energy storage systems as a new product offering in late 2018.
Operations and Maintenance Expense
| Year Ended December 31, |
||||||||||||
| 2019 | 2018 | Change | ||||||||||
| (in thousands) | ||||||||||||
| Operations and maintenance |
$ | 8,588 | $ | 14,035 | $ | (5,447 | ) | |||||
101
Table of Contents
Operations and maintenance expense decreased by $5.4 million for the year ended December 31, 2019 compared to the year ended December 31, 2018. The decrease was primarily due to a decrease in impairments and other related charges due to natural disaster losses of $4.7 million related primarily to Hurricane Maria, which occurred in September 2017 and for which $2.7 million of business interruptions proceeds were received in October 2018. A significant portion of Hurricane Maria charges occurred during the fourth quarter of 2018 as the completion of the repairs for solar energy systems damaged by the hurricane and the completion of the analysis regarding whether a solar energy system damaged by the hurricane was recoverable took an extensive amount of time for many of the assets and customers. Operations and maintenance expense per customer, excluding net natural disaster losses, decreased to $142 per customer for the year ended December 31, 2019 compared to $188 per customer for the year ended December 31, 2018 as a result of operational efficiencies.
General and Administrative Expense
| Year Ended December 31, |
||||||||||||
| 2019 | 2018 | Change | ||||||||||
| (in thousands) | ||||||||||||
| General and administrative |
$ | 97,986 | $ | 67,430 | $ | 30,556 | ||||||
General and administrative expense increased by $30.6 million in the year ended December 31, 2019 compared to the year ended December 31, 2018 primarily due to increases in payroll and employee related expenses of $14.0 million due to the hiring of personnel to support growth and additional non-cash compensation expense in connection with our IPO, consultants, contractors and professional fees of $4.0 million, insurance expenses of $3.2 million, IPO costs of $3.2 million, loss on unenforceable contracts of $2.4 million relating to certain loans originated in 2019 that did not meet certain applicable regulatory requirements, marketing and communications expenses of $1.6 million, depreciation expense not related to solar energy systems of $1.2 million, travel and related business expenses of $0.9 million and bad debt expense of $0.7 million.
Interest Expense, Net
| Year Ended December 31, |
||||||||||||
| 2019 | 2018 | Change | ||||||||||
| (in thousands) | ||||||||||||
| Interest expense, net |
$ | 108,024 | $ | 51,582 | $ | 56,442 | ||||||
Interest expense, net increased by $56.4 million in the year ended December 31, 2019 compared to the year ended December 31, 2018. This increase was primarily driven by increases in realized loss on interest rate swaps of $30.2 million, unrealized loss on interest rate swaps of $13.1 million and interest expense of $10.8 million due to an increase in the principal debt balance after entering into new financing arrangements.
Interest Expense, Net—Affiliates
| Year Ended December 31, |
||||||||||||
| 2019 | 2018 | Change | ||||||||||
| (in thousands) | ||||||||||||
| Interest expense, net—affiliates |
$ | 4,098 | $ | 9,548 | $ | (5,450 | ) | |||||
102
Table of Contents
Interest expense, net—affiliates decreased by $5.5 million in the year ended December 31, 2019 compared to the year ended December 31, 2018 primarily due to a decrease in interest expense due to a decrease in the principal debt balance between the periods and due to the redemption of the senior secured notes and conversion of the convertible notes in July 2019.
Interest Income
| Year Ended December 31, |
||||||||||||
| 2019 | 2018 | Change | ||||||||||
| (in thousands) | ||||||||||||
| Interest income |
$ | 12,483 | $ | 6,450 | $ | 6,033 | ||||||
Interest income increased by $6.0 million in the year ended December 31, 2019 compared to the year ended December 31, 2018. This increase was primarily driven by the increase in the weighted average number of customers with loan agreements from approximately 4,200 for the year ended December 31, 2018 to approximately 8,400 for the year ended December 31, 2019. On a weighted average number of customers basis, loan interest income decreased from $1,464 per customer for the year ended December 31, 2018 to $1,380 per customer for the year ended December 31, 2019 (6% decrease) due to the fact that interest for the first 18 months on solar energy systems placed in service starting in July 2017 are based on 70% of the total amount financed under the loan, as the other 30% is interest free prior to the due date of the 30% prepayment typically due on the 18th month; while interest on solar energy systems placed in service in prior periods was based on the entire financed amount.
Loss on Extinguishment of Long-Term Debt, Net—Affiliates
Loss on extinguishment of long-term debt, net—affiliates increased by $10.6 million in the year ended December 31, 2019 compared to the year ended December 31, 2018 due to the amendment of the senior secured notes in April 2019 that met the criteria for extinguishment accounting under GAAP.
Income Tax
We do not have income tax expense or benefit due to pre-tax losses and a full valuation allowance recorded for the years ended December 31, 2019 and 2018. See “—Components of Results of Operations—Income Tax”.
Net Income Attributable to Redeemable Noncontrolling Interests
Net income attributable to redeemable noncontrolling interests increased by $5.1 million for the year ended December 31, 2019 compared to the year ended December 31, 2018 primarily due to an increase in income attributable to redeemable noncontrolling interests due to tax equity funds added in 2018 and 2019.
103
Table of Contents
Results of Operations—Year Ended December 31, 2018 Compared to Year Ended December 31, 2017
The following table sets forth our consolidated statements of operations data for the periods indicated.
| Year Ended December 31, |
||||||||||||
| 2018 | 2017 | Change | ||||||||||
| (in thousands) | ||||||||||||
| Revenue |
$ | 104,382 | $ | 76,856 | $ | 27,526 | ||||||
| Operating expense: |
||||||||||||
| Cost of revenue—depreciation |
34,710 | 25,896 | 8,814 | |||||||||
| Cost of revenue—other |
2,007 | 1,444 | 563 | |||||||||
| Operations and maintenance |
14,035 | 4,994 | 9,041 | |||||||||
| General and administrative |
67,430 | 54,863 | 12,567 | |||||||||
| Other operating expense (income) |
(70 | ) | 14 | (84 | ) | |||||||
|
|
|
|
|
|
|
|||||||
| Total operating expense, net |
118,112 | 87,211 | 30,901 | |||||||||
|
|
|
|
|
|
|
|||||||
| Operating loss |
(13,730 | ) | (10,355 | ) | (3,375 | ) | ||||||
| Interest expense, net |
51,582 | 59,847 | (8,265 | ) | ||||||||
| Interest expense, net—affiliates |
9,548 | 23,177 | (13,629 | ) | ||||||||
| Interest income |
(6,450 | ) | (3,197 | ) | (3,253 | ) | ||||||
| Other (income) expense |
(1 | ) | — | (1 | ) | |||||||
|
|
|
|
|
|
|
|||||||
| Loss before income tax |
(68,409 | ) | (90,182 | ) | 21,773 | |||||||
| Income tax |
— | — | — | |||||||||
|
|
|
|
|
|
|
|||||||
| Net loss |
(68,409 | ) | (90,182 | ) | 21,773 | |||||||
| Net income attributable to redeemable noncontrolling interests |
5,837 | 903 | 4,934 | |||||||||
|
|
|
|
|
|
|
|||||||
| Net loss attributable to stockholders |
$ | (74,246 | ) | $ | (91,085 | ) | $ | 16,839 | ||||
|
|
|
|
|
|
|
|||||||
Revenue
| Year Ended December 31, |
||||||||||||
| 2018 | 2017 | Change | ||||||||||
| (in thousands) | ||||||||||||
| PPA revenue |
$ | 38,950 | $ | 29,171 | $ | 9,779 | ||||||
| Lease revenue |
33,079 | 21,866 | 11,213 | |||||||||
| SREC revenue |
30,630 | 24,833 | 5,797 | |||||||||
| Loan revenue |
933 | 479 | 454 | |||||||||
| Other revenue |
790 | 507 | 283 | |||||||||
|
|
|
|
|
|
|
|||||||
| Total |
$ | 104,382 | $ | 76,856 | $ | 27,526 | ||||||
|
|
|
|
|
|
|
|||||||
Revenue increased by $27.5 million in the year ended December 31, 2018 compared to the year ended December 31, 2017 primarily as a result of an increased number of solar energy systems in service. The weighted average number of customers (excluding customers with loan agreements) increased from approximately 37,000 for the year ended December 31, 2017 to approximately 49,200 for the year ended December 31, 2018. Excluding SREC revenue and revenue under our loan agreements, on a weighted average number of customers basis, revenue increased from $1,393 per customer for the year ended December 31, 2017 to $1,480 per customer for the same period in 2018
104
Table of Contents
(6% increase). The year over year difference in revenue per customer was affected by (a) the market mix of portfolio and relative yields in those markets, (b) weather variability and (c) the impact of Hurricane Maria on Puerto Rico revenues (for which billing was largely curtailed for approximately two months beginning in September 2017 and then gradually increased over time until billing was materially resumed by August 2018). SREC revenue increased by $5.8 million in the year ended December 31, 2018 compared to the year ended December 31, 2017 primarily as a result of an increase in the number of solar energy systems in service, which resulted in additional SREC production. The fluctuations in SREC revenue from period to period are affected by the total number of solar energy systems, weather seasonality and hedge and spot prices associated with the timing of the sale of SRECs. On a weighted average number of customers basis, revenues under our loan agreements decreased from $266 per customer for the year ended December 31, 2017 to $222 per customer for the same period in 2018 (17% decrease) primarily due to market changes.
Cost of Revenue—Depreciation
| Year Ended December 31, |
||||||||||||
| 2018 | 2017 | Change | ||||||||||
| (in thousands) | ||||||||||||
| Cost of revenue—depreciation |
$ | 34,710 | $ | 25,896 | $ | 8,814 | ||||||
Cost of revenue—depreciation increased by $8.8 million in the year ended December 31, 2018 compared to the year ended December 31, 2017. This increase was primarily driven by an increase in the weighted average number of customers (excluding customers with loan agreements) from approximately 37,000 for the year ended December 31, 2017 to approximately 49,200 for the year ended December 31, 2018. On a weighted average number of customers basis, cost of revenue—depreciation remained relatively flat at $700 per customer for the year ended December 31, 2017 compared to $705 per customer for the same period in 2018.
Cost of Revenue—Other
| Year Ended December 31, |
||||||||||||
| 2018 | 2017 | Change | ||||||||||
| (in thousands) | ||||||||||||
| Cost of revenue—other |
$ | 2,007 | $ | 1,444 | $ | 563 | ||||||
Cost of revenue—other increased by $0.6 million in the year ended December 31, 2018 compared to the year ended December 31, 2017. This increase was primarily driven by an increase in costs related to repairs and maintenance, production guarantees and parts and supplies as a result of the increase in the weighted average number of customers with loan agreements from approximately 1,800 for the year ended December 31, 2017 to approximately 4,200 for the year ended December 31, 2018.
Operations and Maintenance Expense
| Year Ended December 31, |
||||||||||||
| 2018 | 2017 | Change | ||||||||||
| (in thousands) | ||||||||||||
| Operations and maintenance |
$ | 14,035 | $ | 4,994 | $ | 9,041 | ||||||
Operations and maintenance expense increased by $9.0 million for the year ended December 31, 2018 compared to the year ended December 31, 2017. The increase was primarily driven by an
105
Table of Contents
increase in the monthly average cost per customer for operations and maintenance expense, excluding net natural disaster losses, from $146 per customer for the year ended December 31, 2017 to $188 per customer for the same period in 2018 (29% increase). The increase in operations and maintenance expense was also due to an increase in the weighted average number of customers (excluding customers with loan agreements) from approximately 37,000 for the year ended December 31, 2017 to approximately 49,200 for the year ended December 31, 2018, resulting in more service orders in 2018. The operations and maintenance expense per customer increased primarily due to higher repairs and maintenance expense, impairments and loss on disposals, meter replacement costs, higher equipment costs and higher percentage of cases completed with third-party labor in 2018 (thus increasing the average cost per closed case). In addition, operations and maintenance expense includes impairments of $5.8 million and $0.8 million for the years ended December 31, 2018 and 2017, respectively, due to natural disaster losses related primarily to Hurricane Maria, which occurred in September 2017, and other natural disasters, such as California wildfires in October 2017 and November 2018 and a typhoon in Saipan in October 2018. Operations and maintenance expense is net of both the insurance proceeds related to property damage, as estimated or completed in the periods, and the insurance proceeds related to business interruption. A significant portion of Hurricane Maria charges occurred during the fourth quarter of 2018 as the completion of the repairs for solar energy systems damaged by the hurricane and the completion of the analysis regarding whether a solar energy system damaged by the hurricane was recoverable and not recoverable took an extensive amount of time for many of the assets and customers. For further discussion of operations and maintenance expense related to natural disasters, see Note 4, Natural Disaster Losses, to our consolidated financial statements included in our Annual Report on Form 10-K for the year ended December 31, 2019.
General and Administrative Expense
| Year Ended December 31, |
Change | |||||||||||
| 2018 | 2017 | |||||||||||
| (in thousands) | ||||||||||||
| General and administrative |
$ | 67,430 | $ | 54,863 | $ | 12,567 | ||||||
General and administrative expense increased by $12.6 million in the year ended December 31, 2018 compared to the year ended December 31, 2017 primarily due to increases in payroll and employee related expenses of $3.5 million due to the hiring of personnel to support growth, legal and settlements expense of $1.3 million due to dealer litigation and various other general legal matters, financing deal costs of $1.6 million primarily related to $1.5 million of costs written off in March 2018 for a financing facility as it did not materialize, depreciation expense not related to solar energy systems of $1.0 million, IPO costs of $0.6 million and natural disaster losses and related charges of $0.6 million due to Hurricane Maria in Puerto Rico in September 2017.
Interest Expense, Net
| Year Ended December 31, |
||||||||||||
| 2018 | 2017 | Change | ||||||||||
| (in thousands) | ||||||||||||
| Interest expense, net |
$ | 51,582 | $ | 59,847 | $ | (8,265 | ) | |||||
Interest expense, net decreased by $8.3 million in the year ended December 31, 2018 compared to the year ended December 31, 2017. This decrease was primarily driven by an increase in realized gain on interest rate swaps of $20.3 million primarily due to the settlement of interest rate swaps related to repayments on subsidiary debt in November 2018 and a decrease in amortization of deferred
106
Table of Contents
financing costs of $5.5 million due to accelerated amortization from early pay-offs and retirement of debt in April 2017. This decrease was offset by an increase in interest expense of $17.5 million due to higher levels of outstanding debt in 2018.
Interest Expense, Net—Affiliates
| Year Ended December 31, |
||||||||||||
| 2018 | 2017 | Change | ||||||||||
| (in thousands) | ||||||||||||
| Interest expense, net—affiliates |
$ | 9,548 | $ | 23,177 | $ | (13,629 | ) | |||||
Interest expense, net—affiliates decreased by $13.6 million in the year ended December 31, 2018 compared to the year ended December 31, 2017 primarily due to a decrease of $9.0 million in amortization of debt discounts as Sunnova Asset Portfolio 5 Holdings, LLC’s debt was paid down in April 2017 and a decrease in interest expense of $4.8 million due to a decrease in the principal debt balance between the periods.
Interest Income
| Year Ended December 31, |
||||||||||||
| 2018 | 2017 | Change | ||||||||||
| (in thousands) | ||||||||||||
| Interest income |
$ | 6,450 | $ | 3,197 | $ | 3,253 | ||||||
Interest income increased by $3.3 million in the year ended December 31, 2018 compared to the year ended December 31, 2017. This increase was primarily driven by the increase in the weighted average number of customers with loan agreements from approximately 1,800 for the year ended December 31, 2017 to approximately 4,200 for the year ended December 31, 2018. On a weighted average number of customers basis, loan interest income decreased from $1,668 per customer for the year ended December 31, 2017 to $1,464 per customer for the year ended December 31, 2018 (12% decrease) due to the fact that interest for the first 18 months on solar energy systems placed in service starting in July 2017 are based on 70% of the total amount financed under the loan, as the other 30% is interest free prior to the due date of the 30% prepayment typically due on the 18th month; while interest on solar energy systems placed in service in prior periods was based on the entire financed amount.
Income Tax
We do not have income tax expense or benefit due to pre-tax losses and a full valuation allowance recorded for the years ended December 31, 2018 and 2017. See “—Components of Results of Operations—Income Tax”.
Net Income Attributable to Redeemable Noncontrolling Interests
Net income attributable to redeemable noncontrolling interests increased by $4.9 million for the year ended December 31, 2018 compared to the year ended December 31, 2017 primarily due to the addition of two tax equity funds in December 2017 and a full year of income on assets placed in service in 2017.
107
Table of Contents
Liquidity and Capital Resources
As of March 31, 2020, we had total cash of $169.2 million, of which $73.4 million was unrestricted, and $43.6 million of available borrowing capacity under our various financing arrangements. We seek to maintain diversified and cost-effective funding sources to finance and maintain our operations, fund capital expenditures, including customer acquisitions, and satisfy obligations arising from our indebtedness. Historically, our primary sources of liquidity included non-recourse and recourse debt, investor asset-backed and loan-backed securitizations and cash generated from operations. Our business model requires substantial outside financing arrangements to grow the business and facilitate the deployment of additional solar energy systems. We will seek to raise additional required capital, including from new and existing tax equity investors, additional borrowings, securitizations and other potential debt and equity financing sources. As of March 31, 2020, we were in material compliance with all debt covenants under our financing arrangements.
Additionally, from time-to-time we evaluate the potential acquisition of solar energy systems, energy storage systems and related businesses and joint ventures. As a part of these efforts, we may engage in discussions with potential sellers or other parties regarding the possible purchase of or investment in assets and operations that are strategic and complementary to our existing operations. In addition, we have in the past evaluated and pursued, and may in the future evaluate and pursue, the acquisition of or investment in other energy-related assets that have characteristics and opportunities similar to our existing business lines and enable us to leverage our assets, knowledge and skill sets. Such efforts may involve participation by us in processes that have been made public and involve a number of potential buyers or investors, commonly referred to as “auction” processes, as well as situations in which we believe we are the only party or one of a limited number of parties who are in negotiations with the potential seller or other party. These acquisition and investment efforts may involve assets which, if acquired or constructed, could have a material effect on our financial condition and results of operations.
We expect our solar energy systems in service to generate a positive return rate over the customer agreement, typically 25 years. Typically, once residential solar energy systems commence operations, they do not require significant additional capital expenditures to maintain operating performance. However, in order to grow, we are currently dependent on financing from outside parties. We believe we will have sufficient cash, investment fund commitments and securitization commitments, as described below, together with cash flows from operations to meet our working capital, debt service obligations, contingencies and anticipated required capital expenditures, including customer acquisitions, for at least the next 12 months. However, we are subject to business and operational risks that could adversely affect our ability to raise additional financing. If financing is not available to us on acceptable terms if and when needed, we may be unable to finance installation of our new customers’ solar energy systems in a manner consistent with our past performance, our cost of capital could increase, or we may be required to significantly reduce the scope of our operations, any of which would have a material adverse effect on our business, financial condition, results of operations and prospects. In addition, our tax equity funds and debt instruments impose restrictions on our ability to draw on financing commitments. If we are unable to satisfy such conditions, we may incur penalties for non-performance under certain tax equity funds, experience installation delays, or be unable to make installations in accordance with our plans or at all. Any of these factors could also impact customer satisfaction, our business, operating results, prospects and financial condition.
Financing Arrangements
The following is a discussion of certain of our financing arrangements. For further discussion of our financing arrangements and facilities, see Note 8, Long-Term Debt, to our consolidated financial statements included in our Annual Report on Form 10-K for the year ended December 31, 2019,
108
Table of Contents
Note 7, Long-Term Debt, to our consolidated financial statements included in our Quarterly Report on Form 10-Q for the quarter ended March 31, 2020 and “Management’s Discussion and Analysis of Financial Condition and Results of Operations—Liquidity and Capital Resources—Financing Arrangements” in our Annual Report on Form 10-K filed with the SEC on February 25, 2020 and in our Quarterly Report on Form 10-Q filed with the SEC on May 15, 2020.
Tax Equity Fund Commitments
As of March 31, 2020, we had undrawn committed capital of approximately $23.7 million under our tax equity funds, which may only be used to purchase and install solar energy systems. We intend to establish new tax equity funds in the future depending on their attractiveness, including the availability and size of Section 48(a) ITCs and related safe harbors, and on the investor demand for such funding. In May 2020, we admitted a tax equity investor with a total capital commitment of $75.0 million. For additional information regarding our tax equity fund commitments see Note 13, Redeemable Noncontrolling Interests, to our consolidated financial statements included in our Annual Report on Form 10-K for the year ended December 31, 2019 and and Note 12, Redeemable Noncontrolling Interests, to our consolidated financial statements included in our Quarterly Report on Form 10-Q for the quarter ended March 31, 2020.
Warehouse and Other Debt Financings
We from time to time enter into warehouse credit facilities as a source of funding. Under the warehouse credit facilities, revolving or term financing is provided to special purpose entities, which are typically our wholly-owned subsidiaries, and secured by qualifying solar energy systems and related solar service agreements. The cash flows generated by these solar energy systems are used to cover required debt service payments under the related credit facility and satisfy the expenses and reserve requirements of the special purpose entities. The warehouse credit facilities allow for the pooling and transfer of eligible solar energy systems and related solar service agreements on a non-recourse basis to the subsidiary or us, subject to certain limited exceptions. In connection with these warehouse credit facilities, certain of our affiliates receive a fee for managing and servicing the solar energy systems pursuant to management and servicing agreements. The special purpose entities are also typically required to maintain reserve accounts, including a liquidity reserve account and a reserve account for equipment replacements, each of which are funded from initial deposits or cash flows to the levels specified therein.
The warehouse credit facility structures include certain features designed to protect lenders. One of the common primary features relates to certain events, such as the insufficiency of cash flows in the collateral pool of assets to meet contractual requirements, the occurrence of which triggers an early repayment of the loans and limits the relevant borrower’s ability to obtain additional advances or distribute funds to us. We refer to this as an “amortization event”, which may be based on, among other things, a debt service coverage ratio falling or remaining below certain levels, default levels of solar assets exceeding certain thresholds or excess spread falling below certain levels over a multiple month period. In the event of an amortization event, the availability period under a revolving warehouse credit facility may terminate and the borrower may be required to repay the affected outstanding borrowings using available collections received from the asset pool. However, the period of ultimate repayment would be determined by the amount and timing of collections received. An amortization event would impair our liquidity and may require us to utilize our other available contingent liquidity or rely on alternative funding sources, which may or may not be available at the time. The debt agreements of our warehouse credit facilities also typically contain customary events of default for solar warehouse financings that entitle the lenders to take various actions, including the acceleration of amounts due under the related debt agreement and foreclosure on the borrower’s assets.
109
Table of Contents
In May 2020, we amended the revolving credit facility associated with one of our financing subsidiaries that owns certain tax equity funds to, among other things, (a) increase the aggregate commitment amount from $200.0 million to $390.0 million and (b) increase the unused line fee on such committed amounts. In June 2020, we further amended that facility to, among other things, (a) increase the aggregate commitment amount from $390.0 million to $437.5 million and (b) increase the unused line fee on such committed amounts.
Rule 144A Securitization Financing
We from time to time securitize some solar service agreements and related assets as a source of funding. We access the Rule 144A asset-backed securitization market using wholly-owned special purpose entities to securitize pools of assets, which historically have been solar energy systems and the related lease agreements and PPAs and ancillary rights and agreements both directly or indirectly through interests in the managing member of our tax equity funds. We also securitize our loan agreements and ancillary rights and agreements.
In June 2020, one of our subsidiaries issued $135.9 million in aggregate principal amount of Series 2020-A Class A solar loan-backed notes and $22.6 million in aggregate principal amount of Series 2020-A Class B solar loan-backed notes. The notes bear interest at an annual rate of 2.98% and 7.25% for the Class A and Class B notes, respectively.
The securitization structures include certain features designed to protect investors. The primary feature relates to the availability and adequacy of cash flows in the securitized pool of assets to meet contractual requirements, the insufficiency of which triggers an early repayment of the asset-backed notes. We refer to this as “early amortization”, which may be based on, among other things, a debt service coverage ratio falling or remaining below certain levels. As of March 31, 2020, we have not had any early amortizations under any of our securitizations. In the event of an early amortization, the notes issuer would be required to repay the affected outstanding securitized borrowings using available collections received from the asset pool. However, the period of ultimate repayment would be determined by cause of the early amortization and the amount and timing of collections received. An early amortization event would impair our liquidity and may require us to utilize our available non-securitization related contingent liquidity or rely on alternative funding sources, which may or may not be available at the time. The indentures of our securitizations also typically contain customary events of default for solar securitizations that may entitle the noteholders to take various actions, including the acceleration of amounts due under the related indenture and foreclosure on the issuer’s assets.
Convertible Notes
In May 2020, we issued an aggregate principal amount of $130.0 million of our 9.75% convertible senior notes in a private placement at an issue price of 95%, for an aggregate purchase price of $123.5 million. We granted certain investors an option to purchase up to an additional $60.0 million aggregate principal amount of 9.75% convertible senior notes on the same terms and conditions, and the investors exercised this option and completed the purchase of such additional notes in June 2020. In addition, we entered into privately negotiated exchanges with a small number of institutional investors in our 7.75% convertible senior notes whereby such investors exchanged all $55.0 million aggregate principal amount outstanding of our 7.75% convertible senior notes for an equal principal amount of our 9.75% convertible senior notes.
The 9.75% convertible senior notes bear interest at a rate of 9.75% per annum payable quarterly in arrears. Interest on the 9.75% convertible senior notes is payable 7.25% per annum in cash, and 2.50% per annum in cash or, at our option after the 9.75% convertible senior notes are eligible to be
110
Table of Contents
deposited with and held through the facilities of The Depository Trust Company, in kind. If we fail to satisfy certain registration requirements as set forth in the registration rights agreement that was entered into in connection with the issuance of the 9.75% convertible senior notes, and as described below, the 9.75% convertible senior notes will bear additional interest at a rate of 0.25% per annum for each 90-day period such requirements are not met, up to a maximum of 2.00% per annum.
The investors in our 9.75% convertible senior notes may, at their option, convert all or any portion of their 9.75% convertible senior notes. Upon conversion, we may satisfy our conversion obligation by paying and/or delivering, as the case may be, cash, shares of common stock, or a combination of cash and shares of common stock, at our option, subject to certain terms and conditions. The conversion rate for the 9.75% convertible senior notes is 74.0741 shares of common stock per $1,000 principal amount of 9.75% convertible senior notes, plus accrued and unpaid interest, which is equivalent to an initial conversion price (excluding interest) of approximately $13.50 per share of common stock. The conversion rate is subject to adjustment under certain circumstances in accordance with the terms of the related indenture. On and after May 14, 2023, we have the right to cause the conversion of the 9.75% convertible senior notes if certain specified conditions are met, including minimum common stock price and minimum volume conditions.
At any time prior to May 14, 2022, we may, at our option, redeem for cash up to 33.33% aggregate principal amount of the then outstanding 9.75% convertible senior notes (after giving effect to any conversions on or prior to such redemption date) at a redemption price equal to 115% of aggregate principal amount of 9.75% convertible senior notes so redeemed, plus any accrued and unpaid interest to, but excluding, the redemption date, using the net cash proceeds of one or more equity offerings by us, provided the redemption occurs within 180 days of the date of the closing of such equity offering.
At any time on or after May 14, 2023, we may, at our option, redeem for cash all (but not less than all) of the 9.75% convertible senior notes at the redemption price (expressed as percentages of principal amount) set forth below, plus any accrued and unpaid interest, if any, to, but excluding, the redemption date accrued and unpaid interest, if any, to, but excluding, the redemption date:
| Period |
Percentage | |||
| At any time on and after May 14, 2023 but prior to May 14, 2024 |
115 | % | ||
| At any time on and after May 14, 2024 |
110 | % | ||
On and after September 23, 2024, the holders of the 9.75% convertible senior notes have the option to require us to repurchase their 9.75% convertible senior notes for cash at a purchase price of 110% of the aggregate principal amount repurchased, plus accrued and unpaid interest to the date of repurchase.
The shares of the common stock issuable upon conversion of the 9.75% convertible senior notes, if any, have not been registered under the Securities Act and may not be offered or sold in the U.S. absent registration or an applicable exemption from registration requirements. If converted prior to the effectiveness of the shelf registration statement, to the extent that any shares of the common stock are issued upon conversion of the 9.75% convertible senior notes, they will be issued in transactions anticipated to be exempt from registration under the Securities Act by virtue of Section 3(a)(9) thereof because no commission or other remuneration is expected to be paid in connection with conversion of the 9.75% convertible senior notes and any resulting issuance of shares of the common stock.
Certain of the investors in our 9.75% convertible senior notes and their respective affiliates are affiliated with a member of our board of directors, may also hold positions in our other loans or
111
Table of Contents
securities and have provided certain capital for us and our affiliates in the ordinary course of their business in the past and may do so in the future, for which they have received and may continue to receive certain fees and commissions.
Contractual Obligations
The following unaudited table summarizes our contractual obligations as of December 31, 2019:
| Payments Due by Period (1) | ||||||||||||||||||||
| Total | 2020 | 2021-2022 | 2023-2024 | Beyond 2024 | ||||||||||||||||
| (in thousands) | ||||||||||||||||||||
| Debt obligations (including future interest)(2) |
$ | 1,913,596 | $ | 170,280 | $ | 806,763 | $ | 185,476 | $ | 751,077 | ||||||||||
| AROs |
31,053 | — | — | — | 31,053 | |||||||||||||||
| Operating lease payments(3) |
12,548 | (1,374 | ) | 3,095 | 3,210 | 7,617 | ||||||||||||||
| Guaranteed performance obligations |
6,468 | 4,067 | 2,286 | 115 | — | |||||||||||||||
| Inventory purchase obligations |
124,509 | 22,702 | 54,602 | 47,205 | — | |||||||||||||||
| Other obligations |
10,153 | 6,873 | 3,280 | — | — | |||||||||||||||
|
|
|
|
|
|
|
|
|
|
|
|||||||||||
| Total |
$ | 2,098,327 | $ | 202,548 | $ | 870,026 | $ | 236,006 | $ | 789,747 | ||||||||||
|
|
|
|
|
|
|
|
|
|
|
|||||||||||
| (1) | Does not include amounts related to the contingent obligation to purchase all of a tax equity investor’s units upon exercise of their right to withdraw rights. The withdrawal price for the tax equity investors’ interest in the respective fund is equal to the sum of: (a) any unpaid, accrued priority return and (b) the greater of: (i) a fixed price and (ii) the fair market value of such interest at the date the option is exercised. Due to uncertainties associated with estimating the timing and amount of the withdrawal price, we cannot determine the potential future payments that we could have to make under these withdrawal rights. For additional information regarding the withdrawal rights see Note 13, Redeemable Noncontrolling Interests, to our consolidated financial statements included in our Annual Report on Form 10-K for the year ended December 31, 2019. |
| (2) | Interest payments related to long-term debt and interest rate swaps are calculated and estimated for the periods presented based on the amount of debt outstanding and the interest rates as of December 31, 2019. |
| (3) | Negative amount relates to reimbursements of $2.4 million for leasehold improvements. |
Historical Cash Flows—Three Months Ended March 31, 2020 Compared to Three Months Ended March 31, 2019
The following table summarizes our cash flows for the periods indicated:
| Three Months Ended March 31, |
||||||||||||
| 2020 | 2019 | Change | ||||||||||
| (Unaudited, in thousands) | ||||||||||||
| Net cash used in operating activities |
$ | (58,112 | ) | $ | (24,430 | ) | $ | (33,682 | ) | |||
| Net cash used in investing activities |
(184,315 | ) | (92,680 | ) | (91,635 | ) | ||||||
| Net cash provided by financing activities |
261,372 | 109,351 | 152,021 | |||||||||
|
|
|
|
|
|
|
|||||||
| Net increase (decrease) in cash and restricted cash |
$ | 18,945 | $ | (7,759 | ) | $ | 26,704 | |||||
|
|
|
|
|
|
|
|||||||
Operating Activities
Net cash used in operating activities increased by $33.7 million in the three months ended March 31, 2020 compared to the three months ended March 31, 2019. This increase is primarily a
112
Table of Contents
result of increased payments to dealers for exclusivity and other bonus arrangements with net outflows of $5.3 million in 2020 compared to $2.0 million in 2019. This increase is also due to net outflows of $39.9 million in 2020 compared to net outflows of $7.9 million in 2019 based on: (a) our net loss of $77.0 million in 2020 excluding non-cash operating items of $37.1 million, primarily from depreciation, impairments and losses on disposals, amortization of deferred financing costs and debt discounts, unrealized net losses on derivatives and equity-based compensation charges, results in net outflows of $39.9 million and (b) our net loss of $35.5 million in 2019 excluding non-cash operating items of $27.6 million, primarily from depreciation, impairments and losses on disposals, amortization of deferred financing costs and debt discounts, unrealized net losses on derivatives, payment-in-kind interest on debt and equity-based compensation charges, results in net outflows of $7.9 million. These net differences between the two periods result in a net change in operating cash flows of $32.0 million in 2020 compared to 2019 primarily driven by an increase in realized loss on interest rate swaps of $28.3 million due to the termination of certain debt facilities in 2020.
Investing Activities
Net cash used in investing activities increased by $91.6 million in the three months ended March 31, 2020 compared to the three months ended March 31, 2019. This increase is largely due to an increase in purchases of property and equipment, primarily solar energy systems, of $141.2 million in 2020 compared to $68.9 million in 2019 and payments for investments and customer notes receivable of $50.4 million in 2020 compared to $27.7 million in 2019. This increase is partially offset by proceeds from customer notes receivable of $6.9 million (of which $5.5 million was prepaid) in 2020 compared to $3.8 million (of which $3.1 million was prepaid) in 2019.
Financing Activities
Net cash provided by financing activities increased by $152.0 million in the three months ended March 31, 2020 compared to the three months ended March 31, 2019. This increase is primarily a result of net borrowings under our debt facilities of $172.6 million in 2020 compared to $104.1 million in 2019, and net contributions from our redeemable noncontrolling interests of $101.0 million in 2020 compared to $14.4 million in 2019. This increase is partially offset by payments of deferred financing costs and debt discounts of $10.8 million in 2020 compared to $5.8 million in 2019.
Historical Cash Flows—Year Ended December 31, 2019 Compared to Year Ended December 31, 2018
The following table summarizes our cash flows for the periods indicated:
| Year Ended December 31, |
||||||||||||
| 2019 | 2018 | Change | ||||||||||
| (in thousands) | ||||||||||||
| Net cash used in operating activities |
$ | (170,262 | ) | $ | (11,570 | ) | $ | (158,692 | ) | |||
| Net cash used in investing activities |
(568,316 | ) | (348,849 | ) | (219,467 | ) | ||||||
| Net cash provided by financing activities |
801,823 | 365,687 | 436,136 | |||||||||
|
|
|
|
|
|
|
|||||||
| Net increase in cash and restricted cash |
$ | 63,245 | $ | 5,268 | $ | 57,977 | ||||||
|
|
|
|
|
|
|
|||||||
Operating Activities
Net cash used in operating activities increased by $158.7 million in the year ended December 31, 2019 compared to the year ended December 31, 2018. The increase is primarily a result of increased
113
Table of Contents
payments made to dealers for exclusivity and other bonus arrangements and increased purchases of inventory and prepaid inventory with net outflows of $31.7 million and $127.8 million, respectively, in 2019 compared to an insignificant amount and $14.3 million, respectively, in 2018. The increase is also due to net outflows of $19.1 million in 2019 compared to net inflows of $8.0 million in 2018 based on: (a) our net loss of $133.4 million in 2019 excluding non-cash operating items of $114.4 million, primarily from depreciation, impairments and losses on disposals, amortization of deferred financing costs and debt discounts, unrealized net losses on derivatives, payment-in-kind interest on debt, unrealized net losses on fair value option instruments, loss on extinguishment of debt and equity-based compensation charges, results in net outflows of $19.1 million and (b) our net loss of $68.4 million in 2018 excluding non-cash operating items of $76.4 million, primarily from depreciation, impairments and losses on disposals, amortization of deferred financing costs and debt discounts, unrealized net losses on derivatives, payment-in-kind interest on debt and equity-based compensation charges, results in net inflows of $8.0 million. These net differences between the two periods result in a net change in operating cash flows of $27.1 million in 2019 compared to 2018.
Investing Activities
Net cash used in investing activities increased by $219.5 million in the year ended December 31, 2019 compared to the year ended December 31, 2018. The increase is largely due to an increase in purchases of property and equipment, primarily solar energy systems, of $430.8 million in 2019 compared to $252.6 million in 2018 and payments for investments and customer notes receivable of $159.3 million in 2019 compared to $108.4 million in 2018. The increase is partially offset by proceeds from customer notes receivable of $21.6 million (of which $18.2 million was prepaid) in 2019 compared to $7.7 million (of which $6.4 million was prepaid) in 2018.
Financing Activities
Net cash provided by financing activities increased by $436.1 million in the year ended December 31, 2019 compared to the year ended December 31, 2018. The increase is primarily a result of net borrowings under our debt facilities of $494.9 million in 2019 compared to $128.5 million in 2018, net proceeds related to the issuance of common stock of $164.5 million in 2019 compared to an insignificant amount in 2018, net contributions from our redeemable noncontrolling interests of $149.6 million in 2019 compared to $77.0 million in 2018 and net proceeds from the equity component of a debt instrument of $14.0 million in 2019 compared to an insignificant amount in 2018. This increase is partially offset by net payments related to the issuance of convertible preferred stock of $2.5 million in 2019 compared to net proceeds of $172.8 million in 2018 and payments of deferred financing costs and debt discounts of $13.2 million in 2019 compared to $11.1 million in 2018.
Historical Cash Flows—Year Ended December 31, 2018 Compared to Year Ended December 31, 2017
The following table summarizes our cash flows for the periods indicated:
| Year Ended December 31, |
||||||||||||
| 2018 | 2017 | Change | ||||||||||
| (in thousands) | ||||||||||||
| Net cash used in operating activities |
$ | (11,570 | ) | $ | (48,967 | ) | $ | 37,397 | ||||
| Net cash used in investing activities |
(348,849 | ) | (289,133 | ) | (59,716 | ) | ||||||
| Net cash provided by financing activities |
365,687 | 369,893 | (4,206 | ) | ||||||||
|
|
|
|
|
|
|
|||||||
| Net increase in cash and restricted cash |
$ | 5,268 | $ | 31,793 | $ | (26,525 | ) | |||||
|
|
|
|
|
|
|
|||||||
114
Table of Contents
Operating Activities
Net cash used in operating activities decreased by $37.4 million in the year ended December 31, 2018 compared to the year ended December 31, 2017. The decrease is primarily a result of a decrease in payments to certain dealers for advances on work to be performed relating to solar energy systems in the amount of $10.4 million. The decrease is also due to net inflows of $8.0 million in 2018 compared to net outflows of $20.5 million in 2017 based on: (a) our net loss of $68.4 million in 2018 excluding non-cash operating items of $76.4 million, primarily from depreciation, impairments and losses on disposals, amortization of deferred financing costs and debt discounts, unrealized net losses on derivatives, payment-in-kind interest on debt and equity-based compensation charges, results in net inflows of $8.0 million and (b) our net loss of $90.2 million in 2017 excluding non-cash operating items of $69.7 million, primarily from depreciation, impairments and losses on disposals, amortization of deferred financing costs and debt discounts, unrealized net losses on derivatives, payment-in-kind interest on debt and equity-based compensation charges, results in net outflows of $20.5 million. These net differences between the two periods result in a net change in operating cash flows of $28.5 million in 2018 compared to 2017.
Investing Activities
Net cash used in investing activities increased by $59.7 million in the year ended December 31, 2018 compared to the year ended December 31, 2017. The increase is largely due to an increase in purchases of property and equipment, primarily solar energy systems, of $252.6 million in 2018 compared to $240.6 million in 2017 and payments for investments and customer notes receivable of $108.4 million in 2018 compared to $52.4 million in 2017. The increase is partially offset by proceeds from customer notes receivable of $7.7 million (of which $6.4 million was prepaid) in 2018 compared to $2.8 million (of which $2.3 million was prepaid) in 2017.
Financing Activities
Net cash provided by financing activities decreased by $4.2 million in the year ended December 31, 2018 compared to the year ended December 31, 2017. The decrease is primarily a result of net borrowings under our debt facilities of $128.5 million in 2018 compared to $238.9 million in 2017. The decrease is partially offset by net proceeds related to the issuance of convertible preferred stock of $172.8 million in 2018 compared to $89.9 million in 2017, payments of deferred financing costs and debt discounts of $11.1 million in 2018 compared to $28.0 million in 2017 and net contributions from our redeemable noncontrolling interests of $77.0 million in 2018 compared to $71.9 million in 2017.
Seasonality
See “Business—Seasonality”.
Off-Balance Sheet Arrangements
As of March 31, 2020 and December 31, 2019, we did not have any off-balance-sheet arrangements. We consolidate all our securitization vehicles and tax equity funds.
Critical Accounting Policies and Estimates
Our discussion and analysis of our financial condition and results of operations are based upon our consolidated annual financial statements, which have been prepared in accordance with GAAP.
115
Table of Contents
GAAP requires us to make estimates and judgments that affect the reported amounts of assets, liabilities, revenue and expenses, cash flows and related disclosures. We base our estimates on historical experience and on various other assumptions we believe to be reasonable under the circumstances. In many instances, we could have reasonably used different accounting estimates, and in other instances, changes in the accounting estimates are reasonably likely to occur from period-to-period. Actual results may differ from these estimates. Our future consolidated financial statements will be affected to the extent our actual results materially differ from these estimates.
We identify our most critical accounting policies as those that are the most pervasive and important to the portrayal of our financial position and results of operations, and that require the most difficult, subjective, and/or complex judgments by management regarding estimates about matters that are inherently uncertain. We believe the assumptions and estimates associated with the estimated useful life of our solar energy systems, the valuation of the assumptions regarding AROs and the valuation of redeemable noncontrolling interests have the greatest subjectivity and impact on our consolidated financial statements. Therefore, we consider these to be our critical accounting policies and estimates and these items are discussed below. See Note 2, Significant Accounting Policies, to our consolidated financial statements included in our Annual Report on Form 10-K for the year ended December 31, 2019 and Note 2, Significant Accounting Policies, to our unaudited condensed consolidated financial statements included in our Quarterly Report on Form 10-Q for the quarter ended March 31, 2020 for further discussion of our accounting policies.
Useful Life of Solar Energy Systems
Our solar energy systems have an estimated useful life of 35 years. We considered both (a) available information related to the technology currently being employed in the solar energy systems and (b) the terms of the solar leases that have a 25 year term with two five-year renewal options to conclude a 35 year useful life is appropriate. In addition, we reviewed numerous published and online sources from academia, government institutions and private industry and held discussions with certain manufacturers of our solar energy systems to support our estimated useful life of 35 years for the crystalline silicone solar modules we use. We define the useful life of a solar module as the duration for which a solar module operates at or above 80% of its initial power output, which we understand to be the generally accepted standard used by government, academia and the solar industry.
Depreciation and amortization of solar energy systems are calculated using the straight-line method over the estimated useful lives of the solar energy systems and are included in cost of revenue—depreciation. Depreciation begins when a solar energy system is placed in service. Costs associated with improvements to a solar energy system, which extend the life, increase the capacity or improve the efficiency of the solar energy systems, are capitalized and depreciated over the remaining life of the asset.
AROs
We have AROs arising from contractual or regulatory requirements to perform certain asset retirement activities at the time the solar energy systems are disposed. We recognize an ARO at the point an obligating event takes place, typically when the solar energy system is placed in service. An asset is considered retired when it is permanently taken out of service, such as through a sale or disposal.
The liability is initially measured at fair value based on the present value of estimated removal costs and subsequently adjusted for changes in the underlying assumptions and for accretion expense. We estimate approximately half of our solar energy systems will require removal at our expense in the
116
Table of Contents
future. The corresponding asset retirement costs are capitalized as part of the carrying amount of the solar energy system and depreciated over the solar energy system’s remaining useful life. We may revise our estimated future liabilities based on recent actual experiences, changes in certain customer-specific estimates and other cost estimate changes. If there are changes in estimated future costs, those changes will be recorded as either a reduction or addition in the carrying amount of the remaining unamortized asset and the ARO and either decrease or increase depreciation and accretion expense amounts prospectively. Inherent in the calculation of the fair value of our AROs are numerous assumptions and judgments, including the ultimate settlement amounts, inflation factors, credit adjusted discount rates, timing of settlement and changes in the legal, regulatory, environmental and political environments. Due to the intrinsic uncertainties present when estimating asset retirement costs as well as asset retirement dates, our ARO estimates are subject to ongoing volatility.
Redeemable Noncontrolling Interests
Redeemable noncontrolling interests represent third-party interests in the net assets of certain consolidated subsidiaries, which were created to finance the cost of solar energy systems under long-term solar service agreements. The contractual provisions of the financing arrangements represent substantive profit sharing arrangements. We determined the appropriate methodology for attributing income and loss to the redeemable noncontrolling interests is a balance sheet approach referred to as the hypothetical liquidation at book value (“HLBV”) method. We, therefore, determine the amount of the redeemable noncontrolling interests in the net assets of the subsidiaries at each balance sheet date using the HLBV method, which is presented in the consolidated balance sheets as redeemable noncontrolling interests. Under the HLBV method, the amounts reported as redeemable noncontrolling interests in the consolidated balance sheets represent the amounts the third parties would hypothetically receive at each balance sheet date under the liquidation provisions of the financing arrangements, assuming the net assets of the subsidiaries were liquidated at the recorded amounts determined in accordance with GAAP and distributed to the third parties. The third parties’ interests in the results of operations of the subsidiaries are determined as the difference in the redeemable noncontrolling interests balances in the consolidated balance sheets between the start and end of each reporting period, after taking into account any capital transactions, such as contributions and distributions, between the subsidiaries and the third parties. However, the redeemable noncontrolling interests balance is at least equal to the redemption amount. The estimated redemption value is calculated using the discounted cash flows attributable to the third parties subsequent to the reporting date. We classify redeemable noncontrolling interests with redemption features that are not solely within our control outside of permanent equity in our consolidated balance sheets.
Recent Accounting Pronouncements
See Note 2, Significant Accounting Policies, to our consolidated financial statements included in our Annual Report on Form 10-K for the year ended December 31, 2019 and Note 2, Significant Accounting Policies, to our unaudited condensed consolidated financial statements included in our Quarterly Report on Form 10-Q for the quarter ended March 31, 2020.
Quantitative and Qualitative Disclosures About Market Risk
We are exposed to various market risks in the ordinary course of our business. Market risk is the potential loss that may result from market changes associated with our business or with an existing or forecasted financial or commodity transaction. Our primary exposure includes changes in interest rates because certain borrowings bear interest at floating rates based on LIBOR plus a specified margin. We sometimes manage our interest rate exposure on floating-rate debt by entering into derivative instruments to hedge all or a portion of our interest rate exposure on certain debt facilities. We do not
117
Table of Contents
enter into any derivative instruments for trading or speculative purposes. Changes in economic conditions could result in higher interest rates, thereby increasing our interest expense and operating expenses and reducing funds available to capital investments, operations and other purposes. A hypothetical 10% increase in our interest rates on our variable debt facilities would have increased our interest expense by $0.7 million and $2.7 million for the three months ended March 31, 2020 and the year ended December 31, 2019, respectively.
118
Table of Contents
Mission
Our mission is to power energy independence so that homeowners have the freedom to live life uninterrupted.
Overview
We are a leading residential solar and energy storage service provider, serving more than 85,000 customers in more than 20 U.S. states and territories. Our goal is to be the leading provider of clean, affordable and reliable energy for consumers, and we operate with a simple mission: to power energy independence so that homeowners have the freedom to live life uninterrupted. We were founded to deliver customers a better energy service at a better price; and, through our solar and solar plus energy storage service offerings, we are disrupting the traditional energy landscape and the way the 21st century customer generates and consumes electricity.
We have a differentiated residential solar dealer model in which we partner with local dealers who originate, design and install our customers’ solar energy systems and energy storage systems on our behalf. Our focus on our dealer model enables us to leverage our dealers’ specialized knowledge, connections and experience in local markets to drive customer origination while providing our dealers with access to high quality products at competitive prices as well as technical oversight and expertise. We believe this structure provides operational flexibility, reduced exposure to labor shortages and lower fixed costs relative to our peers, furthering our competitive advantage.
We offer customers products to power their homes with affordable solar energy. We are able to offer savings and storage opportunities to most customers compared to utility-based retail rates with little to no up-front expense to the customer, and we are able to provide energy resiliency and reliability to our solar plus energy storage customers. Our solar service agreements take the form of a lease, PPA or loan. The initial term of our solar service agreements is typically either 10 or 25 years. Service is an integral part of our agreements and includes operations and maintenance, monitoring, repairs and replacements, equipment upgrades, on-site power optimization for the customer (for both supply and demand), the ability to efficiently switch power sources among the solar panel, grid and energy storage system, as appropriate, and diagnostics. During the life of the contract we have the opportunity to integrate related and evolving home servicing and monitoring technologies to upgrade the flexibility and reduce the cost of our customers’ energy supply.
In the case of leases and PPAs, we also currently receive tax benefits and other incentives from federal, state and local governments, a portion of which we finance through tax equity, non-recourse debt structures and hedging arrangements in order to fund our upfront costs, overhead and growth investments. We have an established track record of attracting capital from diverse sources. From our inception through March 31, 2020, we have raised more than $5.5 billion in total capital commitments from equity, debt and tax equity investors.
In addition to providing ongoing service as a standard component of our solar service agreements, we also offer Sunnova Protect Services, which provides ongoing energy services to customers who purchased their solar energy system through unaffiliated third parties. Under these arrangements, we agree to provide such monitoring, maintenance and repair services to these customers for the life of the service contract they sign with us. We believe the quality and scope of our comprehensive energy service offerings, whether to customers that obtained their solar energy system through us or through another party, is a key differentiator between us and our competitors.
119
Table of Contents
We commenced operations in January 2013 and began providing solar energy services under our first solar energy system in April 2013. Since then, our brand, innovation and focused execution have driven significant growth in our market share and in the number of customers on our platform. We operate one of the largest fleets of residential solar energy systems in the U.S., comprising more than 625 megawatts of generation capacity and serving more than 85,000 customers. We define number of customers to include each customer that is party to an in-service solar service agreement. For further discussion of how we define number of customers, see “Management’s Discussion and Analysis of Financial Condition and Results of Operations—Key Financial and Operational Metrics”. The following chart illustrates the growth in our number of customers from December 31, 2015 through March 31, 2020.
Our Dealer Network Model
While many of our competitors maintain a large, geographically diverse base of employees in local markets, including a direct sales force comprised of home improvement installers, we limit the cost associated with that structure by utilizing a network of local, independent dealers to market, sell and install solar energy systems and energy storage systems on our behalf. Our dealers typically reside and work within the markets they serve and provide a localized, customer-focused marketing, installation and servicing process. These dealers are often leading local solar installation companies who serve customers that are actively searching for solar power or who were referred by existing customers. When entering new markets, our dealer model immediately provides scale by enabling us to develop relationships with existing local businesses and avoiding the delay and expense required to establish new sales and installation offices. Similarly, because we do not typically maintain local offices, we can quickly refocus our origination efforts and capital deployment strategy to different markets in response to changing dynamics and regulatory developments. Furthermore, because of the low marginal cost to maintain relationships with individual dealers in currently unfavorable markets, we can maintain a strategic presence in anticipation of future developments that may make the economics of distributed residential solar energy in those markets more attractive.
Our dealers realize value in partnering with us for a variety of reasons. Although each of our dealer relationships is unique, we believe our dealers choose to work with us because:
| • | we do not compete with our dealers; |
| • | we receive preferred equipment pricing as a result of our strong supplier relationships; |
120
Table of Contents
| • | we offer a wide variety of product structures; |
| • | we provide easy-to-use software to dealers to assist with the installation process and to price potential solar energy systems and energy storage systems; |
| • | dealers can leverage our brand to support their businesses; |
| • | we provide comprehensive training to dealers; and |
| • | we are a stable counterparty our dealers can trust to make payments on time. |
Origination, Installation, Monitoring and Servicing Processes
Through our dealer network model, we provide a streamlined approach for the origination of solar service agreements and the installation of solar energy systems and energy storage systems. The principal elements of our origination, installation, monitoring and servicing processes are described below:
| • | Customer Origination and Consultation. Our dealers serve as a local, direct-to-home sales force providing in-person consultations to source potential customers in each geographic market where we operate. Our dealers reach potential customers through various means, including online, telemarketing, in-store sales, cross-marketing with complementary products and door-to-door canvasing. Using our technology platform and proprietary pricing tool, the dealer and the customer select one of our standard-form solar service agreements for the relevant market and the dealer submits its proposal to us for approval. Before proceeding to the design phase, we validate that every customer understands the terms of their contract with us as well as the expected benefits of the system. |
| • | Design and Engineering. Prior to the dealer’s purchase and installation of the equipment, we and the dealers work together to design each solar energy system and, if applicable, energy storage system. All of our solar energy systems and energy storage systems are designed with equipment from a pre-approved list of manufacturers. We utilize our extensive tools and services platform, standardized procedures and existing databases to help our dealers comply with our pricing requirements, residential solar best practices, contract terms, and state, territorial and local regulations. For each solar service agreement, an individualized power production estimate is created by analyzing geographic, solar and weather data with the design’s proposed orientation, components and shading. We continue to pursue technological innovation to streamline our review of design and engineering, to expedite installation and to lower costs for our dealers. |
| • | Installation, Commissioning and Interconnection. The installation and commissioning phase requires the dealer to obtain all necessary permits for installation and complete our commissioning process for the solar energy system and energy storage system (if applicable), which entails submitting supporting documentation and photographs illustrating the installation of the solar energy system and energy storage system (if applicable) to our engineering team for review. Following completion of these steps and our approval of these materials the dealer submits required paperwork to the applicable electric distribution utility to obtain permission to operate the equipment, schedule required regulatory inspections and arrange for interconnection of the solar energy system to the electrical grid. |
| • | Customer Billing Dates. How soon we will begin billing the customer after the solar energy system has been placed in service will vary by Sunnova product offering. Lease agreements will begin billing on the first cycle date after the solar energy system has been placed in service; generally within 30 days. PPAs will begin billing on the first cycle date in the next calendar month after the solar energy system has been placed in service; generally between 15 and 60 days after the solar energy system has been placed in service. Loan agreements |
121
Table of Contents
| require that the solar energy system must be in service at least 30 days prior to the date when billing can begin. As a result, billing on loan agreements generally begins the first cycle date in the next calendar month after the solar energy system has been placed in service. |
| • | Monitoring and Servicing. Our monitoring systems utilize cellular connections that allow us to confirm the continuing operation of the solar energy system and energy storage system (if applicable) and identify and solve maintenance issues through our dealers, third-party service providers or our own personnel. We also collect performance data to improve our pricing, generation estimates and services for our customers. |
Our Relationships With Our Dealers
We carefully recruit our dealers, who must meet and maintain our standards to be an approved dealer. Qualifications to be a dealer include: experience in the residential solar industry (or success in complementary industries such as home security, heating, ventilation and air-conditioning, electrical services, and satellite television), experienced and appropriately certified employees (including multiple installation teams) and possession of applicable licenses. We also perform a review of the prospective dealer’s financial condition as part of our recruitment process as well as a background check on the principal owners of the organization. Upon engagement, the dealer enters into a standard dealer agreement with us, which may be amended from time to time, that sets ongoing standards for operations and payment obligations based on different milestones for each project. We provide training, field support and continuing education to help our dealers operate efficiently. This includes training related to our processes, standards and services platform, sales training and compliance education regarding applicable rules and regulations. We actively review our dealers’ performance and compliance with our requirements to determine whether to terminate our relationship with any dealer that is unable to meet our performance standards.
Sub-dealers are typically sales-originating organizations engaged directly by Sunnova’s dealers, who are free to negotiate the terms of their engagement. All sub-dealers are subcontractors to Sunnova’s dealers, and have no direct contractual relationship with Sunnova. All dealer subcontractors are required to meet certain criteria as enumerated in Sunnova’s dealer contracts, including with respect to licensing and insurance. Dealers are fully responsible and liable to Sunnova for all marketing representations, work, services, equipment, and materials of their sub-dealers.
We devote significant resources to maintaining and expanding our relationships with existing dealers. Although most of our dealer agreements allow the dealer to sell services and products from our competitors, we believe dealers find our proprietary technology and operations platform, established supply chain group, commitment to training, quality of service and prompt payment to be an incentive to prioritize selling our services. Furthermore, many of our dealers may be hesitant to work with our competitors that have developed internal sales and installation personnel that may compete with certain aspects of the dealers’ business. Taken as a whole, we believe these considerations promote long-lasting relationships with our dealers.
For the three months ended March 31, 2020 and the years ended December 31, 2019 and 2018, Trinity accounted for approximately 30%, 41% and 52% of our originations for such periods, respectively. In March 2019, we amended our agreement with Trinity pursuant to which Trinity has agreed to perform services or work exclusively for us for four years, with certain exceptions, including (a) the sale of solar energy systems to individuals on a “cash” basis that do not involve any third-party financing, (b) the sale of solar energy systems pursuant to customer agreements we do not elect to accept under the terms of the arrangement and (c) the sale of solar energy systems pursuant to customer agreements executed prior to the date of the amendment to the dealer agreement. In addition, Trinity may market, sell and install solar energy systems for our competitors in instances in
122
Table of Contents
which such competitor has provided the leads for such solar energy system customer directly to Trinity. Under this arrangement, we have agreed to provide annual bonuses to Trinity in the amount of $20 million in year one and $10 million each year thereafter, subject to clawback if minimum annual origination targets are not reached and additional per watt incentive payments if higher annual origination targets are exceeded. The minimum and higher origination targets increase by approximately 15% to 20% each year and limits competing work by Trinity to 10% of Trinity’s annual gross revenues. Unlike most of our dealer agreements, the arrangement with Trinity does not permit the parties to terminate for convenience and only permits termination in specified circumstances including material breach (subject to applicable cure periods), prolonged force majeure events, a change of control, certain insolvency events or mutual agreement. For purposes of the Trinity agreement, “change of control” means (a) the sale of all or substantially all of the assets of a party or (b) any merger, acquisition, or other transaction or series of transactions that results in a change of ownership of more than fifty percent of the voting securities of a party (other than in connection with an IPO of either party or a transfer among Trinity’s existing owners). Additionally, the arrangement provides for a $10 million liquidated damages payment by the applicable party in the event of termination for material breach, certain insolvency events of or wrongful termination by the other party.
We have similar contractual arrangements with several other key dealers. For certain other dealers, substantially all of the solar service agreements originated by such dealers are Sunnova agreements, although they are under no exclusivity arrangement. No dealer other than Trinity and Infinity Energy, Inc. accounted for more than 10% of our total expenditures to dealers relating to costs incurred for solar energy systems for the three months ended March 31, 2020 and year ended December 31, 2019. Only Trinity accounted for more than 10% of our total expenditures to dealers relating to costs incurred for solar energy systems for the year ended December 31, 2018.
Platform of Tools and Services
We have developed a cloud-based technology platform for origination, installation, administration and servicing of our solar energy systems and energy storage systems. All of our dealers are trained in and use this platform. Our software platform includes a proprietary technology suite, including a contact center to assist dealers in lead generation, project tracking and service obligations, a quoting tool to standardize customer quotes and solar service agreements, and other services to manage payments, billing and monitoring. The technology suite also includes tools to streamline the approval process for the design and installation of solar energy systems and energy storage systems and establish a standard process for ongoing service and warranty management. The platform leverages cloud-based infrastructure and software capabilities using multiple third-party providers, including Salesforce, Amazon Web Services, Heroku and FinancialForce. It is compatible with multiple end-user device types, including smartphone, tablet and desktop/laptop interfaces.
We have invested in proprietary software systems and technology that have been designed to tie into third-party platforms and applications of our dealers and other systems. Our key software systems include:
| • | Pricing Tool: Customer pricing and quoting is delivered by a combination of cloud-based technologies including Genability, PV Watts (a service of the National Renewable Energy Laboratory) and proprietary applications running on Amazon Web Services and Heroku. This collection of tools is made available to us and our dealers through a web, tablet or mobile device interface. We permit dealers to generate solar service agreement quotes and proposal documents on demand for presentation to prospective customers. Each completed quote is transferred into Salesforce for solar service agreement generation, customer access and reporting. |
123
Table of Contents
| • | MySunnova: MySunnova is our online portal for customers that allows them to view their solar energy systems’ production history, view energy storage system data, pay their bills, manage their online account and contact information, make referrals and contact our customer service team. |
| • | Salesforce: Salesforce is our central repository and system of record for all contracts, process documentation, customer account information, maintenance information and payment tracking for the life of the solar service agreement. This single system allows for integrated and comprehensive reporting for the entire life cycle of the customer, from quote to end of the solar service agreement term. Many of our other systems interact with the Salesforce platform. |
| • | FinancialForce: FinancialForce is a cloud-based accounting system built on the Salesforce platform. Because it shares similar architecture to our Salesforce system, FinancialForce allows for integration between our operations and accounting. |
Customer Agreements
| Agreement |
Sunnova Offering(s) |
Description |
Initial Term | |||
| Lease | Easy Save | Lease of solar energy system | 25 years | |||
| PPA | Easy Save Simple
Easy Save Monthly |
Sale of solar energy production | ||||
| Loan | Easy Own | Sale of solar energy system | 10 or 25 years | |||
| Energy Storage | Sunnova SunSafe
Sunnova +SunSafe |
Lease or sale of energy storage system to be used with a solar energy system | 10, 15 or 25 years | |||
| Service Only | Sunnova Protect Services | Monitoring & warranty services for non-Sunnova solar energy systems | 1, 5, 10 or 20 years | |||
We focus on growing a geographically diverse customer base with a strong credit profile. We perceive our recurring customer payments as high-quality assets given the broad and relatively inelastic demand for electricity and because our customers typically have high credit scores. As of March 31, 2020, our customers had, at the time of signing the solar service agreement, an average FICO® score of 739. The purpose of our stringent credit approval policy is to ensure reliability of collecting payment over the duration of the solar service agreements. As of March 31, 2020, approximately 0.8% of our customers were in default (over 120 days past due) under their solar service agreements.
Most of our solar service agreements have an initial term of 25 years with an opportunity for customers to renew for up to an additional 10 years via two five-year renewal periods. The customer is obligated to make payments to us on a monthly basis and we operate and maintain the solar energy system and energy storage system, if applicable, in good condition throughout the duration of the agreement. Under our lease agreements and PPAs, the customer’s monthly payment or price per kWh is set based on a calculation that takes into account expected solar energy generation. The customer has an option of choosing a flat rate without an escalator or a lower initial rate with an escalator. As of March 31, 2020, approximately 78% of our lease agreements and PPAs contained a price escalator, ranging from 0.9% to 3.0% annually.
Our solar service agreements are designed to offer the customer energy cost savings and bill stability relative to centralized utility prices, often resulting in an immediate reduction in the customer’s
124
Table of Contents
overall utility bill, with little or no upfront costs. We provide our services through long-term residential solar service agreements in the following formats:
| • | Lease Agreements. Under a lease agreement, or Easy Save Agreement, the customer leases a solar energy system from us at a fixed monthly rate that is typically subject to annual escalation. We own, operate and maintain the solar energy system under our lease agreements. In most cases, lease agreements include a performance guarantee under which we will refund payments or credit the customer if the solar energy system fails to meet a guaranteed minimum level of power production for specified time periods. |
| • | PPAs. We offer PPAs through our Easy Save Monthly Agreement, for monthly generation billing, and the Easy Save Simple Agreement, for a levelized monthly payment. We own, operate and maintain the solar energy system under our PPAs. |
| • | Easy Save Monthly Agreements. Pursuant to an Easy Save Monthly Agreement, the customer agrees to pay for all power generated by a solar energy system at a price per kWh that is typically lower than the local utility rate. The monthly rate is typically subject to annual escalation. |
| • | Easy Save Simple Agreements. The Easy Save Simple Agreement is similar to the Easy Save Monthly Agreement except the customer’s payments are levelized over the course of a year based on an annual production estimate so the customer’s payments are insulated from monthly fluctuations in electricity production subject to a true-up at the end of such period. The fixed monthly rate is typically subject to annual escalation. Should the annual production estimate exceed actual production, the customer will receive a bill credit at the end of the applicable period and we may decrease the estimated production (and corresponding monthly payments) for the subsequent year. Should actual production exceed the annual estimate, we may apply the overproduction to a subsequent year or increase the estimated annual production and corresponding monthly payments for the subsequent year. The estimated annual production will not increase more than 110% from the estimated annual production for the first year. |
| • | Loan Agreements. Pursuant to an Easy Own Agreement, the customer purchases the solar energy system from a dealer using financing provided by us. The customer repays the amount financed plus a finance charge through monthly payments for a typical term of 10 or 25 years. We purchase the Easy Own Agreement from the dealer and agree to operate and maintain the solar energy system. We operate and maintain the solar energy system through our network of dealers. In most cases, Easy Own Agreements include a production guarantee under which we will refund payments or credit the customer if the solar energy system fails to meet a guaranteed minimum level of power production for specified time periods. Customers under our Easy Own Agreements have the option to prepay outstanding principal amounts, in part or in full, without penalty. |
| • | Energy Storage Systems. Our Sunnova SunSafe program offers customers the option of a solar energy system integrated with a solar storage system. Our Sunnova SunSafe Easy Save Agreement and Sunnova SunSafe Easy Own Agreement are similar to our Easy Save Agreement and Easy Own Agreement, respectively, but include energy storage systems with the solar energy systems. The customer may select a term of 10 or 25 years for the SunSafe Easy Own Agreement. These agreements have a production guarantee, similar to the Easy Own Agreements and Easy Save Agreements, except in Guam, Saipan, Hawaii, Puerto Rico and Florida. Additionally, we introduced the Sunnova +SunSafe Agreement to existing customers in several states and territories, under which the customer purchases the energy storage system from a dealer using financing provided by us. Under the Sunnova +SunSafe Agreement, the customer repays the amount financed plus a finance charge through monthly |
125
Table of Contents
| payments for a term of 10 or 15 years. We intend to roll-out these energy storage system offerings to additional geographic regions in the coming years. |
| • | Sunnova Protect Service. For solar energy systems not owned or sold by us, our Sunnova Protect Agreements provide customers maintenance and repairs as well as system monitoring and diagnostics. We provide three levels of service: (a) Basic, which is monitoring only; (b) Premium, which is monitoring plus repair and/or replacement of all equipment under a manufacturer’s warranty; and (c) Platinum, which is monitoring, repair and/or replacement of all equipment under and outside the manufacturer’s warranty and a production guarantee. The customer may select the level of service and a term of 1, 5, 10 or 20 years. Prior to commencing coverage, we will run a diagnostic evaluation on the customer’s solar energy system and will identify any underperforming equipment and estimate production. The customer may elect to repair underperforming equipment, on a time and materials basis, so that it may be included in the coverage going forward. Should the underperforming equipment not be repaired, it will not be covered under the Sunnova Protect Agreement. |
As of March 31, 2020, approximately 32% of our customers had lease agreements, approximately 53% had PPAs, and approximately 15% had loan agreements. Less than 1% of our customers have our Sunnova SunSafe and Sunnova Protect agreements.
We have developed a standardized protocol and set of policies to qualify potential customers. During the solar energy system origination phase, we review the customer’s credit application for compliance with our credit standards. Solar service agreements that are accepted must comply with our underwriting standards, which emphasize the prospective customer’s ability to pay and the value of the customer’s estimated savings under the solar energy service agreement compared to traditional utility rates.
We maintain reporting and controls in place to monitor the timeliness of customer payments. As of March 31, 2020, approximately 93% of all payments received pursuant to our solar service agreements are collected via Automated Clearing House payments (i.e., the funds are deducted automatically on a monthly basis from the customer’s bank account), approximately 3% are collected via automatic recurring credit card payments and approximately 4% are collected through non-recurring means. If a customer becomes delinquent on one or more monthly installment payments, we typically begin a collection process with respect to the customer.
In the event that a customer elects to sell his or her home, the customer’s solar service agreement may be transferred to the prospective purchaser through prescribed reassignment procedures, subject to certain conditions related to the prospective purchaser’s creditworthiness. To initiate the reassignment process, the customer must notify us of the pending sale, after which we will provide a copy of the solar service agreement, including any amendments, to the prospective purchaser. The prospective purchaser will then be required to complete a customer profile and a credit application. Each prospective purchaser’s FICO® Score and Experian TEC Score (Telecommunications, Energy and Cable) will be evaluated on the same basis as a customer in a new origination and will be evaluated by our computer auto-decisioning system.
In the event that a prospective purchaser does not meet our credit criteria or elects not to be subject to such credit inquiry, the current customer will be required to prepay the solar service agreement in full or the prospective purchaser will be required to provide a security deposit in cash in accordance with such customer’s solar service agreement or our transfer policy prior to the approval of the reassignment. Each such security deposit is held in a separate account until the earlier of (a) the time at which the prospective purchaser satisfies our established credit criteria or (b) upon 12 consecutive months of on-time payments following the date of reassignment.
126
Table of Contents
On a case-by-case basis, we may remove a solar energy system and, if applicable, energy storage system from the property on which it is installed if, among other reasons, the solar service agreement is canceled or otherwise terminated, the customer or solar energy system and energy storage system is relocated, any of the component parts are damaged or the new homeowner rejects the reassignment of the solar service agreement upon home transfer, if applicable.
Monitoring and Maintenance Service and Warranties
Our residential solar service agreements typically are accompanied by a warranty and/or monitoring and service agreement. The warranty and monitoring services provided with each type of solar service agreement vary but can include operations and maintenance, equipment repairs, monitoring or site power controls and management for both supply and demand. Additionally, our Sunnova Protect program offers monitoring, service and production guarantees across three tiers of service for solar energy systems owned by the homeowner and installed by an unaffiliated third party.
Regardless of the type of our solar service agreement, we provide ongoing service during the entire term of the customer relationship, including monitoring, maintenance and warranty services of the solar energy system and energy storage system, if applicable. We have an operations and maintenance administration organization consisting of administration staff and a dedicated residential monitoring and production team that evaluates the solar energy systems’ and energy storage systems’ performance daily. When a performance or operation issue is detected via our monitoring system, we provide or arrange for troubleshooting or field services as necessary. We rely on our dealer network and our own personnel to complete the field services required to maintain the solar energy systems. After completion of the resolution steps, the maintenance administration organization verifies remotely the issue has been resolved and the system or energy service is performing as expected.
Additionally, customers under our solar service agreements receive a range of warranties on the related solar energy systems and energy storage systems, including warranties for module production and against defects in workmanship and against component or materials breakdown. We also provide the customers with a warranty on roof penetrations of up to 10 years in compliance with applicable state, territorial or local law. Through our agreements with our dealers, the dealer is obligated, at its sole cost and expense, to correct defects in its installation work for a period of 10 years and provide a roof warranty on roof penetrations of five years. Furthermore, we provide a pass-through of the solar photovoltaic panel manufacturers’ warranty coverage to our customers, generally of 25 years, and of the inverter and energy storage system manufacturers’ warranty coverage, typically of 10 to 25 years. We typically exercise our rights under the manufacturer’s equipment warranties or dealer installation warranties before incurring direct charges or costs. Many service expenses are borne by our dealers and not us directly because of the workmanship warranty provided by the dealers to us. Additionally, many component costs are covered by manufacturer warranties.
Seasonality
The amount of electricity our solar energy systems produce is dependent in part on the amount of sunlight, or irradiation, where the assets are located. Because shorter daylight hours in winter months and poor weather conditions due to rain or snow results in less irradiation, the output of solar energy systems will vary depending on the season or the year. While we expect seasonal variability to occur, the geographic diversity in our assets helps to mitigate our aggregate seasonal variability.
Our Easy Save Monthly PPAs are subject to seasonality because we sell all the solar energy system’s energy output to the customer at a fixed price per kWh. Our Easy Save Simple PPAs are not subject to seasonality (from a cash flow perspective or the customer’s perspective) within a given year
127
Table of Contents
because the customer’s payments are levelized on an annualized basis so we insulate the customer from monthly fluctuations in production. However, our Easy Save Simple PPAs are subject to seasonality from a revenue perspective because, similar to the Easy Save Monthly PPAs, we sell all the solar energy system’s energy output to the customer. Our lease agreements are not subject to seasonality within a given year because we lease the solar energy system to the customer at a fixed monthly rate and the reference period for any production guarantee payments is a full year. Finally, our loan agreements are not subject to seasonality within a given year because the monthly installment payments for the financing of the customers’ purchase of the solar energy system are fixed and the reference period for any production guarantee is a full year.
In addition, weather may impact our dealers’ ability to install solar energy systems and energy storage systems. For example, the ability to install solar energy systems and energy storage systems during the winter months in the Northeastern U.S. is limited. This can impact the timing of when solar energy systems and energy storage systems can be installed and when we can acquire and begin to generate revenue from solar energy systems and energy storage systems.
Intellectual Property
We rely on intellectual property laws, primarily a combination of copyright and trade secret laws in the U.S., as well as license agreements and other contractual provisions, to protect our proprietary technology. We also rely on several registered and unregistered trademarks to protect our brand. In addition, we generally require our employees and independent contractors involved in the development of intellectual property on our behalf to enter into agreements to limit access to, and disclosure and use of, our confidential information and proprietary technology. We also continue to expand our technological capabilities through licensing technology and intellectual property from third parties.
Government Regulations
While we are not regulated as extensively as a public utility where our business is conducted in the U.S., we are subject to various national, state, territorial and other local regulatory regimes. For example, in California and New York, we are subject to regulations concerning marketing and contracting promulgated by state public utility commissions. In some states such as Arizona and Florida, we are limited to offering only a lease agreement or a loan agreement to homeowners and are prohibited from offering a PPA, which is deemed a retail sale of electricity in such states and can only be made by a regulated utility. In Puerto Rico, we are subject to regulation as an electric power company by the Puerto Rico Energy Bureau and are required to comply with certain filing, certification, reporting and annual fee requirements. Regulation by the Puerto Rico Energy Bureau as an electric power company does not currently subject us to centralized utility-like regulation or require the Puerto Rico Energy Bureau’s approval of charges to customers.
To operate the solar energy systems and energy storage systems, our dealers work with customers to obtain interconnection permission from the applicable local electric distribution utility. In many states and territories, by statute, regulations or administrative order, there are standardized procedures for interconnecting distributed residential solar energy and related energy storage systems to the electric utility’s local distribution system. In some states, such as New Jersey and Massachusetts, certain utilities such as municipal utilities or electric cooperatives are exempt from some interconnection requirements. Provided that the system and energy, if applicable, qualify for the standardized procedures based upon size, use of industry-standard components, location on a suitable local network and other applicable requirements, utilities in some states or territories are required to interconnect qualifying solar energy systems and energy storage systems on an expedited basis relative to non-qualifying systems. Expedited procedures, when available, streamline the installation
128
Table of Contents
and interconnection process for solar energy systems and energy storage systems to begin operating. In the U.S. states and territories in which we operate, our dealers typically obtain interconnection permission on behalf of us and our customers using standardized interconnection procedures.
In certain states, such as California, independent solar energy producers who enter into solar service agreements with homeowners for residential solar energy systems are required to make certain disclosures to the homeowner regarding the solar energy system and the terms of the agreement and record a notice against the title to the real property on which the electricity is generated and against the title to any adjacent real property on which the electricity will be used. The notice does not constitute a title defect, lien or encumbrance against the real property.
In June 2019, the U.S. Environmental Protection Agency (“EPA”) issued the final Affordable Clean Energy (“ACE”) rule replacing the previous Clean Power Plan, which established standards to limit carbon dioxide emissions from existing power generation facilities and was expected to increase the cost of certain forms of fossil fuel-derived energy. We estimate the power generated by our solar energy systems has displaced more than 1.2 million metric tons of carbon emissions based on approximately 1.7 billion kWh of electricity produced since our inception and applying the EPA’s online greenhouse gas equivalencies calculator (https://www.epa.gov/energy/greenhouse-gas-equivalencies-calculator). The ACE rule would establish emission guidelines for states to develop plans to limit greenhouse gas emissions from existing coal-fired power plants but does not have the expected increase in cost for fossil fuel-derived energy. We cannot predict what effects, if any, the ACE rule may have on photovoltaic solar markets.
Our operations, as well as the operation of our dealers, are subject to stringent and complex federal, state, territorial and local laws, including regulations governing the occupational health and safety of employees, wage regulations and environmental protection. For example, we and our dealers are subject to the regulations of OSHA, DOT, the EPA and comparable state and territorial entities that protect and regulate employee health and safety and the environment. These include, for example, regulations regarding the disposal of solid and hazardous wastes from the solar energy systems we own. In addition, environmental laws can result in the imposition of liability in connection with end-of-life system disposal, such as in connection with disposal and recycling of batteries.
We and our dealers are also subject to laws and regulations relating to interactions with residential consumers, including those pertaining to sales and trade practices, privacy and data security, equal protection, consumer financial and credit transactions, consumer collections, mortgages and re-financings, home improvements, trade and professional licensing, warranties and various means of customer solicitation, as well as specific regulations pertaining to solar installations.
For a discussion of these and other regulatory requirements, see “Risk Factors—Risks Related to Regulations”.
Government Incentives
U.S. federal, state, territorial and local governments have established various incentives and financial mechanisms to reduce the cost of solar energy and to accelerate the adoption of solar energy. These incentives come in various forms, including rebates, tax credits and other financial incentives such as payments for renewable energy credits associated with renewable energy generation, exclusion of solar energy systems and energy storage systems from property tax assessments, system performance payments, accelerated depreciation and net energy metering, or net metering, programs. These incentives make solar energy system and energy storage system ownership more attractive to some homeowners and enable us to charge our customers lower prices to purchase energy generated
129
Table of Contents
by our solar energy systems and energy storage systems or to lease or purchase our solar energy systems and energy storage systems than they would normally be expected to pay for utility-provided energy. These incentives also help catalyze private sector investments in solar energy and efficiency measures, including the installation and operation of residential and commercial solar energy systems and energy storage systems.
Net metering is one of several key policies that have enabled the growth of distributed solar in the U.S., providing significant value to certain customers with solar energy systems for the electricity generated by their systems but not directly consumed on site. Net metering allows a customer to pay the local electric utility only for power usage net of production from the customer’s solar energy system. Customers receive a credit for the energy an interconnected solar energy system generates in excess of that needed by the home and that is provided to the electrical grid. The credit offsets energy usage incurred by the customer at times when the customer requires more electricity than is generated by the solar energy system. In many markets, this credit is equal to the residential retail rate for electricity and in other markets the rate is less than the retail rate and may be based, for example, in whole or in part on the centralized electric utility’s “avoided cost” for electricity that it would have had to generate or purchase at wholesale to meet the customer’s demand. Furthermore, when coupled with a time of use rate program in certain electric utility territories, a homeowner may offset usage billed at lower rates with net metering credits provided at a higher rate.
For these reasons, net metering credits incentivize consumers to use distributed solar in certain jurisdictions, including some of those in which we operate. In some electric utility territories, any excess credits are rolled over to the next billing period and may also be cashed out later at a rate lower than the retail rate. Most states, the District of Columbia, Puerto Rico and Guam have adopted some form of net metering by statute, regulation, administrative order or a combination thereof, although some of these jurisdictions provide for a credit at less than the retail rate. In some jurisdictions, centralized electric utilities have also adopted net metering on a voluntary basis. Some of the states in which we operate, including New Jersey, Maryland, Massachusetts, Rhode Island, Delaware, Illinois and Hawaii, have in place policies that limit or permit utilities to limit the amount of total electricity generated through net metering and/or solar energy systems, and some of these states as well as other states or territories, including Pennsylvania, Nevada, New Mexico and Guam, have policies that limit or place conditions on the size of individual solar energy systems.
Net metering and other incentive programs are subject to legislative and regulatory review in many states and territories in which we operate and the availability and value of these programs could be limited, reduced or phased out. Some states such as Arizona, Nevada and Kentucky have reduced their net metering credits. Further reviews by these states and others are anticipated and the subsequent amount of net metering credits will continue to be assessed over the next few years in states that have net metering policies. For example, net metering rates in California, Connecticut, Puerto Rico and South Carolina are up for consideration over the next few years. New York is working on developing an alternative to net metering through a Value of Distributed Energy Resources credit that would allow certain customers to receive direct monetary compensation as opposed to a net metering credit. This program is expected to be implemented in 2021. Other states such as California have implemented non-bypassable fees for customers enrolled in a net metering program, which requires customers to pay certain fees regardless of whether they are drawing energy from the electrical grid. As a result of the DRSA, net metering customers in Puerto Rico may be impacted by transition charges and other requirements.
Many states and territories have adopted renewable portfolio energy production requirements. The majority of states, the District of Columbia and Puerto Rico have adopted an RPS that requires regulated electric utilities to generate or procure a specified percentage of total electricity delivered to customers in the state or territory from eligible renewable energy sources, such as solar energy
130
Table of Contents
systems, by a series of specified dates. In addition, several other states have set voluntary goals for renewable generation.
Roughly one-third of states with RPS policies require a minimum portion of the RPS be met by electric generation from solar energy systems, with substantial penalties for non-compliance. To demonstrate compliance with such RPS mandates, electric generation providers must submit SRECs to the applicable authority. One SREC is generated for a specified amount of energy generated for an eligible solar energy system. The specified amount of energy is dependent on system size and when the solar energy system receives a “permission to operate” order. Electric generation providers can either generate their own SRECs through solar energy systems they own or they can purchase SRECs owned by other parties.
SRECs are a distinct product, separate from the electricity generated by solar energy systems. We and our customers apply for and receive SRECs in certain jurisdictions for power generated by the solar energy systems we own. As a distinct product from the electricity generated by solar energy systems, SRECs represent a separate source of cash flow from the sale of electricity. SRECs can be sold with or without the actual electricity associated with the renewable-based generation. Solar energy system owners are typically able to sell SRECs to electric generation providers, such as electric utilities, or in the SREC commodity market. We have hedged a portion of our expected SREC production under fixed price forward contracts. The forward contracts require us to physically deliver the SRECs upon settlement.
Several states have an energy storage mandate or policies designed to encourage the adoption of storage. For example, California offers a cash rebate for storage installations through the Self Generation Incentive Program and Massachusetts and New York offer performance-based financial incentives for storage. Storage installations also are supported in certain states by state public utility commission policies that require utilities to consider alternatives such as storage before they can build new generation. In February 2018, FERC issued Order 841 directing regional transmission operators and independent system operators to remove barriers to the participation of storage in wholesale electricity markets and to establish rules to help ensure storage resources are compensated for the services they provide. An appeal of Order 841 filed by utility trade associations and other parties challenging the extent of FERC’s jurisdiction over storage resources connected to distribution systems (among other issues) is currently pending before the U.S. Court of Appeals for the D.C. Circuit.
Some state and territorial governments, centralized electric utilities, municipal utilities and co-operative utilities offer a cash rebate or other payment incentive for the installation and operation of a solar energy or energy storage system or to customers undertaking other energy efficiency measures. Capital cost or “up-front” rebates provide funds to solar customers or developers or solar energy system owners such as us based on the cost, size or expected production of a customer’s solar energy system. Performance-based incentives and tariff-based incentives provide payments to solar customers or a solar energy system owner based on the energy generated by the solar energy system during a pre-determined period. These rebates and payment incentives, when available, improve the economics of distributed solar to both us and our customers.
The economics of purchasing a solar energy system and energy storage system are also improved by eligibility for accelerated depreciation, which allows for the depreciation of equipment according to an accelerated schedule set forth by the IRS. This accelerated schedule allows a taxpayer to recognize the depreciation of tangible solar property on a five-year basis even though the useful life of such property is greater than five years. The acceleration of depreciation creates a valuable tax benefit that increases the return on investment from a solar energy system and energy storage systems. We benefit from accelerated depreciation on the solar energy systems and energy storage systems we own, which account for substantially all of our solar energy systems and energy storage systems.
131
Table of Contents
The federal government currently provides business investment tax credits under Section 48(a) and residential energy credits under Section 25D of the Code. The Section 48(a) ITC allows taxpayers to claim a federal tax credit equal to 30% of qualified expenditures for certain commercially owned solar energy systems that began construction before 2020 if placed in service before 2024. The Section 48(a) ITC percentage decreases to 26% of the basis of a solar energy system that begins construction during 2020, 22% for 2021 and 10% if construction begins after 2021 or if the solar energy system is placed into service after 2023. In June 2018, the IRS provided guidance as to when construction is considered to begin for such purposes, including a safe harbor that may apply when a taxpayer pays or incurs (or in certain cases, a contractor of the taxpayer pays or incurs) 5% or more of the costs of a system before the end of the applicable year. We are also able to claim the Section 48(a) ITC for energy storage systems installed in conjunction with solar energy systems as long as they are only charged by on-site solar. A reduced Section 48(a) ITC may be available for energy storage systems charged in part from sources other than on-site solar as long as the solar energy systems are charged at least 75% by on-site solar.
The Section 25D Credit allows an individual to claim a federal tax credit equal to 26% of qualified expenditures with respect to a residential solar energy system that is owned by the homeowner. This 26% rate was reduced from 30% for solar energy systems placed in service prior to 2020 and is scheduled to be reduced to 22% for solar energy systems placed in service during 2021. The Section 25D Credit is scheduled to expire effective January 1, 2022. The Section 25D Credit reduces the cost of consumer ownership of solar energy systems, such as under loan agreements.
Certain states and territories in which we operate offer a personal and/or corporate investment or production tax credit for solar energy. Further, most of the states and local jurisdictions have established sales and/or property tax incentives for renewable energy systems that include exemptions, exclusions, abatements and credits. For a discussion of these and other governmental incentives, see “Risk Factors—Risks Related to Regulations”.
Competition
We believe our primary competitors are centralized electric utilities that supply electricity to our potential customers. We compete with these centralized electric utilities primarily based on price (cents per kWh), predictability of future prices (by providing pre-determined annual price escalations), reliability and the ease by which customers can switch to electricity generated by solar energy systems. We believe we compete favorably with centralized electric utilities based on these factors in the states and territories where our solar service agreements are offered.
We also compete with retail electric providers and independent power producers that are not regulated like centralized electric utilities but have access to the centralized utilities’ electricity transmission and distribution infrastructure pursuant to state, territorial and local pro-competitive and consumer choice policies. Furthermore, we compete with solar companies with vertically integrated business models, such as Vivint Solar, Inc. and Sunrun Inc. In addition, we compete with other solar companies who sell or finance products directly to consumers, inclusive of programs like Property-Assessed Clean Energy. For example, we face competition from solar installation businesses that seek financing from external parties or utilize competitive loan products or state and local programs. In the future, we may also compete with solar companies that have business models similar to our own, some of which are marketed to potential customers by our dealers. We compete with these companies based on the competitiveness of the products, the overall customer relationship and the commissions we are willing to pay dealers for the origination of new end customers.
132
Table of Contents
Suppliers
The major components of the solar energy systems include solar photovoltaic panels that turn sunlight into direct current (“DC”) electricity, inverters that convert solar-generated DC electricity into alternating current electricity, the form of energy used by most standard household appliances, racking systems that attach the solar photovoltaic panels to the roof or ground, a remote monitoring system that measures and monitors all energy generated by the solar energy system and provides alerts about system performance and in some cases, an energy storage system (battery) that stores excess energy generated by the photovoltaic panels to supplement energy supply during hours when energy consumption exceeds energy produced by the photovoltaic panels. The solar energy system may also be connected to the electrical grid or other supplemental energy sources, such as fuel cells and generators, with additional wiring and electrical hardware.
We require our dealers to choose all major components of the solar energy system or energy storage system from a pre-approved list of manufacturers and models. By allowing dealers to choose from several manufacturers and models without direct supplier obligations, we have greater flexibility to satisfy customer demand, ensure competitive pricing and adequate supply of components and reduce the concentration of warranty risks. We have entered into master contractual arrangements with each vendor on our pre-approved list of vendors that defines the general terms and conditions of our purchases and those of our dealers, including warranties, product specifications, indemnities, delivery and certain other terms. Our dealers typically purchase solar panels and inverters on an as-needed basis from our pre-approved suppliers at then-prevailing prices pursuant to purchase orders having the benefit of our master contractual arrangements. At times, we will also procure equipment directly and sell it to our dealers. For installations in 2020, we have purchased substantially all the inverters that will be deployed under our lease and PPA agreements that we expect will allow the related solar energy systems to qualify for the 30% Section 48(a) ITC by satisfying the 5% ITC Safe Harbor.
We evaluate and qualify our manufacturers and their product offerings based on total cost of ownership, reliability, warranty coverage, credit quality and other factors. All equipment must be listed on the California Energy Commission’s SB1 List of Eligible Equipment. All approved solar photovoltaic panels must have a minimum 25-year power warranty and 10-year workmanship warranty. We also require approved solar photovoltaic panels to undergo extended reliability testing as an indication of a 25-year or greater lifetime. Beginning in April 2016, we required all our manufacturers carry a 25-year warranty, or offer a warranty extension to 25 years, on all product offerings to be eligible for inclusion on our approved vendor list. Prior to April 2016, we sourced inverter manufacturers offering a warranty of no less than 10 years. All approved racking systems are required to be solar energy system Fire Class Rated “A” with a Type 1 module per recent California Fire requirements. Additionally, the racking system must have a Professional Engineers stamp as proof of structural analysis and wind speed certification and the racking system must be certified as conforming to the integrated grounding and bonding requirements of UL Subject 2703. All replacement parts and components must meet or exceed the same standards as those of the original installation.
In September 2018, the USTR determined to modify its prior actions in its investigation into certain acts, policies and practices of the government of China related to technology transfer, intellectual property and innovation pursuant to Section 301 of the Trade Act of 1974 by imposing an additional 10% duty on $200 billion worth of products from China, including inverters. In May 2019, the tariffs were increased from 10% to 25% and may be raised by the USTR in the future. If inverter production is not shifted to other countries before any tariff rate increase on these products, the price of inverters could increase. However, the cost of solar photovoltaic panels and inverters generally do not comprise a meaningful portion of our operating expenses. In addition, many of the solar photovoltaic panel and inverter manufacturers on our approved vendor list are from countries other than China, including Canada, the U.S., Vietnam and Malaysia. See “Risk Factors—Increases in the
133
Table of Contents
cost of our solar energy systems due to tariffs imposed by the U.S. government could have a material adverse effect on our business, financial condition and results of operations”. These tariffs have not had a material impact on our business or our operations.
For the three months ended March 31, 2020, Hanwha Q-Cells and Longi supplied approximately 54% and 15%, respectively, of our solar photovoltaic panels installed and no other supplier represented more than 10% of our solar photovoltaic panels installed. For the year ended December 31, 2019, Hanwha Q-Cells and Yingli Green Energy supplied approximately 50% and 17%, respectively, of our solar photovoltaic panels installed and no other supplier represented more than 10% of our solar photovoltaic panels installed. In 2018, Hanwha Q-Cells and Trina Solar Limited supplied approximately 52% and 22%, respectively, of our solar photovoltaic panels installed and no other supplier represented more than 10% of our solar photovoltaic panels installed. For the three months ended March 31, 2020 and year ended December 31, 2019, Enphase Energy, Inc. and SolarEdge Technologies Inc. accounted for approximately 69%, 31%, 58% and 42%, respectively, of the inverters used in our solar energy system installations. In 2018, Enphase Energy, Inc. and SolarEdge Technologies Inc. accounted for approximately 55% and 43%, respectively, of the inverters used in our solar energy system installations. For the three months ended March 31, 2020 and year ended December 31, 2019, Tesla, Inc. accounted for 100% of our energy storage systems purchases. In 2018, Tesla, Inc. and LG Chem Ltd. accounted for approximately 86% and 13%, respectively, of our energy storage system purchases. Our dealers generally source the additional equipment and parts needed for installation of the solar energy systems, such as fasteners, wiring and electrical fittings, through distributors or direct purchase procurement from manufacturers.
Employees and Contractors
As of March 31, 2020, we had 365 full-time employees and 369 total employees. We also engage independent contractors and consultants. We are not party to any collective bargaining agreements and have not experienced any strikes or work stoppages.
Insurance
We maintain the types and amounts of insurance coverage we believe are consistent with customary industry practices. Our insurance policies cover employee and contractor-related accidents and injuries, property damage, business interruption, storm damage, fixed assets, facilities, cyber, crime and liability deriving from our activities. Our insurance policies also cover directors’, employee and fiduciary liability and officers’ liability. We may also be covered for certain liabilities by insurance policies issued to third parties, including, but not limited to, our dealers and vendors.
134
Table of Contents
CERTAIN RELATIONSHIPS AND RELATED PARTY TRANSACTIONS
The following is a discussion of certain related party transactions since January 1, 2019. For a discussion of additional transactions with related parties, see “Certain Relationships and Related Transactions, and Director Independence—Certain Relationships and Related Transactions” in the amendment to our Annual Report on Form 10-K for the year ended December 31, 2019 filed with the SEC on March 6, 2020 and “Corporate Governance—Certain Relationships and Related Party Transactions” and elsewhere in our Definitive Proxy Statement on Schedule 14A for our 2020 Annual Meeting of Stockholders filed with the SEC on April 9, 2020.
Senior Convertible Notes
In May 2020, we issued and sold an aggregate principal amount of $130.0 million of our 9.75% convertible senior notes in a private placement at an issue price of 95%, for an aggregate purchase price of $123.5 million to certain investors, including QSIP LP and SCI Partners LP. The 9.75% convertible senior notes mature in April 2025 unless earlier redeemed, repurchased or converted. We granted the investors of the 9.75% convertible senior notes an option to purchase up to an additional $60.0 million aggregate principal amount of 9.75% convertible senior notes on the same terms and conditions, and the investors exercised this option and completed the purchase of such additional notes on June 12, 2020. QSIP LP and SCI Partners LP acquired aggregate principal amounts of $39,920,000 and $80,000, respectively, of our 9.75% convertible senior notes. In addition, QSIP LP and SCI Partners LP entered into the registration rights agreements described in the section titled “Description of Capital Stock—Registration Rights” with respect to our 9.75% convertible senior notes and our common stock issuable upon conversion of such notes.
135
Table of Contents
PRINCIPAL AND SELLING STOCKHOLDERS
The following table sets forth information with respect to the beneficial ownership of our common stock that as of June 15, 2020, (1) immediately prior to the consummation of the offering and (2) upon the consummation of this offering will be owned by:
| • | each person known to us to beneficially own more than 5% of our outstanding common stock; |
| • | each member of our board of directors; |
| • | the selling stockholders; |
| • | each of our named executive officers; and |
| • | all of our directors and named executive officers as a group. |
Our calculation of the percentage of beneficial ownership prior to and after the offering is based on 84,040,432 shares of common stock outstanding as of June 15, 2020, assuming conversion of approximately $15.4 million aggregate principal amount of our 9.75% convertible senior notes held by certain of the selling stockholders plus accrued but unpaid interest to June 15, 2020 and no conversion of the remaining $229.6 million aggregate principal amount of our 9.75% convertible senior notes which will remain outstanding. To our knowledge, each of the selling stockholders has sole voting and investment power as to the shares shown, except as disclosed in this prospectus or to the extent this power may be shared with a spouse. Except as noted in this prospectus, none of the selling stockholders is a director, officer or employee of ours or an affiliate of such person.
All information with respect to beneficial ownership has been furnished by the respective 5% or more shareholders, the selling stockholders, our directors or our named executive officers or their respective advisors, as the case may be. Unless otherwise indicated, the address for each listed stockholder is: c/o Sunnova Energy International Inc., 20 East Greenway Plaza, Suite 540, Houston, Texas 77046.
The underwriters have the option to purchase up to an additional 1,200,000 shares of our common stock from certain of the selling stockholders.
| Principal and Selling Stockholders |
Shares Beneficially Owned Prior to the Offering |
Shares to be Sold in the Offering |
Shares Beneficially Owned After the Offering |
|||||||||||||||||||||||||||||
| Excluding Exercise of the Underwriters’ Option to Purchase Additional Shares(16) |
Including Exercise of the Underwriters’ Option to Purchase Additional Shares(16) |
Excluding Exercise of the Underwriters’ Option to Purchase Additional Shares |
Including Exercise of the Underwriters’ Option to Purchase Additional Shares |
|||||||||||||||||||||||||||||
| Number | Percent | Number | Number | Number | Percent | Number | Percent | |||||||||||||||||||||||||
| Selling Stockholder |
||||||||||||||||||||||||||||||||
| Entities affiliated with Energy Capital Partners(1) |
38,352,957 | 45.6 | % | 6,847,975 | 8,047,975 | 31,504,982 | 37.0 | % | 30,304,982 | 35.6 | % | |||||||||||||||||||||
| Entities affiliated with Tortoise Capital Advisors(2) |
2,427,617 | 2.8 | % | 1,152,025 | 1,152,025 | 1,275,592 | 1.5 | % | 1,275,592 | 1.5 | % | |||||||||||||||||||||
| Executive Officers and Directors |
||||||||||||||||||||||||||||||||
| William J. Berger(3) |
2,192,442 | 2.5 | % | — | — | 2,192,442 | 2.5 | % | 2,192,442 | 2.5 | % | |||||||||||||||||||||
| Robert L. Lane(4) |
35,833 | * | — | — | 35,833 | * | 35,833 | * | ||||||||||||||||||||||||
| Walter A. Baker(5) |
232,370 | * | — | — | 232,370 | * | 232,370 | * | ||||||||||||||||||||||||
| Kris W. Hillstrand(6) |
290,274 | * | — | — | 290,274 | * | 290,274 | * | ||||||||||||||||||||||||
| John T. Santo Salvo(7) |
272,429 | * | — | — | 272,429 | * | 272,429 | * | ||||||||||||||||||||||||
| Anne Slaughter Andrew(8) |
18,650 | * | — | — | 18,650 | * | 18,650 | * | ||||||||||||||||||||||||
| Rahman D’Argenio(9) |
— | — | — | — | — | — | — | — | ||||||||||||||||||||||||
| Matthew DeNichilo |
— | — | — | — | — | — | — | — | ||||||||||||||||||||||||
| Doug Kimmelman(9) |
— | — | — | — | — | — | — | — | ||||||||||||||||||||||||
| Mark Longstreth(10) |
— | — | — | — | — | — | — | — | ||||||||||||||||||||||||
| Michael C. Morgan(11) |
527,985 | * | — | — | 527,985 | * | 527,985 | * | ||||||||||||||||||||||||
| C. Park Shaper(12) |
1,778,067 | 2.1 | % | — | — | 1,778,067 | 2.1 | % | 1,778,067 | 2.1 | % | |||||||||||||||||||||
| Scott D. Steimer |
— | — | — | — | — | — | — | — | ||||||||||||||||||||||||
| All Named Executive Officers and Directors as a Group (13 Persons)(13) |
5,348,050 | 6.3 | % | 6.2 | % | 6.2 | % | |||||||||||||||||||||||||
| 5% Stockholders |
||||||||||||||||||||||||||||||||
| Entities affiliated with Energy Capital Partners(1) |
38,352,957 | 45.6 | % | 6,847,975 | 8,047,975 | 31,504,982 | 37.0 | % | 30,304,982 | 35.6 | % | |||||||||||||||||||||
| QSIP LP(14) |
9,635,161 | 11.5 | % | — | — | 9,635,161 | 11.3 | % | 9,635,161 | 11.3 | % | |||||||||||||||||||||
| Entities Affiliated with Elk Mountain Ltd.(15) |
4,209,746 | 5.0 | % | — | — | 4,209,746 | 4.9 | % | 4,209,746 | 4.9 | % | |||||||||||||||||||||
| * | Represents beneficial ownership or voting power of less than one percent (1%). |
136
Table of Contents
| (1) | Prior to the offering, reflects: 528,150 shares held by Energy Capital Partners III, LP (“ECP III”), 17,779,378 shares held by Energy Capital Partners III-A, LP (“ECP III-A”), 2,147,150 shares held by Energy Capital Partners III-B, LP (“ECP III-B”), 7,350,272 shares held by Energy Capital Partners III-C, LP (“ECP III-C”), 9,071,496 shares held by Energy Capital Partners III-D, LP (“ECP III-D”) and 1,476,511 shares held by Energy Capital Partners III (Sunnova Co-Invest), LP (“ECP Co-Invest” and, collectively with ECP III, ECP III-A, ECP III-B, ECP III-C and ECP III-D, the “ECP Holders”). The shares were issued to the ECP Holders in our initial public offering in exchange for preferred shares of our predecessor entity held by the ECP Holders prior to the initial public offering. Each of ECP III, ECP III-A, ECP III-B, ECP III-C and ECP III-D is controlled by its general partner, Energy Capital Partners GP III, LP (“ECP GP”). ECP GP is controlled by its general partner, Energy Capital Partners III, LLC (“Energy Capital Partners”). ECP Co-Invest is managed by its general partner, Energy Capital Partners GP III Co-Investment (Sunnova), LLC (“ECP Co-Invest GP”), which is managed by its sole member, Energy Capital Partners. Energy Capital Partners is wholly owned and controlled by ECP ControlCo, LLC (“ControlCo”). Douglas W. Kimmelman, Peter Labbat, Tyler Reeder, Andrew D. Singer and Rahman D’Argenio are the managing members of ControlCo and share the power to direct the voting and disposition of the shares beneficially owned by Energy Capital Partners. Each such individual disclaims beneficial ownership of such shares. The address for each of the entities listed in this footnote is 40 Beechwood, Summit, New Jersey 07901. |
| (2) | Consists of 585,467 shares issuable to Tortoise Energy Infrastructure Corp., 407,690 shares issuable to Tortoise Midstream Energy Fund, Inc., 117,272 shares issuable to Tortoise Power and Energy Infrastructure Fund, Inc., 692,282 shares issuable to Tortoise Direct Opportunities Fund II, LP, 492,172 shares issuable to Tortoise Essential Assets Income Term Fund and 132,734 shares issuable to Principal Diversified Select Real Asset Fund, which is the maximum number of shares issuable as of June 15, 2020 to such funds upon conversion of the $32.5 million aggregate principal amount and related accrued interest of 9.75% convertible senior notes held by those funds. Tortoise Capital Advisors, L.L.C. is investment advisor to each of Tortoise Energy Infrastructure Corp., Tortoise Midstream Energy Fund, Inc., Tortoise Essential Assets Income Term Fund and Tortoise Direct Opportunities Fund II, LP and is a sub-advisor to Principal Diversified Select Real Asset Fund. Brian A. Kessens, James R. Mick, Matthew G.P. Sallee, Robert J. Thummel, Stephen Pang, and Nicholas S. Holmes, in their position as portfolio managers, may be deemed to have voting and investment power with respect to our 9.75% convertible senior notes held by and any common stock issuable to those funds. Tortoise Capital Advisors, L.L.C. has sole voting and dispositive power with respect to our 9.75% convertible senior notes held by and any common stock issuable to Tortoise Direct Opportunities Fund II, LP and may be deemed to have shared voting and dispositive power with respect to our 9.75% convertible senior notes held by and any common stock issuable to each of Tortoise Energy Infrastructure Corp., Tortoise Midstream Energy Fund, Inc., Tortoise Essential Assets Income Term Fund and Principal Diversified Select Real Asset Fund. The address for Tortoise Capital Advisors, L.L.C. and Messrs. Kessens, Mick, Sallee, Thummel, Pang, and Holmes is 5100 W. 115th Place, Leawood, KS 66211. |
| (3) | Consists of (i) 58,564 directly owned shares of common stock, (ii) 176,653 shares of common stock owned by Jackson Leigh Ventures LLC for which Mr. Berger serves as managing member, (iii) 7,471 shares of common stock held in Mr. Berger’s IRA, (iv) 1,830,707 shares of common stock issuable from the exercise of stock options pursuant to the Sunnova Option Plan and the 2013 Sunnova Stock Option Plan of Sunnova Energy Corporation (collectively, the “prior option plans”) assuming the satisfaction of the vesting condition with respect to all such options and (v) 119,047 restricted stock units that may be settled in shares of common stock within 60 days of June 15, 2020 assuming the satisfaction of the vesting condition. |
| (4) | Consists of (i) 15,000 shares of common stock purchased in the open market and (ii) 20,833 restricted stock units that may be settled in shares of common stock within 60 days of June 15, 2020 assuming the satisfaction of the vesting condition. |
| (5) | Consists of (i) 214,315 shares of common stock issuable from the exercise of stock options pursuant to the prior option plans assuming the satisfaction of the vesting condition with respect to all such options and (ii) 18,055 restricted stock units that may be settled in shares of common stock within 60 days of June 15, 2020 assuming the satisfaction of the vesting condition. |
| (6) | Consists of (i) 1,000 shares of common stock purchased in the open market, (ii) 271,219 shares of common stock issuable upon the exercise of stock options pursuant to the prior option plans assuming the satisfaction of the vesting condition with respect to all such options and (iii) 18,055 restricted stock units that may be settled in shares of common stock within 60 days of June 15, 2020 assuming the satisfaction of the vesting condition. |
| (7) | Consists of (i) 1,000 shares of common stock purchased in the open market, (ii) 6 shares of common stock held indirectly and (iii) 258,923 shares of common stock issuable upon the exercise of stock options pursuant to the prior option plans assuming the satisfaction of the vesting condition with respect to all such options and (iv) 12,500 restricted stock units that may be settled in shares of common stock within 60 days of June 15, 2020 assuming the satisfaction of the vesting condition. |
| (8) | Consists of 18,650 shares of common stock held via trust. |
| (9) | Mr. D’Argenio and Mr. Kimmelman are each a managing member of ControlCo and may be deemed to beneficially own shares owned by ControlCo and certain of its sponsored funds (the “ECP Funds”), which collectively own 38,352,957 shares of common stock. Mr. Kimmelman and Mr. D’Argenio disclaim beneficial ownership of any common stock beneficially owned by the ECP Funds. |
| (10) | Mr. Longstreth is a Partner at Newlight Partners, LP (“Newlight Partners”). Mr. Longstreth disclaims beneficial ownership of any common stock beneficially owned by QSIP LP, Newlight Partners or Newlight GP LLC. |
| (11) | Consists of (i) 491,750 shares held by Portcullis Partners, LP, for which Mr. Morgan serves as the Manager of the general partner, Portcullis G.P., LLC, (ii) 26,868 shares held by Portcullis Investments, LP, for which Mr. Morgan serves as the Manager of the general partner, Portcullis G.P., LLC and (iii) 9,367 shares held by various trusts, for which Mr. Morgan serves as co-trustee. |
| (12) | Consists of 1,778,067 shares held by Seis Holdings LLC, for which Mr. Shaper serves as CEO. Mr. Shaper may be deemed to beneficially own securities beneficially owned by Seis Holdings LLC. |
| (13) | Consists of (i) 2,584,396 shares of common stock beneficially owned by our named executive officers, current directors and other executive officers, (ii) 2,575,164 shares of common stock issuable from the exercise of options pursuant to the prior option plans |
137
Table of Contents
| assuming the satisfaction of the vesting condition with respect to all such options and (iii) 188,490 restricted stock units that may be settled in shares of common stock within 60 days of June 15, 2020 assuming the satisfaction of the vesting condition. |
| (14) | QSIP LP directly holds 9,635,161 shares of our common stock. The shares were issued to QSIP LP in our IPO in exchange for preferred shares of our predecessor entity held by QSIP LP or one of its affiliates prior to the IPO. Pursuant to an investment management agreement, QSIP LP, SCI Partners LP and certain of its affiliates have delegated sole voting and dispositive power over the shares to Newlight Partners LP. The general partner of Newlight Partners is Newlight GP LLC. The sole members of Newlight GP LLC are Ravi Yadav and David Wassong. This amount excludes shares issuable to QSIP LP and shares issuable to SCI Partners LP upon conversion of the $39.9 million and $0.1 million aggregate principal amount of 9.75% convertible senior notes held respectively by those funds. Because we, at our sole option, will have the right to deliver to each holder of the 9.75% convertible senior notes either cash or shares or a combination thereof upon the holder’s optional conversion, each of QSIP LP, SCI Partners LP, Newlight Partners, Newlight GP LLC, Ravi Yadav and David Wassong disclaims and is not deemed to have beneficial ownership of the shares underlying the 9.75% senior convertible notes for purposes of Section 13(d) under the Exchange Act. The address for each of the above-listed entities and individuals is c/o 390 Park Avenue, New York, NY 10022. |
| (15) | Consists of 3,894,579 shares of common stock held by Elk Mountain Ltd and 315,167 shares of common stock held by Minion Trails Ltd. Elk Mountain Ltd and Minion Trails Ltd are collectively controlled by Russell Gordy, a former director of Sunnova Energy Corporation. The address for both entities is 100 Waugh Drive, #400 Houston, TX 77007. |
| (16) | Represents (i) 94,304 shares to be sold by ECP III (or 110,829 shares if the underwriters exercise in full their option to purchase additional shares), (ii) 3,174,533 shares to be sold by ECP III-A (or 3,730,820 shares if the underwriters exercise in full their option to purchase additional shares), (iii) 383,376 shares to be sold by ECP III-B (or 450,557 shares if the underwriters exercise in full their option to purchase additional shares), (iv) 1,312,401 shares to be sold by ECP III-C (or 1,542,379 shares if the underwriters exercise in full their option to purchase additional shares), (v) 1,619,728 shares to be sold by ECP III-D (or 1,903,560 shares if the underwriters exercise in full their option to purchase additional shares), (vi) 263,633 shares to be sold by ECP Co-Invest (or 309,830 shares if the underwriters exercise in full their option to purchase additional shares), (vii) 293,913 shares to be sold by Tortoise Energy Infrastructure Corp., (viii) 204,666 shares to be sold by Tortoise Midstream Energy Fund, Inc., (ix) 58,872 shares to be sold by Tortoise Power and Energy Infrastructure Fund, Inc., (x) 347,535 shares to be sold by Tortoise Direct Opportunities Fund II, LP and (xi) 247,039 shares to be sold by Tortoise Essential Assets Income Term Fund. |
138
Table of Contents
General
The following description summarizes certain important terms of our capital stock and certain important provisions included in our second amended and restated certificate of incorporation, second amended and restated bylaws and stockholders agreement. This summary does not purport to be complete and is qualified in its entirety by the provisions of our second amended and restated certificate of incorporation, second amended and restated bylaws and stockholders agreement, copies of which are included as exhibits to the Registration Statement of which this prospectus forms a part, and to the applicable provisions of Delaware law.
Our authorized capital stock consists of 1,010,000,000 shares of capital stock, $0.0001 par value per share, of which
| • | 1,000,000,000 shares are designated as common stock and |
| • | 10,000,000 shares are designated as preferred stock. |
Common Stock
Dividend Rights
Subject to preferences that may apply to any shares of preferred stock outstanding at the time, the holders of our common stock are entitled to receive dividends out of funds legally available if our board of directors, in its discretion, determines to issue dividends and then only at the times and in the amounts that our board of directors may determine. See the section titled “Dividend Policy” for additional information.
Voting Rights
Holders of our common stock are entitled to one vote for each share held on all matters submitted to a vote of stockholders. Stockholders do not have the ability to cumulate votes for the election of directors.
No Preemptive or Similar Rights
Our common stock is not entitled to preemptive rights and is not subject to conversion, redemption or sinking fund provisions.
Right to Receive Liquidation Distributions
If we become subject to a liquidation, dissolution or winding-up, the assets legally available for distribution to our stockholders would be distributable ratably among the holders of our common stock and any participating preferred stock outstanding at that time, subject to prior satisfaction of all outstanding debt and liabilities and the preferential rights and payment of liquidation preferences, if any, on any outstanding shares of preferred stock.
Fully Paid and Non-Assessable
All of the shares of our common stock are and will be fully paid and non-assessable upon completion of this offering.
139
Table of Contents
Preferred Stock
No shares of our preferred stock are outstanding. Pursuant to our second amended and restated certificate of incorporation, our board of directors has the authority, without further vote or action by our stockholders, to issue from time to time shares of preferred stock in one or more series and to establish from time to time the number of shares to be included in each series. Our board of directors may designate the powers, rights, preferences, and privileges of the shares of each series of preferred stock and any of its qualifications, limitations or restrictions, including dividend rights, conversion rights, voting rights, redemption rights, liquidation preference, and sinking fund terms, in each case without further vote or action by our stockholders. Our board of directors may also increase or decrease the number of shares of any series of preferred stock, but not below the number of shares of that series then outstanding, without any further vote or action by our stockholders. The issuance of preferred stock, while providing flexibility in connection with possible acquisitions and other corporate purposes, could, among other things, have the effect of delaying, deterring, or preventing a change in control, restricting dividends on our common stock, diluting the voting power and other rights of our common stock, and impairing the liquidation rights of our common stock. Such issuance could have the effect of decreasing the market price of our common stock. We currently have no plans to issue any shares of preferred stock.
Options
As of March 31, 2020, we had outstanding options to purchase 4,176,195 shares of our common stock, with a weighted-average exercise price of approximately $15.81 per share that remained outstanding under our equity compensation plans.
Registration Rights
We are a party to our Second Amended and Restated Registration Rights Agreement, dated as of July 29, 2019 (the “Registration Rights Agreement”), which provides, among other things, that certain holders of our capital stock have the right to demand that we file a registration statement or request that their shares of our capital stock be covered by a registration statement that we are otherwise filing.
On May 14, 2020, in connection with the issuance of the 9.75% convertible senior notes, the Registration Rights Agreement was amended (the “Amendment to Registration Rights Agreement”) to add the investors in our 9.75% convertible senior notes as parties and provide that such investors have the right under certain circumstances to demand that we file a registration statement or request that their shares of our capital stock be covered by a registration statement that we are otherwise filing.
On May 14, 2020, in connection with the issuance of the 9.75% convertible senior notes, we entered into a Registration Rights Agreement (the “2020 Registration Rights Agreement”) with the investors in our 9.75% convertible senior notes. Pursuant to, and subject to the limitations set forth in, the 2020 Registration Rights Agreement, we will use our commercially reasonable efforts to prepare and file a shelf registration statement registering the offer and sale of (a) the 9.75% convertible senior
140
Table of Contents
notes and (b) the shares of common stock issued or issuable upon conversion of the 9.75% convertible senior notes, and to cause such shelf registration statement to become effective on or prior to August 1, 2020 and to keep such shelf registration statement effective until all 9.75% convertible senior notes or shares of common stock issuable upon conversion of the outstanding 9.75% convertible senior notes have been sold or disposed of. These registration rights are subject to certain conditions and limitations, including our right to delay or withdraw a registration statement under certain circumstances. Subject to certain limitations, we will generally be obligated to pay all registration expenses in connection with our obligations under the 2020 Registration Rights Agreement. In addition, the 2020 Registration Rights Agreement provides that we will owe liquidated damages if we do not comply, subject to certain thresholds and grace periods, with our registration obligations. Such liquidated damages are payable as additional interest on the 9.75% convertible senior notes, which, if applicable, shall be paid to the relevant holders quarterly in arrears at a rate per year equal to 0.25% per annum of the principal amount of the relevant 9.75% convertible senior notes to, and including, the 90th day following a default by us of our registration obligations, increasing by 0.25% per annum every 90 days thereafter to a maximum 2.0% per annum.
On May 14, 2020, in connection with the exchange and satisfaction of the 7.75% convertible senior notes, we and the investors party to the Registration Rights Agreement dated December 23, 2019 agreed to terminate that registration rights agreement and our and their rights and obligations thereunder.
Demand Registration Rights
Pursuant and subject to the terms and conditions of the Registration Rights Agreement, if we receive a request from certain of our stockholders, as specified in the Registration Rights Agreement, or any stockholder that is a party to the Registration Rights Agreement and is a holder of at least 40% of our capital stock (other than the capital stock held by such stockholders as specified in the Registration Rights Agreements), in each case that we file a Registration Statement on Form S-1 with respect to our capital stock, then we shall file a Registration Statement on Form S-1 under the Securities Act covering all of our capital stock that the initiating stockholders requested to be registered and any additional of our capital stock requested to be included in such registration by any other of our stockholders that are a party to the Registration Rights Agreement.
Piggyback Registration Rights
Pursuant and subject to the terms and conditions of the Registration Rights Agreement, the Piggy-Back Registration Rights Agreement and the 2020 Registration Rights Agreement, as applicable, if we propose to offer any of our shares of common stock under the Securities Act in connection with a public offering of such securities solely for cash, we shall, at such time, promptly give each stockholder who is a party to the Registration Rights Agreement, the Piggy-Back Registration Rights Agreement or the 2020 Registration Rights Agreement notice of such offering. Upon the written request of such stockholder, we shall, subject to the terms and conditions of such registration rights agreement, cause to be registered or include in the prospectus supplement, as applicable, all of the common stock owned or held by each such stockholder (including common stock issued or issuable upon conversion of such stockholder’s preferred stock) that each such stockholder has requested to be included in such registration.
S-3 Registration Rights
Pursuant and subject to the terms of the conditions of the Registration Rights Agreement, if at any time when we are eligible to use Form S-3, we receive a request from certain of our stockholders, as specified in the Registration Rights Agreement, or any stockholder that is a party to the Registration
141
Table of Contents
Rights Agreement and is a holder of at least 30% of our capital stock (other than the capital stock held by such stockholders as specified in the Registration Rights Agreements) then outstanding that we file a registration statement, including a shelf Registration Statement, and if we are a “well known seasoned issuer” as defined in Rule 405 promulgated under the Securities Act, that we file an automatic shelf registration statement, on Form S-3 with respect to outstanding capital stock of such stockholders, then we shall file a registration statement on Form S-3 under the Securities Act covering all eligible capital stock requested to be included in such registration by our eligible stockholders.
Pursuant and subject to the terms and conditions of the 2020 Registration Rights Agreement, we will file a shelf registration statement registering the offer and sale of our convertible senior notes and common stock issuable upon conversion of the convertible senior notes and will cause such shelf registration statement to become effective on or prior to August 1, 2020 and to keep such shelf registration statement effective until there are no convertible senior notes or shares of our common stock issuable upon conversion of outstanding senior convertible notes which are not eligible for resale pursuant to Rule 144 under the Securities Act, without regard to volume limitation.
Anti-Takeover Provisions
Certain provisions of Delaware law, our second amended and restated certificate of incorporation, and our second amended and restated bylaws, which are summarized below, may have the effect of delaying, deferring, or discouraging another person from acquiring control of us. They are also designed, in part, to encourage persons seeking to acquire control of us to negotiate first with our board of directors. We believe that the benefits of increased protection of our potential ability to negotiate with an unfriendly or unsolicited acquirer outweigh the disadvantages of discouraging a proposal to acquire us because negotiation of these proposals could result in an improvement of their terms.
Delaware Law
A corporation may elect not to be subject to Section 203 of the DGCL. We have elected to not be subject to the provisions of Section 203 of the DGCL. However, our second amended and restated certificate of incorporation contains provisions that are similar to Section 203. In general, our second amended and restated certificate of incorporation prohibits us from engaging in a “business combination” with an “interested stockholder” for a period of three years after the date of the transaction in which the person became an interested stockholder, unless:
| • | the business combination or the transaction was approved by the board of directors prior to the time that the stockholder became an interested stockholder; |
| • | upon consummation of the transaction which resulted in the stockholder becoming an interested stockholder, the interested stockholder owned at least 85% of the voting stock of the corporation outstanding at the time the transaction commenced, excluding shares owned by directors who are also officers of the corporation and shares owned by employee stock plans in which employee participants do not have the right to determine confidentially whether shares held subject to the plan will be tendered in a tender or exchange offer; or |
| • | at or subsequent to the time the stockholder became an interested stockholder, the business combination was approved by the board of directors and authorized at an annual or special meeting of the stockholders, and not by written consent, by the affirmative vote of at least two-thirds of the outstanding voting stock which is not owned by the interested stockholder. |
Generally, a business combination includes a merger of us or any of our subsidiaries with the interested stockholder or any sale or disposition (except proportionately as our stockholder) of assets
142
Table of Contents
representing more than 10% of our consolidated assets or the aggregate market value of our capital stock. Subject to certain exceptions, an interested stockholder is a person who, together with affiliates and associates, owns 15% or more of our voting stock or is an affiliate of us and, within the previous three years, owned 15% or more of our voting stock. In our case, however, the ECP Stockholders (meaning, for purposes of our second amended and restated certificate of incorporation, Energy Capital Partners III, LP, Energy Capital Partners III-A, LP, Energy Capital Partners III-B, LP, Energy Capital Partners III-C, LP, Energy Capital Partners III-D, LP, Energy Capital Partners III (Sunnova Co-Invest), LP and each of their respective affiliates that owns any shares of our common stock or preferred stock) and their affiliates or associates and any of their direct transferees (excluding any person who acquires voting stock through a broker’s transaction on an exchange or pursuant to an underwritten public offering) will not be deemed to be interested stockholders regardless of the percentage of our voting stock owned by them, and accordingly will not be subject to such restrictions, subject to certain exceptions for the acquisition of additional shares of common stock. This provision could delay mergers or other takeover or change in control attempts with respect to us and, accordingly, may discourage attempts to acquire us.
Second Amended and Restated Certificate of Incorporation and Second Amended and Restated Bylaw Provisions
Our second amended and restated certificate of incorporation and our second amended and restated bylaws include a number of provisions that could delay or discourage an unsolicited takeover or a change in control or changes in our board of directors or management team, including the following:
| • | establish advance notice procedures with regard to stockholder proposals relating to the nomination of candidates for election as directors or new business to be brought before meetings of our stockholders. These procedures provide that notice of stockholder proposals must be timely given in writing to our corporate secretary prior to the meeting at which the action is to be taken. Generally, to be timely, notice must be received at our principal executive offices not less than 90 days nor more than 120 days prior to the first anniversary date of the annual meeting for the preceding year. Our second amended and restated bylaws specify the requirements as to form and content of all stockholders’ notices. These requirements may preclude stockholders from bringing matters before the stockholders at an annual or special meeting; |
| • | provide our board of directors the ability to authorize undesignated preferred stock. This ability makes it possible for our board of directors to issue, without stockholder approval, preferred stock with voting or other rights or preferences that could impede the success of any attempt to change control of us. These and other provisions may have the effect of deferring hostile takeovers or delaying changes in control or management of us; |
| • | provide that the authorized number of directors may be changed only by resolution of the board of directors; |
| • | provide that all vacancies, including newly created directorships, may, except as otherwise required by law or, if applicable, the rights of holders of a series of preferred stock or the stockholders agreement, be filled by the affirmative vote of a majority of directors then in office, even if less than a quorum; |
| • | provide that, after the date on which the ECP stockholders beneficially own, in the aggregate, less than 30% of our outstanding common stock, any action required or permitted to be taken by the stockholders must be effected at a duly called annual or special meeting of stockholders and may not be effected by any consent in writing in lieu of a meeting of such stockholders, subject to the rights of the holders of any series of preferred stock with respect to such series; |
143
Table of Contents
| • | provide that, after the date on which the ECP stockholders beneficially own, in the aggregate, less than 30% of our outstanding common stock, our certificate of incorporation and bylaws may only be amended by the affirmative vote of the holders of at least two-thirds of our then outstanding common stock; |
| • | provide that, after the date on which the ECP stockholders beneficially own, in the aggregate, less than 30% of our outstanding common stock, special meetings of our stockholders may only be called by the board of directors, the chief executive officer or the chairman of the board; and |
| • | provide that our bylaws can be amended by the board of directors. |
Choice of Forum
Our second amended and restated certificate of incorporation provides that, unless we consent in writing to the selection of an alternative forum, the sole and exclusive forum for (1) any derivative action or proceeding brought on our or our stockholders’ behalf, (2) any action asserting a claim of breach of a fiduciary duty owed by any of our current or former directors, officers, employees, agents and stockholders to us or our stockholders, (3) any action asserting a claim arising pursuant to any provision of the DGCL, our second amended and restated certificate of incorporation or our second amended and restated bylaws, (4) any action as to which the DGCL confers jurisdiction to the Court of Chancery of the State of Delaware, or (5) any other action asserting a claim that is governed by the internal affairs doctrine shall be the Court of Chancery of the State of Delaware. Our second amended and restated certificate of incorporation also provides that, to the fullest extent permitted by applicable law, the federal district courts of the U.S. is the exclusive forum for resolving any complaint asserting a cause of action arising under the Securities Act, subject to and contingent upon a final adjudication in the State of Delaware of the enforceability of such exclusive forum provision.
Notwithstanding the foregoing, the exclusive forum provision will not apply to suits brought to enforce any liability or duty created by the Exchange Act, or any other claim for which the federal courts have exclusive jurisdiction. Any person or entity purchasing or otherwise acquiring an interest in any shares of our capital stock shall be deemed to have notice of and to have consented to the forum provisions in our second amended and restated certificate of incorporation. These choice-of-forum provisions may limit a stockholder’s ability to bring a claim in a judicial forum that he, she or it believes to be favorable for disputes with us or our directors, officers or other employees, which may discourage such lawsuits. Alternatively, if a court were to find these provisions of our second amended and restated certificate of incorporation inapplicable or unenforceable with respect to one or more of the specified types of actions or proceedings, we may incur additional costs associated with resolving such matters in other jurisdictions, which could materially adversely affect our business, financial condition and results of operations and result in a diversion of the time and resources of our management and board of directors.
Transfer Agent and Registrar
The transfer agent and registrar for our common stock is Computershare Trust Company, N.A. The transfer agent and registrar’s address is 250 Royall Street, Canton, Massachusetts 02021.
Limitations of Liability and Indemnification
Our second amended and restated certificate of incorporation and bylaws contains provisions that limit the liability of our directors and officers for monetary damages to the fullest extent permitted by the
144
Table of Contents
DGCL. Consequently, our directors are not personally liable to us or our stockholders for monetary damages for breach of fiduciary duty as a director, except liability:
| • | for any breach of the director’s duty of loyalty to our company or our stockholders; |
| • | for any act or omission not in good faith or that involve intentional misconduct or knowing violation of law; |
| • | under Section 174 of the DGCL regarding unlawful dividends and stock purchases; or |
| • | for any transaction from which the director derived an improper personal benefit. |
Any amendment to, or repeal of, these provisions will not eliminate or reduce the effect of these provisions in respect of any act, omission or claim that occurred or arose prior to that amendment or repeal. If the DGCL is amended to provide for further limitations on the personal liability of directors of corporations, then the personal liability of our directors will be further limited to the greatest extent permitted by the DGCL.
We have entered into and intend to continue to enter into separate indemnification agreements with each of our directors and officers that provide the maximum indemnity allowed to directors and executive officers by Section 145 of the DGCL and also to provide for certain additional procedural protections. We believe that these agreements and insurance policies are necessary to attract and retain qualified individuals to serve as directors and executive officers.
These indemnification provisions and the indemnification agreements entered into between us and our officers and directors may be sufficiently broad to permit indemnification of our officers and directors for liabilities (including reimbursement of expenses incurred) arising under the Securities Act.
We maintain liability insurance policies that indemnify our directors and officers against various liabilities, including certain liabilities under arising under the Securities Act and the Exchange Act, which may be incurred by them in their capacity as such.
The proposed form of underwriting agreement to be filed as Exhibit 1.1 to this Registration Statement will provide for indemnification by the underwriters of us and our officers and directors for certain liabilities arising under the Securities Act or otherwise.
Insofar as indemnification for liabilities arising under the Securities Act may be permitted to directors, officers or persons controlling our company pursuant to the foregoing provisions, we have been informed that, in the opinion of the SEC, such indemnification is against public policy as expressed in the Securities Act and is therefore unenforceable.
Listing
Our common stock is listed on the NYSE under the symbol “NOVA.”
145
Table of Contents
SHARES ELIGIBLE FOR FUTURE SALE
We cannot predict the effect, if any, that this offering will have on the market price of our common stock. Future sales of shares of our common stock in the public market, or the availability of such shares for sale in the public market or the perception that these sales may occur, could adversely affect the prevailing market prices from time to time and our ability to raise equity capital in the future.
Following the completion of this offering, a total of 85,192,457 shares of our common stock will be outstanding. Of these outstanding shares, all shares of our common stock sold in this offering, in addition to the shares that were sold in our IPO, will be eligible for sale in the public market without restriction under the Securities Act, except that any shares of our common stock purchased in this offering by our “affiliates,” as that term is defined in Rule 144 under the Securities Act, would only be able to be sold in compliance with the conditions of Rule 144 described below.
The remaining shares of our common stock will be deemed “restricted securities,” as that term is defined in Rule 144 under the Securities Act. These restricted securities will be eligible for sale in the public market only if they are registered or if they qualify for an exemption from registration under Rule 144 or Rule 701 under the Securities Act, which rules are summarized below. Subject to the lock-up agreements described below, the provisions of our Registration Rights Agreement, Piggy-Back Registration Rights Agreement and 2020 Registration Rights Agreement described under the section titled “Description of Capital Stock—Registration Rights,” the applicable conditions of Rule 144 or Rule 701, and our insider trading policy, shares of our common stock will be eligible for sale in the public market from time to time as follows: (i) beginning on the date of this prospectus, all 8,000,000 shares of our common stock sold in this offering will be immediately available for sale in the public market; and (ii) following the expiration of the lock-up agreements entered into with our executive officers, directors and stockholders identified on page 136, all shares held by them will become eligible for sale in the public markets, subject to any volume and other limitations applicable to the holders of such shares.
Lock-Up Agreements
We, our executive officers, directors, certain of our other significant stockholders and selling stockholders identified on page 136, which include holders of shares issuable pursuant to stock options and other equity awards or pursuant to securities convertible into or exercisable for common stock, have entered or will enter into lock-up agreements with the underwriters of this offering, under which we and they have agreed that, subject to certain exceptions, without the prior written consent of J.P. Morgan Securities LLC and BofA Securities, Inc. (the “representatives”), we and they will not dispose of or hedge any shares of our common stock or any securities convertible into or exchangeable for shares of our common stock for a period of 90 days after the date of this prospectus. The representatives may, in their discretion, release any of the securities subject to these lock-up agreements at any time. See the section titled “Underwriting” for a description of certain exceptions to this agreement.
Rule 144
In general, Rule 144 provides that, since we have been subject to the public company reporting requirements of Section 13 or Section 15(d) of the Exchange Act for at least 90 days, a person who is not deemed to have been one of our affiliates for purposes of the Securities Act at any time during the 90 days preceding a sale and who has beneficially owned the shares of our common stock proposed to be sold (or certain securities that have converted into such shares) for at least six months (including any period of consecutive ownership of preceding non-affiliated holders) is entitled to sell those shares without complying with the manner of sale, volume limitation, or notice provisions of Rule 144, subject
146
Table of Contents
to compliance with the public information requirements of Rule 144. If such a person has beneficially owned the shares proposed to be sold (or certain securities that have converted into such shares) for at least one year, including the holding period of any prior owner other than our affiliates, then that person would be entitled to sell those shares without complying with any of the requirements of Rule 144.
In general, Rule 144 provides that our affiliates or persons selling shares of our common stock on behalf of our affiliates are entitled to sell upon expiration of the market standoff agreements and lock-up agreements described above, within any three-month period, a number of shares of our common stock that does not exceed the greater of:
| • | 1% of the number of shares of our common stock then outstanding, which will equal shares immediately after the completion of this offering; or |
| • | the average weekly trading volume of our common stock during the four calendar weeks preceding the filing of a notice on Form 144 with respect to that sale. |
Sales of common stock made in reliance upon Rule 144 by our affiliates or persons selling shares of our common stock on behalf of our affiliates are also subject to certain manner of sale provisions and notice requirements and to the availability of current public information about us.
Rule 701
Rule 701 generally allows a stockholder who purchased shares of our capital stock pursuant to a written compensatory plan or contract and who is not deemed to have been an affiliate of our company during the immediately preceding 90 days to sell these shares in reliance upon Rule 144, but without being required to comply with the public information, holding period, volume limitation, or notice provisions of Rule 144. Rule 701 also permits affiliates of our company to sell their Rule 701 shares under Rule 144 without complying with the holding period requirements of Rule 144. All holders of Rule 701 shares, however, are required to wait until 90 days after the date of this prospectus before selling those shares pursuant to Rule 701.
Registration Rights
After the completion of this offering, the holders of up to 49,950,995 shares of common stock, in addition to holders of the convertible notes and any shares issuable under the convertible notes, will be entitled to certain rights with respect to the registration of such shares under the Securities Act. The registration of these shares of our common stock under the Securities Act would result in these shares becoming eligible for sale in the public market without restriction under the Securities Act immediately upon the effectiveness of such registration, subject to the Rule 144 limitations applicable to affiliates. For a description of registration rights with respect to our common stock, see the section titled “Description of Capital Stock—Registration Rights.”
Stock Issued Under Employee Plans
We filed a Registration Statement on Form S-8 under the Securities Act following the completion of our IPO to register the offer and sale of shares of our common stock subject to outstanding options, as well as reserved for future issuance, under our equity incentive plans, including our 2019 Long-Term Incentive Plan. Shares of our common stock covered by such Registration Statement may be publicly resold under a valid exemption from registration and subject to the Rule 144 limitations applicable to affiliates, vesting restrictions and any applicable market standoff agreements and lock-up agreements.
147
Table of Contents
MATERIAL U.S. FEDERAL INCOME TAX CONSEQUENCES TO NON-U.S. HOLDERS OF OUR COMMON STOCK
The following is a summary of material U.S. federal income tax consequences to non-U.S. holders, as defined below, of the ownership and disposition of our common stock as of the date of this prospectus. Except where otherwise noted, this summary deals only with our common stock that is purchased in this offering and held as a capital asset (within the meaning of Section 1221 of the Code) by a non-U.S. holder.
As used herein, a “non-U.S. holder” means a beneficial owner of our common stock that is not for U.S. federal income tax purposes any of the following:
| • | an individual who is a citizen or resident of the U.S.; |
| • | a corporation (or any other entity treated as a corporation for U.S. federal income tax purposes) created or organized in or under the laws of the U.S., any state thereof or the District of Columbia; |
| • | any entity or arrangement treated as a partnership for U.S. federal income tax purposes; |
| • | an estate the income of which is subject to U.S. federal income taxation regardless of its source; or |
| • | a trust if it: (i) is subject to the primary supervision of a court within the U.S. and one or more U.S. persons have the authority to control all substantial decisions of the trust; or (ii) has a valid election in effect under applicable U.S. Treasury regulations to be treated as a U.S. person. |
If any entity or arrangement treated as a partnership for U.S. federal income tax purposes holds our common stock, the tax treatment of a partner in that partnership will generally depend upon the status of the partner and the activities of the partnership. If you are a partner of a partnership investing in common stock, you should consult your tax advisors.
This summary is based upon provisions of the Code, applicable U.S. Treasury regulations, rulings and other administrative pronouncements issued by the IRS, and judicial decisions, all as in effect on the date of this prospectus. These authorities may change or be subject to differing interpretations, perhaps retroactively, so as to result in U.S. federal income tax consequences different from those summarized below. We cannot assure you that a change in law or the interpretation thereof will not alter significantly the tax consequences that we describe in this summary.
This summary does not address all aspects of U.S. federal income taxation, does not address the potential application of the Medicare contribution tax on net investment income, and does not deal with foreign, state, local, alternative minimum, estate, gift or other tax considerations that may be relevant to non-U.S. holders in light of their particular circumstances. In addition, this summary does not address the U.S. federal income tax consequences applicable to you if you are subject to special treatment under the U.S. federal income tax laws, including, without limitation:
| • | certain former citizens or long-term residents of the U.S.; |
| • | partnerships or other pass-through entities (and investors therein); |
| • | “controlled foreign corporations”; |
| • | “passive foreign investment companies”; |
| • | corporations that accumulate earnings to avoid U.S. federal income tax; |
148
Table of Contents
| • | banks, financial institutions, tax equity funds, insurance companies, brokers, dealers or traders in securities; |
| • | tax-exempt organizations and governmental organizations; |
| • | tax-qualified retirement plans; |
| • | persons who hold or receive our common stock pursuant to the exercise of any employee stock option or otherwise as compensation; |
| • | persons that own, or have owned, actually or constructively, more than 5% of our common stock (except to the extent specifically set forth below); |
| • | persons who have elected to mark securities to market; and |
| • | persons holding our common stock as part of a hedging or conversion transaction or straddle, or a constructive sale, or other risk reduction strategy or integrated investment. |
We have not and will not seek any rulings from the IRS regarding the matters described below. No assurance can be given that the IRS would not assert, or that a court would not sustain, a position contrary to any of the tax consequences described below.
If you are considering the purchase of our common stock, you should consult your own tax advisors concerning the particular U.S. federal income, estate and other tax consequences to you of the ownership and disposition of the common stock, as well as the consequences to you arising under the laws of any other applicable taxing jurisdiction or under any applicable tax treaty in light of your particular circumstances.
Distributions
We have not made any distributions on our common stock and we do not plan to make any distributions on our common stock for the foreseeable future. However, if we do make distributions on our common stock, those distributions will constitute dividends for U.S. federal income tax purposes to the extent paid from our current or accumulated earnings and profits, as determined under U.S. federal income tax principles.
To the extent a distribution exceeds our current and accumulated earnings and profits, such distribution will reduce the non-U.S. holder’s adjusted tax basis in its common stock (but not below zero) and thereafter will be treated as gain from the sale of the common stock (the tax treatment of which is generally described below under “—Gain on Disposition of Common Stock”).
Subject to the discussions below regarding effectively connected income, backup withholding and Sections 1471 to 1474 of the Code (such Sections commonly referred to as the Foreign Account Tax Compliance Act, or “FATCA”), the gross amount of dividends paid to a non-U.S. holder generally will be subject to withholding of U.S. federal income tax at a 30% rate, or such lower rate as may be specified by an applicable income tax treaty. A non-U.S. holder that wishes to claim the benefit of an applicable income tax treaty for dividends will be required to provide the applicable withholding agent with a valid IRS Form W-8BEN-E or IRS Form W-8BEN (or other applicable or successor form) and certify under penalties of perjury that such holder is not a U.S. person as defined under the Code and is eligible for treaty benefits. This certification must be provided to the applicable withholding agent prior to the payment of dividends and may be required to be updated periodically. If the non-U.S. holder holds the stock through a financial institution or other agent acting on the non-U.S. holder’s behalf, the non-U.S. holder will be required to provide appropriate documentation to the agent, which then will be required to provide certification to us or our paying agent, either directly or through other intermediaries.
149
Table of Contents
It is possible that a distribution made to a non-U.S. holder may be subject to overwithholding because, for example, at the time of the distribution, we or the relevant withholding agent may not be able to determine how much of the distribution constitutes dividends or the proper documentation establishing the benefits of any applicable treaty has not been properly supplied. If there is any overwithholding on distributions made to a non-U.S. holder, such non-U.S. holder may obtain a refund of the overwithheld amount by timely filing an appropriate claim for refund with the IRS. Non-U.S. holders should consult their tax advisors regarding the applicable withholding tax rules and the possibility of obtaining a refund of any overwithheld amounts.
Dividends that are effectively connected with the conduct of a trade or business by the non-U.S. holder within the U.S. (and, where required by an applicable income tax treaty, are attributable to a permanent establishment maintained by the non-U.S. holder in the U.S.) generally are not subject to the withholding tax. To claim the exemption from withholding tax, the non-U.S. holder must generally furnish a valid IRS Form W-8ECI (or applicable successor form) to the applicable withholding agent. Such dividends are generally subject to U.S. federal income tax on a net income basis in the same manner as if the non-U.S. holder were a U.S. person as defined under the Code. A corporate non-U.S. holder may be subject to an additional “branch profits tax” at a 30% rate (or such lower rate as may be specified by an applicable income tax treaty) on its effectively connected earnings and profits attributable to such dividends.
Gain on Disposition of Common Stock
Subject to the discussions below regarding backup withholding and FATCA, any gain realized by a non-U.S. holder on the disposition of our common stock generally will not be subject to U.S. federal income tax unless:
| • | the gain is effectively connected with a trade or business of the non-U.S. holder in the U.S. (and, where required by an applicable income tax treaty, the gain is attributable to a permanent establishment maintained by the non-U.S. holder in the U.S.); |
| • | the non-U.S. holder is an individual who is present in the U.S. for 183 days or more in the taxable year of that disposition and certain other conditions are met; or |
| • | subject to certain exceptions (described below), our common stock constitutes a “U.S. real property interest” by reason of our status as a “United States real property holding corporation” (a “USRPHC”) for U.S. federal income tax purposes at any time during the shorter of the five-year period ending on the date of the disposition or the period that the non-U.S. holder held our common stock. |
Gain described in the first or third bullet point above will be subject to U.S. federal income tax on a net income basis at the same graduated rates generally applicable to U.S. persons unless an applicable tax treaty provides otherwise. A corporate non-U.S. holder may be subject to an additional “branch profits tax” at a 30% rate (or such lower rate as may be specified by an applicable income tax treaty) on its effectively connected earnings and profits attributable to such gain, as adjusted for certain items.
In the case of a non-U.S. holder described in the second bullet point above, except as otherwise provided by an applicable income tax treaty, any gain, which may be offset by certain U.S. source capital losses provided that the non-U.S. holder has timely filed U.S. federal income tax returns with respect to such losses, will be subject to a 30% tax even though the individual is not considered a resident of the U.S. under the Code.
With respect to the third bullet point above, generally a corporation is a USRPHC if the fair market value of its U.S. real property interests equals or exceeds 50% of the sum of the fair market value of its
150
Table of Contents
worldwide real property interests and its other assets used or held for use in a trade or business. We believe that we are not currently and will not become a USRPHC and the remainder of this discussion so assumes. However, there can be no assurance that we are not now or will not become a USRPHC in the future. Even if we are or become a USRPHC, however, as long as our common stock is “regularly traded on an established securities market,” a non-U.S. holder will be taxable on gain recognized on the disposition of our common stock as a result of our status as a USRPHC only if the non-U.S. holder actually or constructively owns, or owned at any time during the five-year period ending on the date of the disposition or, if shorter, the non-U.S. holder’s holding period for the common stock, more than 5% of our common stock.
Non-U.S. holders should consult their tax advisors with respect to the application of the foregoing rules to their ownership and disposition of our common stock.
Information Reporting and Backup Withholding
Generally, we must report annually to the IRS and to you the amount of dividends paid to you and the amount of tax, if any, withheld with respect to such dividends. The IRS may make this information available to the tax authorities in the country in which you are resident, under the terms of an income tax treaty or tax information exchange agreement.
Payments of dividends to you generally will not be subject to backup withholding if you establish an exemption by properly certifying your non-U.S. status on an IRS Form W-8BEN-E, IRS Form W-8BEN or another appropriate version of IRS Form W-8, provided that the withholding agent does not have actual knowledge, or reason to know, that the beneficial owner is a U.S. person that is not an exempt recipient.
Payments of the proceeds from a sale or other disposition by you of our common stock effected by or through a U.S. office of a broker generally will be subject to information reporting and backup withholding (currently at a 24% rate) unless you establish an exemption by properly certifying your non-U.S. status on an IRS Form W-8BEN-E, IRS Form W-8BEN or another appropriate version of IRS Form W-8 and certain other conditions are met or you otherwise establish an exemption. Information reporting and backup withholding generally will not apply to any payment of the proceeds from a sale or other disposition of our common stock effected outside the U.S. by a foreign office of a broker. However, unless such broker has documentary evidence in its records that the holder is a non-U.S. holder and certain other conditions are met, or the non-U.S. holder otherwise establishes an exemption, information reporting will apply to a payment of the proceeds of the disposition of our common stock effected outside the U.S. by such a broker if it has certain relationships within the U.S.
Backup withholding is not an additional tax. Any amounts withheld under the backup withholding rules may be allowed as a refund or a credit against your U.S. federal income tax liability, provided the required information is timely furnished by you to the IRS.
FATCA
FATCA and the rules and regulations promulgated thereunder generally impose U.S. federal withholding tax at a rate of 30% on dividends on and the gross proceeds from a sale or other disposition of our common stock paid to a “foreign financial institution” (as specially defined under these rules), unless otherwise provided by the Treasury Secretary or such institution enters into an agreement with the U.S. government to withhold on certain payments and to collect and provide to the U.S. tax authorities substantial information regarding the U.S. account holders of such institution (which includes certain equity and debt holders of such institution, as well as certain account holders
151
Table of Contents
that are foreign entities with U.S. owners) or otherwise establishes that an exemption to such rule applies. FATCA also generally imposes a U.S. federal withholding tax of 30% on dividends on and the gross proceeds from a sale or other disposition of our common stock paid to a “non-financial foreign entity” (as specially defined for purposes of these rules) unless otherwise provided by the Treasury Secretary or such entity provides the withholding agent with a certification identifying certain substantial direct and indirect U.S. owners of the entity, certifies that there are none or otherwise establishes and certifies that an exemption to such rule applies. The withholding provisions under FATCA generally apply to dividends on our common stock. The Treasury Secretary has issued proposed regulations providing that the withholding provisions under FATCA do not apply with respect to the gross proceeds from a sale or other disposition of our common stock, which may be relied upon by taxpayers until final regulations are issued. An intergovernmental agreement between the U.S. and your country of tax residence may modify the requirements described in this paragraph. Non-U.S. holders should consult their own tax advisors regarding the possible implications of FATCA on their investment in our common stock.
152
Table of Contents
INVESTMENT IN SUNNOVA ENERGY INTERNATIONAL INC. BY EMPLOYEE BENEFIT PLANS
An investment in us by an employee benefit plan is subject to additional considerations because the investments of these plans are subject to the fiduciary responsibility and prohibited transaction provisions of the Employee Retirement Income Security Act of 1974, as amended (“ERISA”), restrictions imposed by Section 4975 of the Code, and/or provisions under any federal, state, local, non- U.S. or other laws or regulations that are similar to such provisions of the Code or ERISA (collectively, “Similar Laws”). For these purposes the term “employee benefit plan” includes, but is not limited to, qualified pension, profit-sharing and stock bonus plans, Keogh plans, simplified employee pension plans and tax deferred annuities or IRAs and entities whose underlying assets are considered to include “plan assets” of such plans, accounts or arrangements. In considering an investment in shares of our common stock, among other things, consideration should be given to:
| • | whether the investment is prudent under Section 404(a)(1)(B) of ERISA and any other applicable Similar Laws; |
| • | whether in making the investment, the plan will satisfy the diversification requirements of Section 404(a)(1)(C) of ERISA and any other applicable Similar Laws; |
| • | whether the investment is permitted under the terms of the applicable documents governing the employee benefit plan; |
| • | whether in making the investment, the employee benefit plan will be considered to hold, as plan assets, (1) only the investment in our common stock or (2) an undivided interest in our underlying assets; and |
| • | whether making such an investment will comply with the delegation of control and prohibited transaction provisions of ERISA, the Code and any other applicable Similar Laws. |
The person with investment discretion with respect to the assets of an employee benefit plan, often called a fiduciary, should determine whether an investment in us is authorized by the appropriate governing instrument and is a proper investment for the plan.
Prohibited Transaction Issues
Section 406 of ERISA and Section 4975 of the Code prohibit employee benefit plans from engaging in specified transactions involving “plan assets” with parties that are “parties in interest” under ERISA or “disqualified persons” under the Code with respect to the employee benefit plan, unless an exemption is applicable. A party in interest or disqualified person who engages in a non-exempt prohibited transaction may be subject to excise taxes and other penalties and liabilities under ERISA and the Code. In addition, the fiduciary of the ERISA plan that engaged in such a non-exempt prohibited transaction may be subject to excise taxes, penalties and liabilities under ERISA and the Code.
Plan Asset Issues
In addition to considering whether the purchase of common stock is a prohibited transaction, a fiduciary of an employee benefit plan should consider whether the plan will, by investing in us, be deemed to own an undivided interest in our assets, with the result that our operations would be subject to the regulatory restrictions of ERISA, including its prohibited transaction rules, as well as the prohibited transaction rules of the Code and any other applicable Similar Laws.
The U.S. Department of Labor regulations provide guidance with respect to whether the assets of an entity in which employee benefit plans acquire equity interests would be deemed “plan assets”
153
Table of Contents
under some circumstances. Under these regulations, an entity’s assets would not be considered to be “plan assets” if, among other things:
| • | the equity interests acquired by employee benefit plans are publicly offered securities—i.e., the equity interests are widely held by 100 or more investors independent of the issuer and each other, freely transferable and registered under some provisions of the federal securities laws; |
| • | the entity is an “operating company”—i.e., it is primarily engaged in the production or sale of a product or service other than the investment of capital either directly or through a majority-owned subsidiary or subsidiaries; or |
| • | there is no significant investment by benefit plan investors, which is defined to mean that less than 25% of the value of each class of equity interest is held by the employee benefit plans referred to above. |
The foregoing discussion of issues arising for employee benefit plan investments under ERISA, the Code and applicable Similar Laws is general in nature and is not intended to be all inclusive, nor should it be construed as legal advice. Plan fiduciaries contemplating a purchase of shares of common stock should consult with their own counsel regarding the consequences under ERISA, the Code and any other applicable Similar Laws in light of the serious penalties imposed on persons who engage in prohibited transactions or other violations.
154
Table of Contents
The selling stockholders are offering the shares of common stock described in this prospectus through a number of underwriters. J.P. Morgan Securities LLC and BofA Securities, Inc. are acting as joint book-running managers of the offering and as representatives of the underwriters. We and the selling stockholders have entered into an underwriting agreement with the underwriters. Subject to the terms and conditions of the underwriting agreement, the selling stockholders have severally agreed to sell to the underwriters, and each underwriter has severally agreed to purchase, at the public offering price less the underwriting discounts and commissions set forth on the cover page of this prospectus, the number of shares of common stock listed next to its name in the following table:
| Name |
Shares | |||
| J.P. Morgan Securities LLC |
||||
| BofA Securities, Inc. |
||||
| Credit Suisse Securities (USA) LLC |
||||
| Goldman Sachs & Co. LLC |
||||
|
|
|
|||
| Total |
8,000,000 | |||
|
|
|
|||
The underwriters are committed to purchase all the shares of common stock offered by the selling stockholders if they purchase any shares. The underwriting agreement also provides that if an underwriter defaults, the purchase commitments of non-defaulting underwriters may also be increased or the offering may be terminated.
The underwriters propose to offer the shares of common stock directly to the public at the public offering price set forth on the cover page of this prospectus and to certain dealers at that price less a concession not in excess of $ per share. Any such dealers may resell shares to certain other brokers or dealers at a discount of up to $ per share from the public offering price. After the initial offering of the shares to the public, if all of the shares of common stock are not sold at the public offering price, the underwriters may change the offering price and the other selling terms. Sales of shares made outside of the United States may be made by affiliates of the underwriters.
The underwriters have an option to buy up to 1,200,000 additional shares of common stock from certain of the selling stockholders to cover sales of shares by the underwriters which exceed the number of shares specified in the table above. The underwriters have 30 days from the date of this prospectus to exercise this option to purchase additional shares. If any shares are purchased with this option to purchase additional shares, the underwriters will purchase shares in approximately the same proportion as shown in the table above. If any additional shares of common stock are purchased, the underwriters will offer the additional shares on the same terms as those on which the shares are being offered.
The underwriting discounts and commissions are equal to the public offering price per share of common stock less the amount paid by the underwriters to the selling stockholders per share of common stock. The underwriting discounts and commissions are $ per share. The following table shows the per-share and total underwriting discounts and commissions to be paid to the underwriters by the selling stockholders. Such amounts are shown assuming both no exercise and full exercise of the underwriters’ option to purchase additional shares.
Paid by the Selling Stockholders
| No Exercise | Full Exercise | |||||||
| Per share |
$ | $ | ||||||
| Total |
$ | $ | ||||||
155
Table of Contents
We have agreed to pay all expenses of this offering on behalf of the selling stockholders other than underwriting discounts and commissions and stock transfer taxes. We estimate that the total expenses of this offering payable by us, including registration, filing and listing fees, printing fees and legal and accounting expenses, but excluding the underwriting discounts and commissions, will be approximately $1,101,330. We have agreed to reimburse the underwriters for reasonable fees and expenses of counsel related to the review by FINRA of the terms of sale of the shares of common stock offered hereby in an amount not to exceed $30,000.
A prospectus in electronic format may be made available on the web sites maintained by one or more underwriters, or selling group members, if any, participating in the offering. The underwriters may agree to allocate a number of shares to underwriters and selling group members for sale to their online brokerage account holders. Internet distributions will be allocated by the representatives to underwriters and selling group members that may make Internet distributions on the same basis as other allocations.
We have agreed that we will not (i) offer, pledge, sell, contract to sell, sell any option or contract to purchase, purchase any option or contract to sell, grant any option, right or warrant to purchase, lend or otherwise transfer or dispose of, directly or indirectly, or submit to or file with, the SEC a registration statement under the Securities Act relating to, any shares of our common stock or securities convertible into or exchangeable or exercisable for any shares of our common stock, or publicly disclose the intention to make any of the foregoing, or (ii) enter into any swap or other agreement that transfers, in whole or in part, any of the economic consequences of ownership of any shares of common stock or any such other securities (regardless of whether any of these transactions are to be settled by the delivery of shares of common stock or such other securities, in cash or otherwise), in each case without the prior written consent of J.P. Morgan Securities LLC and BofA Securities, Inc. for a period of 90 days after the date of this prospectus; provided that the restrictions described in clause (i) or (ii) shall not apply to (A) the shares of common stock to be sold in this offering, (B) shares of common stock issued upon the exercise or settlement of options or restricted stock units or the award, if any, of stock options or restricted stock units in the ordinary course of business, in all cases, pursuant to Company stock plans that are described in the Registration Statement, Pricing Disclosure Package and Prospectus, (C) the conversion or exchange of convertible or exchangeable securities outstanding as of the date of this Prospectus described in the Registration Statement, Pricing Disclosure Package and Prospectus and in the case of the Company’s convertible notes outstanding as of the date of this Prospectus, additional issuances of convertible notes in satisfaction of payment in kind dividends or the conversion thereof, in each case pursuant to the terms of the indenture governing such convertible notes as in effect on the date of this Prospectus and as described in the Registration Statement, Pricing Disclosure Package and Prospectus, (D) the filing of any registration statement on Form S-8 relating to securities granted or to be granted pursuant to the Company stock plans, or (E) in accordance with any existing registration rights agreement of the Company in effect as of the date hereof as described in the Registration Statement, Pricing Disclosure Package and Prospectus; provided that the restrictions described in clause (i) shall not apply to issuance of common stock directly to a seller of a business or assets as part of the purchase price or private placements in connection with acquisitions by us; provided, further, that (x) any recipient of such shares of common stock will agree to be bound by these restrictions for the remainder of such 90-day period and (y) the aggregate number of shares of common stock that we may offer pursuant to the foregoing proviso shall not exceed 10% of the total number of shares of our common stock issued and outstanding immediately following the completion of the offering contemplated by the Prospectus.
Our directors and executive officers, the selling stockholders and certain of our other significant stockholders, which we refer to as “lock-up parties,” have entered or will enter into lock-up agreements with the underwriters prior to the commencement of this offering pursuant to which each of these persons or entities, subject to certain limitations, for a period of 90 days after the date of this prospectus, may not, without the prior written consent of the representatives, (1) offer, pledge, sell,
156
Table of Contents
contract to sell, sell any option or contract to purchase, purchase any option or contract to sell, grant any option, right or warrant to purchase, lend, or otherwise transfer or dispose of, directly or indirectly, any shares of our common stock or any securities convertible into or exercisable or exchangeable for our common stock (including, without limitation, common stock or such other securities which may be deemed to be beneficially owned by such lock-up parties in accordance with the rules and regulations of the SEC and securities which may be issued upon exercise of a stock option or warrant), which we collectively refer to as “lock-up securities,” or (2) enter into any swap or other agreement that transfers, in whole or in part, any of the economic consequences of ownership of the common stock or such other securities, whether any such transaction described in clause (1) or (2) above is to be settled by delivery of common stock or such other securities, in cash or otherwise, or (3) make any demand for or exercise any right with respect to the registration of any shares of our common stock or any security convertible into or exercisable or exchangeable for our common stock, or publicly disclose the intention to do any of the foregoing. The lock-up agreement entered into with the entities affiliated with ECP permits such entities to pledge, hypothecate or grant a security interest in their shares after 30 days from the date of the offering in certain situations. The lock-up agreement entered into with QSIP LP permits the sale of up to approximately 2.1 million shares during the lockup period, which may be sold through market transactions, exercise of demand registration rights, or otherwise.
We and the selling stockholders have agreed to indemnify the underwriters against certain liabilities, including liabilities under the Securities Act. Our common stock is listed on the NYSE under the symbol “NOVA”.
In connection with this offering, the underwriters may engage in stabilizing transactions, which involves making bids for, purchasing and selling shares of common stock in the open market for the purpose of preventing or retarding a decline in the market price of the common stock while this offering is in progress. These stabilizing transactions may include making short sales of the common stock, which involves the sale by the underwriters of a greater number of shares of common stock than they are required to purchase in this offering, and purchasing shares of common stock on the open market to cover positions created by short sales. Short sales may be “covered” shorts, which are short positions in an amount not greater than the underwriters’ option to purchase additional shares referred to above, or may be “naked” shorts, which are short positions in excess of that amount. The underwriters may close out any covered short position either by exercising their option to purchase additional shares, in whole or in part, or by purchasing shares in the open market. In making this determination, the underwriters will consider, among other things, the price of shares available for purchase in the open market compared to the price at which the underwriters may purchase shares through the option to purchase additional shares. A naked short position is more likely to be created if the underwriters are concerned that there may be downward pressure on the price of the common stock in the open market that could adversely affect investors who purchase in this offering. To the extent that the underwriters create a naked short position, they will purchase shares in the open market to cover the position.
The underwriters have advised us that, pursuant to Regulation M of the Securities Act, they may also engage in other activities that stabilize, maintain or otherwise affect the price of the common stock, including the imposition of penalty bids. This means that if the representatives of the underwriters purchase common stock in the open market in stabilizing transactions or to cover short sales, the representatives can require the underwriters that sold those shares as part of this offering to repay the underwriting discount received by them.
These activities may have the effect of raising or maintaining the market price of the common stock or preventing or retarding a decline in the market price of the common stock, and, as a result, the price of the common stock may be higher than the price that otherwise might exist in the open market. If the underwriters commence these activities, they may discontinue them at any time. The underwriters may carry out these transactions on the NYSE, in the over-the-counter market or otherwise.
157
Table of Contents
Other Relationships
Certain of the underwriters and their affiliates have provided in the past to us and our affiliates and may provide from time to time in the future certain commercial banking, financial advisory, investment banking and other services for us and such affiliates in the ordinary course of their business, for which they have received and may continue to receive customary fees and commissions. For example, affiliates of BofA Securities, Inc. and affiliates of J.P. Morgan Securities LLC have entered into agreements to invest in some of our tax equity funds and they and others may do so in the future. In addition, from time to time, certain of the underwriters and their affiliates may effect transactions for their own account or the account of customers, and hold on behalf of themselves or their customers, long or short positions in our debt or equity securities or loans, and may do so in the future.
Selling Restrictions
Other than in the United States, no action has been taken by us, the selling stockholders or the underwriters that would permit a public offering of the securities offered by this prospectus in any jurisdiction where action for that purpose is required. The securities offered by this prospectus may not be offered or sold, directly or indirectly, nor may this prospectus or any other offering material or advertisements in connection with the offer and sale of any such securities be distributed or published in any jurisdiction, except under circumstances that will result in compliance with the applicable rules and regulations of that jurisdiction. Persons into whose possession this prospectus comes are advised to inform themselves about and to observe any restrictions relating to the offering and the distribution of this prospectus. This prospectus does not constitute an offer to sell or a solicitation of an offer to buy any securities offered by this prospectus in any jurisdiction in which such an offer or a solicitation is unlawful.
Canada
The shares may be sold only to purchasers purchasing, or deemed to be purchasing, as principal that are accredited investors, as defined in National Instrument 45-106 Prospectus Exemptions or subsection 73.3(1) of the Securities Act (Ontario), and are permitted clients, as defined in National Instrument 31-103 Registration Requirements, Exemptions and Ongoing Registrant Obligations. Any resale of the shares must be made in accordance with an exemption from, or in a transaction not subject to, the prospectus requirements of applicable securities laws.
Securities legislation in certain provinces or territories of Canada may provide a purchaser with remedies for rescission or damages if this prospectus (including any amendment thereto) contains a misrepresentation, provided that the remedies for rescission or damages are exercised by the purchaser within the time limit prescribed by the securities legislation of the purchaser’s province or territory. The purchaser should refer to any applicable provisions of the securities legislation of the purchaser’s province or territory for particulars of these rights or consult with a legal advisor.
Pursuant to section 3A.3 of National Instrument 33-105 Underwriting Conflicts (NI 33-105), the underwriters are not required to comply with the disclosure requirements of NI 33-105 regarding underwriter conflicts of interest in connection with this offering.
European Economic Area and United Kingdom
In relation to each Member State of the European Economic Area and the United Kingdom (each a “Relevant State”), no securities have been offered or will be offered pursuant to the offering to the public in that Relevant State prior to the publication of a prospectus in relation to the securities which has been approved by the competent authority in that Relevant State or, where appropriate, approved in another Relevant State and notified to the competent authority in that Relevant State, all in accordance with the Prospectus Regulation), except that offers of shares may be made to the public in that Relevant State at any time under the following exemptions under the Prospectus Regulation:
| (a) | to any legal entity which is a qualified investor as defined under the Prospectus Regulation; |
158
Table of Contents
| (b) | to fewer than 150 natural or legal persons (other than qualified investors as defined under the Prospectus Regulation), subject to obtaining the prior consent of representatives for any such offer; or |
| (c) | in any other circumstances falling within Article 1(4) of the Prospectus Regulation, |
provided that no such offer of shares shall require the Issuer or any Manager to publish a prospectus pursuant to Article 3 of the Prospectus Regulation or supplement a prospectus pursuant to Article 23 of the Prospectus Regulation.
For the purposes of this provision, the expression an “offer to the public” in relation to any securities in any Relevant State means the communication in any form and by any means of sufficient information on the terms of the offer and any shares to be offered so as to enable an investor to decide to purchase or subscribe for any shares, and the expression “Prospectus Regulation” means Regulation (EU) 2017/1129.
The shares are not intended to be offered, sold or otherwise made available to and should not be offered, sold or otherwise made available to any retail investor in the European Economic Area (“EEA”). For these purposes, a retail investor means a person who is one (or more) of: (i) a retail client as defined in point (11) of Article 4(1) of Directive 2014/65/EU (as amended, “MiFID II”); or (ii) a customer within the meaning of Directive 2002/92/EC (as amended, the “Insurance Mediation Directive”), where that customer would not qualify as a professional client as defined in point (10) of Article 4(1) of MiFID II; or (iii) not a qualified investor as defined in Directive 2003/71/EC (as amended, the “Prospectus Directive”). Consequently no key information document required by Regulation (EU) No 1286/2014 (as amended, the “PRIIPs Regulation”) for offering or selling the shares or otherwise making them available to retail investors in the EEA has been prepared and therefore offering or selling the securities or otherwise making them available to any retail investor in the EEA may be unlawful under the PRIIPS Regulation.
United Kingdom
In the United Kingdom, this document is being distributed only to, and is directed only at, and any offer subsequently made may only be directed at persons who are “qualified investors” (as defined in the Prospectus Regulation) (i) who have professional experience in matters relating to investments falling within Article 19(5) of the Financial Services and Markets Act 2000 (Financial Promotion) Order 2005, as amended (the “Order”) and/or (ii) who are high net worth companies (or persons to whom it may otherwise be lawfully communicated) falling within Article 49(2)(a) to (d) of the Order (all such persons together being referred to as “relevant persons”) or otherwise in circumstances which have not resulted and will not result in an offer to the public of the shares in the United Kingdom.
Any person in the United Kingdom that is not a relevant person should not act or rely on the information included in this document or use it as basis for taking any action. In the United Kingdom, any investment or investment activity that this document relates to may be made or taken exclusively by relevant persons.
Hong Kong
The shares have not been offered or sold and will not be offered or sold in Hong Kong, by means of any document, other than (a) to “professional investors” as defined in the Securities and Futures Ordinance (Cap. 571 of the Laws of Hong Kong), or the SFO, of Hong Kong and any rules made thereunder; or (b) in other circumstances which do not result in the document being a “prospectus” as defined in the Companies (Winding Up and Miscellaneous Provisions) Ordinance (Cap. 32) of Hong
159
Table of Contents
Kong), or the CO, or which do not constitute an offer to the public within the meaning of the CO. No advertisement, invitation or document relating to the shares has been or may be issued or has been or may be in the possession of any person for the purposes of issue, whether in Hong Kong or elsewhere, which is directed at, or the contents of which are likely to be accessed or read by, the public of Hong Kong (except if permitted to do so under the securities laws of Hong Kong) other than with respect to shares which are or are intended to be disposed of only to persons outside Hong Kong or only to “professional investors” as defined in the SFO and any rules made thereunder.
Japan
The shares have not been and will not be registered pursuant to Article 4, Paragraph 1 of the Financial Instruments and Exchange Act. Accordingly, none of the shares nor any interest therein may be offered or sold, directly or indirectly, in Japan or to, or for the benefit of, any “resident” of Japan (which term as used herein means any person resident in Japan, including any corporation or other entity organized under the laws of Japan), or to others for reoffering or resale, directly or indirectly, in Japan or to or for the benefit of a resident of Japan, except pursuant to an exemption from the registration requirements of, and otherwise in compliance with, the Financial Instruments and Exchange Act and any other applicable laws, regulations and ministerial guidelines of Japan in effect at the relevant time.
Singapore
Singapore SFA Product Classification—In connection with Section 309B of the SFA and the CMP Regulations 2018, unless otherwise specified before an offer of shares, the we have determined, and hereby notify all relevant persons (as defined in Section 309A(1) of the SFA), that the shares are “prescribed capital markets products” (as defined in the CMP Regulations 2018) and Excluded Investment Products (as defined in MAS Notice SFA 04-N12: Notice on the Sale of Investment Products and MAS Notice FAA-N16: Notice on Recommendations on Investment Products).
Each representative has acknowledged that this prospectus has not been registered as a prospectus with the Monetary Authority of Singapore. Accordingly, each representative has represented and agreed that it has not offered or sold any shares or caused the shares to be made the subject of an invitation for subscription or purchase and will not offer or sell any shares or cause the shares to be made the subject of an invitation for subscription or purchase, and has not circulated or distributed, nor will it circulate or distribute, this prospectus or any other document or material in connection with the offer or sale, or invitation for subscription or purchase, of the shares, whether directly or indirectly, to any person in Singapore other than:
(a) to an institutional investor (as defined in Section 4A of the Securities and Futures Act (Chapter 289) of Singapore, as modified or amended from time to time (the “SFA”)) pursuant to Section 274 of the SFA;
(b) to a relevant person (as defined in Section 275(2) of the SFA) pursuant to Section 275(1) of the SFA and in accordance with the conditions specified in Section 275 of the SFA; or
(c) otherwise pursuant to, and in accordance with the conditions of, any other applicable provision of the SFA.
160
Table of Contents
Where the shares are subscribed or purchased under Section 275 of the SFA by a relevant person which is:
(a) a corporation (which is not an accredited investor (as defined in Section 4A of the SFA)) the sole business of which is to hold investments and the entire share capital of which is owned by one or more individuals, each of whom is an accredited investor; or
(b) a trust (where the trustee is not an accredited investor) whose sole purpose is to hold investments and each beneficiary of the trust is an individual who is an accredited investor, securities or securities-based derivatives contracts (each term as defined in Section 2(1) of the SFA) of that corporation or the beneficiaries’ rights and interest (howsoever described) in that trust shall not be transferred within six months after that corporation or that trust has acquired the shares pursuant to an offer made under Section 275 of the SFA except:
(i) to an institutional investor or to a relevant person, or to any person arising from an offer referred to in Section 276(4)(i)(B) of the SFA;
(i) where no consideration is or will be given for the transfer;
(ii) where the transfer is by operation of law;
(iii) as specified in Section 276(7) of the SFA; or
as specified in Regulation 37A of the Securities and Futures (Offers of Investments) (Securities and Securities-based Derivatives Contracts) Regulations 2018.
Switzerland
This prospectus is not intended to constitute an offer or solicitation to purchase or invest in the shares.
The shares may not be publicly offered, directly or indirectly, in Switzerland within the meaning of the Swiss Financial Services Act (“FinSA”) and no application has or will be made to admit the shares to trading on any trading venue (exchange or multilateral trading facility) in Switzerland. Neither this prospectus nor any other offering or marketing material relating to the shares constitutes a prospectus pursuant to the FinSA, and neither this prospectus nor any other offering or marketing material relating to the shares may be publicly distributed or otherwise made publicly available in Switzerland.
Dubai International Financial Centre (“DIFC”)
This document relates to an Exempt Offer in accordance with the Markets Rules 2012 of the Dubai Financial Services Authority (“DFSA”). This document is intended for distribution only to persons of a type specified in the Markets Rules 2012 of the DFSA. It must not be delivered to, or relied on by, any other person. The DFSA has no responsibility for reviewing or verifying any documents in connection with Exempt Offers. The DFSA has not approved this prospectus supplement nor taken steps to verify the information set forth herein and has no responsibility for this document. The securities to which this document relates may be illiquid and/or subject to restrictions on their resale. Prospective purchasers of the securities offered should conduct their own due diligence on the securities. If you do not understand the contents of this document you should consult an authorized financial advisor.
In relation to its use in the DIFC, this document is strictly private and confidential and is being distributed to a limited number of investors and must not be provided to any person other than the original recipient, and may not be reproduced or used for any other purpose. The interests in the securities may not be offered or sold directly or indirectly to the public in the DIFC.
161
Table of Contents
United Arab Emirates
The shares have not been, and are not being, publicly offered, sold, promoted or advertised in the United Arab Emirates (including the Dubai International Financial Centre) other than in compliance with the laws of the United Arab Emirates (and the Dubai International Financial Centre) governing the issue, offering and sale of securities. Further, this prospectus does not constitute a public offer of securities in the United Arab Emirates (including the Dubai International Financial Centre) and is not intended to be a public offer. This prospectus has not been approved by or filed with the Central Bank of the United Arab Emirates, the Securities and Commodities Authority or the Dubai Financial Services Authority.
Australia
This prospectus:
| • | does not constitute a disclosure document or a prospectus under Chapter 6D.2 of the Corporations Act 2001 (Cth) (the “Corporations Act”); |
| • | has not been, and will not be, lodged with the Australian Securities and Investments Commission (“ASIC”), as a disclosure document for the purposes of the Corporations Act and does not purport to include the information required of a disclosure document for the purposes of the Corporations Act; and |
| • | may only be provided in Australia to select investors who are able to demonstrate that they fall within one or more of the categories of investors, available under section 708 of the Corporations Act (“Exempt Investors”). |
The shares may not be directly or indirectly offered for subscription or purchased or sold, and no invitations to subscribe for or buy the shares may be issued, and no draft or definitive offering memorandum, advertisement or other offering material relating to any shares may be distributed in Australia, except where disclosure to investors is not required under Chapter 6D of the Corporations Act or is otherwise in compliance with all applicable Australian laws and regulations. By submitting an application for the shares, you represent and warrant to us that you are an Exempt Investor.
As any offer of shares under this document will be made without disclosure in Australia under Chapter 6D.2 of the Corporations Act, the offer of those securities for resale in Australia within 12 months may, under section 707 of the Corporations Act, require disclosure to investors under Chapter 6D.2 if none of the exemptions in section 708 applies to that resale. By applying for the shares you undertake to us that you will not, for a period of 12 months from the date of sale of the shares, offer, transfer, assign or otherwise alienate those shares to investors in Australia except in circumstances where disclosure to investors is not required under Chapter 6D.2 of the Corporations Act or where a compliant disclosure document is prepared and lodged with ASIC.
Korea
The shares have not been and will not be registered under the Financial Investments Services and Capital Markets Act of Korea and the decrees and regulations thereunder (the “FSCMA”), and the shares have been and will be offered in Korea as a private placement under the FSCMA. None of the shares may be offered, sold or delivered directly or indirectly, or offered or sold to any person for re-offering or resale, directly or indirectly, in Korea or to any resident of Korea except pursuant to the applicable laws and regulations of Korea, including the FSCMA and the Foreign Exchange Transaction Law of Korea and the decrees and regulations thereunder (the “FETL”). Furthermore, the purchaser of the shares shall comply with all applicable regulatory requirements (including but not limited to requirements under the FETL) in connection with the purchase of the shares. By the purchase of the
162
Table of Contents
shares, the relevant holder thereof will be deemed to represent and warrant that if it is in Korea or is a resident of Korea, it purchased the shares pursuant to the applicable laws and regulations of Korea.
Israel
We have not taken any action to permit a public offering of our shares outside the U.S. Solicitation of our shares, however, will be made in certain countries in a manner that will not require the publication of a prospectus under the laws of the country. Persons outside the U.S. who come into possession of this prospectus must inform themselves about and observe any restrictions relating to the offering of our shares and the distribution of this prospectus outside the U.S.
Notwithstanding the above, the offering of our shares is available to investors listed in the First Supplement of the Israeli Securities Law of 1968, as amended. A prospectus has not been prepared or filed, and will not be prepared or filed, in Israel relating to the shares offered hereunder. The shares cannot be resold in Israel other than to investors listed in the First Supplement of the Israeli Securities Law of 1968, as amended purchasing for their own account and not for distribution or resale purposes. No action will be taken in Israel that would permit an offering of the shares offered hereunder, or the distribution of any offering document or any other material to the public in Israel. This registration statements has not been reviewed or approved by the Israel Securities Authority. Any materials provided to an investor in Israel may not be reproduced or used for any other purpose, nor be furnished to any other person other than those to whom copies have been provided directly by the Issuer or the Dealer(s). The shares will not be traded on the TASE. Nothing in the above should be considered as the rendering of a recommendation or advice, including investment advice or investment marketing under the Israeli Law For Regulation of Investment Advice, Investment Marketing and Investment Portfolio Management, 1995, to purchase any shares and in purchasing the shares, the investors acknowledge they do so based on their own understanding, for their own benefit and for their own account and not with the aim or intention of distributing or offering to other parties. The investors further declare that they have the knowledge, expertise and experience in financial and business matters so as to be capable of evaluating the risks and merits of the purchase of the shares, without relying on any of the materials provided to them.
163
Table of Contents
The validity of our common stock offered by this prospectus will be passed upon for us by Baker Botts L.L.P., Houston, Texas. Certain legal matters in connection with this offering will be passed upon for the underwriters by Vinson & Elkins L.L.P., Houston, Texas and for the selling stockholders by Latham & Watkins LLP, New York, New York and Baker Botts L.L.P., Houston, Texas.
164
Table of Contents
The financial statements incorporated in this Prospectus by reference to the Annual Report on Form 10-K for the year ended December 31, 2019 have been so incorporated in reliance on the report of PricewaterhouseCoopers LLP, an independent registered public accounting firm, given on the authority of said firm as experts in auditing and accounting.
165
Table of Contents
WHERE YOU CAN FIND ADDITIONAL INFORMATION
We have filed with the SEC a Registration Statement on Form S-1 under the Securities Act with respect to our common stock offered under this prospectus. This prospectus, which constitutes a part of the Registration Statement, does not contain all of the information set forth in the Registration Statement, some of which is contained in exhibits and schedules to the Registration Statement as permitted by the rules and regulations of the SEC. Some items are omitted in accordance with the rules and regulations of the SEC. For further information with respect to us and our common stock, please refer to the Registration Statement including its exhibits and schedules filed therewith. Statements contained in this prospectus relating to any contract or other document are not necessarily complete. If a contract or document has been filed as an exhibit to the Registration Statement, please see the copy of the contract or document that has been filed. Each statement in this prospectus relating to a contract or document filed as an exhibit is qualified in all respects by the filed exhibit. The SEC maintains an Internet website that contains reports, proxy and information statements, and other information. The address of that website is www.sec.gov. Information contained on any website we refer to in this prospectus is not part of this prospectus or any report filed with or furnished to the SEC.
We file with or furnish to the SEC periodic reports, proxy statements and other information. These periodic reports, proxy statements and other information will be available for inspection and copying at the website of the SEC referred to above. We also maintain a website at www.sunnova.com. You may access these materials on our website free of charge as soon as reasonably practicable after they are electronically filed with, or furnished to, the SEC. Our website is included in this prospectus as an inactive textual reference only. The information found on our website is not part of this prospectus or any report filed with or furnished to the SEC.
We furnish or make available to our stockholders annual reports containing our audited financial statements, including the information required by Form 10-K, and furnish or make available to our stockholders quarterly reports containing our unaudited interim financial information, including the information required by Form 10-Q, for the first three fiscal quarters of each fiscal year.
166
Table of Contents
INFORMATION INCORPORATED BY REFERENCE
The SEC allows us to “incorporate by reference” into this prospectus the information we file with it, which means that we can disclose important information to you by referring you to those documents. We are incorporating by reference:
| • | our Annual Report on Form 10-K for the year ended December 31, 2019, filed on February 25, 2020, including the amendment to our Annual Report on Form 10-K, filed on March 6, 2020; |
| • | our Quarterly Report on Form 10-Q for the quarter ended March 31, 2020, filed on May 15, 2020; |
| • | the description of our common stock in our registration statement on Form 8-A (registration statement No. 001-38995) filed on July 22, 2019; and |
| • | our Current Reports on Form 8-K filed on January 23, 2020, February 4, 2020, February 11, 2020, February 14, 2020, February 24, 2020, March 3, 2020, April 2, 2020, May 14, 2020, May 20 , 2020, June 12, 2020, June 17, 2020, June 22, 2020 and June 29, 2020 (in each case, excluding any information “furnished” but not “filed” as set forth therein); |
| • | our Definitive Proxy Statement on Schedule 14A for our 2020 Annual Meeting of Stockholders, filed with the SEC on April 9, 2020, including the amendment to our Definitive Proxy Statement on Schedule 14A for our 2020 Annual Meeting of Stockholders, filed with the SEC on May 7, 2020, in each case to the extent incorporated by reference into our Form 10-K; and |
| • | all other reports filed by us with the SEC pursuant to Section 13(a) or 15(d) of the Exchange Act or proxy or information statements filed pursuant to Section 14 of the Exchange Act after December 31, 2019 and prior to the effectiveness of this Registration Statement, in each case excluding any information “furnished” but not “filed,” unless we specifically provide that such “furnished” information is to be incorporated by reference. |
Information incorporated by reference is considered to be part of this prospectus, except for any information that is superseded by information included directly in this prospectus. Any statement contained in this prospectus or a document incorporated by reference in this prospectus will be deemed to be modified or superseded for purposes of this prospectus to the extent that a statement contained in this prospectus or any free writing prospectus provided to you in connection with this offering modifies or superseded the statement. Any statement so modified or superseded will not be deemed, except as so modified or superseded, to constitute a part of this prospectus.
All filings made by us with the SEC pursuant to the Exchange Act after the date of this Registration Statement and prior to the effectiveness of this Registration Statement shall also be deemed incorporated by reference into this prospectus.
We will provide a copy of any and all of the information that is incorporated by reference in this prospectus to any person, including a beneficial owner, to whom a prospectus is delivered, without charge, upon written or oral request. You may obtain a copy of these filings by writing or telephoning:
Sunnova Energy International Inc.
Attention: Investor Relations
20 East Greenway Plaza, Suite 540
Houston, Texas 77046
(281) 985-9904
167
Table of Contents
| J.P. Morgan | BofA Securities | Credit Suisse | Goldman Sachs & Co. LLC |
Table of Contents
PART II
INFORMATION NOT REQUIRED IN PROSPECTUS
ITEM 13. OTHER EXPENSES OF ISSUANCE AND DISTRIBUTION.
The following table sets forth all expenses to be paid by the Registrant, other than underwriting discounts and commissions, upon the completion of this offering. All amounts shown are estimates except for the SEC registration fee and the FINRA filing fee. We have agreed to pay all offering expenses, other than underwriting discounts and commissions, for the selling stockholders incurred in connection with the sale by the selling stockholders.
| Amount to be Paid |
||||
| SEC registration fee |
$ | 23,370 | ||
| FINRA filing fee |
26,860 | |||
| Printing and engraving expenses |
150,000 | |||
| Legal fees and expenses |
675,000 | |||
| Accounting fees and expenses |
200,000 | |||
| Transfer agent and registrar fees |
6,100 | |||
| Miscellaneous expenses |
20,000 | |||
|
|
|
|||
| Total |
$ | 1,101,330 | ||
|
|
|
|||
II-1
Table of Contents
ITEM 14. INDEMNIFICATION OF DIRECTORS AND OFFICERS.
The DGCL provides that a corporation may indemnify any person who was or is a party, or is threatened to be made a party, to any threatened, pending or completed action, suit or proceeding, whether civil, criminal, administrative or investigative (other than an action by or in the right of the corporation by reason of the fact that he is or was a director, officer, employee or agent of the corporation, or is or was serving at the request of the corporation as a director, officer, employee or agent of another corporation, partnership, joint venture, trust or other enterprise), against expenses (including attorneys’ fees), judgments, fines and amounts paid in settlement actually and reasonably incurred by him in connection with such action, suit or proceeding if he acted in good faith and in a manner he reasonably believed to be in or not opposed to the best interests of the corporation and, with respect to any criminal action or proceeding, had no reasonable cause to believe his conduct was unlawful. A similar standard is applicable in the case of derivative actions (i.e., actions by or in the right of the corporation), except that indemnification extends only to expenses, including attorneys’ fees, incurred in connection with the defense or settlement of such action and the statute requires court approval before there can be any indemnification where the person seeking indemnification has been found liable to the corporation.
Our second amended and restated certificate of incorporation and bylaws contains provisions that limit the liability of our directors and officers for monetary damages to the fullest extent permitted by the DGCL. Consequently, our directors are not personally liable to us or our stockholders for monetary damages for breach of fiduciary duty as a director, except liability:
| • | for any breach of the director’s duty of loyalty to our company or our stockholders; |
| • | for any act or omission not in good faith or that involve intentional misconduct or knowing violation of law; |
| • | under Section 174 of the DGCL regarding unlawful dividends and stock purchases; or |
| • | for any transaction from which the director derived an improper personal benefit. |
Any amendment to, or repeal of, these provisions will not eliminate or reduce the effect of these provisions in respect of any act, omission or claim that occurred or arose prior to that amendment or repeal. If the DGCL is amended to provide for further limitations on the personal liability of directors of corporations, then the personal liability of our directors will be further limited to the greatest extent permitted by the DGCL.
We have entered into and intend to continue to enter into separate indemnification agreements with each of our directors and officers that provide the maximum indemnity allowed to directors and executive officers by Section 145 of the DGCL and also to provide for certain additional procedural protections. We believe that these agreements and insurance policies are necessary to attract and retain qualified individuals to serve as directors and executive officers.
These indemnification provisions and the indemnification agreements entered into between the Registrant and its officers and directors may be sufficiently broad to permit indemnification of the Registrant’s officers and directors for liabilities (including reimbursement of expenses incurred) arising under the Securities Act.
We maintain liability insurance policies that indemnify our directors and officers against various liabilities, including certain liabilities under arising under the Securities Act and the Exchange Act, which may be incurred by them in their capacity as such.
The proposed form of underwriting agreement to be filed as Exhibit 1.1 to this Registration Statement will provide for indemnification by the underwriters of the Registrant and its officers and directors for certain liabilities arising under the Securities Act or otherwise.
II-2
Table of Contents
Insofar as indemnification for liabilities arising under the Securities Act may be permitted to directors, officers or persons controlling our company pursuant to the foregoing provisions, we have been informed that, in the opinion of the SEC, such indemnification is against public policy as expressed in the Securities Act and is therefore unenforceable.
ITEM 15. RECENT SALES OF UNREGISTERED SECURITIES.
Since January 1, 2017, we issued the following unregistered securities. We believe the offers, sales, and issuances of the below securities were exempt from registration under the Securities Act by virtue of Section 4(a)(2) of the Securities Act because the issuance of securities to the recipients did not involve a public offering, Section 3(a)(9) of the Securities Act because the issuance involved existing security holders exclusively where no commission or other remuneration was paid or given directly or indirectly for soliciting such exchange, or Rule 701 promulgated under Section 3(b) of the Securities Act as transactions by an issuer pursuant to benefit plans and contracts relating to compensation as provided under Rule 701. The recipients of the securities in each of these transactions represented their intentions to acquire the securities for investment only and not with a view to or for sale in connection with any distribution thereof.
Preferred Stock Issuances
In March 2016, we entered into a purchase and exchange agreement pursuant to which we issued an aggregate of 104,851,119 shares of our Series A convertible preferred stock between March 2016 and March 2018. Pursuant to that agreement, we issued 56,341,483 shares of Series A convertible preferred stock at a purchase price of approximately $5.32 per share for an aggregate purchase price of $300.0 million.
From November 2017 through January 2018, Sunnova Energy Corporation sold an aggregate of 10,723,861 shares of its Series B convertible preferred stock to accredited investors at a purchase price of $3.73 per share, for an aggregate purchase price of $40.0 million.
From March 2018 through November 2018, Sunnova Energy Corporation sold an aggregate of 30,344,827 shares of its Series C convertible preferred stock to accredited investors at a purchase price of $5.80 per share, for an aggregate purchase price of $176.0 million.
Exchanges of Preferred Stock
On March 29, 2018, all outstanding shares of Sunnova Energy Corporation’s Series B convertible preferred stock were exchanged for an aggregate 11,112,285 newly issued shares of Sunnova Energy Corporation’s Series A convertible preferred stock.
Conversion of Preferred Stock to Common Stock
Contemporaneously with the completion of our IPO, we issued approximately 60,479,017 shares of our common stock upon conversion of outstanding shares of convertible Series A preferred stock and Series C preferred stock.
Option Grants and Common Stock Issuances
Since January 1, 2017, we have granted to our officers, employees and consultants options to purchase an aggregate of 2,344,947 shares of our common stock under our equity compensation plans at exercise prices ranging from approximately $12.44 to $27.16 per share.
II-3
Table of Contents
Since January 1, 2017, we issued and sold to our officers, employees and consultants an aggregate of 70,678 shares of our common stock upon the exercise of options under our equity compensation plans at an exercise price ranging from approximately $1.85 to $13.58 per share, for aggregate consideration of approximately $0.8 million.
Senior Convertible Notes
On April 24, 2017, Sunnova Energy Corporation issued and sold an aggregate principal amount of $80.0 million of our 12.00% senior secured notes in a private placement to a total of three institutional accredited investors for an aggregate purchase price of $78.4 million. In May 2018 and January 2019, the terms of these senior secured notes were amended to extend the maturity date from October 2018 to January 2019 and from January 2019 to July 2019, respectively. In April 2019, the terms of the remaining $44.9 million aggregate principal amount of these senior secured notes were amended so that, among other things, (i) the interest rate on the notes decreased from 12.00% per annum to 9.50% per annum, (ii) the maturity date was extended from July 2019 to March 2021 and (iii) a conversion feature was added such that the notes will be convertible into common stock, in full, following an initial public offering by us of at least $225.0 million in gross proceeds or, up to 50% of such notes will be convertible into common stock, following an initial public offering by us of less than $225.0 million in gross proceeds; provided that we have converted the full amount of the 2019 subordinated convertible note to equity in connection with this offering. In June 2019, the terms of these senior convertible notes were amended to permit the Subordinated Convertible Notes Issuance.
On July 8, 2019, all of the holders of the senior convertible notes agreed to irrevocably waive their right to convert their respective senior secured notes into common stock in connection with our IPO. All of the senior convertible notes were redeemed with a portion of the net proceeds of our IPO. The aggregate redemption price for all of the senior convertible notes was approximately $56.8 million (which included a premium of $11.4 million) plus a cash payment equal to accrued and unpaid cash interest and pay-in-kind interest to the date of redemption.
On December 23, 2019, we issued and sold an aggregate principal amount of $55.0 million of our 7.75% convertible senior notes due 2027 in a private placement, which mature on January 30, 2027, for an aggregate purchase price of approximately $52.0 million. We also granted the investors of the 7.75% convertible senior notes an option to purchase up to an additional $20.0 million aggregate principal amount of 7.75% convertible senior notes on the same terms and conditions, which expired on March 31, 2020. In June 2020, all of our issued and outstanding 7.75% convertible notes were exchanged for an equal principal amount of our 9.75% convertible senior notes plus accrued and unpaid interest, as described below.
On May 14, 2020, we issued and sold an aggregate principal amount of $130.0 million of our 9.75% convertible senior notes due 2025 in a private placement at an issue price of 95%, for an aggregate purchase price of approximately $123.5 million. We granted the investors of the 9.75% convertible senior notes an option to purchase up to an additional $60.0 million aggregate principal amount of 9.75% convertible senior notes on the same terms and conditions, and the investors exercised this option and completed the purchase of such additional notes on June 12, 2020, for an aggregate purchase price of approximately $57.0 million. We also entered into privately negotiated exchanges on May 14, 2020 with a small number of institutional investors in our 7.75% convertible senior notes due 2027 whereby such investors exchanged all $55.0 million aggregate principal amount outstanding of our 7.75% convertible senior notes for an equal principal amount of our 9.75% convertible senior notes, plus accrued and unpaid interest of approximately $0.2 million and did not receive any cash proceeds from the exchange.
II-4
Table of Contents
Subordinated Convertible Notes
In August 2017, Sunnova Energy Corporation issued a convertible note for $15.0 million to ECP, which is subordinated to Sunnova Energy Corporation’s senior secured notes, with a maturity date of the earlier of (a) the repayment of Sunnova Energy Corporation’s senior secured notes or (b) November 2018. This subordinated convertible note was terminated in October 2017.
In March 2018, Sunnova Energy Corporation issued a convertible note for $15.0 million to ECP, which is subordinated to Sunnova Energy Corporation’s senior convertible notes, with a maturity date of the earlier of (a) the repayment of Sunnova Energy Corporation’s senior convertible notes or (b) May 2019. In January 2019, the terms of this subordinated convertible note were amended to extend the maturity date from May 2019 to December 2019.
In June 2019, Sunnova Energy Corporation issued a subordinated convertible note for $15.0 million to certain of its existing stockholders, including ECP, which is subordinated to Sunnova Energy Corporation’s senior convertible notes and ranks equally with the 2019 subordinated convertible note, with a maturity date of the earlier of (a) the repayment of Sunnova Energy Corporation’s senior convertible notes or (b) December 2021.
Contemporaneously with the completion of our IPO, ECP exercised its right to convert the principal amount of the subordinated convertible note plus any accrued and unpaid interest as of the date of conversion into shares of Series A convertible preferred stock, which in turn converted into approximately 1,422,767 shares of common stock.
II-5
Table of Contents
ITEM 16. EXHIBITS AND FINANCIAL STATEMENT SCHEDULES.
The exhibits filed as part of this Registration Statement are as follows:
(a) Exhibits.
II-6
Table of Contents
II-7
Table of Contents
II-8
Table of Contents
II-9
Table of Contents
| * | To be filed by amendment. |
| + | Indicates management contract or compensatory plan. |
| ¥ | Portions of this exhibit have been omitted. |
| # | Filed herewith. |
II-10
Table of Contents
ITEM 17. UNDERTAKINGS.
The undersigned Registrant hereby undertakes to provide to the underwriters at the closing specified in the underwriting agreement certificates in such denominations and registered in such names as required by the underwriters to permit prompt delivery to each purchaser.
Insofar as indemnification for liabilities arising under the Securities Act may be permitted to directors, officers and controlling persons of the Registrant pursuant to the foregoing provisions, or otherwise, the Registrant has been advised that in the opinion of the SEC such indemnification is against public policy as expressed in the Securities Act and is, therefore, unenforceable. In the event that a claim for indemnification against such liabilities (other than the payment by the Registrant of expenses incurred or paid by a director, officer or controlling person of the Registrant in the successful defense of any action, suit or proceeding) is asserted by such director, officer or controlling person in connection with the securities being registered, the Registrant will, unless in the opinion of its counsel the matter has been settled by controlling precedent, submit to a court of appropriate jurisdiction the question whether such indemnification by it is against public policy as expressed in the Securities Act and will be governed by the final adjudication of such issue.
The undersigned Registrant hereby undertakes that:
(1) For purposes of determining any liability under the Securities Act, the information omitted from the form of prospectus filed as part of this Registration Statement in reliance upon Rule 430A and contained in a form of prospectus filed by the Registrant pursuant to Rule 424(b)(1) or (4) or 497(h) under the Securities Act shall be deemed to be part of this Registration Statement as of the time it was declared effective.
(2) For the purpose of determining any liability under the Securities Act, each post-effective amendment that contains a form of prospectus shall be deemed to be a new registration statement relating to the securities offered therein, and the offering of such securities at that time shall be deemed to be the initial bona fide offering thereof.
(3) The Registrant hereby undertakes that, for purposes of determining any liability under the Securities Act, each filing of the Registrant’s annual report pursuant to section 13(a) or section 15(d) of the Exchange Act (and, where applicable, each filing of an employee benefit plan’s annual report pursuant to section 15(d) of the Exchange Act) that is incorporated by reference in the registration statement shall be deemed to be a new registration statement relating to the securities offered therein, and the offering of such securities at that time shall be deemed to be the initial bona fide offering thereof.
II-11
Table of Contents
Pursuant to the requirements of the Securities Act of 1933, the Registrant has duly caused this Registration Statement on Form S-1 to be signed on its behalf by the undersigned, thereunto duly authorized, in Houston, Texas, on the 29th day of June, 2020.
| SUNNOVA ENERGY INTERNATIONAL INC. | ||
| By: | /s/ William J. Berger | |
| William J. Berger | ||
| Chairman of the Board, President and Chief Executive Officer | ||
II-12
Table of Contents
Each person whose signature appears below appoints William J. Berger, Walter A. Baker and Robert L. Lane, and each of them, any of whom may act without the joinder of the other, as his true and lawful attorneys-in-fact and agents, with full power of substitution and resubstitution, for him and in his name, place and stead, in any and all capacities, to sign any and all amendments (including post-effective amendments) to this Registration Statement and any Registration Statement (including any amendment thereto) for this offering that is to be effective upon filing pursuant to Rule 462(b) under the Securities Act of 1933, as amended, and to file the same, with all exhibits thereto, and all other documents in connection therewith, with the Securities and Exchange Commission, granting unto said attorneys-in-fact and agents, and each of them, full power and authority to do and perform each and every act and thing requisite and necessary to be done in connection therewith, as fully to all intents and purposes as he might or could do in person, hereby ratifying and confirming all that said attorneys-in-fact and agents, or any of them, or their or his substitute and substitutes, may lawfully do or cause to be done by virtue hereof. Pursuant to the requirements of the Securities Act of 1933, as amended, this Registration Statement on Form S-1 has been signed by the following persons in the capacities and on the dates indicated.
| Signature |
Title |
Date | ||
| /s/ William J. Berger William J. Berger |
Chairman of the Board, President and Chief Executive Officer (Principal Executive Officer) | June 29, 2020 | ||
| /s/ Robert L. Lane Robert L. Lane |
Executive Vice President, Chief Financial Officer (Principal Financial and Accounting Officer) | June 29, 2020 | ||
| /s/ Anne Slaughter Andrew Anne Slaughter Andrew |
Director | June 29, 2020 | ||
| /s/ Rahman D’Argenio Rahman D’Argenio |
Director | June 29, 2020 | ||
| /s/ Matthew DeNichilo Matthew DeNichilo |
Director | June 29, 2020 | ||
| /s/ Doug Kimmelman Doug Kimmelman |
Director | June 29, 2020 | ||
| /s/ Mark Longstreth Mark Longstreth |
Director | June 29, 2020 | ||
| /s/ Michael C. Morgan Michael C. Morgan |
Director | June 29, 2020 | ||
| /s/ C. Park Shaper C. Park Shaper |
Director | June 29, 2020 | ||
| /s/ Scott D. Steimer Scott D. Steimer |
Director | June 29, 2020 | ||
II-13