Attached files
| file | filename |
|---|---|
| EX-99.3 - EXHIBIT 99.3 - Golden Nugget Online Gaming, Inc. | tm2023623d3_ex99-3.htm |
| EX-99.1 - EXHIBIT 99.1 - Golden Nugget Online Gaming, Inc. | tm2023623d3_ex99-1.htm |
| 8-K - FORM 8-K - Golden Nugget Online Gaming, Inc. | tm2023623d3_8k.htm |
Exhibit 99.2

INVESTOR PRESENTATION JUNE 29, 2020
Disclaimer 2 This investor presentation (the “presentation”) is for informational purposes only and does not constitute an offer to sell, a s olicitation of an offer to buy, or a recommendation to purchase any equity, debtor other financial instruments of Landcadia H old ings II, Inc. (“Landcadia”) or Golden Nugget Online Gaming, Inc. (“GNOG”) or any of their respective affiliates. The presenta tio n has been prepared to assist parties in making their own evaluation with respect to the proposed transactions (the 'Business Combination”) conte mpl ated by the Purchase Agreement, by and among Landcadia, GNOG and the other parties thereto (the “Purchase Agreement”) and for no other purpose. It is not intended to form the basis of any investment decision or any other decisions with respect of the Bus in ess Combination. No Representation or Warranty No representation or warranty, express or implied, is or will be given by Landcadia or GNOG or any of their respective affili ate s, directors, officers, employees or advisers or any other person as to the accuracy or completeness of the information in th is presentation or any other written, oral or other communications transmitted or otherwise made available to any party in the c our se of its evaluation of the Business Combination, and no responsibility or liability whatsoever is accepted for the accuracy or sufficiency thereof o r f or any errors, omissions or misstatements, negligent or otherwise, relating thereto. This presentation does not purport to co nta in all of the information that may be required to evaluate a possible investment decision with respect to Landcadia, and does no t constitute investment, tax or legal advice. The recipient also acknowledges and agrees that the information contained in this presentati on is preliminary in nature and is subject to change, and any such changes may be material. Landcadia and GNOG disclaim any duty to update the information contained in this presentation. Any and all trademarks and trade names referred to in this presentatio n are the property of their respective owners. Forward - looking statements This presentation contains “forward - looking statements” within the meaning of The Private Securities Litigation Reform Act of 19 95. Forward - looking statements include, without limitation, statements regarding the estimated future financial performance, fin ancial position and financial impacts of the Business Combination, the satisfaction of closing conditions to the Business Com bin ation, the level of redemption by Landcadia's public stockholders and purchase price adjustments in connection with the Business Combination, the timing of the completion of the Business Combination, the anticipated pro forma enterprise value and projected revenue of the combined company following th e Business Combination, anticipated ownership percentages of the combined company's stockholders following the potential transaction, and the business strategy, plans and objectives of management for future operations, including as they re late to the potential Business Combination. Such statements can be identified by the fact that they do not relate strictly to hi storical or current facts. When used in this presentation, words such as “pro forma,” “anticipate,” “believe,” “continue,” “c oul d,” “estimate,” “expect,” “intend,” “may,” “might,” “plan,” “possible,” “potential,” “predict,” “project,” “should,” “strive,” “would” and si mil ar expressions may identify forward - looking statements, but the absence of these words does not mean that a statement is not for ward - looking. When Landcadia discusses its strategies or plans, including as they relate to the Business Combination, it is maki ng projections, forecasts and forward - looking statements. Such statements are based on the beliefs of, as well as assumptions made by and inform ation currently available to, Landcadia's management. These forward - looking statements involve significant risks and uncertainties that could cause the actual results to differ mater ially from the expected results. Most of these factors are outside of Landcadia's and GNOG's control and are difficult to predict. Factors that may cause such differences include, but are not limited to: (1) Landcadia's ability to complete the Business Combination or, if Landcadia does not complete the Business Combination, any other initial business combination; (2) satisfaction or waiver (if applicable ) o f the conditions to the Business Combination, including with respect to the approval of the stockholders of Landcadia; (3) th e a bility to maintain the listing of the combined company's securities on Nasdaq or another exchange; (4) the risk that the Busi nes s Combination disrupts current plans and operations of Landcadia or GNOG as a result of the announcement and consummation of the transaction describ ed herein; (5) the impact of COVID - 19 on GNOG’s business and operations and/or the ability of the parties to complete the Business Combination; (6) the ability to recognize the anticipated benefits of the Business Combination, which may be affected by, amo ng other things, competition, the ability of the combined company to grow and manage growth profitably, maintain relationships with cu sto mers and suppliers and retain its management and key employees; (7) costs related to the Business Combination; (8) changes in ap plicable laws or regulations and delays in obtaining, adverse conditions contained in, or the inability to obtain necessary r egu latory approvals required to complete the Business Combination, including but not limited to, applicable gaming laws and regulations; (9) the pos sibility that GNOG and Landcadia may be adversely affected by other economic, business, and/or competitive factors; (10) the out come of any legal proceedings that may be instituted against Landcadia, GNOG or any of their respective directors or officers fo llowing the announcement of the Business Combination; (11) the failure to realize anticipated pro forma results and underlying assumption s, including with respect to estimated stockholder redemptions and purchase price and other adjustments; and (12) other risks an d u ncertainties indicated from time to time in the preliminary proxy statement of Landcadia related to the Business Combination, in cluding those under “Risk Factors” therein, and other documents filed or to be filed with the Securities and Exchange Commission (“SEC”) by La ndcadia. You are cautioned not to place undue reliance upon any forward - looking statements. Forward - looking statements included in this p resentation speak only as of the date of this presentation. Neither Landcadia nor GNOG undertakes any obligation to update it s f orward - looking statements to reflect events or circumstances after the date hereof. Additional risks and uncertainties are ident ified and discussed in Landcadia's reports filed with the SEC. No Offer or Solicitation T his presentation shall not constitute a solicitation of a proxy, consent or authorization with respect to any securities or i n r espect of the Business Combination. This presentation shall also not constitute an offer to sell or the solicitation of an of fer to buy any securities pursuant to the Business Combination or otherwise, nor shall there be any sale of securities in any jur is diction in which the offer, solicitation or sale would be unlawful prior to the registration or qualification under the securities laws of any such juris dic tion. Use of Projections This presentation contains financial forecasts. Neither Landcadia's nor GNOG's independent auditors have studied, reviewed, compiled or performed any procedures with respect to the projections fo r the purpose of their inclusion in this presentation, and accordingly, neither of them has expressed an opinion or provided any other form of assurance with respect thereto for the purpose of this presentation. These projections are for illustrative purposes only and should not be relied upon as being necessarily indicat ive of future results. In this presentation, certain of the above - mentioned projected information has been provided for purposes of providing comparisons with historical data. The assumptions and estimates underlying the prospective financial information ar e inherently uncertain and are subject to a wide variety of significant business, economic and competitive risks and uncertainties that could cause act ual results to differ materially from those contained in the prospective financial information. Projections are inherently un cer tain due to a number of factors outside of Landcadia's or GNOG's control. Accordingly, there can be no assurance that the prospective results are indicative of future performance of Landcadia, GNOG or the combined company after the Business Combination or that actual res ult s will not differ materially from those presented in the prospective financial information. Inclusion of the prospective fina nci al information in this presentation should not be regarded as a representation by any person that the results contained in th e p rospective financial information will be achieved. Industry and Market Data In this presentation, we rely on and refer to information and statistics regarding market participants in the sectors in whic h G NOG competes and other industry data. We obtained this information and statistics from third - party sources, including reports by market research firms and company filings. Being in receipt of the presentation you agree you may be restricted from dealing in (or encouraging others to deal in) price sensitive securities. Non - GAAP Financial Matters This presentation includes certain non - GAAP financial measures, including EBITDA, Adjusted EBITDA and Adjusted EBITDA Margin. EB TIDA is defined as net income plus tax expense, interest expense and depreciation and amortization. Adjusted EBITDA is define d a s EBITDA, less brand royalties . These financial measures are not prepared in accordance with accounting principles generally accepted in the United States (“GAAP”) and may be different from non - GAAP financial measures used by other companies. Landcadia and GNOG believe that the use of these non - GAAP financial measures provides an additional tool for investors to use in evaluating ongoing operat ing results and trends. These non - GAAP measures with comparable names should not be considered in isolation from, or as an alter native to, financial measures determined in accordance with GAAP. See the footnotes on the slides where these measures are discussed and “R econciliation of Non - GAAP Measures” on slide 51 of the Appendix for a description of these non - GAAP financial measures and recon ciliations of such non - GAAP financial measures to the most comparable GAAP amounts. Additionally, to the extent that forward - loo king non - GAAP financial measures are provided, they are presented on a non - GAAP basis without reconciliations of such forward - looking non - GAAP measures due to the inherent difficulty in forecasting and quantifying certain amounts that are necessary for such recon ci liation. Additional Information Landcadia intends to file with the SEC a preliminary proxy statement in connection with the Business Combination and, when av ail able, will mail a definitive proxy statement and other relevant documents to its stockholders. The definitive proxy statement wi ll contain important information about the Business Combination and the other matters to be voted upon at a meeting of stockh old ers to be held to approve the Business Combination and other matters (the “Special Meeting”) and is not intended to provide the basis for an y i nvestment decision or any other decision In respect of such matters. Landcadia’s stockholders and other interested persons are advised to read, when available, the preliminary proxy statement, the amendment s thereto, and the definitive proxy statement in connection with Landcadia's solicitation of proxies for the Special Meeting because the proxy statement will contain important information about the Busi ne ss Combination. When available, the definitive proxy statement will be mailed to Landcadia stockholders as of a record date t o b e established for voting on the Business Combination and the other matters to be voted upon at the Special Meeting. Landcadia’s stockholders will also be able to obtain copies of the proxy statement, without charge once available, at the SEC's website at www.sec.gov or by directing a request to Landcadia’s secretary at 1510 West Loop South Houston, Texas 77027. Participants in the Solicitation Landcadia and its directors and officers may be deemed participants in the solicitation of proxies of Landcadia stockholders in connection with the Business Combination. Landcadia’s stockholders and other interested persons may obtain, without charge, more detailed information regarding the directors and o ff icers of Landcadia in Landcadia's Annual Report on Form 10 - K for the fiscal year ended December 31, 2019, which was filed with the SEC on March 27, 2020 and is available at the SEC’s website at www.sec.gov or by directing a request to Landcadia’s secretary at the address above. Information regarding the persons who may, under SEC rules, be deemed participants in the sol ic itation of proxies to Landcadia stockholders in connection with the Business Combination and other matters to be voted upon at the Special Meeting will be set forth in the proxy statement for the Business Combination when available. Ad dit ional information regarding the interests of participants in the solicitation of proxies in connection with the Business Comb ina tion will be included in the proxy statement that the Landcadia intends to file with the SEC.
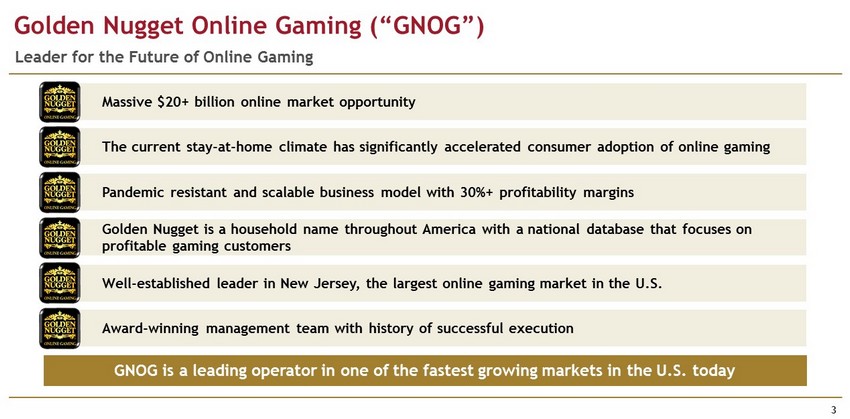
Golden Nugget Online Gaming (“GNOG”) 3 GNOG is a leading operator in one of the fastest growing markets in the U.S. today Award - winning management team with history of successful execution Well - established leader in New Jersey, the largest online gaming market in the U.S. Golden Nugget is a household name throughout America with a national database that focuses on profitable gaming customers Pandemic resistant and scalable business model with 30%+ profitability margins The current stay - at - home climate has significantly accelerated consumer adoption of online gaming Massive $20+ billion online market opportunity Leader for the Future of Online Gaming
4 AGENDA GNOG Company Summary How We Differentiate Ourselves Proposed Transaction Financial Overview and Growth Plan Introduction Market Overview Appendix
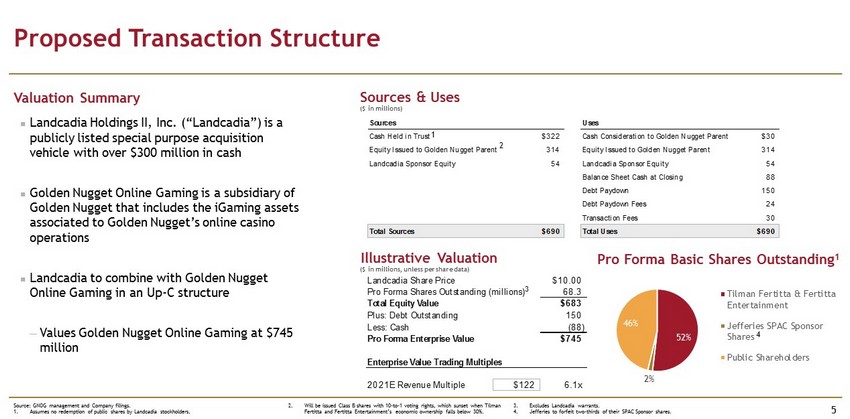
52% 2% 46% Tilman Fertitta & Fertitta Entertainment Jefferies SPAC Sponsor Shares Public Shareholders Landcadia Share Price $10.00 Pro Forma Shares Outstanding (millions) 68.3 Total Equity Value $683 Plus: Debt Outstanding 150 Less: Cash (88) Pro Forma Enterprise Value $745 Enterprise Value Trading Multiples 2021E Revenue Multiple $122 6.1x Sources Uses Cash Held in Trust $322 Cash Consideration to Golden Nugget Parent $30 Equity Issued to Golden Nugget Parent 314 Equity Issued to Golden Nugget Parent 314 Landcadia Sponsor Equity 54 Landcadia Sponsor Equity 54 Balance Sheet Cash at Closing 88 Debt Paydown 150 Debt Paydown Fees 24 Transaction Fees 30 Total Sources $690 Total Uses $690 Proposed Transaction Structure 5 Valuation Summary Sources & Uses Pro Forma Basic Shares Outstanding 1 Illustrative Valuation Landcadia Holdings II, Inc. (“ Landcadia ”) is a publicly listed special purpose acquisition vehicle with over $300 million in cash Golden Nugget Online Gaming is a subsidiary of Golden Nugget that includes the iGaming assets associated to Golden Nugget’s online casino operations Landcadia to combine with Golden Nugget Online Gaming in an Up - C structure ─ Values Golden Nugget Online Gaming at $745 million Source: GNOG management and Company filings. 1. Assumes no redemption of public shares by Landcadia stockholders. ($ in millions) ($ in millions, unless per share data) 3 2. Will be issued Class B shares with 10 - to - 1 voting rights, which sunset when Tilman Fertitta and Fertitta Entertainment’s economic ownership falls below 30%. 4 1 2 3. Excludes Landcadia warrants. 4. Jefferies to forfeit two - thirds of their SPAC Sponsor shares .
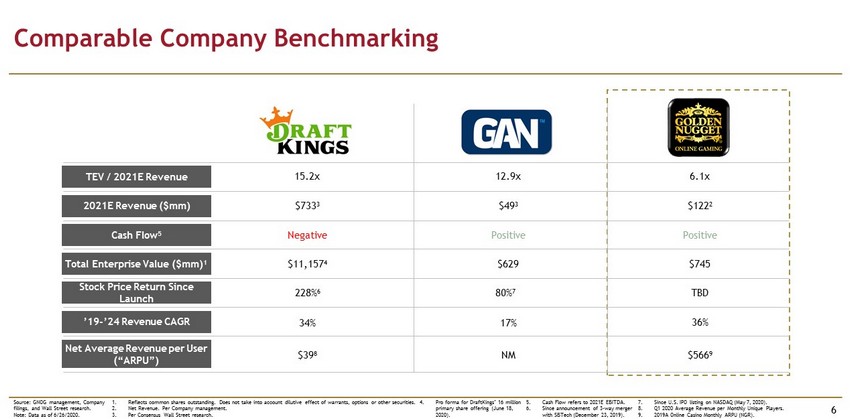
Comparable Company Benchmarking 6 Source: GNOG management, Company filings, and Wall Street research. Note: Data as of 6/26/2020. 2021E Revenue ($mm) Cash Flow 5 Stock Price Return Since Launch Total Enterprise Value ($mm) 1 TEV / 2021E Revenue $733 3 ’19 - ’24 Revenue CAGR Net Average Revenue per User (“ARPU”) $122 2 Negative Positive $11,157 4 $745 $49 3 Positive $629 34% 36% 17% 1. Reflects common shares outstanding. Does not take into account dilutive effect of warrants, options or other securities. 2. Net Revenue. Per Company management. 3. Per Consensus Wall Street research. TBD 228% 6 80% 7 $39 8 $566 9 NM 15.2x 6.1x 12.9x 5. Cash Flow refers to 2021E EBITDA. 6. Since announcement of 3 - way merger with SBTech (December 23, 2019). 7. Since U.S. IPO listing on NASDAQ (May 7, 2020). 8. Q1 2020 Average Revenue per Monthly Unique Players. 9. 2019A Online Casino Monthly ARPU (NGR). 4. Pro forma for DraftKings’ 16 million primary share offering (June 18, 2020).
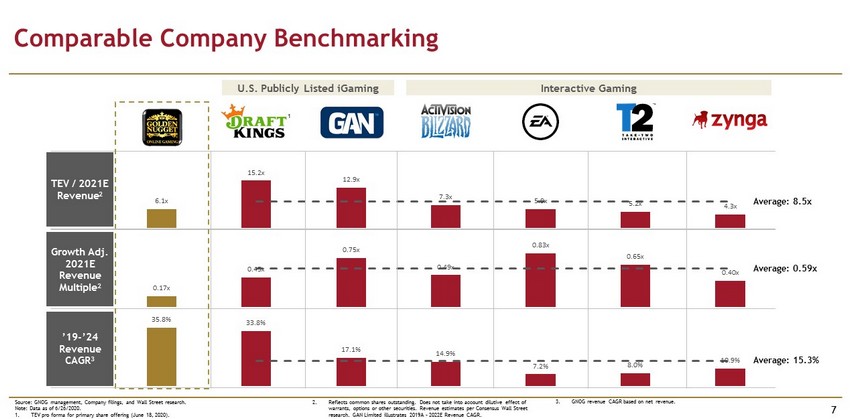
0.17x 0.45x 0.75x 0.49x 0.83x 0.65x 0.40x 35.8% 33.8% 17.1% 14.9% 7.2% 8.0% 10.9% 6.1x 15.2x 12.9x 7.3x 5.9x 5.2x 4.3x Comparable Company Benchmarking 7 Source: GNOG management, Company filings, and Wall Street research. Note: Data as of 6/26/2020. 1. TEV pro forma for primary share offering (June 18, 2020). TEV / 2021E Revenue 2 Growth Adj. 2021E Revenue Multiple 2 U.S. Publicly Listed iGaming Interactive Gaming 1 Average: 8.5x Average: 15.3% 2. Reflects common shares outstanding. Does not take into account dilutive effect of warrants, options or other securities. Revenue estimates per Consensus Wall Street research. GAN Limited illustrates 2019A – 2022E Revenue CAGR. 3. GNOG revenue CAGR based on net revenue. ’19 - ’24 Revenue CAGR 3 Average: 0.59x
8 AGENDA GNOG Company Summary How We Differentiate Ourselves Proposed Transaction Financial Overview and Growth Plan Introduction Market Overview Appendix
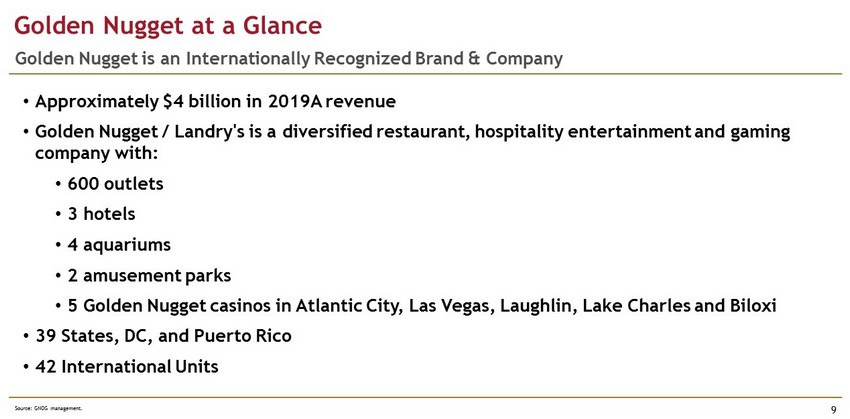
Golden Nugget at a Glance 9 Golden Nugget is an Internationally Recognized Brand & Company • Approximately $4 billion in 2019A revenue • Golden Nugget / Landry's is a diversified restaurant, hospitality entertainment and gaming company with: • 600 outlets • 3 hotels • 4 aquariums • 2 amusement parks • 5 Golden Nugget casinos in Atlantic City, Las Vegas, Laughlin, Lake Charles and Biloxi • 39 States, DC, and Puerto Rico • 42 International Units Source: GNOG management.
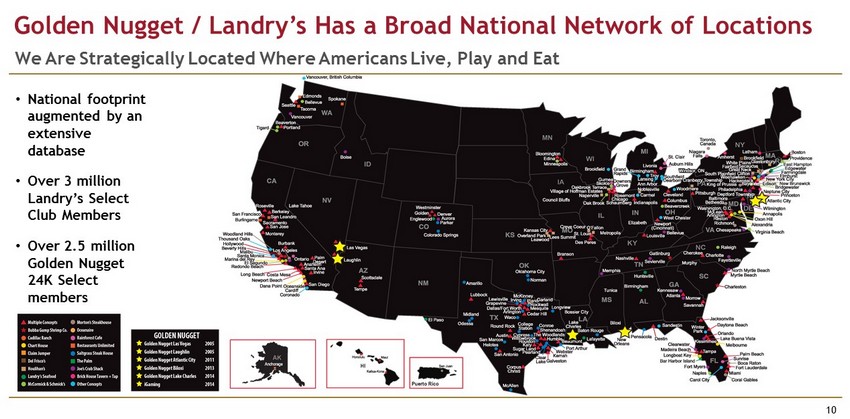
Golden Nugget / Landry’s Has a Broad National Network of Locations 10 We Are Strategically Located Where Americans Live, Play and Eat • National footprint augmented by an extensive database • Over 3 million Landry’s Select Club Members • Over 2.5 million Golden Nugget 24K Select members
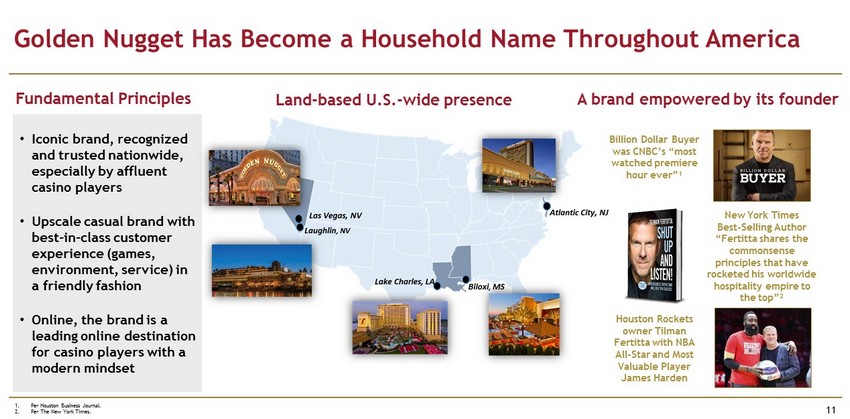
Golden Nugget Has Become a Household Name Throughout America 11 Houston Rockets owner Tilman Fertitta with NBA All - Star and Most Valuable Player James Harden New York Times Best - Selling Author “Fertitta shares the commonsense principles that have rocketed his worldwide hospitality empire to the top” 2 Billion Dollar Buyer was CNBC’s “most watched premiere hour ever” 1 Land - based U.S. - wide presence A brand empowered by its founder • Iconic brand, recognized and trusted nationwide, especially by affluent casino players • Upscale casual brand with b est - in - class customer experience (games, environment, service) in a friendly fashion • Online, the brand is a leading online destination for casino players with a modern mindset Fundamental Principles 1. Per Houston Business Journal. 2. Per The New York Times.
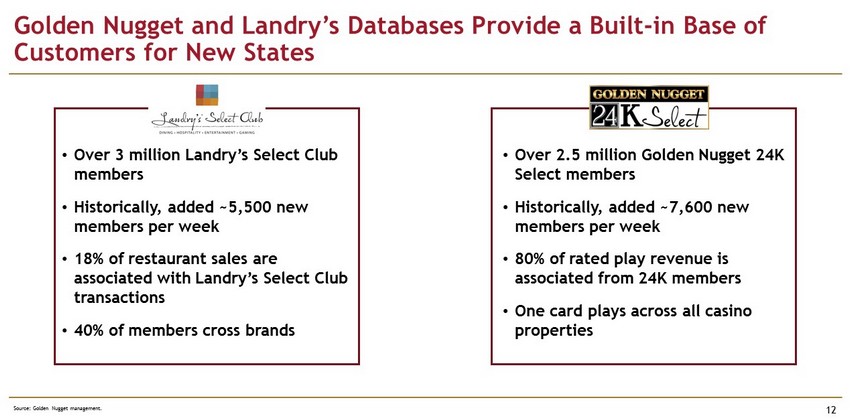
• Over 3 million Landry’s Select Club members • Historically, added ~5,500 new members per week • 18% of restaurant sales are associated with Landry’s Select Club transactions • 40% of members cross brands Golden Nugget and Landry’s Databases Provide a Built - in Base of Customers for New States 12 Source: Golden Nugget management. • Over 2.5 million Golden Nugget 24K Select members • Historically, added ~7,600 new members per week • 80% of rated play revenue is associated from 24K members • One card plays across all casino properties
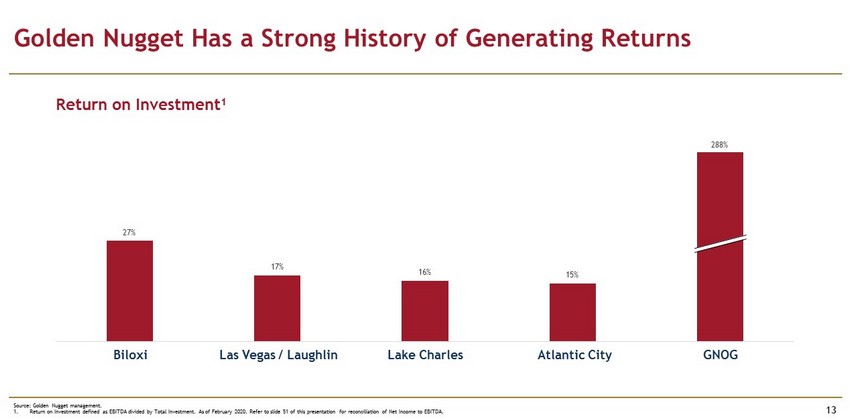
27% 17% 16% 15% Biloxi Las Vegas / Laughlin Lake Charles Atlantic City GNOG Source: Golden Nugget management. 1. Return on Investment defined as EBITDA divided by Total Investment. As of February 2020. Refer to slide 51 of this presentati on for reconciliation of Net Income to EBITDA. Golden Nugget Has a Strong History of Generating Returns 13 Return on Investment 1 Biloxi Las Vegas / Laughlin Lake Charles Atlantic City GNOG 288%

Seasoned Management Team of Industry Experts 14 Warren Steven VP, Product & Operations Thomas Winter President Tilman Fertitta Chairman & Chief Executive Officer • Mr. Fertitta has been the sole shareholder, chairman and Chief Executive Officer of Fertitta Entertainment, Inc., which owns the NBA Houston Rockets, the restaurant conglomerate Landry’s and the Golden Nugget Casinos • Recognized today as a global leader in the dining, hospitality, entertainment and gaming industries • Mr. Fertitta currently serves as Chairman of the Houston Children’s Charity, the Houston Police Foundation, and is currently the Chairman of the Board of Regents for the University of Houston • Joined Golden Nugget Online Gaming at inception • Previously served as CEO of Betclic, a major European online sports betting and gaming operator, which he grew organically 10 - fold to $200m in revenue over 3 years. Responsible for Expekt.com, which he merged with Betclic.com • Currently a board observer for Superbet, one of the largest operators in Central and Eastern Europe • Prior to joining Betclic, spent 9 years in the Telco and Sports Media industries • MBA from ESSEC business school, Paris (France) • 15 - year veteran of online gaming and currently going on 6 years with GNOG • Previously spent 5 years with Betclic Everest Group, eventually overseeing the P&L of online gaming for the group focused on Casino, Games, Poker and Bingo products for the Betclic, Expekt and Everest brands, including developing and operating the online version of the world famous Casino de Monte - Carlo brand for Société des Bains de Mer • Prior to GNOG, Mr. Steven was Commercial Manager of Casino and Games at Paddy Power Michael Harwell Chief Financial Officer • Previously served 8 years as Chief Accounting Officer for a publicly traded energy company and served 7 years as Vice President and Corporate Controller for Landry’s • Prior to this, Mr. Harwell served as Vice President and Corporate Controller for NetVersant Solutions, Inc., and was Corporate Controller for publicly traded Nabors Industries, Ltd • BBA in accounting from Texas A&M University, Certified Public Accountant who began his career with Ernst & Young LLP
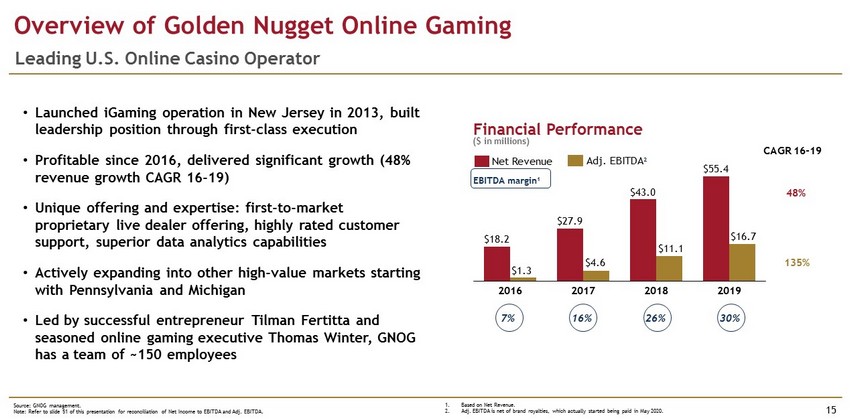
Source: GNOG management. Note: Refer to slide 51 of this presentation for reconciliation of Net Income to EBITDA and Adj. EBITDA. Overview of Golden Nugget Online Gaming 15 Leading U.S. Online Casino Operator • Launched iGaming operation in New Jersey in 2013, built leadership position through first - class execution • Profitable since 2016, delivered significant growth (48% revenue growth CAGR 16 - 19) • Unique offering and expertise: first - to - market proprietary live dealer offering, highly rated customer support, superior data analytics capabilities • Actively expanding into other high - value markets starting with Pennsylvania and Michigan • Led by successful entrepreneur Tilman Fertitta and seasoned online gaming executive Thomas Winter, GNOG has a team of ~150 employees Financial Performance $27.9 2018 2019 2017 $4.6 2016 $18.2 $1.3 $43.0 $11.1 $55.4 $16.7 Net Revenue Adj. EBITDA 2 CAGR 16 - 19 48% 135% 7% 16% 26% 30% EBITDA margin 1 ($ in millions) 1. Based on Net Revenue. 2. Adj. EBITDA is net of brand royalties, which actually started being paid in May 2020.
Over 15 Awards in the Last 5 Years 16
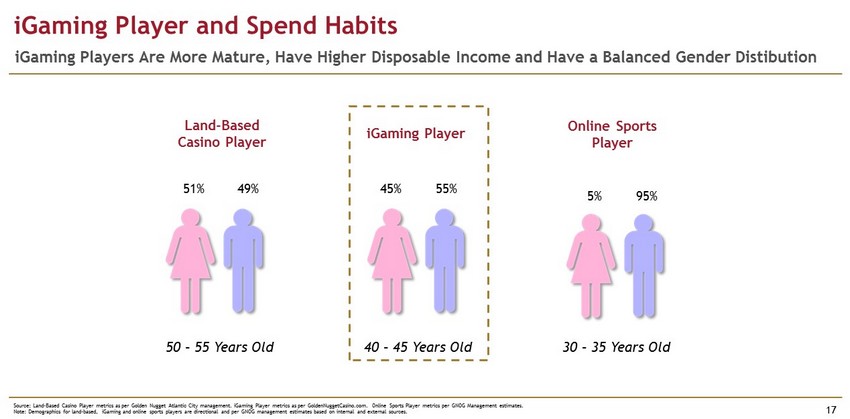
Source: Land - Based Casino Player metrics as per Golden Nugget Atlantic City management. iGaming Player metrics as per GoldenNugg etCasino.com. Online Sports Player metrics per GNOG Management estimates. Note: Demographics for land - based, iGaming and online sports players are directional and per GNOG management estimates based on internal and external sources. iGaming Player and Spend Habits 17 iGaming Players Are More Mature, Have Higher Disposable Income and Have a Balanced Gender Distibution iGaming Player Land - Based Casino Player Online Sports Player 45% 55% 40 – 45 Years Old 51% 49% 50 – 55 Years Old 5% 95% 30 – 35 Years Old
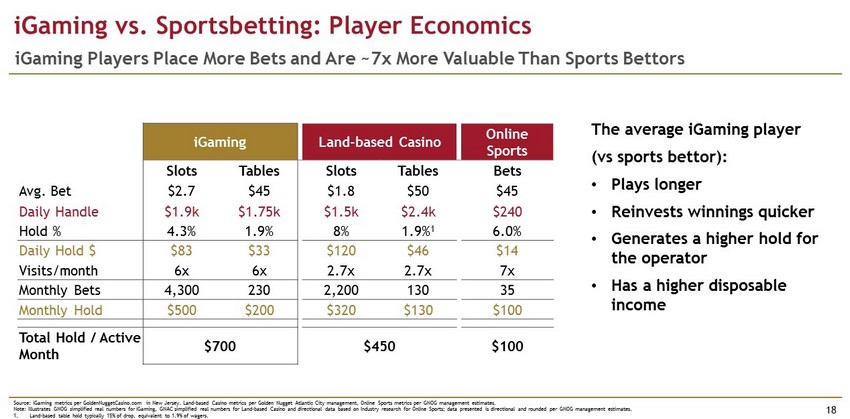
iGaming vs. Sportsbetting: Player Economics 18 iGaming Players Place More Bets and Are ~7x More Valuable Than Sports Bettors iGaming Land - based Casino Online Sports Slots Tables Slots Tables Bets Avg. Bet $2.7 $45 $1.8 $50 $45 Daily Handle $1.9k $1.75k $1.5k $2.4k $240 Hold % 4.3% 1.9% 8% 1.9% 1 6.0% Daily Hold $ $83 $33 $120 $46 $14 Visits/month 6x 6x 2.7x 2.7x 7x Monthly Bets 4,300 230 2,200 130 35 Monthly Hold $500 $200 $320 $130 $100 Total Hold / Active Month $700 $450 $100 The average iGaming player (vs sports bettor): • Plays longer • Reinvests winnings quicker • Generates a higher hold for the operator • Has a higher disposable income Source: iGaming metrics per GoldenNuggetCasino.com in New Jersey. Land - based Casino metrics per Golden Nugget Atlantic City management, Online Sports metric s per GNOG management estimates . Note: Illustrates GNOG simplified real numbers for iGaming, GNAC simplified real numbers for Land - based Casino and directional d ata based on Industry research for Online Sports; data presented is directional and rounded per GNOG management estimates. 1. Land - based table hold typically 15% of drop, equivalent to 1.9% of wagers.
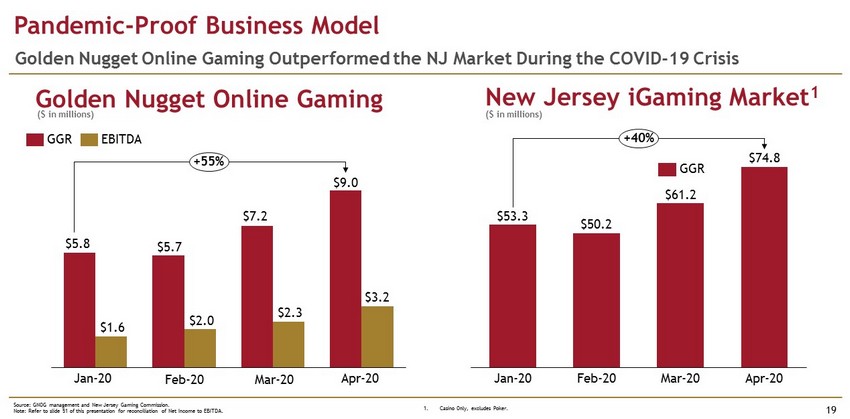
Source: GNOG management and New Jersey Gaming Commission. Note: Refer to slide 51 of this presentation for reconciliation of Net Income to EBITDA. Pandemic - Proof Business Model 19 Golden Nugget Online Gaming Outperformed the NJ Market During the COVID - 19 Crisis Golden Nugget Online Gaming New Jersey iGaming Market 1 Apr - 20 Jan - 20 Feb - 20 Mar - 20 $53.3 $50.2 $61.2 $74.8 +40% GGR $9.0 Jan - 20 Feb - 20 Mar - 20 Apr - 20 $2.0 $5.8 $1.6 $5.7 $7.2 $2.3 $3.2 +55% GGR EBITDA ($ in millions) ($ in millions) 1. Casino Only, excludes Poker.
20 AGENDA GNOG Company Summary How We Differentiate Ourselves Proposed Transaction Financial Overview and Growth Plan Introduction Market Overview Appendix
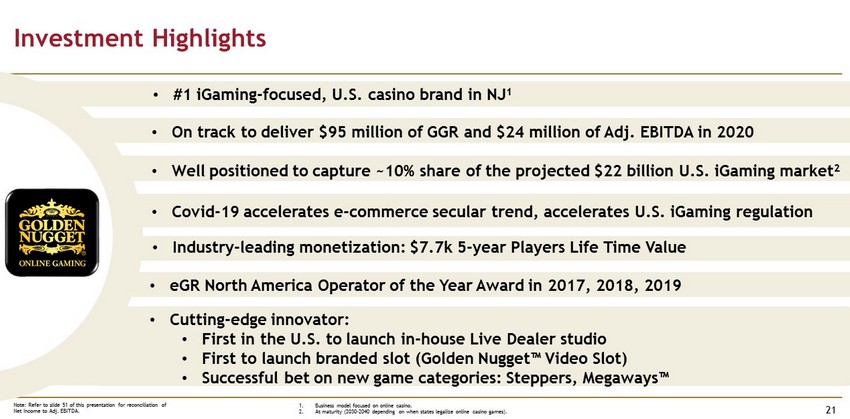
1. Business model focused on online casino. 2. At maturity (2030 - 2040 depending on when states legalize online casino games). Investment Highlights 21 • Cutting - edge innovator: • First in the U.S. to launch in - house Live Dealer studio • First to launch branded slot (Golden Nugget ™ Video Slot) • Successful bet on new game categories: Steppers, Megaways ™ • Industry - leading monetization: $7.7k 5 - year Players Life Time Value • Well positioned to capture ~10% share of the projected $22 billion U.S. iGaming market 2 • On track to deliver $95 million of GGR and $24 million of Adj. EBITDA in 2020 • Covid - 19 accelerates e - commerce secular trend, accelerates U.S. iGaming regulation • eGR North America Operator of the Year Award in 2017, 2018, 2019 • #1 iGaming - focused, U.S. casino brand in NJ 1 Note: Refer to slide 51 of this presentation for reconciliation of Net Income to Adj. EBITDA.
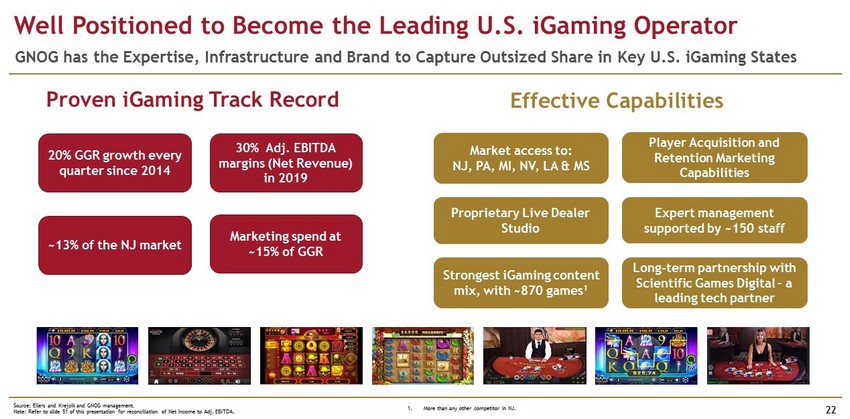
Source: Eilers and Krejcik and GNOG management. Note: Refer to slide 51 of this presentation for reconciliation of Net Income to Adj. EBITDA. Well Positioned to Become the Leading U.S. iGaming Operator 22 GNOG has the Expertise, Infrastructure and Brand to Capture Outsized Share in Key U.S. iGaming States Proven iGaming Track Record Effective Capabilities 20% GGR growth every quarter since 2014 30% Adj. EBITDA margins (Net Revenue) in 2019 ~13% of the NJ market Marketing spend at ~15% of GGR Proprietary Live Dealer Studio Player Acquisition and Retention Marketing Capabilities Market access to: NJ, PA, MI, NV, LA & MS Long - term partnership with Scientific Games Digital – a leading tech partner Expert management supported by ~150 staff Strongest iGaming content mix, with ~870 games 1 1. More than any other competitor in NJ.

Source: GNOG management. 1. Post - COVID landing, people back to work. Milestones of Golden Nugget Online Gaming 23 ~50% Revenue CAGR Since 2014 Q4 $11 $8 Q1 Q2 Q4 $9 Q3 Q3 Q1 $15 $5 Q2 Q2 $6 Q3 Q4 Q1 $6 Q1 Q2 Q4 Q3 Q4 $15 Q1 $8 Q2 $8 Q4 F Q3 Q4 Q4 Q2 Q3 Q1 $2 Q2 F Q3 F $1 $3 $27 Q1 $4 $4 $4 $4 $5 $11 $3 $13 $14 $17 $19 $26 1 $24 1 $13 Actual GGR Forecast GGR 2014 2013 2015 2016 2017 2018 2019 2020 • Live in NJ in Q4 • $1 million of GGR per month • Profitable • First to offer Live Dealer in the U.S. • Reached $3 million of GGR per month • First to launch Live Casino Floor Roulette in the U.S. • Launches NJ Online sportsbook • $6 million GGR per month • Explosive growth during COVID - 19 outbreak • Mobile iOS and Android application ($ in millions)

Huge U.S. iGaming Opportunity for Golden Nugget Online Gaming 24 NJ, PA and MI Only the Start of U.S. iGaming Roll - Out NJ Today Immediate Opportunities Future Opportunities ~13% of a ~$800 million iGaming market ~10% of a ~$22 billion iGaming market at maturity W A O R M T I D U T W Y C O O K K S N B S D N D M N I A M O T N N C I L O H I N K Y W V PA MI ~12% of a ~$2.5 billion iGaming market NJ Source: Company reports and GNOG management estimates.
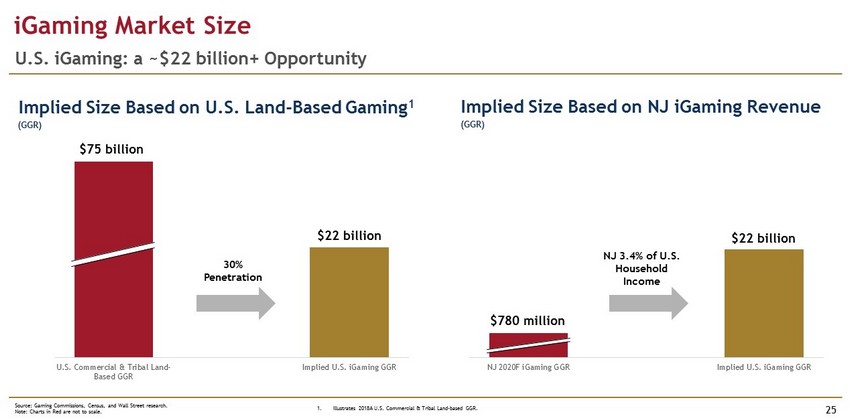
NJ 2020F iGaming GGR Implied U.S. iGaming GGR U.S. Commercial & Tribal Land- Based GGR Implied U.S. iGaming GGR iGaming Market Size 25 U.S. iGaming: a ~$22 billion+ Opportunity Source: Gaming Commissions, Census, and Wall Street research. Note: Charts in Red are not to scale. NJ 3.4% of U.S. Household Income $780 million $22 billion 30% Penetration $75 billion $22 billion Implied Size Based on U.S. Land - Based Gaming 1 (GGR) (GGR) Implied Size Based on NJ iGaming Revenue 1. Illustrates 2018A U.S. Commercial & Tribal Land - based GGR.
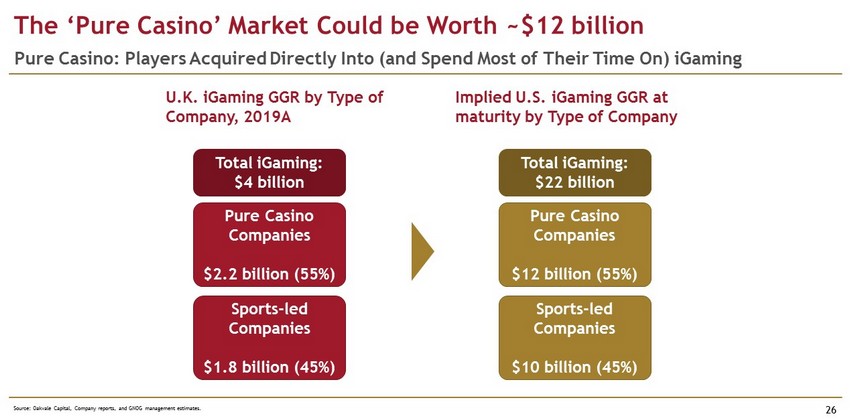
The ‘Pure Casino’ Market Could be Worth ~$12 billion 26 Pure Casino: Players Acquired Directly Into (and Spend Most of Their Time On) iGaming U.K. iGaming GGR by Type of Company, 2019A Source: Oakvale Capital, Company reports, and GNOG management estimates. Pure Casino Companies $2.2 billion (55%) Sports - led Companies $1.8 billion (45%) Implied U.S. iGaming GGR at maturity by Type of Company Pure Casino Companies $12 billion (55%) Sports - led Companies $10 billion (45%) Total iGaming: $4 billion Total iGaming: $22 billion
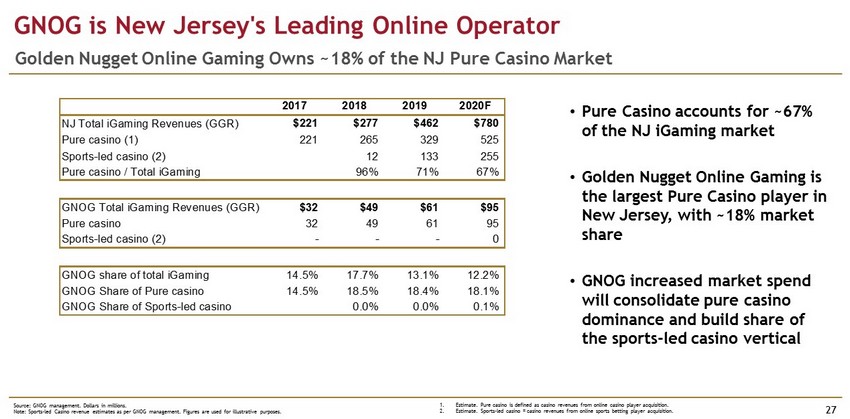
1. Estimate. Pure casino is defined as casino revenues from online casino player acquisition. 2. Estimate. Sports - led casino = casino revenues from online sports betting player acquisition. GNOG is New Jersey's Leading Online Operator 27 Golden Nugget Online Gaming Owns ~18% of the NJ Pure Casino Market • Pure Casino accounts for ~67% of the NJ iGaming market • Golden Nugget Online Gaming is the largest Pure Casino player in New Jersey, with ~18% market share • GNOG increased market spend will consolidate pure casino dominance and build share of the sports - led casino vertical Source: GNOG management. Dollars in millions. Note: Sports - led Casino revenue estimates as per GNOG management. Figures are used for illustrative purposes. 2017 2018 2019 2020F NJ Total iGaming Revenues (GGR) $221 $277 $462 $780 Pure casino (1) 221 265 329 525 Sports-led casino (2) 12 133 255 Pure casino / Total iGaming 96% 71% 67% GNOG Total iGaming Revenues (GGR) $32 $49 $61 $95 Pure casino 32 49 61 95 Sports-led casino (2) - - - 0 GNOG share of total iGaming 14.5% 17.7% 13.1% 12.2% GNOG Share of Pure casino 14.5% 18.5% 18.4% 18.1% GNOG Share of Sports-led casino 0.0% 0.0% 0.1%
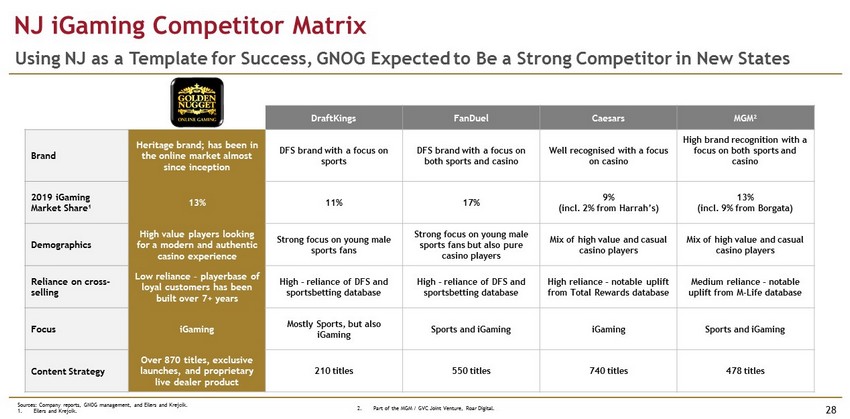
NJ iGaming Competitor Matrix 28 Using NJ as a Template for Success, GNOG Expected to Be a Strong Competitor in New States DraftKings FanDuel Caesars MGM 2 Brand Heritage brand; has been in the online market almost since inception DFS brand with a focus on sports DFS brand with a focus on both sports and casino Well recognised with a focus on casino High brand recognition with a focus on both sports and casino 2019 iGaming Market Share 1 13% 11% 17% 9% (incl. 2% from Harrah’s) 13% (incl. 9% from Borgata ) Demographics High value players looking for a modern and authentic casino experience Strong focus on young male sports fans Strong focus on young male sports fans but also pure casino players Mix of high value and casual casino players Mix of high value and casual casino players Reliance on cross - selling Low reliance – playerbase of loyal customers has been built over 7+ years High – reliance of DFS and sportsbetting database High – reliance of DFS and sportsbetting database High reliance – notable uplift from Total Rewards database Medium reliance – notable uplift from M - Life database Focus iGaming Mostly Sports, but also iGaming Sports and iGaming iGaming Sports and iGaming Content Strategy Over 870 titles, exclusive launches, and proprietary live dealer product 210 titles 550 titles 740 titles 478 titles Sources: Company reports, GNOG management, and Eilers and Krejcik. 1. Eilers and Krejcik. 2. Part of the MGM / GVC Joint Venture, Roar Digital.
29 AGENDA GNOG Company Summary How We Differentiate Ourselves Proposed Transaction Financial Overview and Growth Plan Introduction Market Overview Appendix
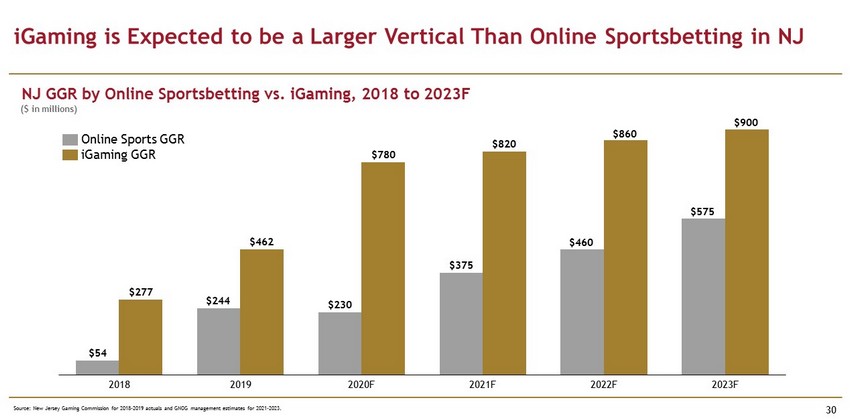
iGaming is Expected to be a Larger Vertical Than Online Sportsbetting in NJ 30 2021F $460 $860 $820 2018 2019 2020F 2022F 2023F $54 $277 $375 $244 $462 $230 $780 $575 $900 Online Sports GGR iGaming GGR NJ GGR by Online Sportsbetting vs. iGaming, 2018 to 2023F Source: New Jersey Gaming Commission for 2018 - 2019 actuals and GNOG management estimates for 2021 - 2023. ($ in millions)
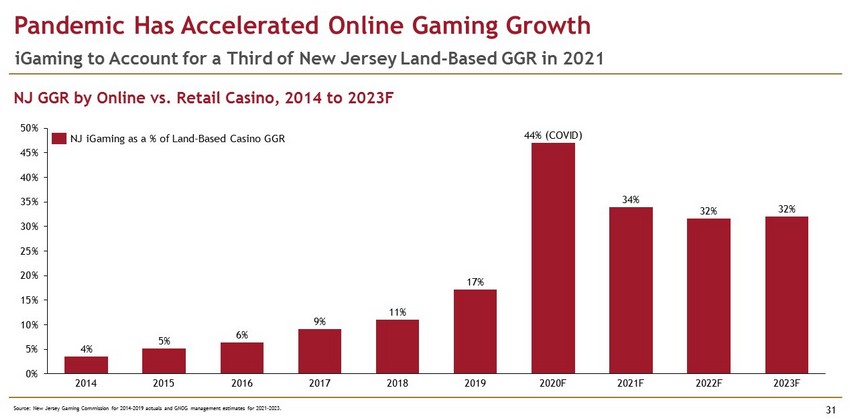
Source: New Jersey Gaming Commission for 2014 - 2019 actuals and GNOG management estimates for 2021 - 2023. Pandemic Has Accelerated Online Gaming Growth 31 4% 5% 6% 9% 11% 17% 34% 32% 32% 0% 5% 10% 15% 20% 25% 30% 35% 40% 45% 50% 2020F 2016 2022F 2014 2018 2015 2017 2019 2021F 2023F 44% (COVID) NJ GGR by Online vs. Retail Casino, 2014 to 2023F NJ iGaming as a % of Land - Based Casino GGR iGaming to Account for a Third of New Jersey Land - Based GGR in 2021
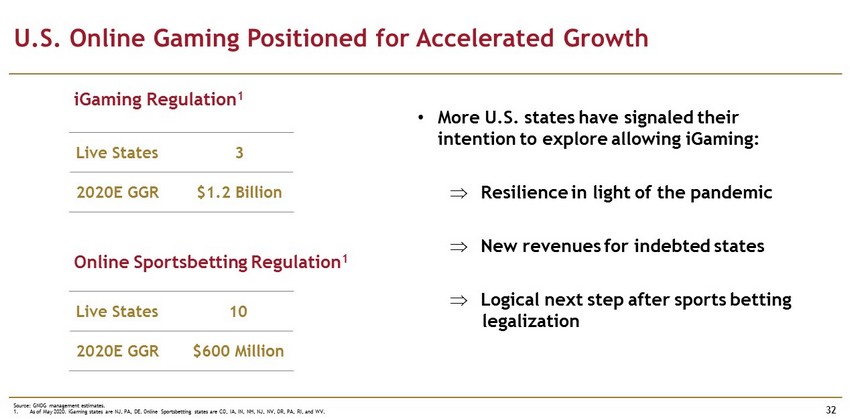
Source: GNOG management estimates. 1. As of May 2020. iGaming states are NJ, PA, DE. Online Sportsbetting states are CO, IA, IN, NH, NJ, NV, OR, PA, RI, and WV. U.S. Online Gaming Positioned for Accelerated Growth 32 Live States 3 2020E GGR $1.2 Billion iGaming Regulation 1 Online Sportsbetting Regulation 1 • More U.S. states have signaled their intention to explore allowing iGaming: Resilience in light of the pandemic New revenues for indebted states Logical next step after sports betting legalization Live States 10 2020E GGR $600 Million

33 AGENDA GNOG Company Summary How We Differentiate Ourselves Proposed Transaction Financial Overview and Growth Plan Introduction Market Overview Appendix
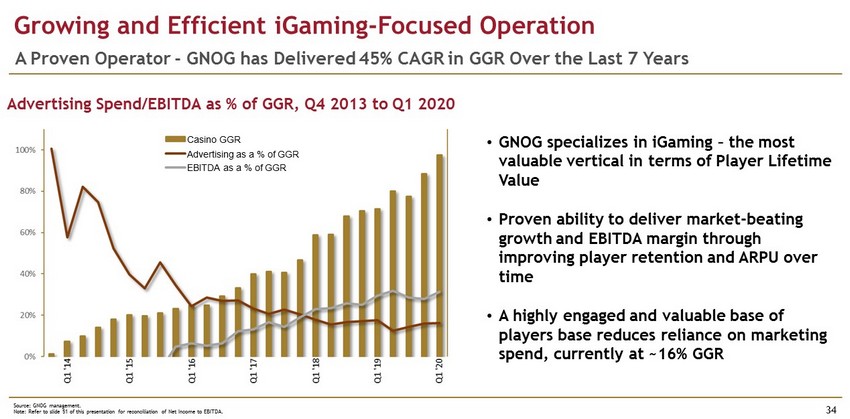
Growing and Efficient iGaming - Focused Operation 34 A Proven Operator - GNOG has Delivered 45% CAGR in GGR Over the Last 7 Years Advertising Spend/EBITDA as % of GGR, Q4 2013 to Q1 2020 • GNOG specializes in iGaming – the most valuable vertical in terms of Player Lifetime Value • Proven ability to deliver market - beating growth and EBITDA margin through improving player retention and ARPU over time • A highly engaged and valuable base of players base reduces reliance on marketing spend, currently at ~16% GGR Casino GGR Advertising as a % of GGR EBITDA as a % of GGR Source: GNOG management. Note: Refer to slide 51 of this presentation for reconciliation of Net Income to EBITDA.
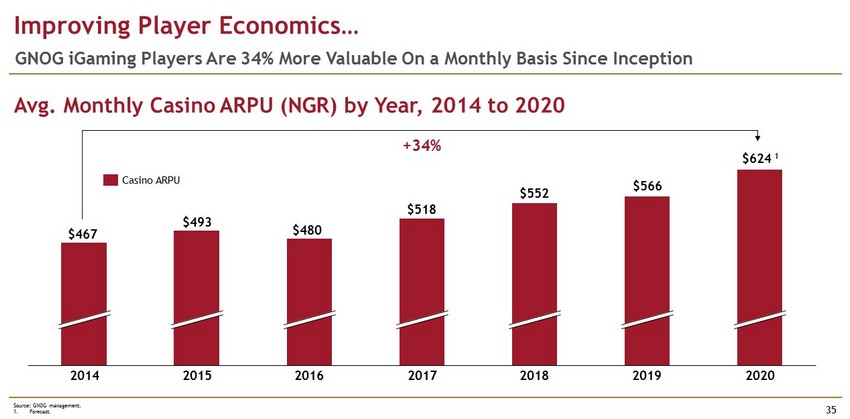
Improving Player Economics… 35 GNOG iGaming Players Are 34% More Valuable On a Monthly Basis Since Inception $566 $624 1 $552 $493 $480 $518 2018 $467 2016 2019 2015 2020 2014 2017 +34% Casino ARPU Avg. Monthly Casino ARPU (NGR) by Year, 2014 to 2020 Source: GNOG management. 1. Forecast.

Source: GNOG management and Company filings. 1. DraftKings Investor Presentation (Dec - 19). …And Above - Market Lifetime Value 36 Average Y1 LTVs at ~$2.1k; Y5 at ~$7.7k Avg. Cohort LTV (GGR), Over Six Years (Monthly) $2k $8k $6k $12k $0k $4k $10k M68 M8 M24 M2 M52 M70 M32 LTV M4 M10 M12 M14 M16 $7.7k M18 M30 M20 M22 M26 M28 M48 M36 M34 M60 M38 M40 M42 M44 M6 M50 M58 M54 M56 M62 M46 M66 M72 $2.1k $5.0k $10.1k M64 5 year LTV: ~$7.7k 5 year LTV: ~$2.4k 1 (New Jersey)
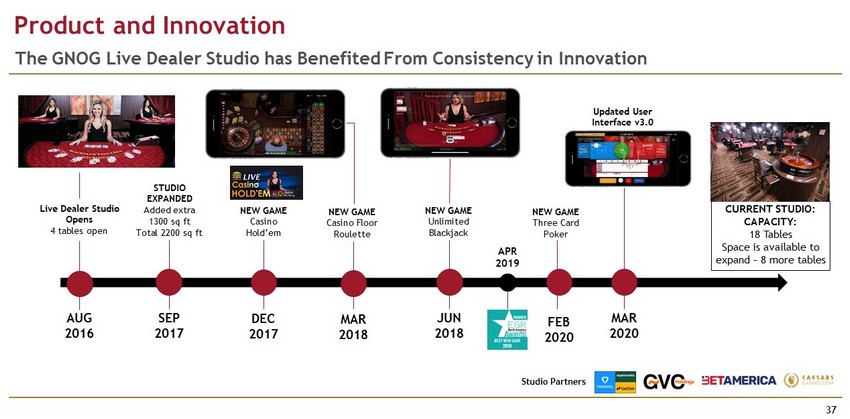
Product and Innovation 37 The GNOG Live Dealer Studio has Benefited From Consistency in Innovation Live Dealer Studio Opens 4 tables open AUG 2016 SEP 2017 STUDIO EXPANDED Added extra 1300 sq ft Total 2200 sq ft DEC 2017 NEW GAME Casino Hold’em MAR 2018 NEW GAME Casino Floor Roulette JUN 2018 NEW GAME Unlimited Blackjack FEB 2020 NEW GAME Three Card Poker MAR 2020 Updated User Interface v3.0 APR 2019 Studio Partners CURRENT STUDIO: CAPACITY: 18 Tables Space is available to expand – 8 more tables
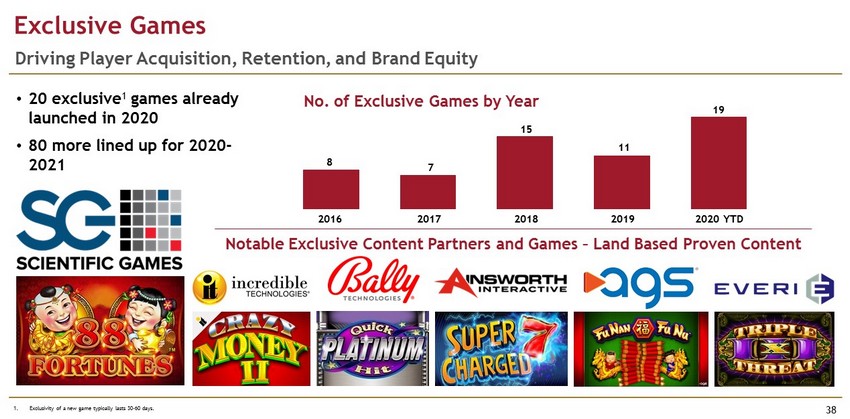
Exclusive Games 38 Driving Player Acquisition, Retention, and Brand Equity • 20 exclusive 1 games already launched in 2020 • 80 more lined up for 2020 - 2021 Notable Exclusive Content Partners and Games – Land Based Proven Content 2020 YTD 2016 2018 2017 2019 No. of Exclusive Games by Year 8 7 15 11 19 1. Exclusivity of a new game typically lasts 30 - 60 days.
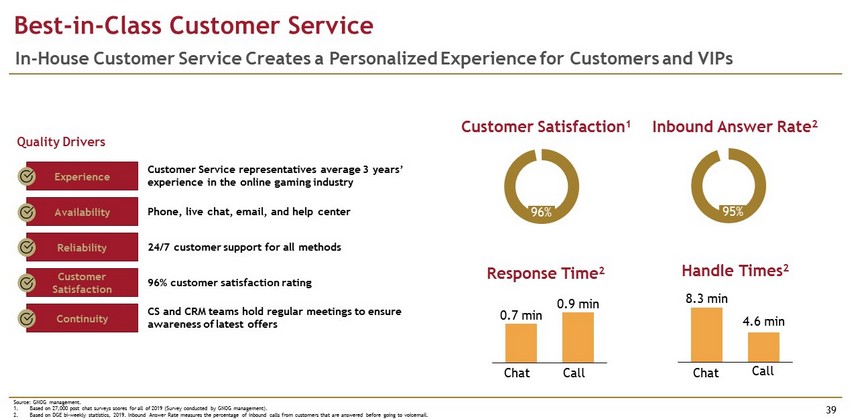
Customer Service representatives average 3 years’ experience in the online gaming industry Phone, live chat, email, and help center 24/7 customer support for all methods 96% customer satisfaction rating CS and CRM teams hold regular meetings to ensure awareness of latest offers Experience Source: GNOG management. 1. Based on 27,000 post chat surveys scores for all of 2019 (Survey conducted by GNOG management) . 2. Based on DGE bi - weekly statistics, 2019. Inbound Answer Rate measures the percentage of inbound calls from customers that are an swered before going to voicemail. Best - in - Class Customer Service 39 In - House Customer Service Creates a Personalized Experience for Customers and VIPs Quality Drivers Availability Reliability Customer Satisfaction Continuity 96% Customer Satisfaction 1 95% Inbound Answer Rate 2 Response Time 2 Handle Times 2 0.7 min 0.9 min Chat Call 8.3 min 4.6 min Chat Call

40 AGENDA GNOG Company Summary How We Differentiate Ourselves Proposed Transaction Financial Overview and Growth Plan Introduction Market Overview Appendix
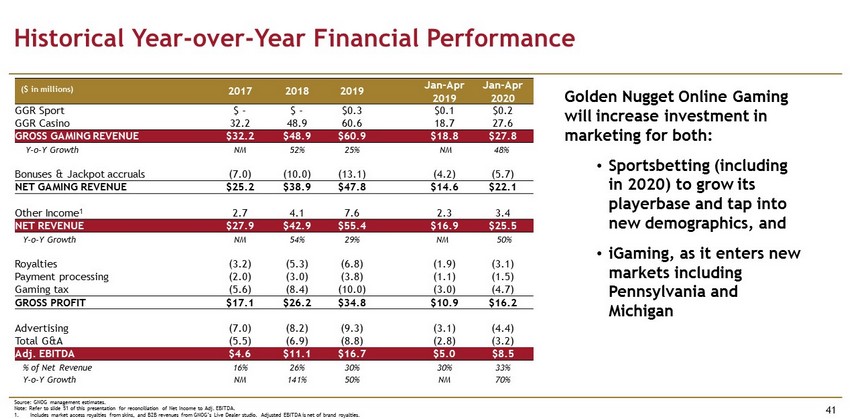
Source: GNOG management estimates. Note: Refer to slide 51 of this presentation for reconciliation of Net Income to Adj. EBITDA. 1. Includes market access royalties from skins, and B2B revenues from GNOG’s Live Dealer studio. Adjusted EBITDA is net of brand ro yalties. Historical Year - over - Year Financial Performance 41 2017 2018 2019 Jan - Apr 2019 Jan - Apr 2020 GGR Sport $ - $ - $0.3 $0.1 $0.2 GGR Casino 32.2 48.9 60.6 18.7 27.6 GROSS GAMING REVENUE $32.2 $48.9 $60.9 $18.8 $27.8 Y - o - Y Growth NM 52% 25% NM 48% Bonuses & Jackpot accruals (7.0) (10.0) (13.1) (4.2) (5.7) NET GAMING REVENUE $25.2 $38.9 $47.8 $14.6 $22.1 Other Income 1 2.7 4.1 7.6 2.3 3.4 NET REVENUE $27.9 $42.9 $55.4 $16.9 $25.5 Y - o - Y Growth NM 54% 29% NM 50% Royalties (3.2) (5.3) (6.8) (1.9) (3.1) Payment processing (2.0) (3.0) (3.8) (1.1) (1.5) Gaming tax (5.6) (8.4) (10.0) (3.0) (4.7) GROSS PROFIT $17.1 $26.2 $34.8 $10.9 $16.2 Advertising (7.0) (8.2) (9.3) (3.1) (4.4) Total G&A (5.5) (6.9) (8.8) (2.8) (3.2) Adj. EBITDA $4.6 $11.1 $16.7 $5.0 $8.5 % of Net Revenue 16% 26% 30% 30% 33% Y - o - Y Growth NM 141% 50% NM 70% Golden Nugget Online Gaming will increase investment in marketing for both: • Sportsbetting (including in 2020) to grow its playerbase and tap into new demographics, and • iGaming, as it enters new markets including Pennsylvania and Michigan ($ in millions)
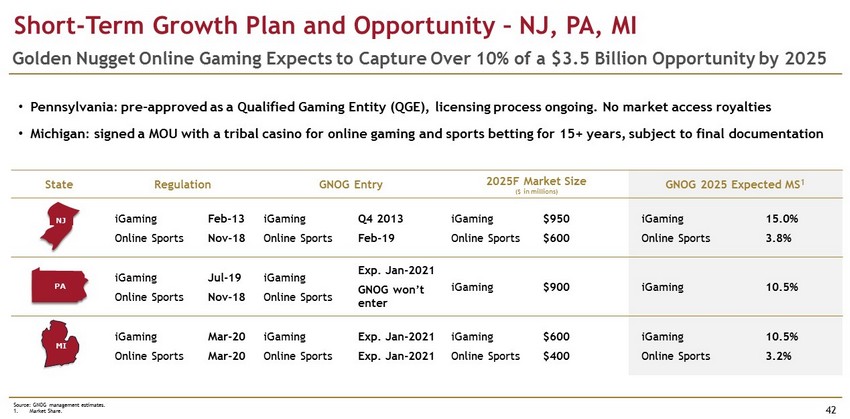
State Regulation GNOG Entry 2025F Market Size ($ in millions) GNOG 2025 Expected MS 1 iGaming Online Sports Feb - 13 Nov - 18 iGaming Online Sports Q4 2013 Feb - 19 iGaming Online Sports $950 $600 iGaming Online Sports 15.0% 3.8% iGaming Online Sports Jul - 19 Nov - 18 iGaming Online Sports Exp. Jan - 2021 GNOG won’t enter iGaming $900 iGaming 10.5% iGaming Online Sports Mar - 20 Mar - 20 iGaming Online Sports Exp. Jan - 2021 Exp. Jan - 2021 iGaming Online Sports $600 $400 iGaming Online Sports 10.5% 3.2% Source: GNOG management estimates. 1. Market Share. Short - Term Growth Plan and Opportunity – NJ, PA, MI 42 Golden Nugget Online Gaming Expects to Capture Over 10% of a $3.5 Billion Opportunity by 2025 • Pennsylvania : pre - approved as a Qualified Gaming Entity (QGE), licensing process ongoing. No market access royalties • Michigan : signed a MOU with a tribal casino for online gaming and sports betting for 15+ years, subject to final documentation NJ PA MI

Projected Revenue 1 43 GNOG Expects to Enter New Markets, Starting with PA and MI in 2021 Net Revenue (2019 to 2025) ($ in millions) NJ MI PA New States Source: GNOG Management. 1. Assumes operations in MI and PA launch on 1/1/2021. New state market size estimates derived from research. GNOG assumes marke t p enetration rate and GNOG market share to determine new state GGR. 75% margin applied to new state GGR to reach Net Revenue. $55 $86 $122 2019A 2020F 2021F $635 million 2025F
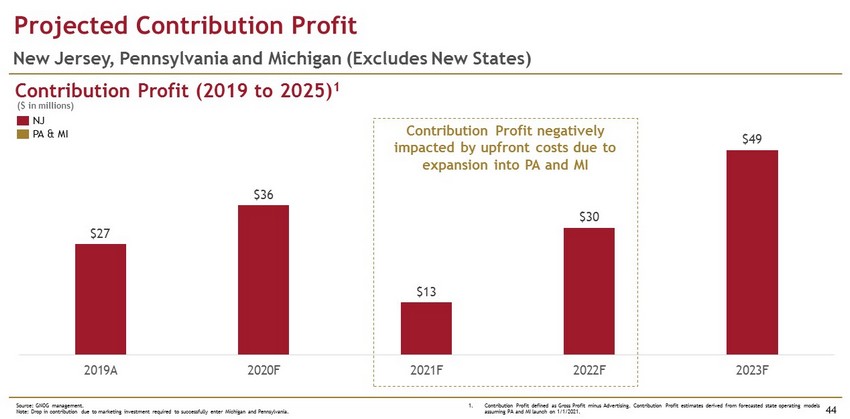
$27 $36 $13 $30 $49 2019A 2020F 2021F 2022F 2023F Projected Contribution Profit 44 New Jersey, Pennsylvania and Michigan (Excludes New States) Contribution Profit (2019 to 2025) 1 Source: GNOG management. Note: Drop in contribution due to marketing investment required to successfully enter Michigan and Pennsylvania. Contribution Profit negatively impacted by upfront costs due to expansion into PA and MI ($ in millions) NJ PA & MI 1. Contribution Profit defined as Gross Profit minus Advertising. Contribution Profit estimates derived from forecasted state op era ting models assuming PA and MI launch on 1/1/2021.
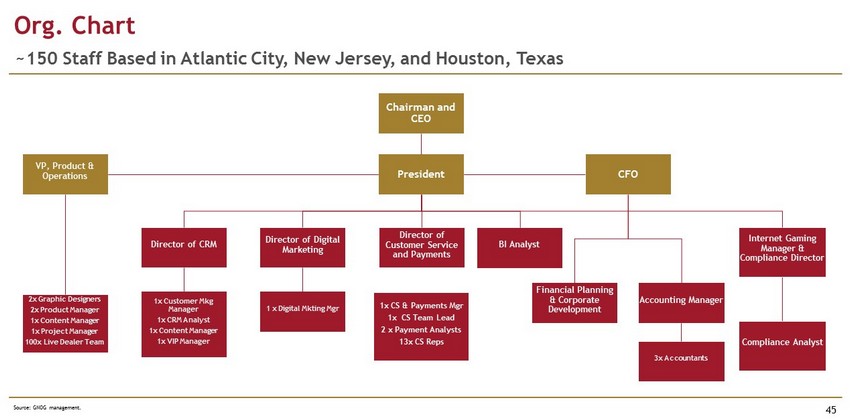
Source: GNOG management. Org. Chart 45 ~150 Staff Based in Atlantic City, New Jersey, and Houston, Texas Internet Gaming Manager & Compliance Director Compliance Analyst President VP, Product & Operations 2x Graphic Designers 2x Product Manager 1x Content Manager 1x Project Manager 100x Live Dealer Team Director of CRM 1x Customer Mkg Manager 1x CRM Analyst 1x Content Manager 1x VIP Manager Director of Digital Marketing 1 x Digital Mkting Mgr Director of Customer Service and Payments 1x CS & Payments Mgr 1x CS Team Lead 2 x Payment Analysts 13x CS Reps Financial Planning & Corporate Development Accounting Manager 3x Accountants BI Analyst CFO Chairman and CEO
46 AGENDA GNOG Company Summary How We Differentiate Ourselves Proposed Transaction Financial Overview and Growth Plan Introduction Market Overview Appendix
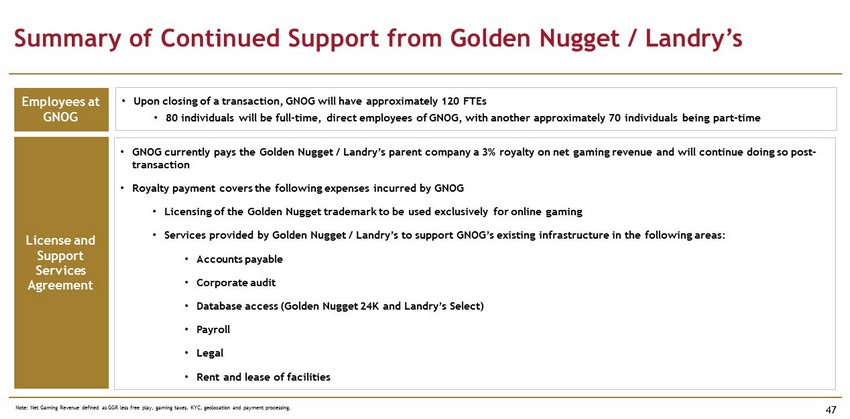
Summary of Continued Support from Golden Nugget / Landry’s 47 • Upon closing of a transaction, GNOG will have approximately 120 FTEs • 80 individuals will be full - time, direct employees of GNOG, with another approximately 70 individuals being part - time Employees at GNOG License and Support Services Agreement • GNOG currently pays the Golden Nugget / Landry’s parent company a 3% royalty on net gaming revenue and will continue doing so po st - transaction • Royalty payment covers the following expenses incurred by GNOG • Licensing of the Golden Nugget trademark to be used exclusively for online gaming • Services provided by Golden Nugget / Landry’s to support GNOG’s existing infrastructure in the following areas: • Accounts payable • Corporate audit • Database access (Golden Nugget 24K and Landry’s Select) • Payroll • Legal • Rent and lease of facilities Note: Net Gaming Revenue defined as GGR less free play, gaming taxes, KYC, geolocation and payment processing.

Highly Loyal and Valuable Player Base 48 ~50% of GGR in 2019 Generated by Cohorts Acquired Before 2018 $0m $5m $10m $30m $20m $15m $35m $65m $25m $40m $45m $50m $55m $60m 2018 Cohort 2013 2014 2015 2016 2017 2018 2019 2017 Cohort 2019 Cohort 2016 Cohort 2015 Cohort 2014 Cohort 2013 Cohort GNOG GGR by Yearly Cohort, 2013 to 2019 % of 2019 GGR 22% 29% 16% 12% 8% 12% 1% Source: GNOG management.
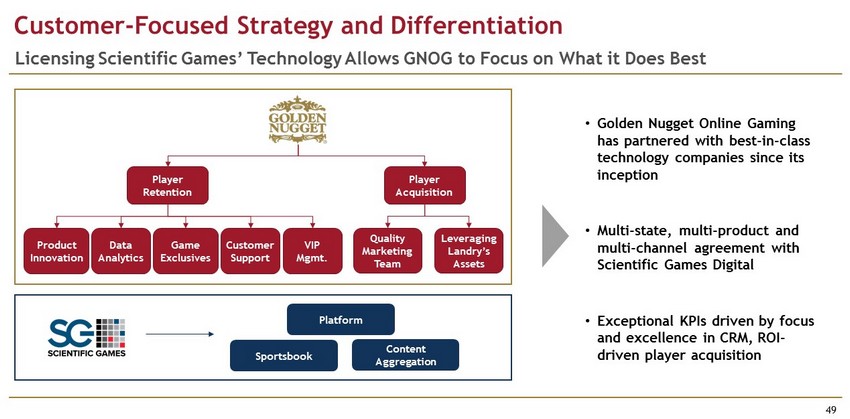
Customer - Focused Strategy and Differentiation 49 Licensing Scientific Games’ Technology Allows GNOG to Focus on What it Does Best Player Retention Product Innovation Game Exclusives Customer Support Quality Marketing Team Player Acquisition Platform Sportsbook Content Aggregation • Golden Nugget Online Gaming has partnered with best - in - class technology companies since its inception • Multi - state, multi - product and multi - channel agreement with Scientific Games Digital • Exceptional KPIs driven by focus and excellence in CRM, ROI - driven player acquisition Leveraging Landry’s Assets Data Analytics VIP Mgmt.
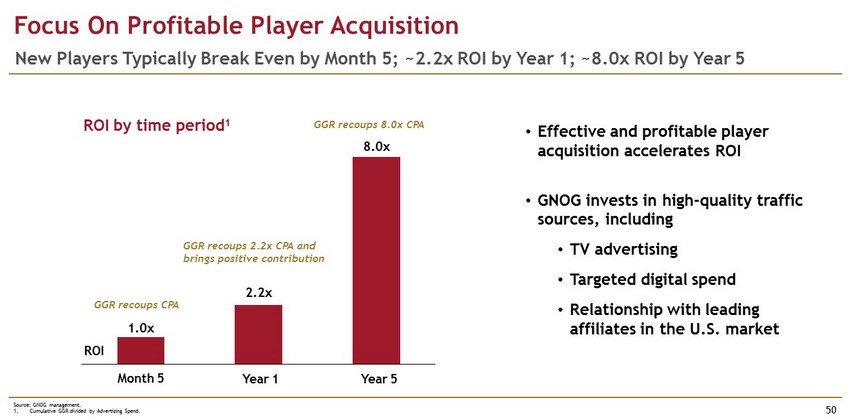
Source: GNOG management. 1. Cumulative GGR divided by Advertising Spend. Focus On Profitable Player Acquisition 50 New Players Typically Break Even by Month 5; ~2.2x ROI by Year 1; ~8.0x ROI by Year 5 • Effective and profitable player acquisition accelerates ROI • GNOG invests in high - quality traffic sources, including • TV advertising • Targeted digital spend • Relationship with leading affiliates in the U.S. market 1.0x 2.2x 8.0x Month 5 ROI Year 1 Year 5 GGR recoups CPA GGR recoups 2.2x CPA and brings positive contribution GGR recoups 8.0x CPA ROI by time period 1

Reconciliation of Non - GAAP Measures 51 Source: GNOG management. ($ in millions) 2016 2017 2018 2019 Net Income $1.6 $4.5 $7.2 $11.7 Plus: Tax Expense - 0.5 4.7 6.0 Plus: Interest Expense 0.1 0.1 - - Plus: Depreciation & Amortization 0.0 0.0 0.1 0.1 EBITDA $1.7 $5.1 $12.0 $17.8 Less: Brand Royalties (0.4) (0.5) (0.9) (1.1) Adj. EBITDA $1.3 $4.6 $11.1 $16.7 ($ in millions) Jan - 19 Feb - 19 Mar - 19 Apr - 19 Jan - 20 Feb - 20 Mar - 20 Apr - 20 Net Income $0.8 $0.7 $1.1 $1.0 $1.1 $1.3 $1.6 $2.2 Plus: Estimated Tax Expense 0.4 0.4 0.5 0.5 0.5 0.6 0.7 1.0 Plus: Interest Expense - - - - - - - - Plus: Depreciation & Amortization 0.0 0.0 0.0 0.0 0.0 0.0 0.0 0.0 EBITDA $1.2 $1.1 $1.6 $1.5 $1.6 $1.9 $2.3 $3.2 Less: Brand Royalties (0.1) (0.1) (0.1) (0.1) (0.1) (0.1) (0.1) (0.2) Adj. EBITDA $1.1 $1.0 $1.5 $1.4 $1.5 $1.8 $2.2 $3.0 Note: Prior to November 2017, GNOG was a pass through entity and as such no tax impact was previously reflected.