Attached files
| file | filename |
|---|---|
| EX-99.1 - EXHIBIT 99.1 - CHESAPEAKE ENERGY CORP | tm2023599d1_ex99-1.htm |
| EX-10.2 - EXHIBIT 10.2 - CHESAPEAKE ENERGY CORP | tm2023599d1_ex10-2.htm |
| EX-10.1 - EXHIBIT 10.1 - CHESAPEAKE ENERGY CORP | tm2023599d1_ex10-1.htm |
| 8-K - FORM 8-K - CHESAPEAKE ENERGY CORP | tm2023599-1_8k.htm |
Exhibit 99.2
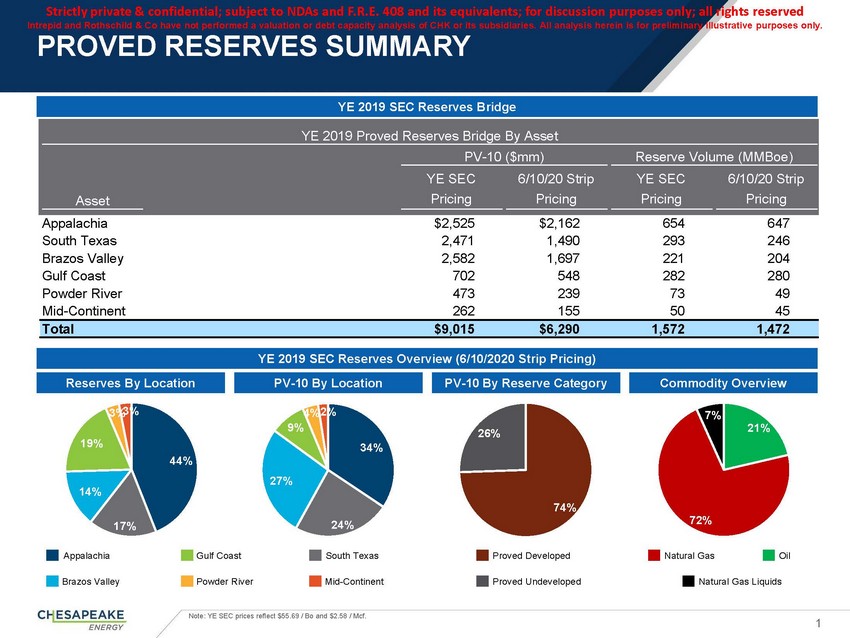
Strictly private & confidential; subject to NDAs and F.R.E. 408 and its equivalents; for discussion purposes only; all rights reserved Intrepid and Rothschild & Co have not performed a valuation or debt capacity analysis of CHK or its subsidiaries. All analysis herein is for preliminary illustrative purposes only. PROVED RESERVES SUMMARYYE 2019 SEC Reserves BridgeYE 2019 Proved Reserves Bridge By AssetPV-10 ($mm) Reserve Volume (MMBoe)AssetYE SEC Pricing6/10/20 Strip PricingYE SEC Pricing6/10/20 Strip PricingAppalachia $2,525 $2,162 654 647 South Texas 2,471 1,490 293 246 Brazos Valley 2,582 1,697 221 204 Gulf Coast 702 548 282 280 Powder River 473 239 73 49 Mid-Continent 262 155 50 45 Total $9,015 $6,290 1,572 1,472YE 2019 SEC Reserves Overview (6/10/2020 Strip Pricing)Reserves By Location PV-10 By Location PV-10 By Reserve Category Commodity Overview4% 9% 19% 34% 44%26%7% 21%14%17%27%24%74%72%Appalachia Gulf Coast South TexasProved DevelopedNatural GasOilBrazos Valley Powder River Mid-ContinentProved UndevelopedNatural Gas LiquidsNote: YE SEC prices reflect $55.69 / Bo and $2.58 / Mcf. 1
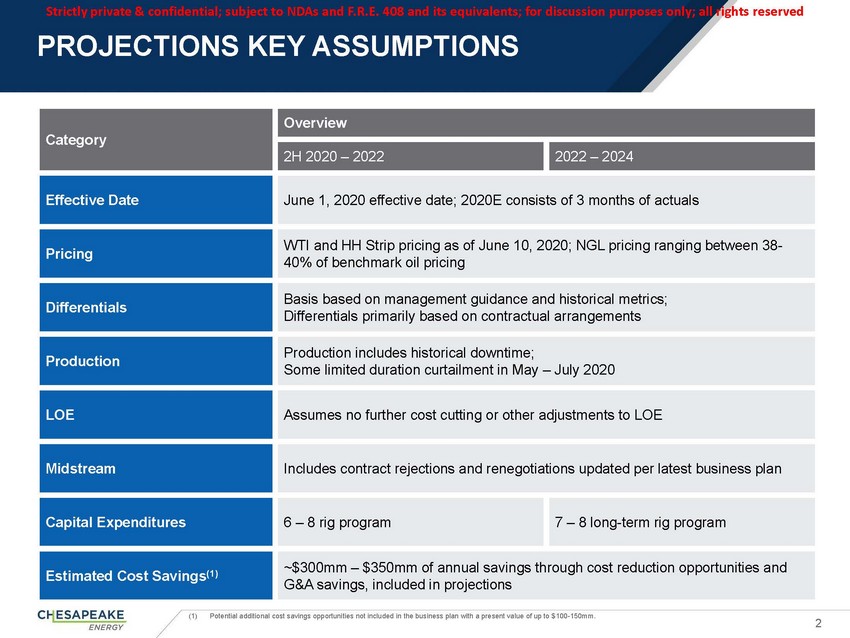
Strictly private & confidential; subject to NDAs and F.R.E. 408 and its equivalents; for discussion purposes only; all rights reservedPROJECTIONS KEY ASSUMPTIONSCategoryOverview2H 2020 – 2022 2022 – 2024Effective Date June 1, 2020 effective date; 2020E consists of 3 months of actualsPricing WTI and HH Strip pricing as of June 10, 2020; NGL pricing ranging between 38- 40% of benchmark oil pricingDifferentials Basis based on management guidance and historical metrics; Differentials primarily based on contractual arrangementsProduction Production includes historical downtime; Some limited duration curtailment in May – July 2020LOE Assumes no further cost cutting or other adjustments to LOEMidstream Includes contract rejections and renegotiations updated per latest business planCapital Expenditures 6 – 8 rig program 7 – 8 long-term rig programEstimated Cost Savings(1) ~$300mm – $350mm of annual savings through cost reduction opportunities and G&A savings, included in projections(1) Potential additional cost savings opportunities not included in the business plan with a present value of up to $100-150mm. 2
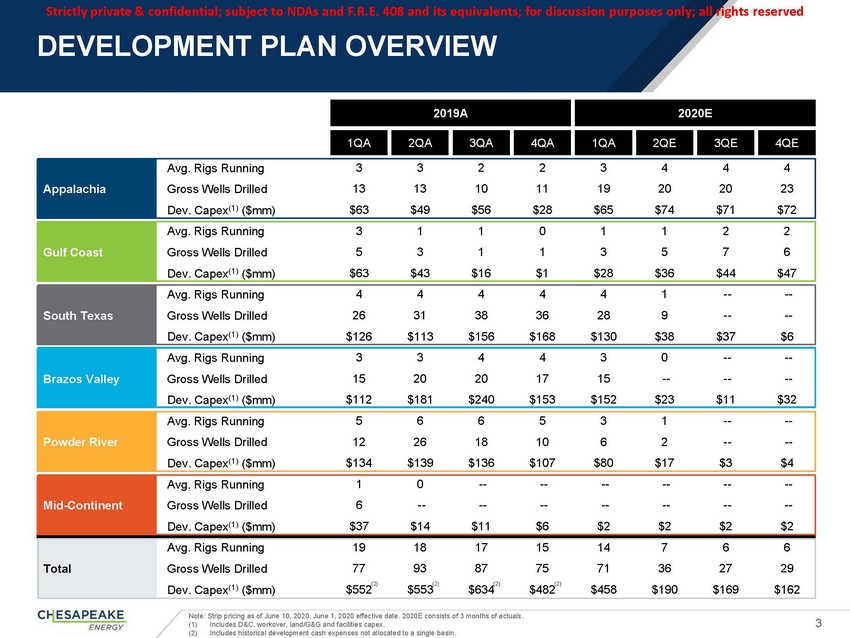
Strictly private & confidential; subject to NDAs and F.R.E. 408 and its equivalents; for discussion purposes only; all rights reservedDEVELOPMENT PLAN OVERVIEW2019A 2020E1QA 2QA 3QA 4QA 1QA 2QE 3QE 4QEAppalachia Gulf Coast South Texas Brazos Valley Powder River Mid-Continent TotalAvg. Rigs Running 3 3 2 2 3 4 4 4Gross Wells Drilled 13 13 10 11 19 20 20 23Dev. Capex(1) ($mm) $63 $49 $56 $28 $65 $74 $71 $72Avg. Rigs Running 3 1 1 0 1 1 2 2Gross Wells Drilled 5 3 1 1 3 5 7 6Dev. Capex(1) ($mm) $63 $43 $16 $1 $28 $36 $44 $47Avg. Rigs Running 4 4 4 4 4 1 -- -- Gross Wells Drilled 26 31 38 36 28 9 -- -- Dev. Capex(1) ($mm) $126 $113 $156 $168 $130 $38 $37 $6 Avg. Rigs Running 3 3 4 4 3 0 -- -- Gross Wells Drilled 15 20 20 17 15 -- -- -- Dev. Capex(1) ($mm) $112 $181 $240 $153 $152 $23 $11 $32 Avg. Rigs Running 5 6 6 5 3 1 -- -- Gross Wells Drilled 12 26 18 10 6 2 -- -- Dev. Capex(1) ($mm) $134 $139 $136 $107 $80 $17 $3 $4 Avg. Rigs Running 1 0 -- -- -- -- -- -- Gross Wells Drilled 6 -- -- -- -- -- -- -- Dev. Capex(1) ($mm) $37 $14 $11 $6 $2 $2 $2 $2 Avg. Rigs Running 19 18 17 15 14 7 6 6Gross Wells Drilled 77 93 87 75 71 36 27 29Dev. Capex(1) ($mm) $552 $553 $634 $482 $458 $190 $169 $162Note: Strip pricing as of June 10, 2020. June 1, 2020 effective date. 2020E consists of 3 months of actuals. (1) Includes D&C, workover, land/G&G and facilities capex.3 (2) Includes historical development cash expenses not allocated to a single basin.
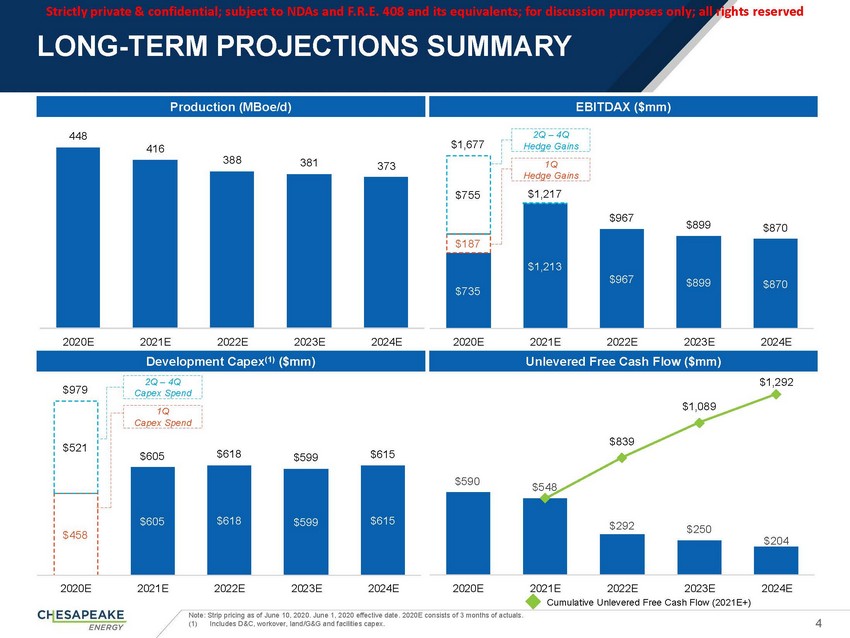
Strictly private & confidential; subject to NDAs and F.R.E. 408 and its equivalents; for discussion purposes only; all rights reservedLONG-TERM PROJECTIONS SUMMARYProduction (MBoe/d)EBITDAX ($mm)448416388 381 373$1,677$755$1872Q – 4Q Hedge Gains1Q Hedge Gains$1,217$967 $899 $870$735$1,213$967 $899 $8702020E 2021E 2022E 2023E 2024EDevelopment Capex(1) ($mm)2Q – 4Q2020E 2021E 2022E 2023E 2024EUnlevered Free Cash Flow ($mm)$1,292$979$521Capex Spend1Q Capex Spend$605 $618 $599 $615$590 $548$839$1,089$458$605 $618 $599 $615$292 $250$2042020E 2021E 2022E 2023E 2024E2020E 2021E 2022E 2023E 2024E Cumulative Unlevered Free Cash Flow (2021E+)Note: Strip pricing as of June 10, 2020. June 1, 2020 effective date. 2020E consists of 3 months of actuals.
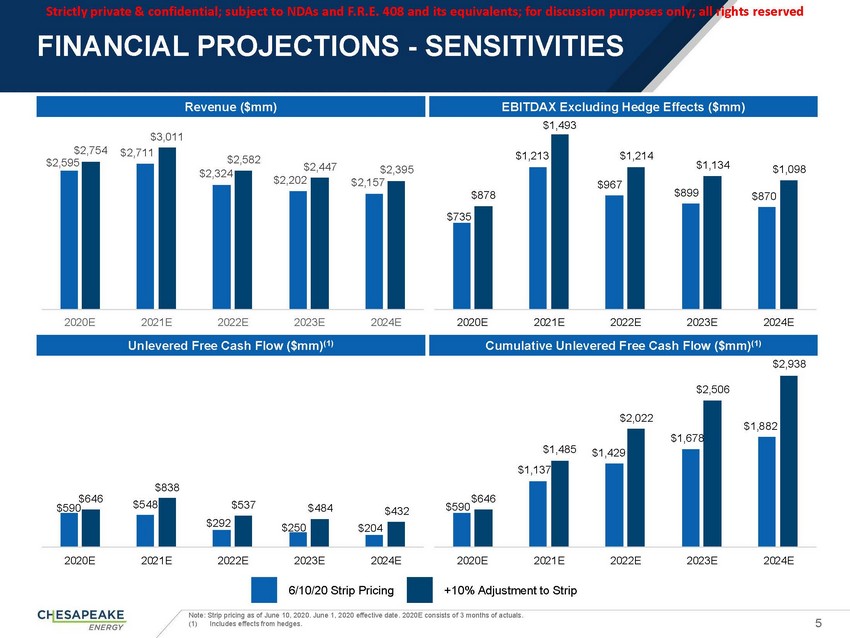
Strictly private & confidential; subject to NDAs and F.R.E. 408 and its equivalents; for discussion purposes only; all rights reservedFINANCIAL PROJECTIONS - SENSITIVITIES$3,011Revenue ($mm)EBITDAX Excluding Hedge Effects ($mm) $1,493$2,754 $2,595$2,711$2,582 $2,324 $2,447 $2,395 $2,202 $2,157$878$735$1,213$1,214$967$1,134 $1,098$899 $8702020E 2021E 2022E 2023E 2024EUnlevered Free Cash Flow ($mm)(1)2020E 2021E 2022E 2023E 2024ECumulative Unlevered Free Cash Flow ($mm)(1)$2,938$2,506$646$838$646$1,485$1,137$2,022$1,429$1,678$1,882$590 $548$537 $484 $432 $292 $250 $204$5902020E 2021E 2022E 2023E 2024E2020E 2021E 2022E 2023E 2024E6/10/20 Strip Pricing +10% Adjustment to StripNote: Strip pricing as of June 10, 2020. June 1, 2020 effective date. 2020E consists of 3 months of actuals. (1) Includes effects from hedges.5
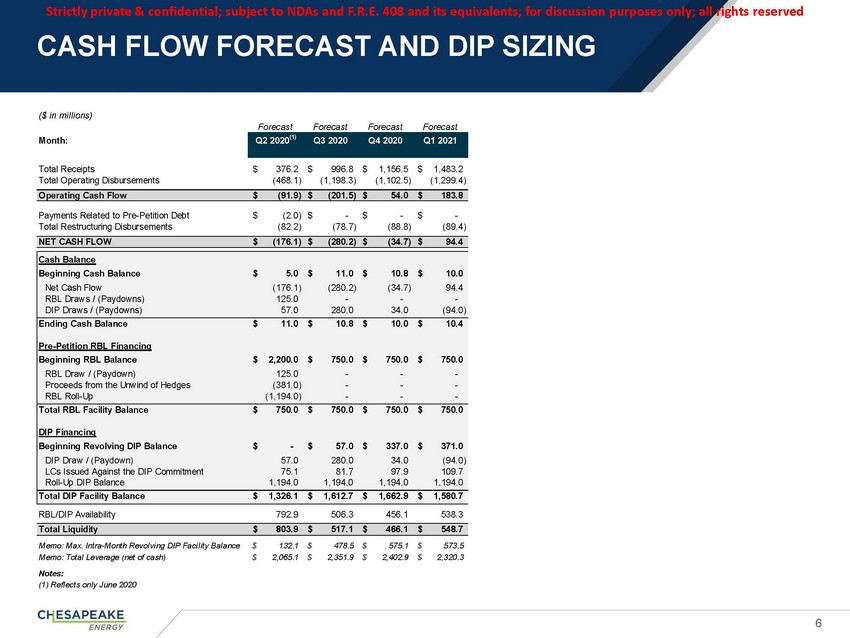
($ in millions)Forecast Forecast Forecast ForecastMonth: Q2 2020(1) Q3 2020 Q4 2020 Q1 2021Total Receipts$ 376.2 $996.8 $1,156.5 $1,483.2Total Operating Disbursements (468.1) (1,198.3) (1,102.5) (1,299.4)Operating Cash Flow$ (91.9) $(201.5) $54.0 $183.8Payments Related to Pre-Petition Debt$ (2.0) $ - $- $ -Total Restructuring Disbursements (82.2) (78.7) (88.8) (89.4)NET CASH FLOWCash Balance Beginning Cash Balance$ (176.1) $$ 5.0 $(280.2) $11.0 $(34.7) $10.8 $94.410.0Net Cash Flow (176.1) (280.2) (34.7) 94.4 RBL Draws / (Paydowns) 125.0 - - - DIP Draws / (Paydowns) 57.0 280.0 34.0 (94.0)Ending Cash Balance$ 11.0 $10.8 $10.0 $10.4Pre-Petition RBL Financing Beginning RBL Balance$ 2,200.0 $750.0 $750.0 $750.0RBL Draw / (Paydown) 125.0 - - - Proceeds from the Unwind of Hedges (381.0) - - - RBL Roll-Up (1,194.0) - - -Total RBL Facility Balance$ 750.0 $750.0 $750.0 $750.0DIP Financing Beginning Revolving DIP Balance$ - $57.0 $337.0 $371.0DIP Draw / (Paydown) 57.0 280.0 34.0 (94.0) LCs Issued Against the DIP Commitment 75.1 81.7 97.9 109.7 Roll-Up DIP Balance 1,194.0 1,194.0 1,194.0 1,194.0Total DIP Facility Balance$ 1,326.1 $1,612.7 $1,662.9 $1,580.7RBL/DIP Availability 792.9 506.3 456.1 538.3Total Liquidity$ 803.9 $517.1 $466.1 $548.7Memo: Max. Intra-Month Revolving DIP Facility Balance $ Memo: Total Leverage (net of cash) $132.1 $ 2,065.1 $478.5 $ 2,351.9 $575.1 $ 2,402.9 $573.5 2,320.3Notes: (1) Reflects only June 20206