Attached files
| file | filename |
|---|---|
| 8-K - 8-K - Old COPPER Company, Inc. | d930433d8k.htm |
Exhibit 99.1
J. C. PENNEY COMPANY, INC.
CONSOLIDATED STATEMENTS OF OPERATIONS
(Unaudited)
| Month Ended | Four Months Ended | |||||||||||||||
| June 6, | June 8, | June 6, | June 8, | |||||||||||||
| (In millions, except per share data) | 2020 | 2019 | 2020 | 2019 | ||||||||||||
| Total net sales |
$ | 266 | $ | 1,003 | $ | 1,348 | $ | 3,442 | ||||||||
| Credit income and other |
7 | 32 | 121 | 148 | ||||||||||||
|
|
|
|
|
|
|
|
|
|||||||||
| Total revenues |
273 | 1,035 | 1,469 | 3,590 | ||||||||||||
| Costs and expenses/(income): |
||||||||||||||||
| Cost of goods sold (exclusive of depreciation and amortization shown separately below) |
166 | 645 | 979 | 2,275 | ||||||||||||
| Selling, general and administrative (SG&A) |
113 | 313 | 685 | 1,169 | ||||||||||||
| Depreciation and amortization |
50 | 56 | 185 | 203 | ||||||||||||
| Real estate and other, net |
(3 | ) | 6 | (5 | ) | 1 | ||||||||||
| Restructuring and management transition |
7 | 2 | 162 | 22 | ||||||||||||
|
|
|
|
|
|
|
|
|
|||||||||
| Total costs and expenses |
333 | 1,022 | 2,006 | 3,670 | ||||||||||||
|
|
|
|
|
|
|
|
|
|||||||||
| Operating income/(loss) |
(60 | ) | 13 | (537 | ) | (80 | ) | |||||||||
| Other components of net periodic pension cost/(income) |
(8 | ) | (4 | ) | (31 | ) | (18 | ) | ||||||||
| Net interest expense |
25 | 27 | 100 | 100 | ||||||||||||
| Loss due to discontinuance of hedge accounting |
— | — | 77 | — | ||||||||||||
| Reorganization items, net |
72 | — | 72 | — | ||||||||||||
|
|
|
|
|
|
|
|
|
|||||||||
| Income/(loss) before income taxes |
(149 | ) | (10 | ) | (755 | ) | (162 | ) | ||||||||
| Income tax expense/(benefit) |
(1 | ) | 1 | (61 | ) | 3 | ||||||||||
|
|
|
|
|
|
|
|
|
|||||||||
| Net income/(loss) |
$ | (148 | ) | $ | (11 | ) | $ | (694 | ) | $ | (165 | ) | ||||
|
|
|
|
|
|
|
|
|
|||||||||
| Earnings/(loss) per share - basic |
$ | (0.46 | ) | $ | (0.03 | ) | $ | (2.14 | ) | $ | (0.52 | ) | ||||
| Earnings/(loss) per share - diluted |
$ | (0.46 | ) | $ | (0.03 | ) | $ | (2.14 | ) | $ | (0.52 | ) | ||||
J. C. PENNEY COMPANY, INC.
CONSOLIDATED BALANCE SHEETS
(Unaudited)
| June 6, | June 8, | |||||||
| 2020 | 2019 | |||||||
| (In millions) |
||||||||
| Assets |
||||||||
| Current assets: |
||||||||
| Cash in banks and in transit |
$ | 154 | $ | 148 | ||||
| Cash short-term investments |
583 | 7 | ||||||
|
|
|
|
|
|||||
| Cash and cash equivalents |
737 | 155 | ||||||
| Merchandise inventory |
2,124 | 2,398 | ||||||
| Prepaid expenses and other |
300 | 297 | ||||||
|
|
|
|
|
|||||
| Total current assets |
3,161 | 2,850 | ||||||
| Property and equipment, net |
3,306 | 3,626 | ||||||
| Operating lease assets |
929 | 912 | ||||||
| Prepaid pension |
144 | 159 | ||||||
| Other assets |
626 | 662 | ||||||
|
|
|
|
|
|||||
| Total assets |
$ | 8,166 | $ | 8,209 | ||||
|
|
|
|
|
|||||
| Liabilities and stockholders’ equity |
||||||||
| Current liabilities: |
||||||||
| Merchandise accounts payable |
$ | 583 | $ | 807 | ||||
| Other accounts payable and accrued expenses |
919 | 881 | ||||||
| Current operating lease liabilities |
101 | 83 | ||||||
| Current portion of finance leases and note payable |
— | 2 | ||||||
| Current portion of long-term debt, net |
4,884 | 92 | ||||||
|
|
|
|
|
|||||
| Total current liabilities |
6,487 | 1,865 | ||||||
| Noncurrent operating lease liabilities |
1,080 | 1,076 | ||||||
| Long-term debt |
— | 3,793 | ||||||
| Deferred taxes |
47 | 119 | ||||||
| Other liabilities |
355 | 330 | ||||||
|
|
|
|
|
|||||
| Total liabilities |
7,969 | 7,183 | ||||||
| Stockholders’ equity |
||||||||
| Common stock |
161 | 159 | ||||||
| Additional paid-in capital |
4,721 | 4,719 | ||||||
| Reinvested earnings/(accumulated deficit) |
(4,363 | ) | (3,566 | ) | ||||
| Accumulated other comprehensive income/(loss) |
(322 | ) | (286 | ) | ||||
|
|
|
|
|
|||||
| Total stockholders’ equity |
197 | 1,026 | ||||||
|
|
|
|
|
|||||
| Total liabilities and stockholders’ equity |
$ | 8,166 | $ | 8,209 | ||||
|
|
|
|
|
|||||
J. C. PENNEY COMPANY, INC.
CONSOLIDATED STATEMENTS OF STOCKHOLDERS’ EQUITY
(Unaudited)
| Reinvested | Accumulated | |||||||||||||||||||||||
| Number of | Additional | Earnings/ | Other | |||||||||||||||||||||
| Common | Common | Paid-in | (Accumulated | Comprehensive | Total Stockholders’ | |||||||||||||||||||
| (In millions) | Shares | Stock | Capital | Deficit) | Income/(Loss) | Equity | ||||||||||||||||||
| February 1, 2020 |
320.5 | $ | 160 | $ | 4,723 | $ | (3,667 | ) | $ | (387 | ) | $ | 829 | |||||||||||
| Net income/(loss) |
— | — | — | (546 | ) | — | (546 | ) | ||||||||||||||||
| Discontinuance of hedge accounting |
— | — | — | — | 63 | 63 | ||||||||||||||||||
| Other comprehensive income/(loss) |
— | — | — | — | 1 | 1 | ||||||||||||||||||
| Stock-based compensation and other |
1.4 | 1 | 2 | (2 | ) | — | 1 | |||||||||||||||||
|
|
|
|
|
|
|
|
|
|
|
|
|
|||||||||||||
| May 2, 2020 |
321.9 | 161 | 4,725 | (4,215 | ) | (323 | ) | 348 | ||||||||||||||||
| Net income/(loss) |
— | — | — | (148 | ) | — | (148 | ) | ||||||||||||||||
| Other comprehensive income/(loss) |
— | — | — | — | 1 | 1 | ||||||||||||||||||
| Stock-based compensation and other |
— | — | (4 | ) | — | — | (4 | ) | ||||||||||||||||
|
|
|
|
|
|
|
|
|
|
|
|
|
|||||||||||||
| June 6, 2020 |
321.9 | $ | 161 | $ | 4,721 | $ | (4,363 | ) | $ | (322 | ) | $ | 196 | |||||||||||
|
|
|
|
|
|
|
|
|
|
|
|
|
|||||||||||||
| Reinvested | Accumulated | |||||||||||||||||||||||
| Number of | Additional | Earnings/ | Other | |||||||||||||||||||||
| Common | Common | Paid-in | (Accumulated | Comprehensive | Total Stockholders’ | |||||||||||||||||||
| (In millions) | Shares | Stock | Capital | Deficit) | Income/(Loss) | Equity | ||||||||||||||||||
| February 2, 2019 |
316.1 | $ | 158 | $ | 4,713 | $ | (3,373 | ) | $ | (328 | ) | $ | 1,170 | |||||||||||
| ASC 842 (Leases) and ASU 2018-02 (Stranded Taxes) adoption |
— | — | — | (26 | ) | 53 | 27 | |||||||||||||||||
| Net income/(loss) |
— | — | — | (154 | ) | — | (154 | ) | ||||||||||||||||
| Other comprehensive income/(loss) |
— | — | — | — | (11 | ) | (11 | ) | ||||||||||||||||
| Stock-based compensation and other |
0.7 | — | 2 | — | — | 2 | ||||||||||||||||||
|
|
|
|
|
|
|
|
|
|
|
|
|
|||||||||||||
| May 4, 2019 |
316.8 | 158 | 4,715 | (3,553 | ) | (286 | ) | 1,034 | ||||||||||||||||
| Net income/(loss) |
— | — | — | (11 | ) | — | (11 | ) | ||||||||||||||||
| Stock-based compensation and other |
0.3 | 1 | 4 | (2 | ) | — | 3 | |||||||||||||||||
|
|
|
|
|
|
|
|
|
|
|
|
|
|||||||||||||
| June 8, 2019 |
317.1 | $ | 159 | $ | 4,719 | $ | (3,566 | ) | $ | (286 | ) | $ | 1,026 | |||||||||||
|
|
|
|
|
|
|
|
|
|
|
|
|
|||||||||||||
J. C. PENNEY COMPANY, INC.
CONSOLIDATED STATEMENTS OF CASH FLOWS
(Unaudited)
| Month Ended | Four Months Ended | |||||||||||||||
| June 6, | June 8, | June 6, | June 8, | |||||||||||||
| (In millions) | 2020 | 2019 | 2020 | 2019 | ||||||||||||
| Cash flows from operating activities: |
||||||||||||||||
| Net income/(loss) |
$ | (148 | ) | $ | (11 | ) | $ | (694 | ) | $ | (165 | ) | ||||
| Adjustments to reconcile net income/(loss) to net cash provided by/(used in) operating activities: |
||||||||||||||||
| Restructuring and management transition |
— | — | 139 | 15 | ||||||||||||
| Net gain on sale of operating assets |
— | 7 | — | 3 | ||||||||||||
| Discontinuance of hedge accounting |
— | — | 77 | — | ||||||||||||
| Depreciation and amortization |
50 | 56 | 185 | 203 | ||||||||||||
| Benefit plans |
(5 | ) | (9 | ) | (27 | ) | (23 | ) | ||||||||
| Stock-based compensation |
(5 | ) | 3 | (3 | ) | 5 | ||||||||||
| Deferred taxes |
— | — | (60 | ) | (3 | ) | ||||||||||
| Change in cash from: |
||||||||||||||||
| Inventory |
97 | 79 | 42 | 39 | ||||||||||||
| Prepaid expenses and other assets |
(28 | ) | (10 | ) | (126 | ) | (108 | ) | ||||||||
| Merchandise accounts payable |
4 | (35 | ) | (203 | ) | (40 | ) | |||||||||
| Income taxes |
— | (4 | ) | (1 | ) | (1 | ) | |||||||||
| Accrued expenses and other |
124 | (44 | ) | (54 | ) | (98 | ) | |||||||||
|
|
|
|
|
|
|
|
|
|||||||||
| Net cash provided by/(used in) operating activities |
89 | 32 | (725 | ) | (173 | ) | ||||||||||
|
|
|
|
|
|
|
|
|
|||||||||
| Cash flows from investing activities: |
||||||||||||||||
| Capital expenditures |
— | (18 | ) | (33 | ) | (89 | ) | |||||||||
| Proceeds from sale of operating assets |
— | 4 | — | 12 | ||||||||||||
|
|
|
|
|
|
|
|
|
|||||||||
| Net cash provided by/(used in) investing activities |
— | (14 | ) | (33 | ) | (77 | ) | |||||||||
|
|
|
|
|
|
|
|
|
|||||||||
| Cash flows from financing activities: |
||||||||||||||||
| Proceeds from borrowings under the credit facility |
— | 221 | 1,950 | 629 | ||||||||||||
| Payments of borrowings under the credit facility |
— | (255 | ) | (771 | ) | (545 | ) | |||||||||
| Payments of finance leases and note payable |
— | — | (1 | ) | (1 | ) | ||||||||||
| Payments of long-term debt |
— | — | (19 | ) | (11 | ) | ||||||||||
|
Debtor-in-possession financing costs |
(50 | ) | — | (50 | ) | — | ||||||||||
|
|
|
|
|
|
|
|
|
|||||||||
| Net cash provided by/(used in) financing activities |
(50 | ) | (34 | ) | 1,109 | 72 | ||||||||||
|
|
|
|
|
|
|
|
|
|||||||||
| Net increase/(decrease) in cash and cash equivalents |
39 | (16 | ) | 351 | (178 | ) | ||||||||||
| Cash and cash equivalents at beginning of period |
698 | 171 | 386 | 333 | ||||||||||||
|
|
|
|
|
|
|
|
|
|||||||||
| Cash and cash equivalents at end of period |
$ | 737 | $ | 155 | $ | 737 | $ | 155 | ||||||||
|
|
|
|
|
|
|
|
|
|||||||||
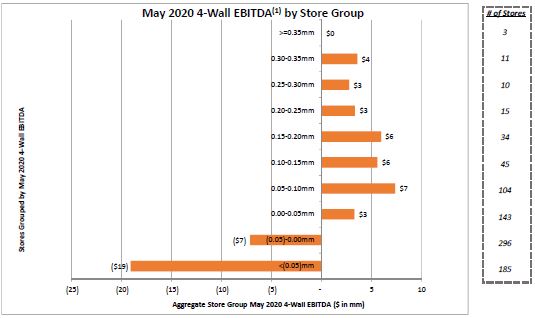
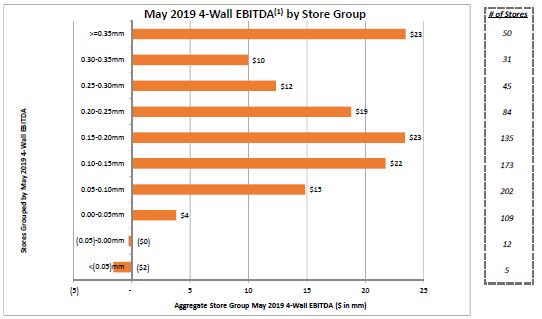
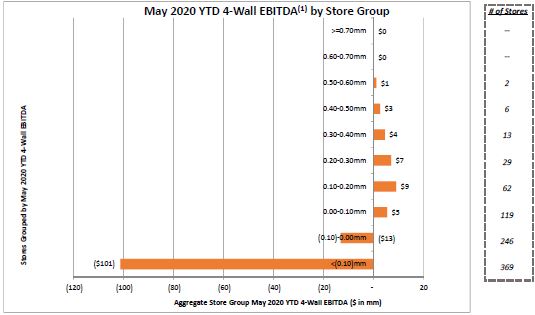
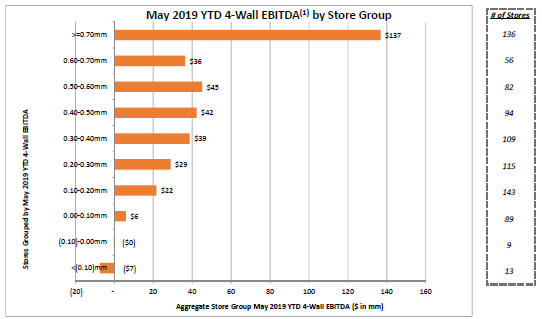
| (1) | 4-Wall EBITDA is an internal store performance metric, which excludes most corporate overhead and other fixed allocated costs. Monthly 4-Wall EBITDA numbers do not reflect certain allocations made only on an annual basis. |
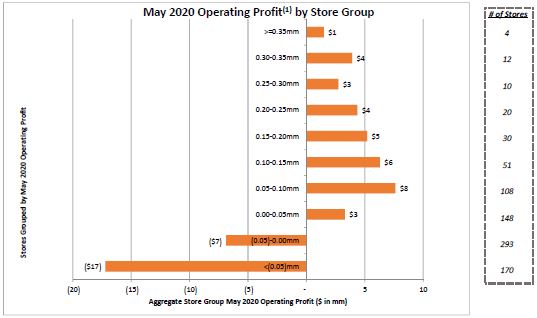
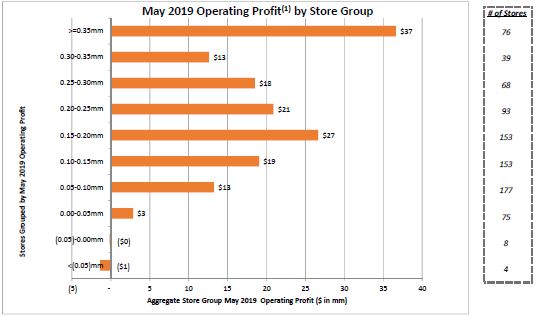
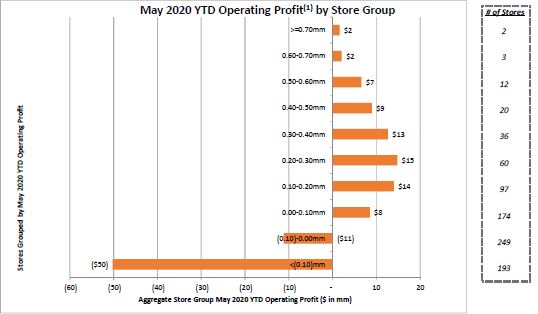
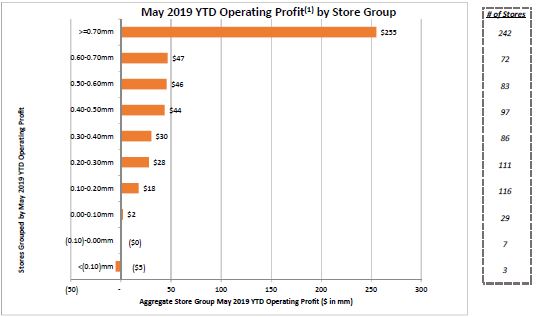
| (1) | Operating Profit is an internal store performance metric, which excludes most corporate overhead and other fixed allocated costs. |
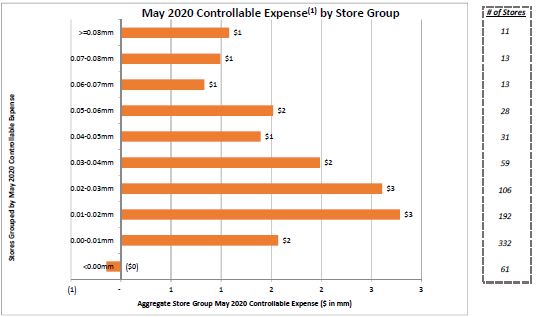
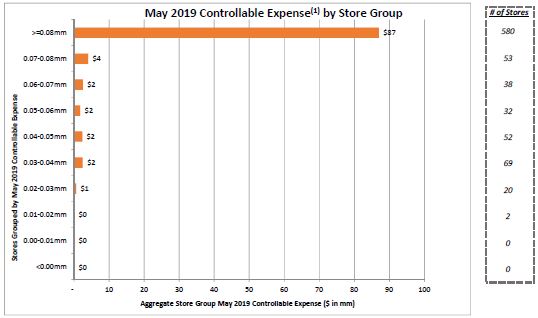
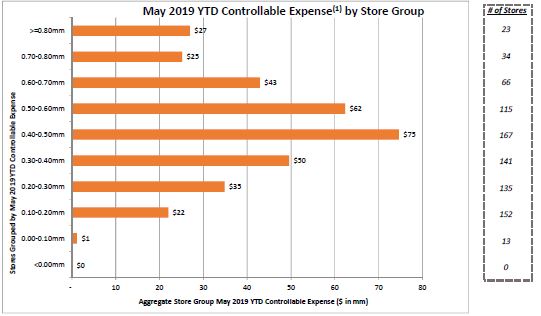
| (1) | Controllable expenses include store salaries, facilities expenses and utilities expenses, among others. |
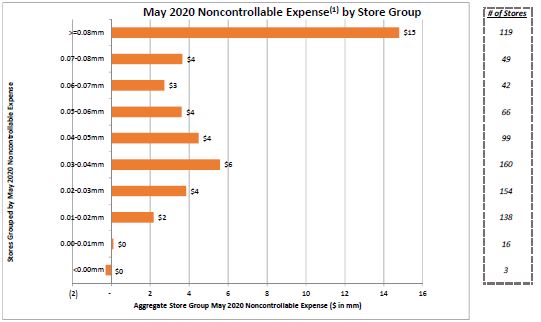
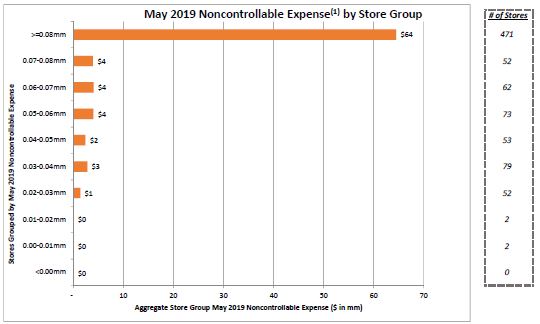
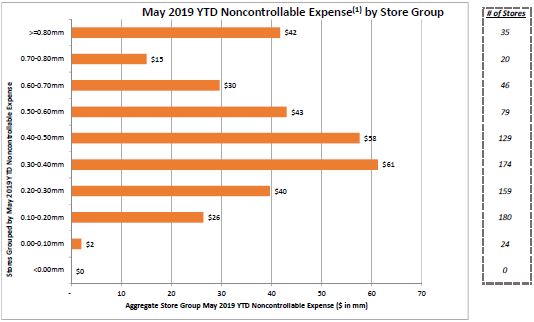
| (1) | Noncontrollable expenses include expenses relating to marketing, display, maintenance and repairs, among others. |
| (1) | 4-Wall EBITDA is an internal store performance metric, which excludes most corporate overhead and other fixed allocated costs. Monthly 4-Wall EBITDA numbers do not reflect certain allocations made only on an annual basis. |
| (1) | Operating Profit is an internal store performance metric, which excludes most corporate overhead and other fixed allocated costs. |
| (1) | Controllable expenses include store salaries, facilities expenses and utilities expenses, among others. |
| (1) | Noncontrollable expenses include expenses relating to marketing, display, maintenance and repairs, among others. |
| (1) | 4-Wall EBITDA is an internal store performance metric, which excludes most corporate overhead and other fixed allocated costs. Monthly 4-Wall EBITDA numbers do not reflect certain allocations made only on an annual basis. |
| (1) | Operating Profit is an internal store performance metric, which excludes most corporate overhead and other fixed allocated costs. |
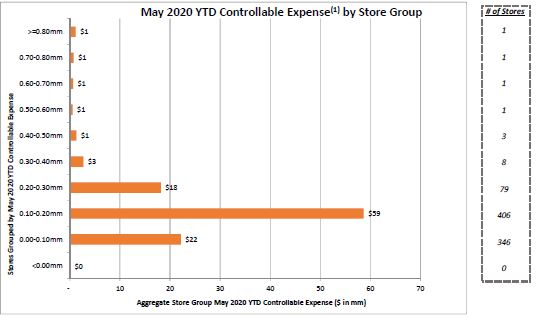
| (1) | Controllable expenses include store salaries, facilities expenses and utilities expenses, among others. |
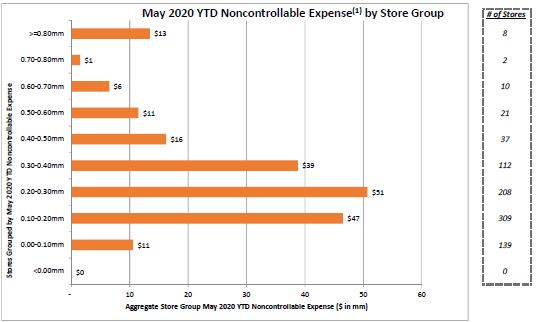
| (1) | Noncontrollable expenses include expenses relating to marketing, display, maintenance and repairs, among others. |
| (1) | 4-Wall EBITDA is an internal store performance metric, which excludes most corporate overhead and other fixed allocated costs. Monthly 4-Wall EBITDA numbers do not reflect certain allocations made only on an annual basis. |
| (1) | Operating Profit is an internal store performance metric, which excludes most corporate overhead and other fixed allocated costs. |
| (1) | Controllable expenses include store salaries, facilities expenses and utilities expenses, among others. |
| (1) | Noncontrollable expenses include expenses relating to marketing, display, maintenance and repairs, among others. |