Attached files
| file | filename |
|---|---|
| EX-99.1 - EXHIBIT 99.1 - GMS Inc. | tm2023399d1_ex99-1.htm |
| 8-K - FORM 8-K - GMS Inc. | tm2023399d1_8k.htm |
Exhibit 99.2
June 25, 2020 Q4 FY 2020 Earnings Conference Call

2 Safe Harbor and Basis of Presentation Forward - Looking Statement Safe Harbor - This presentation includes “forward - looking statements” within the meaning of the Private Securities Litigation Reform Act of 1995. You can generally identify forward - looking statements by the Company’s use of forward - looking terminology such as “anticip ate,” “believe,” “continue,” “could,” “estimate,” “expect,” “intend,” “may,” “might,” “plan,” “potential,” “predict,” “seek,” or “should,” or the negative thereof or other variations thereon or comparable terminology. In particular, statements about the markets in which GMS operates and the economy generally, actions taken to op tim ize our operations and align our business consistent with demand, our ability to continue successfully navigating the evolving operating environment, strategi c i nitiatives and growth potential across the Company’s business, our efforts in response to COVID - 19, our efforts in response to COVID - 19, future financial performance, the ability of the Company to grow stronger, and the ability to deliver growth value creation and long - term success contained in this presentation may be considere d forward - looking statements. and the ability to deliver growth, value creation and long - term success contained in this press release may be considered forward - lookin g statements. The Company has based forward - looking statements on its current expectations, assumptions, estimates and projections. While the Company believes these expectations, assumptions, estimates and projections are reasonable, such forward - looking statements are only predictions and involve known and unknown risks and unc ertainties, many of which are beyond its control, including current public health issues that may affect the Company’s business. Forward - looking statements involve r isks and uncertainties, including, but not limited to, those described in the “Risk Factors” section in the Company’s most recent Annual Report on Form 10 - K, and in its ot her periodic reports filed with the SEC. In addition, the statements in this release are made as of June 25, 2020. The Company undertakes no obligation to update any of the forward - looking statements made herein, whether as a result of new information, future events, changes in expectation or otherwise. These forward - looking statem ents should not be relied upon as representing the Company’s views as of any date subsequent to June 25, 2020. Use of Non - GAAP and Adjusted Financial Information - To supplement GAAP financial information, we use adjusted measures of operating results which are non - GAAP measures. This non - GAAP adjusted financial information is provided as additional information for investors. These adjusted results exclude certain costs, expenses, gains and losses, and we believe their exclusion can enhance an overall understanding of our past financial perform anc e and also our prospects for the future. These adjustments to our GAAP results are made with the intent of providing both management and investors a more complete und ers tanding of our operating performance by excluding non - recurring, infrequent or other non - cash charges that are not believed to be material to the ongoing performance of our business. The presentation of this additional information is not meant to be considered in isolation or as a substitute for GAAP measures o f n et income, diluted earnings per share or net cash provided by (used in) operating activities prepared in accordance with generally accepted accounting principles in the U nit ed States. Please see the Appendix to this presentation for a further discussion on these non - GAAP measures and a reconciliation of these non - GAAP measures to the most dir ectly comparable GAAP measures.

3 Health and Safety Response to COVID - 19 The health, safety and wellbeing of our employees, business partners and communities remains our top priority. Enhanced operating protocols in compliance with public health requirements, recommendations and guidelines: Curtailed non - essential travel and meetings Implemented routine cleaning and sanitation Practicing social distancing Restricted or modified access to facilities Employees who can do so work from home Appropriate use of PPE Sincere appreciation to all teammates who continue to be engaged, focused and proactive as we come together to support customers and each other during this time We express deep gratitude to first responders, healthcare providers and essential workers who are on the frontlines every day
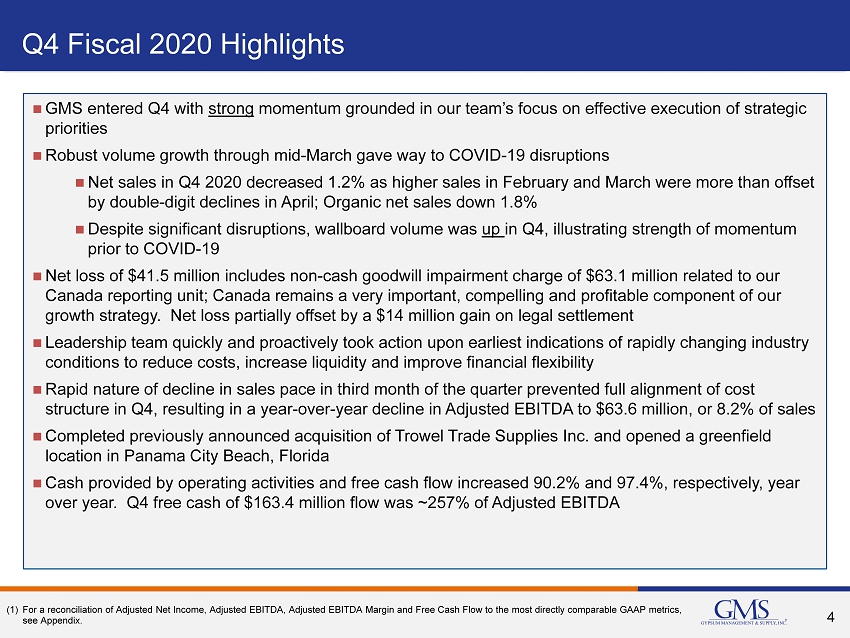
4 Q4 Fiscal 2020 Highlights GMS entered Q4 with strong momentum grounded in our team’s focus on effective execution of strategic priorities Robust volume growth through mid - March gave way to COVID - 19 disruptions Net sales in Q4 2020 decreased 1.2% as higher sales in February and March were more than offset by double - digit declines in April; Organic net sales down 1.8% Despite significant disruptions, wallboard volume was up in Q4, illustrating strength of momentum prior to COVID - 19 Net loss of $41.5 million includes non - cash goodwill impairment charge of $63.1 million related to our Canada reporting unit; Canada remains a very important, compelling and profitable component of our growth strategy. Net loss partially offset by a $14 million gain on legal settlement Leadership team quickly and proactively took action upon earliest indications of rapidly changing industry conditions to reduce costs, increase liquidity and improve financial flexibility Rapid nature of decline in sales pace in third month of the quarter prevented full alignment of cost structure in Q4, resulting in a year - over - year decline in Adjusted EBITDA to $63.6 million, or 8.2% of sales Completed previously announced acquisition of Trowel Trade Supplies Inc. and opened a greenfield location in Panama City Beach, Florida Cash provided by operating activities and free cash flow increased 90.2% and 97.4%, respectively, year over year. Q4 free cash of $163.4 million flow was ~257% of Adjusted EBITDA (1) For a reconciliation of Adjusted Net Income, Adjusted EBITDA, Adjusted EBITDA Margin and Free Cash Flow to the most directly com parable GAAP metrics, see Appendix.
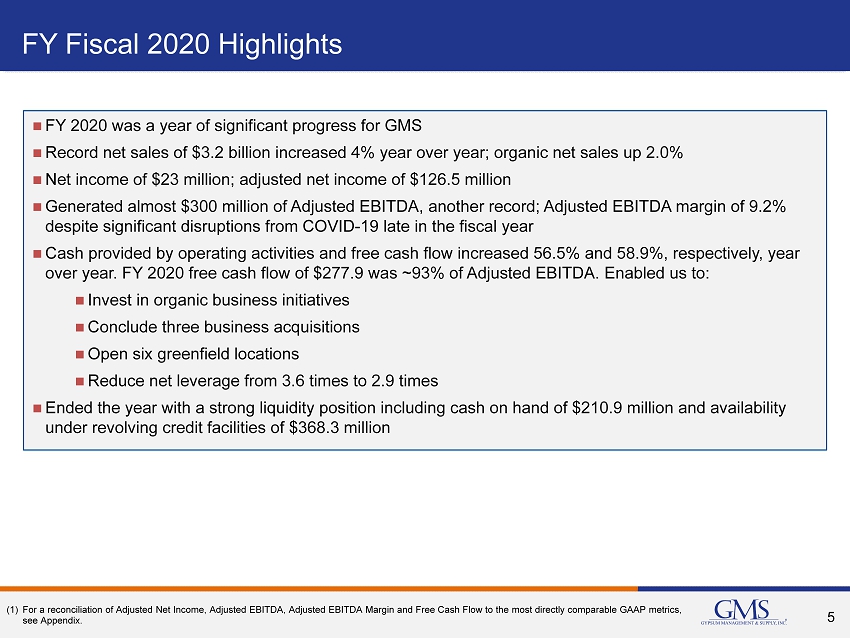
5 FY Fiscal 2020 Highlights FY 2020 was a year of significant progress for GMS Record net sales of $3.2 billion increased 4% year over year; organic net sales up 2.0% Net income of $23 million; adjusted net income of $126.5 million Generated almost $300 million of Adjusted EBITDA, another record; Adjusted EBITDA margin of 9.2% despite significant disruptions from COVID - 19 late in the fiscal year Cash provided by operating activities and free cash flow increased 56.5% and 58.9%, respectively, year over year. FY 2020 free cash flow of $277.9 was ~93% of Adjusted EBITDA. Enabled us to: Invest in organic business initiatives Conclude three business acquisitions Open six greenfield locations Reduce net leverage from 3.6 times to 2.9 times Ended the year with a strong liquidity position including cash on hand of $210.9 million and availability under revolving credit facilities of $368.3 million (1) For a reconciliation of Adjusted Net Income, Adjusted EBITDA, Adjusted EBITDA Margin and Free Cash Flow to the most directly com parable GAAP metrics, see Appendix.
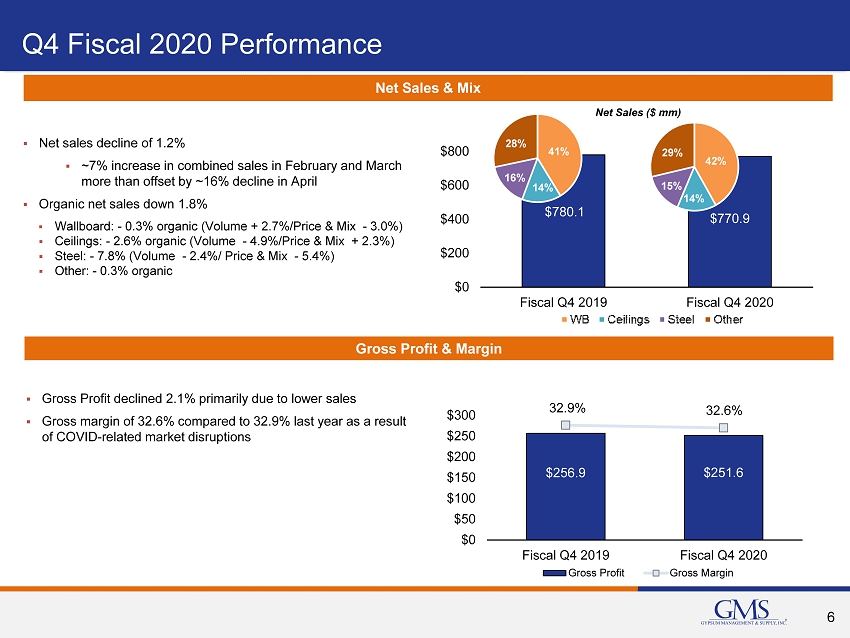
6 Q4 Fiscal 2020 Performance Net Sales & Mix $780.1 $770.9 $0 $200 $400 $600 $800 Fiscal Q4 2019 Fiscal Q4 2020 41% 14% 16% 28% ▪ Net sales decline of 1.2% ▪ ~7% increase in combined sales in February and March more than offset by ~16% decline in April ▪ Organic net sales down 1.8% ▪ Wallboard: - 0.3% organic (Volume + 2.7%/Price & Mix - 3.0%) ▪ Ceilings: - 2.6% organic (Volume - 4.9%/Price & Mix + 2.3%) ▪ Steel: - 7.8% (Volume - 2.4%/ Price & Mix - 5.4%) ▪ Other: - 0.3% organic Net Sales ($ mm) 42% 14% 15% 29% Gross Profit & Margin $256.9 $251.6 32.9% 32.6% 20.0% 20.5% 21.0% 21.5% 22.0% 22.5% 23.0% 23.5% 24.0% 24.5% 25.0% 25.5% 26.0% 26.5% 27.0% 27.5% 28.0% 28.5% 29.0% 29.5% 30.0% 30.5% 31.0% 31.5% 32.0% 32.5% 33.0% 33.5% 34.0% $0 $50 $100 $150 $200 $250 $300 Fiscal Q4 2019 Fiscal Q4 2020 Gross Profit Gross Margin ▪ Gross Profit declined 2.1% primarily due to lower sales ▪ Gross margin of 32.6% compared to 32.9% last year as a result of COVID - related market disruptions
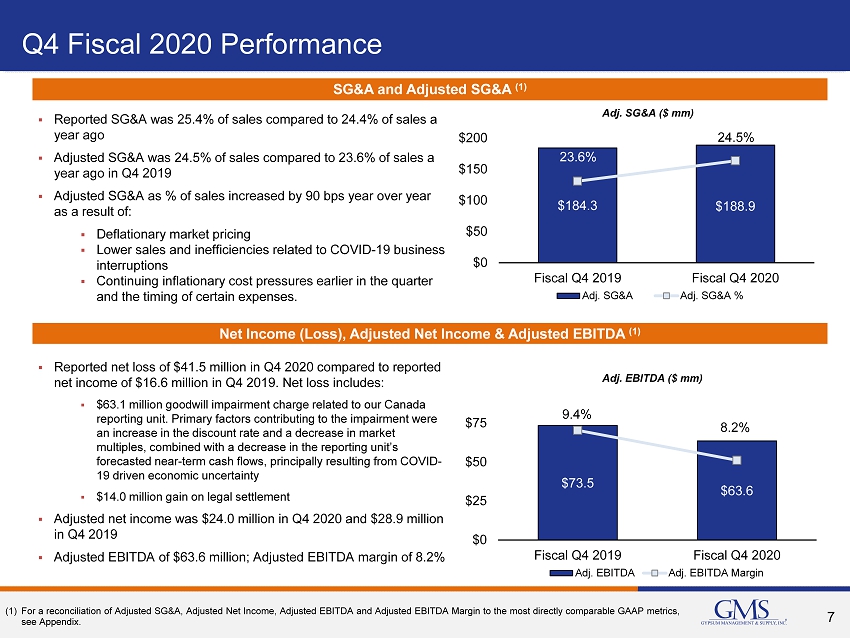
7 SG&A and Adjusted SG&A (1) Q4 Fiscal 2020 Performance ▪ Reported SG&A was 25.4% of sales compared to 24.4% of sales a year ago ▪ Adjusted SG&A was 24.5% of sales compared to 23.6% of sales a year ago in Q4 2019 ▪ Adjusted SG&A as % of sales increased by 90 bps year over year as a result of: ▪ Deflationary market pricing ▪ Lower sales and inefficiencies related to COVID - 19 business interruptions ▪ Continuing inflationary cost pressures earlier in the quarter and the timing of certain expenses. Adj. SG&A ($ mm) 7.9% 9.4% (1) For a reconciliation of Adjusted SG&A, Adjusted Net Income, Adjusted EBITDA and Adjusted EBITDA Margin to the most directly c omp arable GAAP metrics, see Appendix. $184.3 $188.9 23.6% 24.5% 20.0% 20.5% 21.0% 21.5% 22.0% 22.5% 23.0% 23.5% 24.0% 24.5% 25.0% 25.5% $0 $50 $100 $150 $200 Fiscal Q4 2019 Fiscal Q4 2020 Adj. SG&A Adj. SG&A % Net Income (Loss), Adjusted Net Income & Adjusted EBITDA (1) ▪ Reported net loss of $41.5 million in Q4 2020 compared to reported net income of $16.6 million in Q4 2019. Net loss includes: ▪ $63.1 million goodwill impairment charge related to our Canada reporting unit. P rimary factors contributing to the impairment were an increase in the discount rate and a decrease in market multiples, combined with a decrease in the reporting unit’s forecasted near - term cash flows, principally resulting from COVID - 19 driven economic uncertainty ▪ $14.0 million gain on legal settlement ▪ Adjusted net income was $24.0 million in Q4 2020 and $28.9 million in Q4 2019 ▪ Adjusted EBITDA of $63.6 million; Adjusted EBITDA margin of 8.2% $73.5 $63.6 9.4% 8.2% 5.0% 5.5% 6.0% 6.5% 7.0% 7.5% 8.0% 8.5% 9.0% 9.5% 10.0% $0 $25 $50 $75 Fiscal Q4 2019 Fiscal Q4 2020 Adj. EBITDA Adj. EBITDA Margin Adj. EBITDA ($ mm)
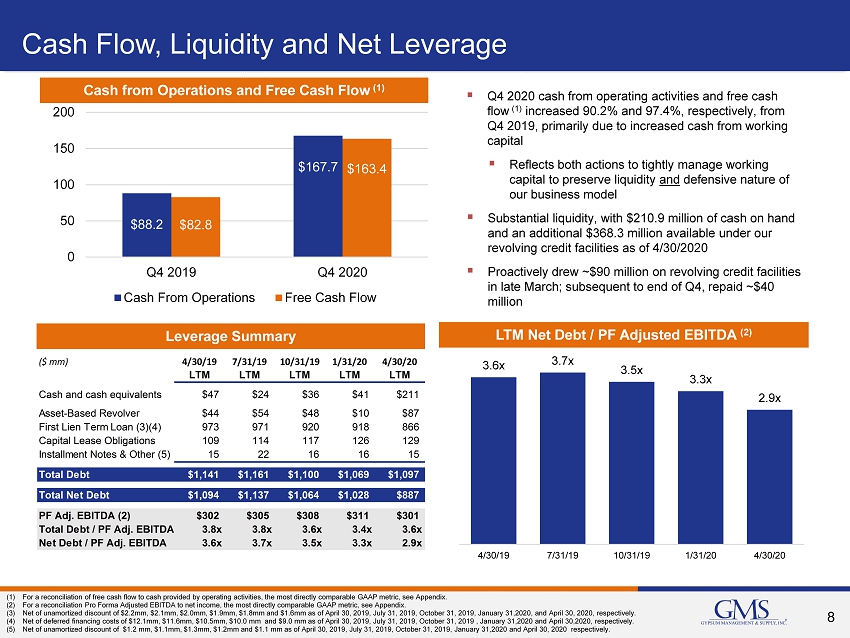
8 Cash Flow, Liquidity and Net Leverage ▪ Q4 2020 cash from operating activities and free cash flow (1) increased 90.2% and 97.4%, respectively, from Q4 2019, primarily due to increased cash from working capital ▪ Reflects both actions to tightly manage working capital to preserve liquidity and defensive nature of our business model ▪ Substantial liquidity, with $210.9 million of cash on hand and an additional $368.3 million available under our revolving credit facilities as of 4/30/2020 ▪ Proactively drew ~$90 million on revolving credit facilities in late March; subsequent to end of Q4, repaid ~$40 million Leverage Summary LTM Net Debt / PF Adjusted EBITDA (2) (1) For a reconciliation of free cash flow to cash provided by operating activities, the most directly comparable GAAP metric, se e A ppendix. (2) For a reconciliation Pro Forma Adjusted EBITDA to net income, the most directly comparable GAAP metric, see Appendix. (3) Net of unamortized discount of $2.2mm, $2.1mm, $2.0mm, $1.9mm, $1.8mm and $1.6mm as of April 30, 2019, July 31, 2019, October 31 , 2019, January 31,2020, and April 30, 2020, respectively. (4) Net of deferred financing costs of $12.1mm, $11.6mm, $10.5mm, $10.0 mm and $9.0 mm as of April 30, 2019, July 31, 2019, Octo ber 31, 2019 , January 31,2020 and April 30,2020, respectively. (5) Net of unamortized discount of $1.2 mm, $1.1mm, $1.3mm, $1.2mm and $1.1 mm as of April 30, 2019, July 31, 2019, October 31, 201 9, January 31,2020 and April 30, 2020 respectively. Cash from Operations and Free Cash Flow (1) $88.2 $167.7 $82.8 $163.4 0 50 100 150 200 Q4 2019 Q4 2020 Cash From Operations Free Cash Flow 3.6 x 3.7 x 3.5 x 3.3 x 2.9 x 4/30/19 7/31/19 10/31/19 1/31/20 4/30/20 ($ mm) 4/30/19 7/31/19 10/31/19 1/31/20 4/30/20 LTM LTM LTM LTM LTM Cash and cash equivalents $47 $24 $36 $41 $211 Asset-Based Revolver $44 $54 $48 $10 $87 First Lien Term Loan (3)(4) 973 971 920 918 866 Capital Lease Obligations 109 114 117 126 129 Installment Notes & Other (5) 15 22 16 16 15 Total Debt $1,141 $1,161 $1,100 $1,069 $1,097 Total Net Debt $1,094 $1,137 $1,064 $1,028 $887 PF Adj. EBITDA (2) $302 $305 $308 $311 $301 Total Debt / PF Adj. EBITDA 3.8x 3.8x 3.6x 3.4x 3.6x Net Debt / PF Adj. EBITDA 3.6x 3.7x 3.5x 3.3x 2.9x
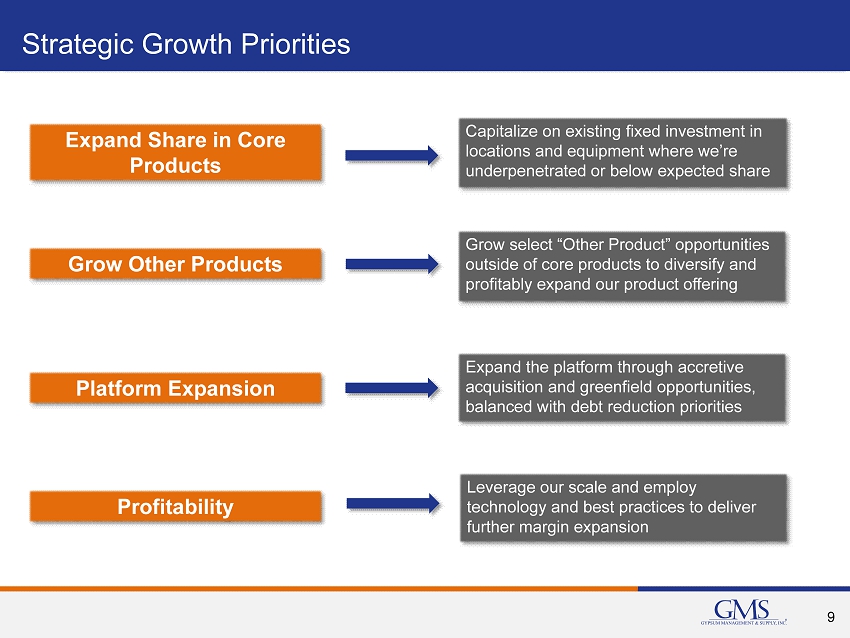
9 Expand Share in Core Products Grow Other Products Platform Expansion Capitalize on existing fixed investment in locations and equipment where we’re underpenetrated or below expected share Grow select “Other Product” opportunities outside of core products to diversify and profitably expand our product offering Expand the platform through accretive acquisition and greenfield opportunities, balanced with debt reduction priorities Strategic Growth Priorities Profitability Leverage our scale and employ technology and best practices to deliver further margin expansion

10 GMS is Well - Positioned Both Now and for the Long - Term • Proactive and decisive responses to COVID - 19 pandemic and resulting business conditions to reduce costs, increase liquidity and improve financial flexibility • Strong cash flow generation resulting from defensive nature of business model and tight management of working capital • Healthy balance sheet and strong liquidity position • A North American market leader in specialty distribution of interior construction products • Significant scale combined with local expertise • Differentiated service model • Entrepreneurial culture • Executing on strategic priorities to capitalize on long - term growth opportunities
Appendix
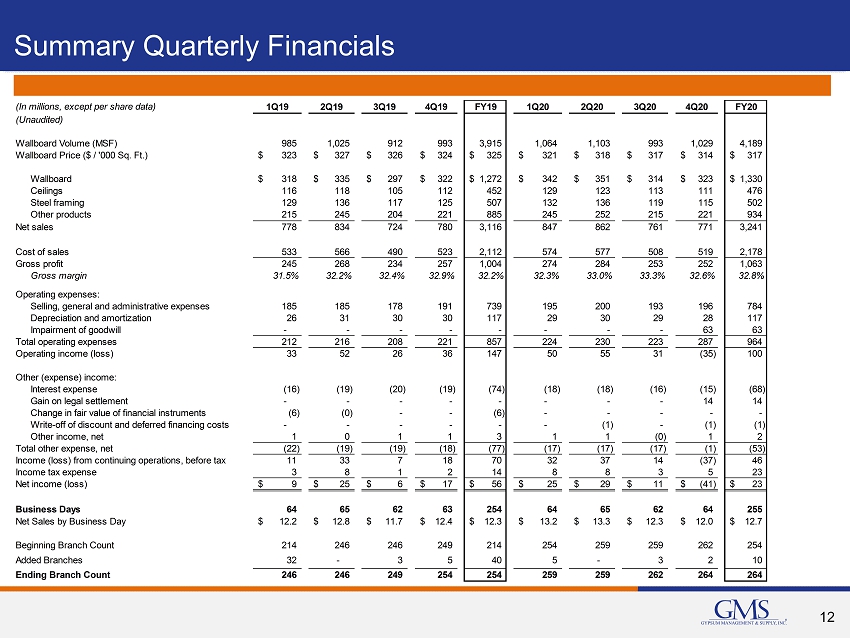
12 Summary Quarterly Financials (In millions, except per share data) 1Q19 2Q19 3Q19 4Q19 FY19 1Q20 2Q20 3Q20 4Q20 FY20 (Unaudited) Wallboard Volume (MSF) 985 1,025 912 993 3,915 1,064 1,103 993 1,029 4,189 Wallboard Price ($ / '000 Sq. Ft.) 323$ 327$ 326$ 324$ 325$ 321$ 318$ 317$ 314$ 317$ Wallboard 318$ 335$ 297$ 322$ 1,272$ 342$ 351$ 314$ 323$ 1,330$ Ceilings 116 118 105 112 452 129 123 113 111 476 Steel framing 129 136 117 125 507 132 136 119 115 502 Other products 215 245 204 221 885 245 252 215 221 934 Net sales 778 834 724 780 3,116 847 862 761 771 3,241 Cost of sales 533 566 490 523 2,112 574 577 508 519 2,178 Gross profit 245 268 234 257 1,004 274 284 253 252 1,063 Gross margin 31.5% 32.2% 32.4% 32.9% 32.2% 32.3% 33.0% 33.3% 32.6% 32.8% Operating expenses: Selling, general and administrative expenses 185 185 178 191 739 195 200 193 196 784 Depreciation and amortization 26 31 30 30 117 29 30 29 28 117 Impairment of goodwill - - - - - - - - 63 63 Total operating expenses 212 216 208 221 857 224 230 223 287 964 Operating income (loss) 33 52 26 36 147 50 55 31 (35) 100 Other (expense) income: Interest expense (16) (19) (20) (19) (74) (18) (18) (16) (15) (68) Gain on legal settlement - - - - - - - - 14 14 Change in fair value of financial instruments (6) (0) - - (6) - - - - - Write-off of discount and deferred financing costs - - - - - - (1) - (1) (1) Other income, net 1 0 1 1 3 1 1 (0) 1 2 Total other expense, net (22) (19) (19) (18) (77) (17) (17) (17) (1) (53) Income (loss) from continuing operations, before tax 11 33 7 18 70 32 37 14 (37) 46 Income tax expense 3 8 1 2 14 8 8 3 5 23 Net income (loss) 9$ 25$ 6$ 17$ 56$ 25$ 29$ 11$ (41)$ 23$ Business Days 64 65 62 63 254 64 65 62 64 255 Net Sales by Business Day 12.2$ 12.8$ 11.7$ 12.4$ 12.3$ 13.2$ 13.3$ 12.3$ 12.0$ 12.7$ Beginning Branch Count 214 246 246 249 214 254 259 259 262 254 Added Branches 32 - 3 5 40 5 - 3 2 10 Ending Branch Count 246 246 249 254 254 259 259 262 264 264
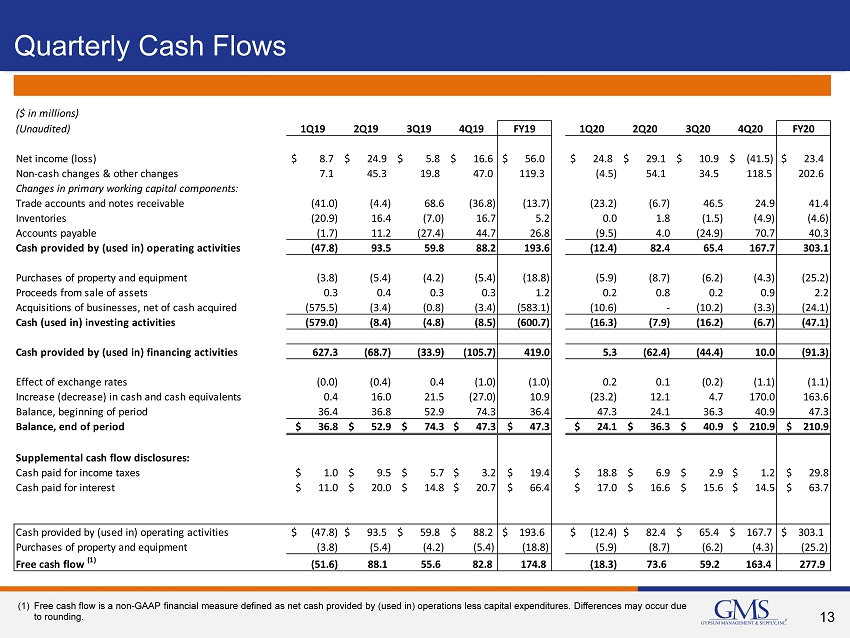
13 Quarterly Cash Flows (1) Free cash flow is a non - GAAP financial measure defined as net cash provided by (used in) operations less capital expenditures. D ifferences may occur due to rounding. ($ in millions) (Unaudited) 1Q19 2Q19 3Q19 4Q19 FY19 1Q20 2Q20 3Q20 4Q20 FY20 Net income (loss) $ 8.7 $ 24.9 $ 5.8 $ 16.6 $ 56.0 $ 24.8 $ 29.1 $ 10.9 $ (41.5) $ 23.4 Non-cash changes & other changes 7.1 45.3 19.8 47.0 119.3 (4.5) 54.1 34.5 118.5 202.6 Changes in primary working capital components: Trade accounts and notes receivable (41.0) (4.4) 68.6 (36.8) (13.7) (23.2) (6.7) 46.5 24.9 41.4 Inventories (20.9) 16.4 (7.0) 16.7 5.2 0.0 1.8 (1.5) (4.9) (4.6) Accounts payable (1.7) 11.2 (27.4) 44.7 26.8 (9.5) 4.0 (24.9) 70.7 40.3 Cash provided by (used in) operating activities (47.8) 93.5 59.8 88.2 193.6 (12.4) 82.4 65.4 167.7 303.1 Purchases of property and equipment (3.8) (5.4) (4.2) (5.4) (18.8) (5.9) (8.7) (6.2) (4.3) (25.2) Proceeds from sale of assets 0.3 0.4 0.3 0.3 1.2 0.2 0.8 0.2 0.9 2.2 Acquisitions of businesses, net of cash acquired (575.5) (3.4) (0.8) (3.4) (583.1) (10.6) - (10.2) (3.3) (24.1) Cash (used in) investing activities (579.0) (8.4) (4.8) (8.5) (600.7) (16.3) (7.9) (16.2) (6.7) (47.1) Cash provided by (used in) financing activities 627.3 (68.7) (33.9) (105.7) 419.0 5.3 (62.4) (44.4) 10.0 (91.3) Effect of exchange rates (0.0) (0.4) 0.4 (1.0) (1.0) 0.2 0.1 (0.2) (1.1) (1.1) Increase (decrease) in cash and cash equivalents 0.4 16.0 21.5 (27.0) 10.9 (23.2) 12.1 4.7 170.0 163.6 Balance, beginning of period 36.4 36.8 52.9 74.3 36.4 47.3 24.1 36.3 40.9 47.3 Balance, end of period $ 36.8 $ 52.9 $ 74.3 $ 47.3 $ 47.3 $ 24.1 $ 36.3 $ 40.9 $ 210.9 $ 210.9 Supplemental cash flow disclosures: Cash paid for income taxes $ 1.0 $ 9.5 $ 5.7 $ 3.2 $ 19.4 $ 18.8 $ 6.9 $ 2.9 $ 1.2 $ 29.8 Cash paid for interest $ 11.0 $ 20.0 $ 14.8 $ 20.7 $ 66.4 $ 17.0 $ 16.6 $ 15.6 $ 14.5 $ 63.7 Cash provided by (used in) operating activities $ (47.8) $ 93.5 $ 59.8 $ 88.2 $ 193.6 $ (12.4) $ 82.4 $ 65.4 $ 167.7 $ 303.1 Purchases of property and equipment (3.8) (5.4) (4.2) (5.4) (18.8) (5.9) (8.7) (6.2) (4.3) (25.2) Free cash flow (1) (51.6) 88.1 55.6 82.8 174.8 (18.3) 73.6 59.2 163.4 277.9
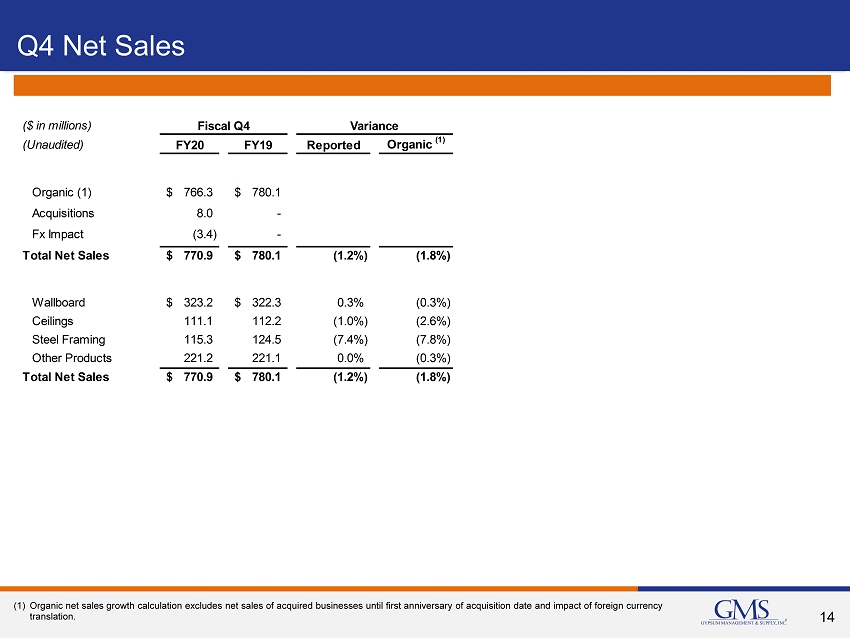
14 Q4 Net Sales (1) Organic net sales growth calculation excludes net sales of acquired businesses until first anniversary of acquisition date an d i mpact of foreign currency translation. ($ in millions) (Unaudited) FY20 FY19 Reported Organic (1) Organic (1) 766.3$ 780.1$ Acquisitions 8.0 - Fx Impact (3.4) - Total Net Sales 770.9$ 780.1$ (1.2%) (1.8%) Wallboard 323.2$ 322.3$ 0.3% (0.3%) Ceilings 111.1 112.2 (1.0%) (2.6%) Steel Framing 115.3 124.5 (7.4%) (7.8%) Other Products 221.2 221.1 0.0% (0.3%) Total Net Sales 770.9$ 780.1$ (1.2%) (1.8%) Fiscal Q4 Variance
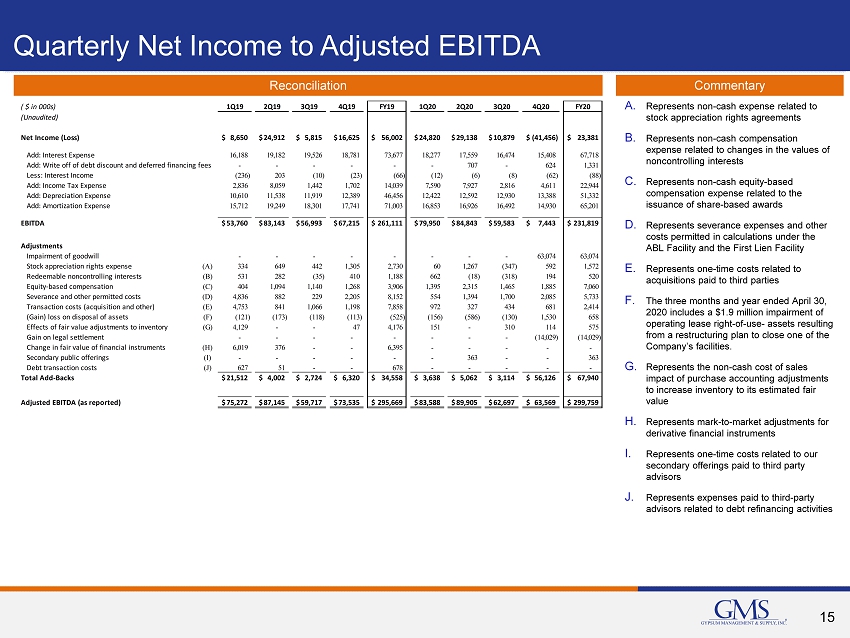
15 Quarterly Net Income to Adjusted EBITDA Reconciliation Commentary A. Represents non - cash expense related to stock appreciation rights agreements B. Represents non - cash compensation expense related to changes in the values of noncontrolling interests C. Represents non - cash equity - based compensation expense related to the issuance of share - based awards D. Represents severance expenses and other costs permitted in calculations under the ABL Facility and the First Lien Facility E. Represents one - time costs related to acquisitions paid to third parties F. The three months and year ended April 30, 2020 includes a $1.9 million impairment of operating lease right - of - use - assets resulting from a restructuring plan to close one of the Company’s facilities. G. Represents the non - cash cost of sales impact of purchase accounting adjustments to increase inventory to its estimated fair value H. Represents mark - to - market adjustments for derivative financial instruments I. Represents one - time costs related to our secondary offerings paid to third party advisors J. Represents expenses paid to third - party advisors related to debt refinancing activities ( $ in 000s) 1Q19 2Q19 3Q19 4Q19 FY19 1Q20 2Q20 3Q20 4Q20 FY20 (Unaudited) Net Income (Loss) 8,650$ 24,912$ 5,815$ 16,625$ 56,002$ 24,820$ 29,138$ 10,879$ (41,456)$ 23,381$ Add: Interest Expense 16,188 19,182 19,526 18,781 73,677 18,277 17,559 16,474 15,408 67,718 Add: Write off of debt discount and deferred financing fees - - - - - - 707 - 624 1,331 Less: Interest Income (236) 203 (10) (23) (66) (12) (6) (8) (62) (88) Add: Income Tax Expense 2,836 8,059 1,442 1,702 14,039 7,590 7,927 2,816 4,611 22,944 Add: Depreciation Expense 10,610 11,538 11,919 12,389 46,456 12,422 12,592 12,930 13,388 51,332 Add: Amortization Expense 15,712 19,249 18,301 17,741 71,003 16,853 16,926 16,492 14,930 65,201 EBITDA 53,760$ 83,143$ 56,993$ 67,215$ 261,111$ 79,950$ 84,843$ 59,583$ 7,443$ 231,819$ Adjustments Impairment of goodwill - - - - - - - - 63,074 63,074 Stock appreciation rights expense (A) 334 649 442 1,305 2,730 60 1,267 (347) 592 1,572 Redeemable noncontrolling interests (B) 531 282 (35) 410 1,188 662 (18) (318) 194 520 Equity-based compensation (C) 404 1,094 1,140 1,268 3,906 1,395 2,315 1,465 1,885 7,060 Severance and other permitted costs (D) 4,836 882 229 2,205 8,152 554 1,394 1,700 2,085 5,733 Transaction costs (acquisition and other) (E) 4,753 841 1,066 1,198 7,858 972 327 434 681 2,414 (Gain) loss on disposal of assets (F) (121) (173) (118) (113) (525) (156) (586) (130) 1,530 658 Effects of fair value adjustments to inventory (G) 4,129 - - 47 4,176 151 - 310 114 575 Gain on legal settlement - - - - - - - - (14,029) (14,029) Change in fair value of financial instruments (H) 6,019 376 - - 6,395 - - - - - Secondary public offerings (I) - - - - - - 363 - - 363 Debt transaction costs (J) 627 51 - - 678 - - - - - Total Add-Backs 21,512$ 4,002$ 2,724$ 6,320$ 34,558$ 3,638$ 5,062$ 3,114$ 56,126$ 67,940$ Adjusted EBITDA (as reported) 75,272$ 87,145$ 59,717$ 73,535$ 295,669$ 83,588$ 89,905$ 62,697$ 63,569$ 299,759$
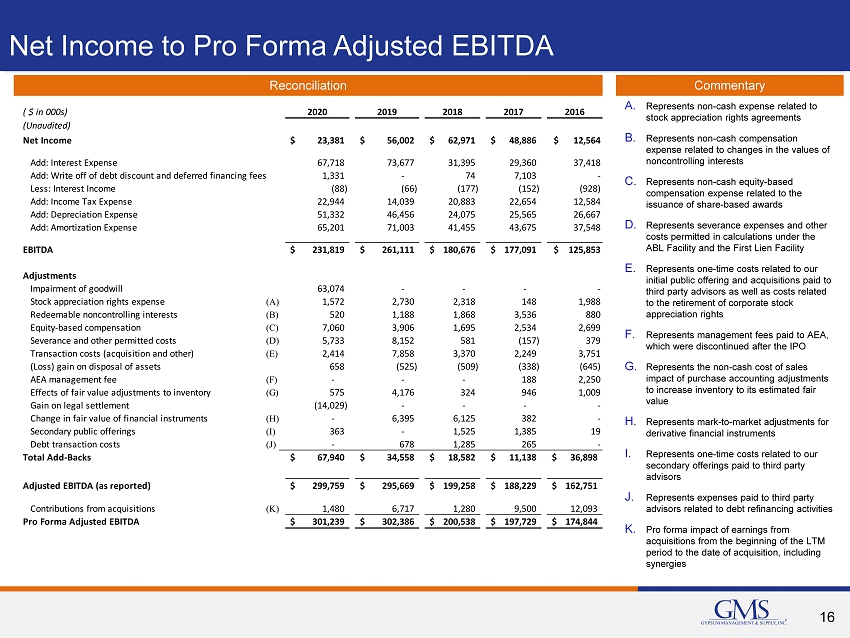
16 Net Income to Pro Forma Adjusted EBITDA Reconciliation Commentary A. Represents non - cash expense related to stock appreciation rights agreements B. Represents non - cash compensation expense related to changes in the values of noncontrolling interests C. Represents non - cash equity - based compensation expense related to the issuance of share - based awards D. Represents severance expenses and other costs permitted in calculations under the ABL Facility and the First Lien Facility E. Represents one - time costs related to our initial public offering and acquisitions paid to third party advisors as well as costs related to the retirement of corporate stock appreciation rights F. Represents management fees paid to AEA, which were discontinued after the IPO G. Represents the non - cash cost of sales impact of purchase accounting adjustments to increase inventory to its estimated fair value H. Represents mark - to - market adjustments for derivative financial instruments I. Represents one - time costs related to our secondary offerings paid to third party advisors J. Represents expenses paid to third party advisors related to debt refinancing activities K. Pro forma impact of earnings from acquisitions from the beginning of the LTM period to the date of acquisition, including synergies ( $ in 000s) 2020 2019 2018 2017 2016 (Unaudited) Net Income 23,381$ 56,002$ 62,971$ 48,886$ $ 12,564 Add: Interest Expense 67,718 73,677 31,395 29,360 37,418 Add: Write off of debt discount and deferred financing fees 1,331 - 74 7,103 - Less: Interest Income (88) (66) (177) (152) (928) Add: Income Tax Expense 22,944 14,039 20,883 22,654 12,584 Add: Depreciation Expense 51,332 46,456 24,075 25,565 26,667 Add: Amortization Expense 65,201 71,003 41,455 43,675 37,548 EBITDA 231,819$ 261,111$ 180,676$ 177,091$ $ 125,853 Adjustments Impairment of goodwill 63,074 - - - - Stock appreciation rights expense (A) 1,572 2,730 2,318 148 1,988 Redeemable noncontrolling interests (B) 520 1,188 1,868 3,536 880 Equity-based compensation (C) 7,060 3,906 1,695 2,534 2,699 Severance and other permitted costs (D) 5,733 8,152 581 (157) 379 Transaction costs (acquisition and other) (E) 2,414 7,858 3,370 2,249 3,751 (Loss) gain on disposal of assets 658 (525) (509) (338) (645) AEA management fee (F) - - - 188 2,250 Effects of fair value adjustments to inventory (G) 575 4,176 324 946 1,009 Gain on legal settlement (14,029) - - - - Change in fair value of financial instruments (H) - 6,395 6,125 382 - Secondary public offerings (I) 363 - 1,525 1,385 19 Debt transaction costs (J) - 678 1,285 265 - Total Add-Backs 67,940$ 34,558$ 18,582$ 11,138$ 36,898$ Adjusted EBITDA (as reported) 299,759$ 295,669$ 199,258$ 188,229$ 162,751$ Contributions from acquisitions (K) 1,480 6,717 1,280 9,500 12,093 Pro Forma Adjusted EBITDA 301,239$ 302,386$ 200,538$ 197,729$ 174,844$

17 Reconciliation of Income (loss) Before Taxes to Adjusted Net Income Reconciliation Commentary A. Depreciation and amortization from the increase in value of certain long - term assets associated with the April 1, 2014 acquisition of the predecessor company and the acquisition of Titan. B. Normalized cash tax rate determined based on our estimated taxes excluding the impact of purchase accounting and certain other deferred tax amounts. C. Diluted shares outstanding for periods prior to June 13, 2019 have been adjusted to include the effect of 1.1 million shares of equity issued in connection with the acquisition of Titan that were exchangeable for the Company’s common stock. On June 13, 2019, the holders exchanged all of the exchangeable shares for 1.1 million shares of the Company’s common stock. ($ in 000s) 4Q20 4Q19 FY20 FY19 (Unaudited) Income (loss) before taxes (36,845)$ 18,327$ 46,325$ 70,041$ EBITDA add-backs 56,126 6,320 67,940 34,558 Write-off of debt discount and deferred financing fees 624 - 1,331 - Purchase accounting depreciation and amortization (A) 11,038 12,369 47,568 49,619 Adjusted pre-tax income 30,943 37,016 163,164 154,218 Adjusted income tax expense 6,962 8,329 36,712 34,699 Adjusted net income 23,981$ 28,687$ 126,452$ 119,519$ Effective tax rate (B) 22.5% 22.5% 22.5% 22.5% Weighted average shares outstanding: Basic 42,435 40,487 41,853 40,914 Diluted (C) 42,826 42,105 42,637 42,718 Adjusted net income per share: Basic 0.57$ 0.71$ 3.02$ 2.92$ Diluted 0.56$ 0.68$ 2.97$ 2.80$

18 Reported SG&A to Adjusted SG&A Reconciliation Commentary A. Represents non - cash expense related to stock appreciation rights agreements B. Represents non - cash compensation expense related to changes in the values of noncontrolling interests C. Represents non - cash equity - based compensation expense related to the issuance of share - based awards D. Represents severance expenses and other costs permitted in calculations under the ABL Facility and the First Lien Facility E. Represents one - time costs related to acquisitions paid to third parties. F. The three months and year ended April 30, 2020 includes a $1.9 million impairment of operating lease right - of - use - assets resulting from a restructuring plan to close one of the Company’s facilities. G. Represents one - time costs related to our secondary offerings paid to third party advisors H. Represents expenses paid to third - party advisors related to debt refinancing activities (Unaudited) 1Q19 2Q19 3Q19 4Q19 FY2019 1Q20 2Q20 3Q20 4Q20 FY2020 ($ in millions) SG&A - Reported 185.4$ 185.3$ 178.2$ 190.6$ 739.5$ 194.6$ 200.5$ 193.4$ 195.6$ 784.1$ Adjustments Stock appreciation rights expense (A) (0.3) (0.6) (0.4) (1.3) (2.7) (0.1) (1.3) 0.3 (0.6) (1.6) Redeemable noncontrolling interests (B) (0.5) (0.3) 0.0 (0.4) (1.2) (0.7) 0.0 0.3 (0.2) (0.5) Equity-based compensation (C) (0.4) (1.1) (1.1) (1.3) (3.9) (1.4) (2.3) (1.5) (1.9) (7.1) Severance and other permitted costs (D) (4.8) (0.9) (0.2) (2.2) (8.2) (0.6) (1.4) (0.5) (1.9) (4.3) Transaction costs (acquisition and other) (E) (4.8) (0.8) (1.1) (1.2) (7.9) (1.0) (0.3) (0.4) (0.7) (2.4) Gain on disposal of assets (F) 0.1 0.2 0.1 0.1 0.5 0.2 0.6 0.1 (1.5) (0.7) Secondary public offerings (G) - - - - - - (0.4) - - (0.4) Debt transaction costs (H) (0.6) (0.1) - - (0.7) - - - - - SG&A - Adjusted 174.1$ 181.6$ 175.5$ 184.3$ 715.5$ 191.1$ 195.4$ 191.8$ 188.9$ 767.2$ % of net sales 22.4% 21.8% 24.2% 23.6% 23.0% 22.6% 22.7% 25.2% 24.5% 23.7%
www.gms.com