Attached files
| file | filename |
|---|---|
| 8-K - FORM 8-K - XG SCIENCES INC | e1998_8k.htm |

June 22, 2020
To: XG Sciences, Inc. Shareholders
From: Philip Rose, CEO
Re: First Quarter 2020 Report to Shareholders
Dear Shareholders:
I am pleased to provide this report on the first quarter 2020 performance and recent progress of XG Sciences, Inc. (the “Company”, “XGS”, “we” or “us”). Recently, we filed our Quarterly Report on Form 10-Q for the first quarter of 2020 with the SEC. Attached is a copy for your review, and directly below is a summary of certain financial metrics and key trends in our business. Please read these in conjunction with the 10-Q.
Financial Highlights
The following table summarizes the results of our operations. For the three months ending March 31, 2020 we reported revenue of $167,000, a 17.7% sequential increase from the $142,000 reported in Q4 2019 and an 80.5% decrease from the $857,000 reported in Q1 2019. The $690,000 year-over-year decrease in revenue is primarily due to three customers who purchased $774,000 of our products in the first quarter of 2019 but did not purchase any products in the first quarter of 2020. The largest of these three is Callaway Golf Company who, as reported in our last letter, is still working down excess inventory levels. All three of these customers are still using our material in production, and we expect they will resume purchasing our products in the next few quarters.
| For the Three Months Ended March 31, | Change 2020 to 2019 | |||||||||||||||
| 2020 | 2019 | $ | % | |||||||||||||
| Total Revenues | 167,063 | 857,278 | (690,215 | ) | -80.5 | % | ||||||||||
| Cost of Goods Sold | 762,483 | 1,174,622 | 412,139 | 35.1 | % | |||||||||||
| Gross Loss | (595,420 | ) | (317,344 | ) | (278,076 | ) | -87.6 | % | ||||||||
| Research & Development Expense | 285,727 | 385,245 | 99,518 | 25.8 | % | |||||||||||
| Sales, General & Administrative Expense | 1,292,135 | 1,420,922 | 128,787 | 9.1 | % | |||||||||||
| Total Operating Expenses | 1,577,862 | 1,806,167 | 228,305 | 12.6 | % | |||||||||||
| Operating Loss | (2,173,282 | ) | (2,123,511 | ) | (49,771 | ) | -2.3 | % | ||||||||
| Other Expense | (178,009 | ) | (76,665 | ) | 101,344 | -132.2 | % | |||||||||
| Net Loss | (1,995,273 | ) | (2,046,846 | ) | 51,573 | 2.5 | % | |||||||||
On the positive side, one customer purchased $38,700 of our products in the first three months of 2019 and $83,172 in the first three months of 2020, an increase of 115%. In addition, we have a strong customer pipeline and continue to establish a robust baseline of customers who are nearing commercial status. We believe that once these customers reach commercial status with products that incorporate our materials, each will begin to order from us on a regular basis, mitigating the quarterly revenue variability. However, until such time, we should expect to see variations in quarterly revenue driven by variable order patterns from our customers.
| 1 |
Commercialization Process and Trends
There are seemingly endless applications where graphene may be used. The current state of the industry is such that both material suppliers and potential end-users are working through the process of discovery related to where graphene can be used to differentiate products and create enough of a value proposition to warrant adoption at significant scale. Unfortunately, that process can be lengthy, and because graphene nanoplatelets are relatively new-to-the-world materials, progress toward commercial adoption is not linear. In every instance, the introduction of graphene must meet market paradigms for performance and cost and establish minimum baselines of value add to the customer’s product. There are several applications that are starting to benefit from the use of graphene nanoplatelets, but none have reached the scale of 100’s to 1,000’s of metric tons and the broader market is still in the initial stages of adoption. Currently, most applications only require 10’s of Kgs to 100’s of Kgs, and in some instances, multiple 1,000’s of Kgs.
Commercialization is a process, the exact timing of which is often difficult to predict. It starts with our own internal R&D to validate performance for an identified market or customer-specific need. Our customers then validate the performance of our materials and determine whether our products can be incorporated into their manufacturing processes. This is initially done at pilot production scale levels before our customers then introduce products that incorporate our materials to their own customers to validate performance. After successfully validating performance with their customers, our customers then move to commercial scale production. Every customer goes through the same processes, but each does so at different speeds, depending on the customer, product application, and end-use market. Thus, it is difficult to predict when our customers will begin ordering commercial volumes of our materials. However, as customers move through the commercialization process, we receive much more specific feedback and gain insights to their commercialization activities.
The following graphic demonstrates the commercialization trend over the past 8 fiscal quarters, as customers indicate their intent to commercialize applications and move into actively selling or promoting products that incorporate our material. Due to the coronavirus pandemic, several customers pushed out the timing for commercial adoption. As a result, the number of customers indicating their intent to commercialize in the next 6-9 months declined. Also, we experienced a reduction in the number of “commercial” customers, as some customers previously promoting their products to their customers suspended marketing efforts until such time as market conditions are more favorable. We anticipate we may continue to see customer delays due to COVID-19 over the next several quarters.
| 2 |

(a) Customer applications where our materials are used in customer products and they are actively selling them to their customers or actively promoting them for future sales.
(b) Customer applications where our customers are indicating that they expect to begin shipping products incorporating our materials in the next 3-6 months.
(c) Customer applications where our customers are indicating an intent to commercialize in the next 6-9 months.
Many additional customers are demonstrating efficacy and moving through qualification process.
Pipeline Opportunities
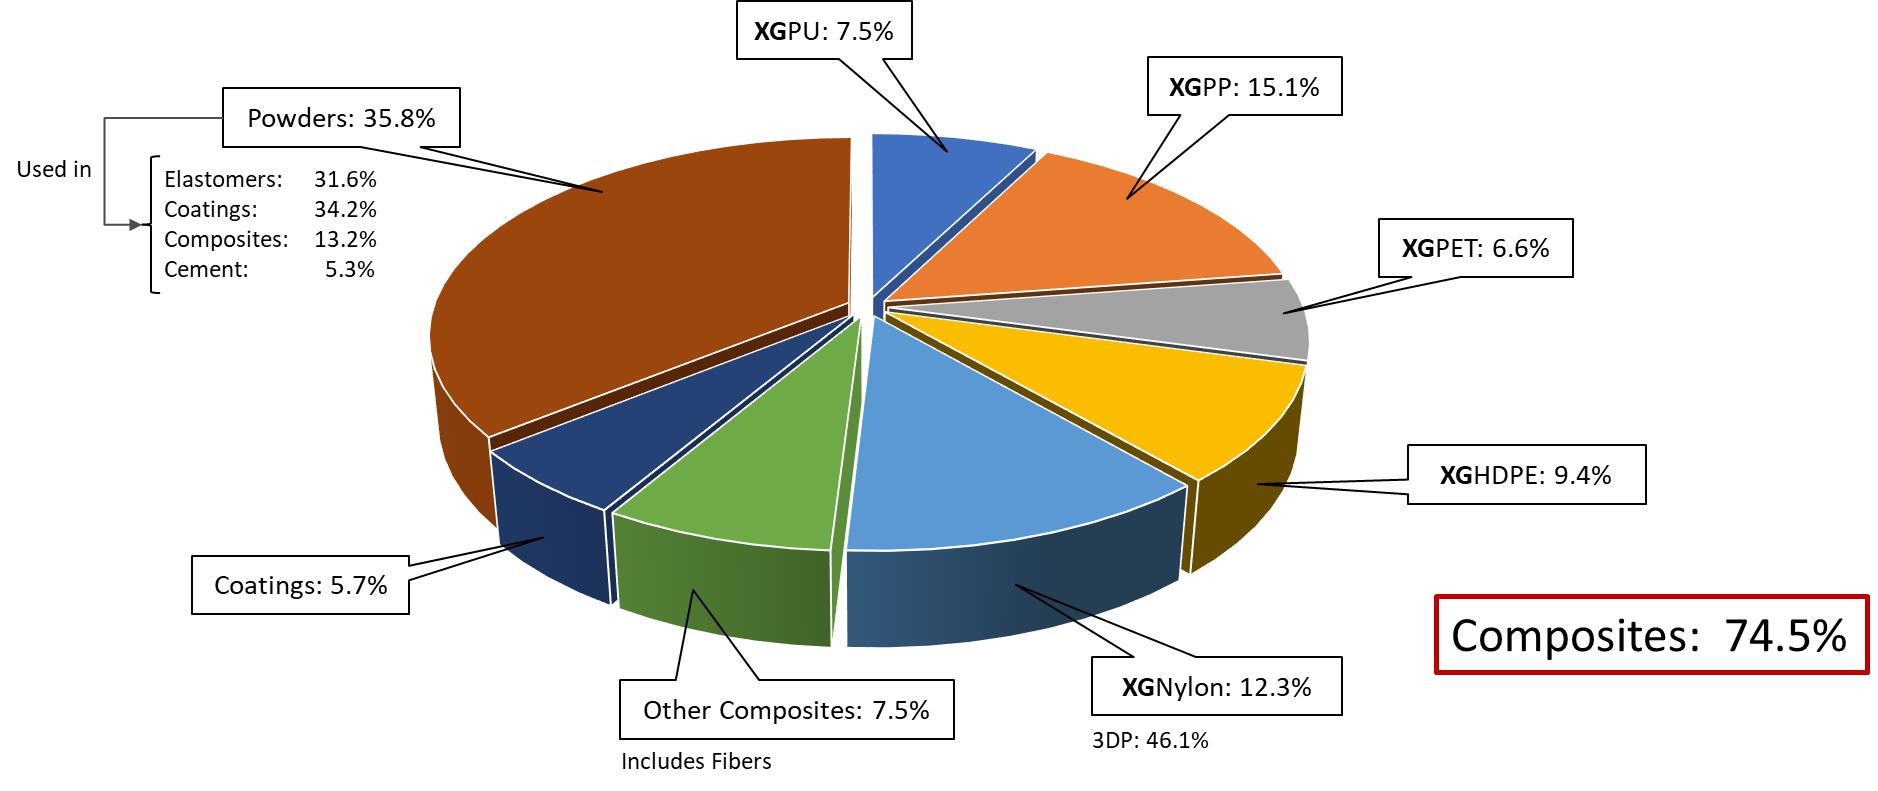
Despite the disruptions we are currently experiencing from the COVID-19 pandemic, we believe our customer pipeline is robust. Approximately 75% of our pipeline activity is focused on demonstrating the value proposition of our products in composites combining graphene nanoplatelets with thermoplastics. We focus on a subset of thermoplastics including polyethylene terephthalate (PET), high-density polyethylene (HDPE), nylon, polypropylene (PP) and various rubber-like elastomers. We sell our graphene nanoplatelets in the form of powders, slurries, and cakes, in addition to master batches of graphene nanoplatelets pre-mixed into various thermoplastics. We call the later form, “integrated products”, because they incorporate graphene nanoplatelets into a separate matrix to facilitate their ease of adoption by our customers and optimize their performance in an application. The below graphic is a representation of our customer pipeline as a function of products offered, demonstrating the product families that form our customer and end-market engagements.
| 3 |
We continue to make progress in demonstrating the performance of our products in various new market applications. For example, XGHDPE™ (a masterbatch of HDPE and xGnP® graphene nanoplatelets) is targeted for use in packaging applications, where a primary market need is to increase strength. Higher strength allows for a reduction in the amount of plastic, which contributes to sustainability targets and reduced cost. We have demonstrated up to a 30% improvement in mechanical properties, which meets the performance requirements of many customers. Samples are in testing with a limited number of customers, and pending positive feedback, we will extend sampling to other customers. Performance improvements were also made in XGPP™, XGPU and XGPA6 (nylon). More recently, we demonstrated an ability to improve the performance of XGPET™ to levels requested by several customers. We will soon scale the process and begin initial customer sampling and trials.
Although, we are not seeing our progress translating to meaningful revenue yet, rest assured that progress is being made. The following are examples of customer activity in the last two months since our last shareholder report:
| · | Signed a supply agreement with customer using our products in coatings applications, shipped the first small-volume order with a second targeted for August; |
| · | Exceeded customer performance target by 2x in elastomer application, moving to product testing in Q3; |
| · | China-based customer communicated product meets performance expectations in an electronic coatings application and placed an order for qualification material, expect to begin initial production ramp in Q4; |
| · | Customer not ordering in the last few quarters indicated new pulls from inventory and may re-order in the next few quarters; and |
| · | Customer confirmed intent to start purchasing material in Q3 for government related applications that we believe has the potential to scale to multiple tons per month. |
We believe XG Sciences is well positioned both within the industry and with several products already in commercial use. We have an excellent pipeline of opportunities and believe the Company is poised for growth. The only questions are the timing of market adoption and runway/cash management until we establish a stable baseline of revenue upon which the Company may self-fund on-going operations and growth initiatives.
| 4 |
Funding Update
As more fully described in the Liquidity section of the Management Discussion and Analysis portion of our 10-Q, we have structured an offering of secured, convertible notes with certain common stock exchange rights (the “Unit Offering”). On April 23, 2020, certain members of our Board of Directors and their affiliates purchased $550,000 of Units to launch the Unit Offering. As discussed in the 10-Q, after taking into consideration the cash that is currently on hand, we estimate that we will still need approximately $500,000 - $1.0 million of additional capital in order to continue our operations for the next twelve months in a minimal to no revenue growth environment relative to 2019’s revenue of $1.4 million. If we are able to raise $1.5 million of capital from disinterested third parties, the commitments from our Board members to match this amount would result in $3.0 million of total capital to the Company, which we estimate would allow the Company to continue operating for 24 months in a minimal to no revenue growth environment.
Thank you for your continued support of XG Sciences. If you have any questions on any aspect of this shareholder report, please feel free to call me at +1 517 999 5453.
Warm Regards,

Philip Rose, Ph.D.
Chief Executive Officer
Forward Looking Statements
Certain information contained in this letter constitutes forward-looking statements for purposes of the safe harbor provisions of The Private Securities Litigation Reform Act of 1995, including, but not limited to, the information set forth in the section entitled “Revisions to 2019 Revenue Guidance and Introduction of Preliminary 2020 Revenue Guidance”. These forward-looking statements involve a number of risks and uncertainties that could cause actual future results to differ materially from those anticipated in the forward-looking statements as the result of the Company’s ability to continue gaining new customers, offer new products, and otherwise implement its business plan. Forward-looking statements represent the Company’s estimates only as of the date such statements are made (unless another date is indicated) and should not be relied upon as representing the Company’s estimates as of any subsequent date. While the Company may elect to update forward-looking statements at some point in the future, it specifically disclaims any obligation to do so, even if its estimates change.
| 5 |