Attached files
| file | filename |
|---|---|
| EX-99.1 - EX-99.1 - Summit Midstream Partners, LP | d946556dex991.htm |
| 8-K - 8-K - Summit Midstream Partners, LP | d946556d8k.htm |

Exhibit 99.2 Summit Midstream Partners, LP Series A Preferred Unit Exchange for Common Units June 19, 2020Exhibit 99.2 Summit Midstream Partners, LP Series A Preferred Unit Exchange for Common Units June 19, 2020

Disclaimer Summit Midstream Partners, LP (the “Partnership” or “SMLP”) has filed a Tender Offer Statement on Schedule TO with the Securities and Exchange Commission (“SEC”) with respect to the Exchange Offer (as defined herein). An Offer to Exchange and Letter of Transmittal have been distributed to SMLP preferred unitholders in connection with the Exchange Offer. Unitholders are urged to read carefully the Offer to Exchange in its entirety (including any amendments or supplements thereto) and any documents which are included with or incorporated by reference into the Offer to Exchange, because they contain important information about the Exchange Offer. The Exchange Offer is being conducted in accordance with Section 3(a)(9) of the Securities Act of 1933, as amended (the “Securities Act”). Section 3(a)(9) of the Securities Act provides an exemption from registration for any security exchanged by an issuer with its existing security holders exclusively where no commission or other remuneration is paid or given directly or indirectly for soliciting such exchange. When securities are exchanged for other securities of an issuer under Section 3(a)(9), the securities received assume the character of the exchanged securities for purposes of the Securities Act. Accordingly, the common units representing limited partner interests in SMLP (the “common units”) issued in exchange for Series A Preferred Units would be free of resale restrictions if held by persons that are not “affiliates” of ours within the meaning of Rule 405 of the Securities Act. See Transfer Restrictions in the Offer to Exchange. 2Disclaimer Summit Midstream Partners, LP (the “Partnership” or “SMLP”) has filed a Tender Offer Statement on Schedule TO with the Securities and Exchange Commission (“SEC”) with respect to the Exchange Offer (as defined herein). An Offer to Exchange and Letter of Transmittal have been distributed to SMLP preferred unitholders in connection with the Exchange Offer. Unitholders are urged to read carefully the Offer to Exchange in its entirety (including any amendments or supplements thereto) and any documents which are included with or incorporated by reference into the Offer to Exchange, because they contain important information about the Exchange Offer. The Exchange Offer is being conducted in accordance with Section 3(a)(9) of the Securities Act of 1933, as amended (the “Securities Act”). Section 3(a)(9) of the Securities Act provides an exemption from registration for any security exchanged by an issuer with its existing security holders exclusively where no commission or other remuneration is paid or given directly or indirectly for soliciting such exchange. When securities are exchanged for other securities of an issuer under Section 3(a)(9), the securities received assume the character of the exchanged securities for purposes of the Securities Act. Accordingly, the common units representing limited partner interests in SMLP (the “common units”) issued in exchange for Series A Preferred Units would be free of resale restrictions if held by persons that are not “affiliates” of ours within the meaning of Rule 405 of the Securities Act. See Transfer Restrictions in the Offer to Exchange. 2

Forward-Looking Statements Investors are cautioned that certain statements contained in this presentation are “forward-looking” statements within the meaning of Section 27A of the Securities Act and Section 21E of the Securities Exchange Act. Forward-looking statements include, without limitation, any statement that may project, indicate or imply future results, events, performance or achievements and may contain the words “expect,” “intend,” “plan,” “anticipate,” “estimate,” “believe,” “will be,” “will continue,” “will likely result,” and similar expressions, or future conditional verbs such as “may,” “will,” “should,” “would,” and “could.” In addition, any statement concerning future financial performance (including future revenues, earnings or growth rates), ongoing business strategies or prospects, and possible actions taken by us, are also forward-looking statements. Forward-looking statements are based on current expectations and projections about future events and are inherently subject to a variety of risks and uncertainties, many of which are beyond the control of our management team. All forward-looking statements in this presentation and subsequent written and oral forward-looking statements attributable to us are expressly qualified in their entirety by the cautionary statements in this paragraph. These risks and uncertainties include, among others: § fluctuations in natural gas, NGLs and crude oil prices, including as a result of§ the availability, terms and cost of downstream transportation and processing the political or economic measures taken by various countries or OPEC; services; § the extent and success of our customers' drilling efforts, as well as the quantity§ natural disasters, accidents, weather-related delays, casualty losses and other of natural gas, crude oil and produced water volumes produced within proximity matters beyond our control; of our assets; § operational risks and hazards inherent in the gathering, compression, treating § the current and potential future impact of the COVID-19 pandemic on our and/or processing of natural gas, crude oil and produced water; business, results of operations, financial position or cash flows; § weather conditions and terrain in certain areas in which we operate; § failure or delays by our customers in achieving expected production in their § any other issues that can result in deficiencies in the design, installation or natural gas, crude oil and produced water projects; operation of our gathering, compression, treating and processing facilities; § competitive conditions in our industry and their impact on our ability to connect § timely receipt of necessary government approvals and permits, our ability to hydrocarbon supplies to our gathering and processing assets or systems; control the costs of construction, including costs of materials, labor and rights- § actions or inactions taken or nonperformance by third parties, including of-way and other factors that may impact our ability to complete projects within suppliers, contractors, operators, processors, transporters and customers, budget and on schedule; including the inability or failure of our shipper customers to meet their financial § our ability to finance our obligations related to capital expenditures or the obligations under our gathering agreements and our ability to enforce the terms Deferred Purchase Price Obligation, including through opportunistic asset and conditions of certain of our gathering agreements in the event of a divestitures or joint ventures and the impact any such divestitures or joint bankruptcy of one or more of our customers; ventures could have on our results; § our ability to divest or joint ventures of certain of our assets to third parties on § the effects of existing and future laws and governmental regulations, including attractive terms, which is subject to a number of factors, including prevailing environmental, safety and climate change requirements and federal, state and conditions and outlook in the natural gas, NGL and crude oil industries and local restrictions or requirements applicable to oil and/or gas drilling, production markets; or transportation; § the ability to attract and retain key management personnel; § the ability of SMP Holdings to meet its obligations under its senior secured § commercial bank and capital market conditions and the potential impact of term loan facility; changes or disruptions in the credit and/or capital markets; § changes in tax status; § changes in the availability and cost of capital and the results of our financing § the effects of litigation; efforts, including availability of funds in the credit and/or capital markets; § changes in general economic conditions; and § restrictions placed on us by the agreements governing our debt and preferred § certain factors discussed elsewhere in this presentation. equity instruments; Developments in any of these areas could cause actual results to differ materially from those anticipated or projected or cause a significant reduction in the market price of our common units, preferred units and senior notes. The foregoing list of risks and uncertainties may not contain all of the risks and uncertainties that could affect us. In addition, in light of these risks and uncertainties, the matters referred to in the forward-looking statements contained in this document may not in fact occur. Accordingly, undue reliance should not be placed on these statements. We undertake no obligation to publicly update or revise any forward-looking statements as a result of new information, future events or otherwise, except as otherwise required by law. 3Forward-Looking Statements Investors are cautioned that certain statements contained in this presentation are “forward-looking” statements within the meaning of Section 27A of the Securities Act and Section 21E of the Securities Exchange Act. Forward-looking statements include, without limitation, any statement that may project, indicate or imply future results, events, performance or achievements and may contain the words “expect,” “intend,” “plan,” “anticipate,” “estimate,” “believe,” “will be,” “will continue,” “will likely result,” and similar expressions, or future conditional verbs such as “may,” “will,” “should,” “would,” and “could.” In addition, any statement concerning future financial performance (including future revenues, earnings or growth rates), ongoing business strategies or prospects, and possible actions taken by us, are also forward-looking statements. Forward-looking statements are based on current expectations and projections about future events and are inherently subject to a variety of risks and uncertainties, many of which are beyond the control of our management team. All forward-looking statements in this presentation and subsequent written and oral forward-looking statements attributable to us are expressly qualified in their entirety by the cautionary statements in this paragraph. These risks and uncertainties include, among others: § fluctuations in natural gas, NGLs and crude oil prices, including as a result of§ the availability, terms and cost of downstream transportation and processing the political or economic measures taken by various countries or OPEC; services; § the extent and success of our customers' drilling efforts, as well as the quantity§ natural disasters, accidents, weather-related delays, casualty losses and other of natural gas, crude oil and produced water volumes produced within proximity matters beyond our control; of our assets; § operational risks and hazards inherent in the gathering, compression, treating § the current and potential future impact of the COVID-19 pandemic on our and/or processing of natural gas, crude oil and produced water; business, results of operations, financial position or cash flows; § weather conditions and terrain in certain areas in which we operate; § failure or delays by our customers in achieving expected production in their § any other issues that can result in deficiencies in the design, installation or natural gas, crude oil and produced water projects; operation of our gathering, compression, treating and processing facilities; § competitive conditions in our industry and their impact on our ability to connect § timely receipt of necessary government approvals and permits, our ability to hydrocarbon supplies to our gathering and processing assets or systems; control the costs of construction, including costs of materials, labor and rights- § actions or inactions taken or nonperformance by third parties, including of-way and other factors that may impact our ability to complete projects within suppliers, contractors, operators, processors, transporters and customers, budget and on schedule; including the inability or failure of our shipper customers to meet their financial § our ability to finance our obligations related to capital expenditures or the obligations under our gathering agreements and our ability to enforce the terms Deferred Purchase Price Obligation, including through opportunistic asset and conditions of certain of our gathering agreements in the event of a divestitures or joint ventures and the impact any such divestitures or joint bankruptcy of one or more of our customers; ventures could have on our results; § our ability to divest or joint ventures of certain of our assets to third parties on § the effects of existing and future laws and governmental regulations, including attractive terms, which is subject to a number of factors, including prevailing environmental, safety and climate change requirements and federal, state and conditions and outlook in the natural gas, NGL and crude oil industries and local restrictions or requirements applicable to oil and/or gas drilling, production markets; or transportation; § the ability to attract and retain key management personnel; § the ability of SMP Holdings to meet its obligations under its senior secured § commercial bank and capital market conditions and the potential impact of term loan facility; changes or disruptions in the credit and/or capital markets; § changes in tax status; § changes in the availability and cost of capital and the results of our financing § the effects of litigation; efforts, including availability of funds in the credit and/or capital markets; § changes in general economic conditions; and § restrictions placed on us by the agreements governing our debt and preferred § certain factors discussed elsewhere in this presentation. equity instruments; Developments in any of these areas could cause actual results to differ materially from those anticipated or projected or cause a significant reduction in the market price of our common units, preferred units and senior notes. The foregoing list of risks and uncertainties may not contain all of the risks and uncertainties that could affect us. In addition, in light of these risks and uncertainties, the matters referred to in the forward-looking statements contained in this document may not in fact occur. Accordingly, undue reliance should not be placed on these statements. We undertake no obligation to publicly update or revise any forward-looking statements as a result of new information, future events or otherwise, except as otherwise required by law. 3

Series A Preferred Unit Exchange Offer Overview SMLP is launching an offer to all holders of SMLP’s 9.50% Series A Fixed-to-Floating Rate Cumulative Redeemable Perpetual Preferred Units ($1,000 liquidation preference) (the “Series A Preferred Units”) to exchange their Series A Preferred Units into common units at an exchange ratio of 150 common units per Series A Preferred Unit (the “Exchange Offer”) Contact Information Exchange Offer Timeline June 2020 July 2020 S M T W T F S S M T W T F S Website: www.summitmidstream.com 1 2 3 4 5 6 1 2 3 4 7 8 9 10 11 12 13 5 6 7 8 9 10 11 Headquarters: 910 Louisiana Street 14 15 16 17 18 19 20 12 13 14 15 16 17 18 Suite 4200 21 22 23 24 25 26 27 19 20 21 22 23 24 25 Houston, TX 77002 28 29 30 26 27 28 29 30 31 Partnership Contacts: Ross Wong Key Date Observed Holiday Sr. Director, Corporate Development & Finance ir@summitmidstream.com 832.930.7512 Date Action Bill Mault VP, Corporate Development, Finance & Treasurer Ø Launch of Exchange Offer June 18 770.504.5047 July 17Ø Expiration Date Marc Stratton EVP and Chief Financial Officer 832.608.6166 July 22Ø Exchange Offer settlement Note: The Exchange Offer is conditioned on, among other things, that holders of at least 30,000 Series A Preferred Units properly tender (and not validly withdraw) their Series A Preferred Units prior to the Expiration Date. 4Series A Preferred Unit Exchange Offer Overview SMLP is launching an offer to all holders of SMLP’s 9.50% Series A Fixed-to-Floating Rate Cumulative Redeemable Perpetual Preferred Units ($1,000 liquidation preference) (the “Series A Preferred Units”) to exchange their Series A Preferred Units into common units at an exchange ratio of 150 common units per Series A Preferred Unit (the “Exchange Offer”) Contact Information Exchange Offer Timeline June 2020 July 2020 S M T W T F S S M T W T F S Website: www.summitmidstream.com 1 2 3 4 5 6 1 2 3 4 7 8 9 10 11 12 13 5 6 7 8 9 10 11 Headquarters: 910 Louisiana Street 14 15 16 17 18 19 20 12 13 14 15 16 17 18 Suite 4200 21 22 23 24 25 26 27 19 20 21 22 23 24 25 Houston, TX 77002 28 29 30 26 27 28 29 30 31 Partnership Contacts: Ross Wong Key Date Observed Holiday Sr. Director, Corporate Development & Finance ir@summitmidstream.com 832.930.7512 Date Action Bill Mault VP, Corporate Development, Finance & Treasurer Ø Launch of Exchange Offer June 18 770.504.5047 July 17Ø Expiration Date Marc Stratton EVP and Chief Financial Officer 832.608.6166 July 22Ø Exchange Offer settlement Note: The Exchange Offer is conditioned on, among other things, that holders of at least 30,000 Series A Preferred Units properly tender (and not validly withdraw) their Series A Preferred Units prior to the Expiration Date. 4
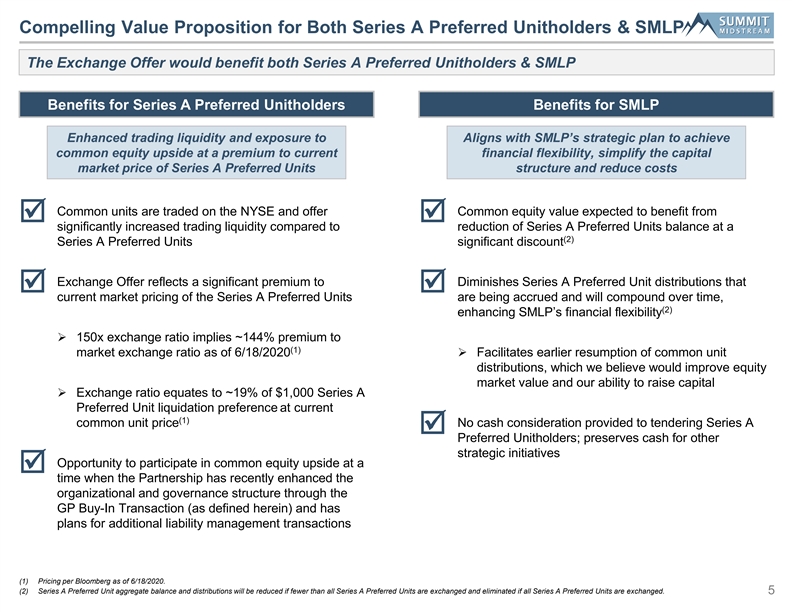
Compelling Value Proposition for Both Series A Preferred Unitholders & SMLP The Exchange Offer would benefit both Series A Preferred Unitholders & SMLP Benefits for Series A Preferred Unitholders Benefits for SMLP Enhanced trading liquidity and exposure to Aligns with SMLP’s strategic plan to achieve common equity upside at a premium to current financial flexibility, simplify the capital market price of Series A Preferred Units structure and reduce costs Common units are traded on the NYSE and offer Common equity value expected to benefit from þþ significantly increased trading liquidity compared to reduction of Series A Preferred Units balance at a (2) Series A Preferred Units significant discount Exchange Offer reflects a significant premium to Diminishes Series A Preferred Unit distributions that þþ current market pricing of the Series A Preferred Units are being accrued and will compound over time, (2) enhancing SMLP’s financial flexibility Ø 150x exchange ratio implies ~144% premium to (1) market exchange ratio as of 6/18/2020Ø Facilitates earlier resumption of common unit distributions, which we believe would improve equity market value and our ability to raise capital Ø Exchange ratio equates to ~19% of $1,000 Series A Preferred Unit liquidation preference at current (1) common unit price No cash consideration provided to tendering Series A þ Preferred Unitholders; preserves cash for other strategic initiatives Opportunity to participate in common equity upside at a þ time when the Partnership has recently enhanced the organizational and governance structure through the GP Buy-In Transaction (as defined herein) and has plans for additional liability management transactions (1) Pricing per Bloomberg as of 6/18/2020. (2) Series A Preferred Unit aggregate balance and distributions will be reduced if fewer than all Series A Preferred Units are exchanged and eliminated if all Series A Preferred Units are exchanged. 5Compelling Value Proposition for Both Series A Preferred Unitholders & SMLP The Exchange Offer would benefit both Series A Preferred Unitholders & SMLP Benefits for Series A Preferred Unitholders Benefits for SMLP Enhanced trading liquidity and exposure to Aligns with SMLP’s strategic plan to achieve common equity upside at a premium to current financial flexibility, simplify the capital market price of Series A Preferred Units structure and reduce costs Common units are traded on the NYSE and offer Common equity value expected to benefit from þþ significantly increased trading liquidity compared to reduction of Series A Preferred Units balance at a (2) Series A Preferred Units significant discount Exchange Offer reflects a significant premium to Diminishes Series A Preferred Unit distributions that þþ current market pricing of the Series A Preferred Units are being accrued and will compound over time, (2) enhancing SMLP’s financial flexibility Ø 150x exchange ratio implies ~144% premium to (1) market exchange ratio as of 6/18/2020Ø Facilitates earlier resumption of common unit distributions, which we believe would improve equity market value and our ability to raise capital Ø Exchange ratio equates to ~19% of $1,000 Series A Preferred Unit liquidation preference at current (1) common unit price No cash consideration provided to tendering Series A þ Preferred Unitholders; preserves cash for other strategic initiatives Opportunity to participate in common equity upside at a þ time when the Partnership has recently enhanced the organizational and governance structure through the GP Buy-In Transaction (as defined herein) and has plans for additional liability management transactions (1) Pricing per Bloomberg as of 6/18/2020. (2) Series A Preferred Unit aggregate balance and distributions will be reduced if fewer than all Series A Preferred Units are exchanged and eliminated if all Series A Preferred Units are exchanged. 5

Large Disparity in Market Trading Liquidity Between March 1 and June 18, 2020, the aggregate volume of SMLP’s common units that was traded was ~20 times that of SMLP’s Series A Preferred Units (1) Series A Preferred Unit Trading History Preferred Unit Price (% of par) Cumulative Market Volume ($MM) 120% $60 100% $50 Ø Between March 1 and June 18, 2020, Series A Preferred Units with an aggregate 80% $40 market value of ~$3MM were traded 60% $30 ̶ Represents ~$39MM of Series A 40% $20 Preferred Units at liquidation preference value 20% $10 7.94 $3MM 0% $0 3/1 3/8 3/15 3/22 3/29 4/5 4/12 4/19 4/26 5/3 5/10 5/17 5/24 5/31 6/7 6/14 (1) Common Unit Trading History Common Unit Price ($) Cumulative Market Volume ($MM) $6.00 $60 $5.00 $50 Ø Between March 1 and June 18, 2020, $4.00 $40 common units with an aggregate market $58MM value of ~$58MM were traded $3.00 $30 ̶ Represents ~55MM common units at a $2.00 $20 VWAP of ~$1.06 since March 1 $1.29 $1.00 $10 $0.00 $0 3/1 3/8 3/15 3/22 3/29 4/5 4/12 4/19 4/26 5/3 5/10 5/17 5/24 5/31 6/7 6/14 Source: Pricing and volume estimated per Bloomberg as of 6/18/2020. (1) Cumulative volume shown at market values based on estimated trading volume and trading price for each day. 6Large Disparity in Market Trading Liquidity Between March 1 and June 18, 2020, the aggregate volume of SMLP’s common units that was traded was ~20 times that of SMLP’s Series A Preferred Units (1) Series A Preferred Unit Trading History Preferred Unit Price (% of par) Cumulative Market Volume ($MM) 120% $60 100% $50 Ø Between March 1 and June 18, 2020, Series A Preferred Units with an aggregate 80% $40 market value of ~$3MM were traded 60% $30 ̶ Represents ~$39MM of Series A 40% $20 Preferred Units at liquidation preference value 20% $10 7.94 $3MM 0% $0 3/1 3/8 3/15 3/22 3/29 4/5 4/12 4/19 4/26 5/3 5/10 5/17 5/24 5/31 6/7 6/14 (1) Common Unit Trading History Common Unit Price ($) Cumulative Market Volume ($MM) $6.00 $60 $5.00 $50 Ø Between March 1 and June 18, 2020, $4.00 $40 common units with an aggregate market $58MM value of ~$58MM were traded $3.00 $30 ̶ Represents ~55MM common units at a $2.00 $20 VWAP of ~$1.06 since March 1 $1.29 $1.00 $10 $0.00 $0 3/1 3/8 3/15 3/22 3/29 4/5 4/12 4/19 4/26 5/3 5/10 5/17 5/24 5/31 6/7 6/14 Source: Pricing and volume estimated per Bloomberg as of 6/18/2020. (1) Cumulative volume shown at market values based on estimated trading volume and trading price for each day. 6

Pro Forma Capitalization The table below illustrates the pro forma impacts of the GP Buy-In Transaction and the Exchange Offer (assuming 50% participation) on SMLP’s capital structure as of 3/31/2020 (1) (2) As Reported GP Buy-In Transaction Exchange Offer ($s in thousands) 3/31/2020 As Adjusted As Further Adjusted (3) Cash and Cash Equivalents $71,751 $112,345 $112,345 Debt: Revolving Credit Facility (Due May 2022) $698,000 $733,000 $733,000 ECP Term Loan Credit Agreements (Due March 2021) – 35,000 35,000 (4) 5.50% Senior Notes (Due August 2022) 300,000 300,000 300,000 (4) 5.75% Senior Notes (Due April 2025) 500,000 500,000 500,000 (5) SMPH Term Loan (Due May 2022) – 160,750 160,750 Total Debt $1,498,000 $1,728,750 $1,728,750 Other Obligations: (6) DPPO $180,750 – – Mezzanine Capital: Subsidiary Series A Preferred Units 62,341 62,341 62,341 Partners' Capital: (7) Series A Preferred Units 300,000 300,000 150,000 (8) Common Limited Partner Capital 457,176 457,176 607,176 Total Partners' Capital $757,176 $757,176 $757,176 (9) Total Capitalization and Other Obligations $2,498,267 $2,548,267 $2,548,267 (10) SMLP Common Units Outstanding (000s) 94,558 43,323 65,823 (1) Announced on 5/3/2020; closed on 5/28/2020. (2) Assumes exchange ratio of 150 common units per $1,000 liquidation value of Series A Preferred Units and 50% participation in the Exchange Offer. (3) Includes $4.1 million of restricted cash. Subsequent to the consummation of the GP Buy-In Transaction on May 28, 2020, cash and cash equivalents on SMLP's consolidated balance sheet will include the cash balance at SMP Holdings ($5.6 million as of March 31, 2020). (4) Reflects the principal amount of the note series rather than the carrying amount, which is presented net of unamortized debt issuance costs. Subsequent to March 31, 2020, SMLP utilized approximately $50 million in cash to repurchase approximately $16 million face value of 5.50% Senior Notes due August 2022 at a weighted average 38% discount and approximately $71 million face value of 5.75% Senior Notes due April 2025 at a weighted average 44% discount. (5) The SMPH Term Loan is non-recourse to the Partnership, but SMP Holdings' equity interest in the General Partner and 34.6 million common units are pledged as collateral under the SMPH Term Loan. (6) Subsequent to the consummation of the GP Buy-In Transaction on May 28, 2020, the Deferred Purchase Price Obligation liability will be eliminated from SMLP’s consolidated balance sheet because SMLP acquired the corresponding Deferred Purchase Price Obligation receivable in the GP Buy-In Transaction. SMLP’s legal subsidiaries that are the holders of the Deferred Purchase Price Obligation and Deferred Purchase Price Obligation receivable will continue to reflect the instruments in their standalone financial statements. (7) Reflects the liquidation preference value of $1,000 per Series A Preferred Unit and is an amount before the allocation of net income to the Series A Preferred Unit and related issuance costs. (8) Common limited partner capital has not been adjusted for the As Adjusted or As Further Adjusted scenarios presented in the capitalization table because the net effect of the adjustments necessary to account for the GP Buy-In Transaction is not significant to the capitalization table and the Company has not finalized the re-cast of its historical financial statements. Under generally accepted accounting principles, the GP Buy-In Transaction will be accounted for as a common-control transaction and the historical book equity of SMLP will be (i) increased to account for the equity of Summit Investments, and (ii) concurrently reduced for transaction costs incurred and the allocation of consideration transferred for purchase of the 34.6 million common units pledged as collateral under the SMPH Term Loan and the 16.6 million common units not pledged as collateral under the SMPH Term Loan. The impact of these adjustments is not a significant net reduction to the common limited partner capital account balance. Subsequent to the Exchange Offer, for each Series A Preferred Unit that is exchanged, SMLP will eliminate from its Series A Preferred Unit capital account an amount equal to the sum of $1,000, the undistributed net income allocated to the Series A Preferred Unit, and an offset amount for the allocation of Series A Preferred Unit issuance costs. The amount eliminated will be replaced by an equivalent amount in the common unit capital account. (9) Excludes changes to the book value of common limited partner capital in the as-adjusted basis and as further adjusted basis per footnote 8. (10) Represents basic units outstanding for voting and distribution purposes and excludes the potential impacts of warrants. Actual units outstanding is as of April 30, 2020. As part of the GP Buy-In Transaction closing, SMLP acquired 51.2 million SMLP common units including 16.6 million common units that have been retired and 34.6 million common units owned by a subsidiary of SMLP, as a result of which they ceased to be outstanding. 7Pro Forma Capitalization The table below illustrates the pro forma impacts of the GP Buy-In Transaction and the Exchange Offer (assuming 50% participation) on SMLP’s capital structure as of 3/31/2020 (1) (2) As Reported GP Buy-In Transaction Exchange Offer ($s in thousands) 3/31/2020 As Adjusted As Further Adjusted (3) Cash and Cash Equivalents $71,751 $112,345 $112,345 Debt: Revolving Credit Facility (Due May 2022) $698,000 $733,000 $733,000 ECP Term Loan Credit Agreements (Due March 2021) – 35,000 35,000 (4) 5.50% Senior Notes (Due August 2022) 300,000 300,000 300,000 (4) 5.75% Senior Notes (Due April 2025) 500,000 500,000 500,000 (5) SMPH Term Loan (Due May 2022) – 160,750 160,750 Total Debt $1,498,000 $1,728,750 $1,728,750 Other Obligations: (6) DPPO $180,750 – – Mezzanine Capital: Subsidiary Series A Preferred Units 62,341 62,341 62,341 Partners' Capital: (7) Series A Preferred Units 300,000 300,000 150,000 (8) Common Limited Partner Capital 457,176 457,176 607,176 Total Partners' Capital $757,176 $757,176 $757,176 (9) Total Capitalization and Other Obligations $2,498,267 $2,548,267 $2,548,267 (10) SMLP Common Units Outstanding (000s) 94,558 43,323 65,823 (1) Announced on 5/3/2020; closed on 5/28/2020. (2) Assumes exchange ratio of 150 common units per $1,000 liquidation value of Series A Preferred Units and 50% participation in the Exchange Offer. (3) Includes $4.1 million of restricted cash. Subsequent to the consummation of the GP Buy-In Transaction on May 28, 2020, cash and cash equivalents on SMLP's consolidated balance sheet will include the cash balance at SMP Holdings ($5.6 million as of March 31, 2020). (4) Reflects the principal amount of the note series rather than the carrying amount, which is presented net of unamortized debt issuance costs. Subsequent to March 31, 2020, SMLP utilized approximately $50 million in cash to repurchase approximately $16 million face value of 5.50% Senior Notes due August 2022 at a weighted average 38% discount and approximately $71 million face value of 5.75% Senior Notes due April 2025 at a weighted average 44% discount. (5) The SMPH Term Loan is non-recourse to the Partnership, but SMP Holdings' equity interest in the General Partner and 34.6 million common units are pledged as collateral under the SMPH Term Loan. (6) Subsequent to the consummation of the GP Buy-In Transaction on May 28, 2020, the Deferred Purchase Price Obligation liability will be eliminated from SMLP’s consolidated balance sheet because SMLP acquired the corresponding Deferred Purchase Price Obligation receivable in the GP Buy-In Transaction. SMLP’s legal subsidiaries that are the holders of the Deferred Purchase Price Obligation and Deferred Purchase Price Obligation receivable will continue to reflect the instruments in their standalone financial statements. (7) Reflects the liquidation preference value of $1,000 per Series A Preferred Unit and is an amount before the allocation of net income to the Series A Preferred Unit and related issuance costs. (8) Common limited partner capital has not been adjusted for the As Adjusted or As Further Adjusted scenarios presented in the capitalization table because the net effect of the adjustments necessary to account for the GP Buy-In Transaction is not significant to the capitalization table and the Company has not finalized the re-cast of its historical financial statements. Under generally accepted accounting principles, the GP Buy-In Transaction will be accounted for as a common-control transaction and the historical book equity of SMLP will be (i) increased to account for the equity of Summit Investments, and (ii) concurrently reduced for transaction costs incurred and the allocation of consideration transferred for purchase of the 34.6 million common units pledged as collateral under the SMPH Term Loan and the 16.6 million common units not pledged as collateral under the SMPH Term Loan. The impact of these adjustments is not a significant net reduction to the common limited partner capital account balance. Subsequent to the Exchange Offer, for each Series A Preferred Unit that is exchanged, SMLP will eliminate from its Series A Preferred Unit capital account an amount equal to the sum of $1,000, the undistributed net income allocated to the Series A Preferred Unit, and an offset amount for the allocation of Series A Preferred Unit issuance costs. The amount eliminated will be replaced by an equivalent amount in the common unit capital account. (9) Excludes changes to the book value of common limited partner capital in the as-adjusted basis and as further adjusted basis per footnote 8. (10) Represents basic units outstanding for voting and distribution purposes and excludes the potential impacts of warrants. Actual units outstanding is as of April 30, 2020. As part of the GP Buy-In Transaction closing, SMLP acquired 51.2 million SMLP common units including 16.6 million common units that have been retired and 34.6 million common units owned by a subsidiary of SMLP, as a result of which they ceased to be outstanding. 7
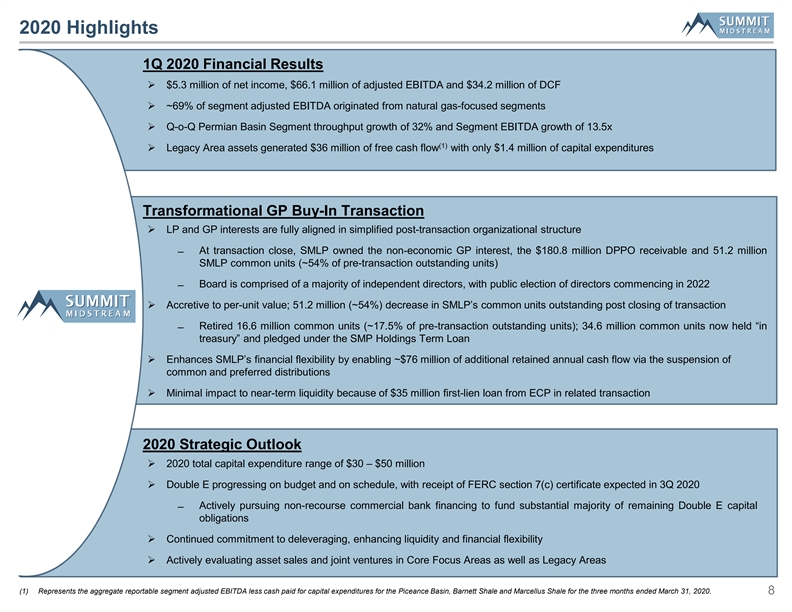
2020 Highlights 1Q 2020 Financial Results Ø $5.3 million of net income, $66.1 million of adjusted EBITDA and $34.2 million of DCF Ø ~69% of segment adjusted EBITDA originated from natural gas-focused segments Ø Q-o-Q Permian Basin Segment throughput growth of 32% and Segment EBITDA growth of 13.5x (1) Ø Legacy Area assets generated $36 million of free cash flow with only $1.4 million of capital expenditures Transformational GP Buy-In Transaction Ø LP and GP interests are fully aligned in simplified post-transaction organizational structure ̶ At transaction close, SMLP owned the non-economic GP interest, the $180.8 million DPPO receivable and 51.2 million SMLP common units (~54% of pre-transaction outstanding units) ̶ Board is comprised of a majority of independent directors, with public election of directors commencing in 2022 Ø Accretive to per-unit value; 51.2 million (~54%) decrease in SMLP’s common units outstanding post closing of transaction ̶ Retired 16.6 million common units (~17.5% of pre-transaction outstanding units); 34.6 million common units now held “in treasury” and pledged under the SMP Holdings Term Loan Ø Enhances SMLP’s financial flexibility by enabling ~$76 million of additional retained annual cash flow via the suspension of common and preferred distributions Ø Minimal impact to near-term liquidity because of $35 million first-lien loan from ECP in related transaction 2020 Strategic Outlook Ø 2020 total capital expenditure range of $30 – $50 million Ø Double E progressing on budget and on schedule, with receipt of FERC section 7(c) certificate expected in 3Q 2020 ̶ Actively pursuing non-recourse commercial bank financing to fund substantial majority of remaining Double E capital obligations Ø Continued commitment to deleveraging, enhancing liquidity and financial flexibility Ø Actively evaluating asset sales and joint ventures in Core Focus Areas as well as Legacy Areas (1) Represents the aggregate reportable segment adjusted EBITDA less cash paid for capital expenditures for the Piceance Basin, Barnett Shale and Marcellus Shale for the three months ended March 31, 2020. 82020 Highlights 1Q 2020 Financial Results Ø $5.3 million of net income, $66.1 million of adjusted EBITDA and $34.2 million of DCF Ø ~69% of segment adjusted EBITDA originated from natural gas-focused segments Ø Q-o-Q Permian Basin Segment throughput growth of 32% and Segment EBITDA growth of 13.5x (1) Ø Legacy Area assets generated $36 million of free cash flow with only $1.4 million of capital expenditures Transformational GP Buy-In Transaction Ø LP and GP interests are fully aligned in simplified post-transaction organizational structure ̶ At transaction close, SMLP owned the non-economic GP interest, the $180.8 million DPPO receivable and 51.2 million SMLP common units (~54% of pre-transaction outstanding units) ̶ Board is comprised of a majority of independent directors, with public election of directors commencing in 2022 Ø Accretive to per-unit value; 51.2 million (~54%) decrease in SMLP’s common units outstanding post closing of transaction ̶ Retired 16.6 million common units (~17.5% of pre-transaction outstanding units); 34.6 million common units now held “in treasury” and pledged under the SMP Holdings Term Loan Ø Enhances SMLP’s financial flexibility by enabling ~$76 million of additional retained annual cash flow via the suspension of common and preferred distributions Ø Minimal impact to near-term liquidity because of $35 million first-lien loan from ECP in related transaction 2020 Strategic Outlook Ø 2020 total capital expenditure range of $30 – $50 million Ø Double E progressing on budget and on schedule, with receipt of FERC section 7(c) certificate expected in 3Q 2020 ̶ Actively pursuing non-recourse commercial bank financing to fund substantial majority of remaining Double E capital obligations Ø Continued commitment to deleveraging, enhancing liquidity and financial flexibility Ø Actively evaluating asset sales and joint ventures in Core Focus Areas as well as Legacy Areas (1) Represents the aggregate reportable segment adjusted EBITDA less cash paid for capital expenditures for the Piceance Basin, Barnett Shale and Marcellus Shale for the three months ended March 31, 2020. 8

Enhanced Governance Structure through GP Buy-In Transaction On May 28, 2020, SMLP closed the acquisition of Summit Midstream Partners, LLC (“Summit Investments”) from Energy Capital Partners II, LLC (“ECP”) for $35 million in cash plus warrants for up to 10 million SMLP common units (the “GP Buy-In Transaction”), better aligning stakeholders by providing SMLP control of its GP and enabling Board governance to include a majority of independent directors (1) Governance and Corporate Structure Highlights Pro Forma Organizational Structure Ø SMLP acquired the GP interest, 51.2 million SMLP common units Public and the $180.8 million DPPO receivable ̶ 16.6 million units have been retired; 34.6 million units now 43.3MM Summit Midstream held “in treasury” common units Partners, LP (NYSE: SMLP) Ø SMLP is now governed by a board consisting of a majority of independent directors $181MM DPPO $300MM Series A Preferred ̶ All directors affiliated with ECP have resigned Board consists of 6 independent directors and J. Heath ̶ Summit Midstream Holdings, LLC Summit Midstream Deneke, SMLP’s President & CEO and Chairman of the Board Partners, LLC $733MM Revolver Drawn Ø SMLP’s common units outstanding reduced by 54.2% (Summit Investments) $35MM ECP Loan immediately for purposes of voting and distributions $800MM Notes ̶ SMLP public unitholders now own 100% of SMLP’s common Operating Assets units outstanding GP Interest Ø Summit Investments and all of its subsidiaries became wholly- owned subsidiaries of SMLP Summit Midstream Ø Summit Midstream Partners Holdings, LLC (“SMP Holdings”), a Partners Holdings, LLC 34.6MM common (SMP Holdings) wholly-owned subsidiary of Summit Investments, will continue as (2) units pledged to TL borrower under an existing term loan (“TL”); the TL will continue to $181MM DPPO Receivable (3) $161MM Term Loan be non-recourse indebtedness to SMLP and its operating subsidiaries Summit Midstream GP, ̶ TL is secured by ~34.6 million SMLP common units owned by LLC SMP Holdings and the GP interest (the General Partner) Note: All balances as of 3/31/2020, pro forma for GP Buy-In Transaction. LP Interest percentage for purposes of voting and distributions. (1) Represents simplified organizational structure and not all entities are displayed. (2) 34.6 million units pledged to the TL are held in treasury and not counted in the common units outstanding for purposes of voting and distributions. (3) Balance as of 3/31/2020. 9Enhanced Governance Structure through GP Buy-In Transaction On May 28, 2020, SMLP closed the acquisition of Summit Midstream Partners, LLC (“Summit Investments”) from Energy Capital Partners II, LLC (“ECP”) for $35 million in cash plus warrants for up to 10 million SMLP common units (the “GP Buy-In Transaction”), better aligning stakeholders by providing SMLP control of its GP and enabling Board governance to include a majority of independent directors (1) Governance and Corporate Structure Highlights Pro Forma Organizational Structure Ø SMLP acquired the GP interest, 51.2 million SMLP common units Public and the $180.8 million DPPO receivable ̶ 16.6 million units have been retired; 34.6 million units now 43.3MM Summit Midstream held “in treasury” common units Partners, LP (NYSE: SMLP) Ø SMLP is now governed by a board consisting of a majority of independent directors $181MM DPPO $300MM Series A Preferred ̶ All directors affiliated with ECP have resigned Board consists of 6 independent directors and J. Heath ̶ Summit Midstream Holdings, LLC Summit Midstream Deneke, SMLP’s President & CEO and Chairman of the Board Partners, LLC $733MM Revolver Drawn Ø SMLP’s common units outstanding reduced by 54.2% (Summit Investments) $35MM ECP Loan immediately for purposes of voting and distributions $800MM Notes ̶ SMLP public unitholders now own 100% of SMLP’s common Operating Assets units outstanding GP Interest Ø Summit Investments and all of its subsidiaries became wholly- owned subsidiaries of SMLP Summit Midstream Ø Summit Midstream Partners Holdings, LLC (“SMP Holdings”), a Partners Holdings, LLC 34.6MM common (SMP Holdings) wholly-owned subsidiary of Summit Investments, will continue as (2) units pledged to TL borrower under an existing term loan (“TL”); the TL will continue to $181MM DPPO Receivable (3) $161MM Term Loan be non-recourse indebtedness to SMLP and its operating subsidiaries Summit Midstream GP, ̶ TL is secured by ~34.6 million SMLP common units owned by LLC SMP Holdings and the GP interest (the General Partner) Note: All balances as of 3/31/2020, pro forma for GP Buy-In Transaction. LP Interest percentage for purposes of voting and distributions. (1) Represents simplified organizational structure and not all entities are displayed. (2) 34.6 million units pledged to the TL are held in treasury and not counted in the common units outstanding for purposes of voting and distributions. (3) Balance as of 3/31/2020. 9

GP Buy-In Transaction Rationale Ø Enables SMLP to continue to prioritize the balance sheet by reducing debt, controlling costs, increasing financial flexibility and improving credit metrics in the volatile macro environment Increased Financial Ø Facilitated the suspension of distributions on common and Series A Preferred Units, resulting in Flexibility the retention of ~$76 million of cash annually that otherwise would have been distributed out of the business Ø SMLP’s acquisition of the GP fully aligns LP unitholder and GP interests; governance structure moves closer to a C-corp with the tax benefits of an MLP Enhanced Governance Ø SMLP’s public unitholders own substantially all of the outstanding SMLP common units for Structure purposes of voting and distributions Ø Board comprised of majority independent directors and public election of directors starting in 2022 promotes alignment with interests of SMLP common unitholders Ø Full ownership of the DPPO receivable allows SMLP to address the DPPO in a manner that maximizes value for SMLP unitholders Ownership of DPPO Ø Mitigates potential conflict of interests between owner of the DPPO receivable and public SMLP Receivable common unitholders Ø Eliminates DPPO liability from SMLP’s consolidated balance sheet Ø Increases equity value on per-unit basis for public unitholders as a result of reduction of 51.2 million units, or ~54% in common units outstanding vs. pre-transaction close Accretive to Per Unit Ø SMLP retired 16.6 million SMLP common units (~17.5% of total SMLP common units outstanding Equity Value prior to the closing of GP Buy-In Transaction) 10GP Buy-In Transaction Rationale Ø Enables SMLP to continue to prioritize the balance sheet by reducing debt, controlling costs, increasing financial flexibility and improving credit metrics in the volatile macro environment Increased Financial Ø Facilitated the suspension of distributions on common and Series A Preferred Units, resulting in Flexibility the retention of ~$76 million of cash annually that otherwise would have been distributed out of the business Ø SMLP’s acquisition of the GP fully aligns LP unitholder and GP interests; governance structure moves closer to a C-corp with the tax benefits of an MLP Enhanced Governance Ø SMLP’s public unitholders own substantially all of the outstanding SMLP common units for Structure purposes of voting and distributions Ø Board comprised of majority independent directors and public election of directors starting in 2022 promotes alignment with interests of SMLP common unitholders Ø Full ownership of the DPPO receivable allows SMLP to address the DPPO in a manner that maximizes value for SMLP unitholders Ownership of DPPO Ø Mitigates potential conflict of interests between owner of the DPPO receivable and public SMLP Receivable common unitholders Ø Eliminates DPPO liability from SMLP’s consolidated balance sheet Ø Increases equity value on per-unit basis for public unitholders as a result of reduction of 51.2 million units, or ~54% in common units outstanding vs. pre-transaction close Accretive to Per Unit Ø SMLP retired 16.6 million SMLP common units (~17.5% of total SMLP common units outstanding Equity Value prior to the closing of GP Buy-In Transaction) 10

Key Takeaways Opportunity for Series A Preferred Unitholders to receive a substantial premium to current market pricing 1 and significantly increase trading liquidity Participating Series A Preferred Unitholders have option to monetize position or participate in common 2 equity upside immediately upon settlement Exchange Offer expected to be value accretive for common unitholders and mitigate compounding impact 3 of accrued Series A Preferred distributions, while preserving cash for other strategic initiatives New organizational and governance structure with fully aligned LP and GP, majority independent board and 4 no financial sponsor Enhanced financial flexibility with the recent suspension of common and Series A Preferred Unit 5 distributions, significant liquidity and no near-term maturities Laser focus on capital discipline and operational excellence, with 2020 expected capital expenditure range 6 of $30 – $50 million Committed to strengthening the balance sheet via capital discipline, cost control, and asset sales or joint 7 ventures in both Legacy Areas and Core Focus Areas Legacy Areas generating stable and predictable cash flows, and are highly contracted through 2023 with 8 significant MVC underpinnings Core Focus Areas, including franchise positions in the Utica, Williston, DJ and Permian are well positioned 9 for highly accretive growth as oil and gas market fundamentals improve 11Key Takeaways Opportunity for Series A Preferred Unitholders to receive a substantial premium to current market pricing 1 and significantly increase trading liquidity Participating Series A Preferred Unitholders have option to monetize position or participate in common 2 equity upside immediately upon settlement Exchange Offer expected to be value accretive for common unitholders and mitigate compounding impact 3 of accrued Series A Preferred distributions, while preserving cash for other strategic initiatives New organizational and governance structure with fully aligned LP and GP, majority independent board and 4 no financial sponsor Enhanced financial flexibility with the recent suspension of common and Series A Preferred Unit 5 distributions, significant liquidity and no near-term maturities Laser focus on capital discipline and operational excellence, with 2020 expected capital expenditure range 6 of $30 – $50 million Committed to strengthening the balance sheet via capital discipline, cost control, and asset sales or joint 7 ventures in both Legacy Areas and Core Focus Areas Legacy Areas generating stable and predictable cash flows, and are highly contracted through 2023 with 8 significant MVC underpinnings Core Focus Areas, including franchise positions in the Utica, Williston, DJ and Permian are well positioned 9 for highly accretive growth as oil and gas market fundamentals improve 11

AppendixAppendix

SMLP Overview SMLP is a value-driven independent natural gas, crude oil and produced water gathering and processing company with diversified operations across seven resource plays in the continental U.S. Key Statistics Franchise positions in the Utica, Williston, DJ and Permian Unit Price (as of June 18, 2020) $1.29 (1) Market Capitalization ($MM) $59 (2) Enterprise Value ($MM) $2,037 (3) Leverage (1Q ‘20) 5.05x Total Expected 2020 Capex ($MM) $30 – $50 (4) Operational Statistics Weighted Average Contract Life 7.2 Years (5) Fee-Based Gross Margin > 95% (6) 1Q 2020 Total Volume 1,869 MMcfe/d 1Q 2020 Volumes % Natural Gas 69% Core Focus Area Legacy Area Total AMI (acres) 2.8 million (1) Common unit count used to calculate market capitalization illustratively includes impact of 10MM warrants held by ECP (~2.1MM common units based on treasury stock method and 6/18/20 unit price). (2) Enterprise Value shown adjusted for GP Buy-In Transaction and includes Total Debt, Series A Preferred Units, Subsidiary Series A Preferred Units and cash as outlined on page 7 and $59MM market capitalization. (3) As defined in revolving credit facility Credit Agreement. (4) As of March 31, 2020, unless noted otherwise. (5) Reflects gross margin in 2019: excludes contract amortization, electricity and other pass-throughs / reimbursables. Includes gas retainage revenue which is used to partially offset compression power expense in the Barnett. (6) Represents operated volume throughput and includes oil and produced water at a 6:1 conversion ratio. 13SMLP Overview SMLP is a value-driven independent natural gas, crude oil and produced water gathering and processing company with diversified operations across seven resource plays in the continental U.S. Key Statistics Franchise positions in the Utica, Williston, DJ and Permian Unit Price (as of June 18, 2020) $1.29 (1) Market Capitalization ($MM) $59 (2) Enterprise Value ($MM) $2,037 (3) Leverage (1Q ‘20) 5.05x Total Expected 2020 Capex ($MM) $30 – $50 (4) Operational Statistics Weighted Average Contract Life 7.2 Years (5) Fee-Based Gross Margin > 95% (6) 1Q 2020 Total Volume 1,869 MMcfe/d 1Q 2020 Volumes % Natural Gas 69% Core Focus Area Legacy Area Total AMI (acres) 2.8 million (1) Common unit count used to calculate market capitalization illustratively includes impact of 10MM warrants held by ECP (~2.1MM common units based on treasury stock method and 6/18/20 unit price). (2) Enterprise Value shown adjusted for GP Buy-In Transaction and includes Total Debt, Series A Preferred Units, Subsidiary Series A Preferred Units and cash as outlined on page 7 and $59MM market capitalization. (3) As defined in revolving credit facility Credit Agreement. (4) As of March 31, 2020, unless noted otherwise. (5) Reflects gross margin in 2019: excludes contract amortization, electricity and other pass-throughs / reimbursables. Includes gas retainage revenue which is used to partially offset compression power expense in the Barnett. (6) Represents operated volume throughput and includes oil and produced water at a 6:1 conversion ratio. 13
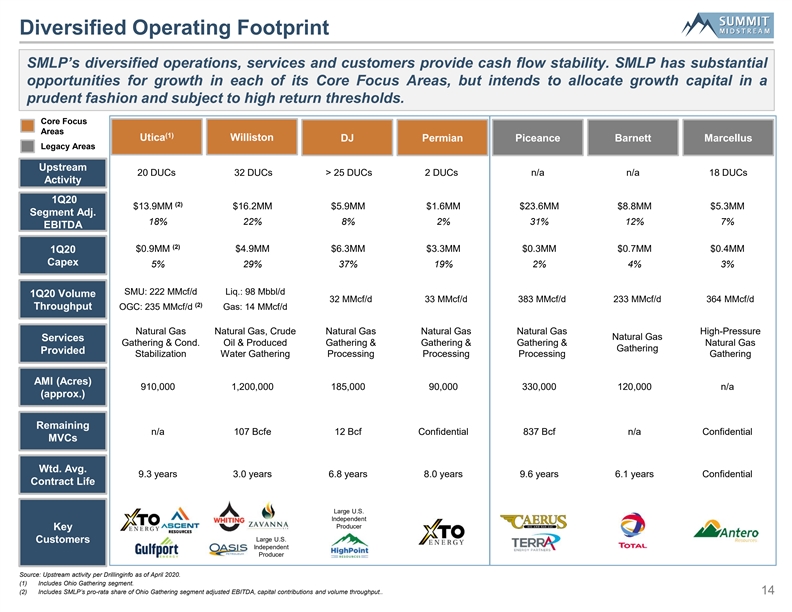
Diversified Operating Footprint SMLP’s diversified operations, services and customers provide cash flow stability. SMLP has substantial opportunities for growth in each of its Core Focus Areas, but intends to allocate growth capital in a prudent fashion and subject to high return thresholds. Core Focus Areas (1) Utica Williston DJ Permian Piceance Barnett Marcellus Legacy Areas Upstream 20 DUCs 32 DUCs > 25 DUCs 2 DUCs n/a n/a 18 DUCs Activity 1Q20 (2) $13.9MM $16.2MM $5.9MM $1.6MM $23.6MM $8.8MM $5.3MM Segment Adj. 18% 22% 8% 2% 31% 12% 7% EBITDA (2) $0.9MM $4.9MM $6.3MM $3.3MM $0.3MM $0.7MM $0.4MM 1Q20 Capex 5% 29% 37% 19% 2% 4% 3% SMU: 222 MMcf/d Liq.: 98 Mbbl/d 1Q20 Volume 32 MMcf/d 33 MMcf/d 383 MMcf/d 233 MMcf/d 364 MMcf/d (2) Throughput OGC: 235 MMcf/d Gas: 14 MMcf/d Natural Gas Natural Gas, Crude Natural Gas Natural Gas Natural Gas High-Pressure Natural Gas Services Gathering & Cond. Oil & Produced Gathering & Gathering & Gathering & Natural Gas Gathering Provided Stabilization Water Gathering Processing Processing Processing Gathering AMI (Acres) 910,000 1,200,000 185,000 90,000 330,000 120,000 n/a (approx.) Remaining n/a 107 Bcfe 12 Bcf Confidential 837 Bcf n/a Confidential MVCs Wtd. Avg. 9.3 years 3.0 years 6.8 years 8.0 years 9.6 years 6.1 years Confidential Contract Life Large U.S. Independent Producer Key Large U.S. Customers Independent Producer Source: Upstream activity per Drillinginfo as of April 2020. (1) Includes Ohio Gathering segment. (2) Includes SMLP’s pro-rata share of Ohio Gathering segment adjusted EBITDA, capital contributions and volume throughput.. 14Diversified Operating Footprint SMLP’s diversified operations, services and customers provide cash flow stability. SMLP has substantial opportunities for growth in each of its Core Focus Areas, but intends to allocate growth capital in a prudent fashion and subject to high return thresholds. Core Focus Areas (1) Utica Williston DJ Permian Piceance Barnett Marcellus Legacy Areas Upstream 20 DUCs 32 DUCs > 25 DUCs 2 DUCs n/a n/a 18 DUCs Activity 1Q20 (2) $13.9MM $16.2MM $5.9MM $1.6MM $23.6MM $8.8MM $5.3MM Segment Adj. 18% 22% 8% 2% 31% 12% 7% EBITDA (2) $0.9MM $4.9MM $6.3MM $3.3MM $0.3MM $0.7MM $0.4MM 1Q20 Capex 5% 29% 37% 19% 2% 4% 3% SMU: 222 MMcf/d Liq.: 98 Mbbl/d 1Q20 Volume 32 MMcf/d 33 MMcf/d 383 MMcf/d 233 MMcf/d 364 MMcf/d (2) Throughput OGC: 235 MMcf/d Gas: 14 MMcf/d Natural Gas Natural Gas, Crude Natural Gas Natural Gas Natural Gas High-Pressure Natural Gas Services Gathering & Cond. Oil & Produced Gathering & Gathering & Gathering & Natural Gas Gathering Provided Stabilization Water Gathering Processing Processing Processing Gathering AMI (Acres) 910,000 1,200,000 185,000 90,000 330,000 120,000 n/a (approx.) Remaining n/a 107 Bcfe 12 Bcf Confidential 837 Bcf n/a Confidential MVCs Wtd. Avg. 9.3 years 3.0 years 6.8 years 8.0 years 9.6 years 6.1 years Confidential Contract Life Large U.S. Independent Producer Key Large U.S. Customers Independent Producer Source: Upstream activity per Drillinginfo as of April 2020. (1) Includes Ohio Gathering segment. (2) Includes SMLP’s pro-rata share of Ohio Gathering segment adjusted EBITDA, capital contributions and volume throughput.. 14

Reportable Segment Adjusted EBITDA Three Months ended March 31, ($s in 000s) 2020 2019 (1) Reportable segment adjusted EBITDA : Utica Shale $5,928 $6,193 (2) Ohio Gathering 7,939 9,210 (3) Williston Basin 16,192 18,734 DJ Basin 5,911 2,673 Permian Basin 1,581 (550) (4) Piceance Basin 23,557 25,999 Barnett Shale 8,760 11,374 Marcellus Shale 5,320 5,142 Total $75,188 $78,775 (5) Less: Corporate and other 9,102 9,805 Adjusted EBITDA $66,086 $68,970 (1) We define segment adjusted EBITDA as total revenues less total costs and expenses, plus (i) other income excluding interest income, (ii) our proportional adjusted EBITDA for equity method investees, (iii) depreciation and amortization, (iv) adjustments related to MVC shortfall payments, (v) adjustments related to capital reimbursement activity, (vi) unit-based and noncash compensation, (vii) change in the Deferred Purchase Price Obligation, (viii) impairments and (ix) other noncash expenses or losses, less other noncash income or gains. (2) Represents our proportional share of adjusted EBITDA for Ohio Gathering, subject to a one-month lag. We define proportional adjusted EBITDA for our equity method investees as the product of (i) total revenues less total expenses, excluding impairments and other noncash income or expense items and (ii) amortization for deferred contract costs; multiplied by our ownership interest in Ohio Gathering during the respective period. (3) The Williston Basin segment includes the Tioga Midstream system, which was sold in March 2019. (4) The Piceance Basin segment includes the RRG West system, which was sold in December 2019. (5) Corporate and Other represents those results that are not specifically attributable to a reportable segment (such as Double E) or that have not been allocated to our reportable segments, including certain general and administrative expense items, natural gas and crude oil marketing services, interest expense and a change in the Deferred Purchase Price Obligation. 15Reportable Segment Adjusted EBITDA Three Months ended March 31, ($s in 000s) 2020 2019 (1) Reportable segment adjusted EBITDA : Utica Shale $5,928 $6,193 (2) Ohio Gathering 7,939 9,210 (3) Williston Basin 16,192 18,734 DJ Basin 5,911 2,673 Permian Basin 1,581 (550) (4) Piceance Basin 23,557 25,999 Barnett Shale 8,760 11,374 Marcellus Shale 5,320 5,142 Total $75,188 $78,775 (5) Less: Corporate and other 9,102 9,805 Adjusted EBITDA $66,086 $68,970 (1) We define segment adjusted EBITDA as total revenues less total costs and expenses, plus (i) other income excluding interest income, (ii) our proportional adjusted EBITDA for equity method investees, (iii) depreciation and amortization, (iv) adjustments related to MVC shortfall payments, (v) adjustments related to capital reimbursement activity, (vi) unit-based and noncash compensation, (vii) change in the Deferred Purchase Price Obligation, (viii) impairments and (ix) other noncash expenses or losses, less other noncash income or gains. (2) Represents our proportional share of adjusted EBITDA for Ohio Gathering, subject to a one-month lag. We define proportional adjusted EBITDA for our equity method investees as the product of (i) total revenues less total expenses, excluding impairments and other noncash income or expense items and (ii) amortization for deferred contract costs; multiplied by our ownership interest in Ohio Gathering during the respective period. (3) The Williston Basin segment includes the Tioga Midstream system, which was sold in March 2019. (4) The Piceance Basin segment includes the RRG West system, which was sold in December 2019. (5) Corporate and Other represents those results that are not specifically attributable to a reportable segment (such as Double E) or that have not been allocated to our reportable segments, including certain general and administrative expense items, natural gas and crude oil marketing services, interest expense and a change in the Deferred Purchase Price Obligation. 15

Reconciliation of Net Income or Loss to adj. EBITDA and DCF Three Months Ended March 31, Year Ended December 31, ($s in 000s) 2020 2019 2019 2018 2017 2016 Net income / (loss) $5,309 ($36,914) ($369,833) $42,351 $86,050 ($38,187) Add: Interest expense 20,218 17,527 74,429 60,535 68,131 63,810 Income tax (benefit) expense (28) 207 1,174 33 3 41 75 (1) Depreciation and amortization 29,863 28,116 111,426 106,767 114,872 112,661 (2) Proportional adjusted EBITDA for equity method investees 7,939 9,210 39,126 39,969 41,246 45,602 (3) Adjustments related to MVC shortfall payments (5,442) (4,199) 3,476 (3,632) (41,373) 11,600 (4) Adjustments related to capital reimbursement activity (211) (715) (2,156) (427) - - Unit-based and noncash compensation 2,723 2,526 8,171 8,328 7,951 7,985 (5) Deferred Purchase Price Obligation 2,297 4,427 (1,982) 20,975 (200,322) 55,854 (6) Early extinguishment of debt - - - - 22,039 - Loss (gain) on asset sales, net 115 (961) (1,536) - 5 27 93 Long-lived asset impairment 3,821 44,951 60,507 7,186 188,702 1,764 Goodwill impairment - - 16,211 - - - (7) Other, net 2,793 4,354 10,277 1,112 - - Less: Income (loss) from equity method investees 3,311 (441) (337,851) (10,888) (2,223) (30,344) Adjusted EBITDA $66,086 $68,970 $287,141 $294,085 $290,387 $291,601 Less: Cash interest paid 16,523 15,229 76,883 64,678 71,488 63,000 Cash paid for taxes - - 1 50 1 75 - (50) (8) Senior notes interest adjustment 3,063 3,063 - - (5,261) - (9) Distributions to Series A Preferred unitholders - - 28,500 28,500 2,375 - (10) Series A Preferred units distribution adjustment 7,125 7,125 - - 1,188 - Maintenance capital expenditures 5,131 3,325 14,175 21,430 15,587 17,745 Distributable cash flow $34,244 $40,228 $167,433 $179,302 $205,010 $210,906 (1) Includes the amortization expense associated with our favorable gas gathering contracts as reported in other revenues. (2) Reflects our proportionate share of Ohio Gathering adjusted EBITDA, subject to a one-month lag. (3) Adjustments related to MVC shortfall payments recognize the earnings from MVC shortfall payments ratably over the term of the associated MVC. (4) Adjustments related to capital reimbursement activity represent contributions in aid of construction revenue recognized in accordance with Accounting Standards Update No. 2014-09 Revenue from Contracts with Customers ( Topic 606 ). (5) Deferred Purchase Price Obligation represents the change in the present value of the Deferred Purchase Price Obligation. (6) Represents items of income or loss that we characterize as unrepresentative of our ongoing operations, including, in the three months and the year ended December 31, 2019, $5.0 million related to restructuring expenses and $0.7 million of transaction costs associated with the November 2019 DPPO amendment. For the year ended December 31, 2019, the amount includes $3.4 million of severance expense associated with our former Chief Executive Officer, $0.9 million of transaction costs associated with the Equity Restructuring, and $0.9 million of transaction costs primarily associated with the November 2019 DPPO amendment. For the three months and the year ended December 31, 2018, the amount consisted of severance expense to our former Chief Financial Officer. (7) Represents items of income or loss that we characterize as unrepresentative of our ongoing operations. For the three months ended March 31, 2020, the amount represents restructuring expenses. For the three months ended March 31, 2019, the amount includes $3.4 million of severance expense associated with our former Chief Executive Officer and $0.9 million of transaction costs associated with the Equity Restructuring. (8) Senior notes interest adjustment represents the net of interest expense accrued and paid during the period. Interest on the $300.0 million 5.5% senior notes is paid in cash semi-annually in arrears on February 15 and August 15 until maturity in August 2022. Interest on the $500.0 million 5.75% senior notes is paid in cash semi-annually in arrears on April 15 and October 15 until maturity in April 2025. (9) Distributions on the Series A Preferred Units are paid in cash semi-annually in arrears on June 15 and December 15 each year, through and including December 15, 2022, and, thereafter, quarterly in arrears on the 15th day of March, June, September and December of each year. (10) Series A Preferred unit distribution adjustment represents the net of distributions paid and accrued on the Series A Preferred units. Distributions on the Series A Preferred Units are paid or accrued semi-annually in arrears on June 15 and December 15 each year, through and including December 15, 2022, and, thereafter, quarterly in arrears on the 15th day of March, June, September and December of each year. 16Reconciliation of Net Income or Loss to adj. EBITDA and DCF Three Months Ended March 31, Year Ended December 31, ($s in 000s) 2020 2019 2019 2018 2017 2016 Net income / (loss) $5,309 ($36,914) ($369,833) $42,351 $86,050 ($38,187) Add: Interest expense 20,218 17,527 74,429 60,535 68,131 63,810 Income tax (benefit) expense (28) 207 1,174 33 3 41 75 (1) Depreciation and amortization 29,863 28,116 111,426 106,767 114,872 112,661 (2) Proportional adjusted EBITDA for equity method investees 7,939 9,210 39,126 39,969 41,246 45,602 (3) Adjustments related to MVC shortfall payments (5,442) (4,199) 3,476 (3,632) (41,373) 11,600 (4) Adjustments related to capital reimbursement activity (211) (715) (2,156) (427) - - Unit-based and noncash compensation 2,723 2,526 8,171 8,328 7,951 7,985 (5) Deferred Purchase Price Obligation 2,297 4,427 (1,982) 20,975 (200,322) 55,854 (6) Early extinguishment of debt - - - - 22,039 - Loss (gain) on asset sales, net 115 (961) (1,536) - 5 27 93 Long-lived asset impairment 3,821 44,951 60,507 7,186 188,702 1,764 Goodwill impairment - - 16,211 - - - (7) Other, net 2,793 4,354 10,277 1,112 - - Less: Income (loss) from equity method investees 3,311 (441) (337,851) (10,888) (2,223) (30,344) Adjusted EBITDA $66,086 $68,970 $287,141 $294,085 $290,387 $291,601 Less: Cash interest paid 16,523 15,229 76,883 64,678 71,488 63,000 Cash paid for taxes - - 1 50 1 75 - (50) (8) Senior notes interest adjustment 3,063 3,063 - - (5,261) - (9) Distributions to Series A Preferred unitholders - - 28,500 28,500 2,375 - (10) Series A Preferred units distribution adjustment 7,125 7,125 - - 1,188 - Maintenance capital expenditures 5,131 3,325 14,175 21,430 15,587 17,745 Distributable cash flow $34,244 $40,228 $167,433 $179,302 $205,010 $210,906 (1) Includes the amortization expense associated with our favorable gas gathering contracts as reported in other revenues. (2) Reflects our proportionate share of Ohio Gathering adjusted EBITDA, subject to a one-month lag. (3) Adjustments related to MVC shortfall payments recognize the earnings from MVC shortfall payments ratably over the term of the associated MVC. (4) Adjustments related to capital reimbursement activity represent contributions in aid of construction revenue recognized in accordance with Accounting Standards Update No. 2014-09 Revenue from Contracts with Customers ( Topic 606 ). (5) Deferred Purchase Price Obligation represents the change in the present value of the Deferred Purchase Price Obligation. (6) Represents items of income or loss that we characterize as unrepresentative of our ongoing operations, including, in the three months and the year ended December 31, 2019, $5.0 million related to restructuring expenses and $0.7 million of transaction costs associated with the November 2019 DPPO amendment. For the year ended December 31, 2019, the amount includes $3.4 million of severance expense associated with our former Chief Executive Officer, $0.9 million of transaction costs associated with the Equity Restructuring, and $0.9 million of transaction costs primarily associated with the November 2019 DPPO amendment. For the three months and the year ended December 31, 2018, the amount consisted of severance expense to our former Chief Financial Officer. (7) Represents items of income or loss that we characterize as unrepresentative of our ongoing operations. For the three months ended March 31, 2020, the amount represents restructuring expenses. For the three months ended March 31, 2019, the amount includes $3.4 million of severance expense associated with our former Chief Executive Officer and $0.9 million of transaction costs associated with the Equity Restructuring. (8) Senior notes interest adjustment represents the net of interest expense accrued and paid during the period. Interest on the $300.0 million 5.5% senior notes is paid in cash semi-annually in arrears on February 15 and August 15 until maturity in August 2022. Interest on the $500.0 million 5.75% senior notes is paid in cash semi-annually in arrears on April 15 and October 15 until maturity in April 2025. (9) Distributions on the Series A Preferred Units are paid in cash semi-annually in arrears on June 15 and December 15 each year, through and including December 15, 2022, and, thereafter, quarterly in arrears on the 15th day of March, June, September and December of each year. (10) Series A Preferred unit distribution adjustment represents the net of distributions paid and accrued on the Series A Preferred units. Distributions on the Series A Preferred Units are paid or accrued semi-annually in arrears on June 15 and December 15 each year, through and including December 15, 2022, and, thereafter, quarterly in arrears on the 15th day of March, June, September and December of each year. 16
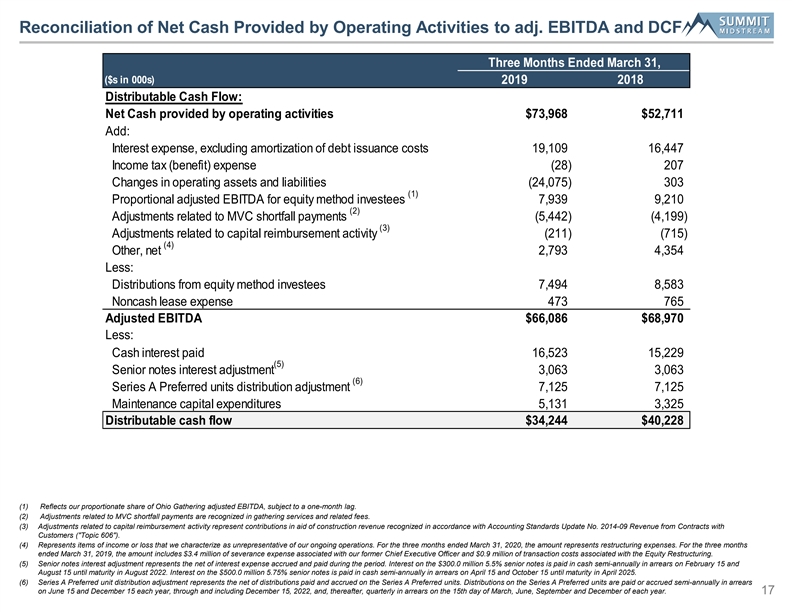
Reconciliation of Net Cash Provided by Operating Activities to adj. EBITDA and DCF Three Months Ended March 31, ($s in 000s) 2019 2018 Distributable Cash Flow: Net Cash provided by operating activities $73,968 $52,711 Add: Interest expense, excluding amortization of debt issuance costs 19,109 16,447 Income tax (benefit) expense (28) 207 Changes in operating assets and liabilities (24,075) 303 (1) Proportional adjusted EBITDA for equity method investees 7,939 9,210 (2) Adjustments related to MVC shortfall payments (5,442) (4,199) (3) Adjustments related to capital reimbursement activity (211) (715) (4) Other, net 2,793 4,354 Less: Distributions from equity method investees 7,494 8,583 Noncash lease expense 473 765 Adjusted EBITDA $66,086 $68,970 Less: Cash interest paid 16,523 15,229 (5) Senior notes interest adjustment 3,063 3,063 (6) Series A Preferred units distribution adjustment 7,125 7,125 Maintenance capital expenditures 5,131 3,325 Distributable cash flow $34,244 $40,228 (1) Reflects our proportionate share of Ohio Gathering adjusted EBITDA, subject to a one-month lag. (2) Adjustments related to MVC shortfall payments are recognized in gathering services and related fees. (3) Adjustments related to capital reimbursement activity represent contributions in aid of construction revenue recognized in accordance with Accounting Standards Update No. 2014-09 Revenue from Contracts with Customers ( Topic 606 ). (4) Represents items of income or loss that we characterize as unrepresentative of our ongoing operations. For the three months ended March 31, 2020, the amount represents restructuring expenses. For the three months ended March 31, 2019, the amount includes $3.4 million of severance expense associated with our former Chief Executive Officer and $0.9 million of transaction costs associated with the Equity Restructuring. (5) Senior notes interest adjustment represents the net of interest expense accrued and paid during the period. Interest on the $300.0 million 5.5% senior notes is paid in cash semi-annually in arrears on February 15 and August 15 until maturity in August 2022. Interest on the $500.0 million 5.75% senior notes is paid in cash semi-annually in arrears on April 15 and October 15 until maturity in April 2025. (6) Series A Preferred unit distribution adjustment represents the net of distributions paid and accrued on the Series A Preferred units. Distributions on the Series A Preferred units are paid or accrued semi-annually in arrears on June 15 and December 15 each year, through and including December 15, 2022, and, thereafter, quarterly in arrears on the 15th day of March, June, September and December of each year. 17Reconciliation of Net Cash Provided by Operating Activities to adj. EBITDA and DCF Three Months Ended March 31, ($s in 000s) 2019 2018 Distributable Cash Flow: Net Cash provided by operating activities $73,968 $52,711 Add: Interest expense, excluding amortization of debt issuance costs 19,109 16,447 Income tax (benefit) expense (28) 207 Changes in operating assets and liabilities (24,075) 303 (1) Proportional adjusted EBITDA for equity method investees 7,939 9,210 (2) Adjustments related to MVC shortfall payments (5,442) (4,199) (3) Adjustments related to capital reimbursement activity (211) (715) (4) Other, net 2,793 4,354 Less: Distributions from equity method investees 7,494 8,583 Noncash lease expense 473 765 Adjusted EBITDA $66,086 $68,970 Less: Cash interest paid 16,523 15,229 (5) Senior notes interest adjustment 3,063 3,063 (6) Series A Preferred units distribution adjustment 7,125 7,125 Maintenance capital expenditures 5,131 3,325 Distributable cash flow $34,244 $40,228 (1) Reflects our proportionate share of Ohio Gathering adjusted EBITDA, subject to a one-month lag. (2) Adjustments related to MVC shortfall payments are recognized in gathering services and related fees. (3) Adjustments related to capital reimbursement activity represent contributions in aid of construction revenue recognized in accordance with Accounting Standards Update No. 2014-09 Revenue from Contracts with Customers ( Topic 606 ). (4) Represents items of income or loss that we characterize as unrepresentative of our ongoing operations. For the three months ended March 31, 2020, the amount represents restructuring expenses. For the three months ended March 31, 2019, the amount includes $3.4 million of severance expense associated with our former Chief Executive Officer and $0.9 million of transaction costs associated with the Equity Restructuring. (5) Senior notes interest adjustment represents the net of interest expense accrued and paid during the period. Interest on the $300.0 million 5.5% senior notes is paid in cash semi-annually in arrears on February 15 and August 15 until maturity in August 2022. Interest on the $500.0 million 5.75% senior notes is paid in cash semi-annually in arrears on April 15 and October 15 until maturity in April 2025. (6) Series A Preferred unit distribution adjustment represents the net of distributions paid and accrued on the Series A Preferred units. Distributions on the Series A Preferred units are paid or accrued semi-annually in arrears on June 15 and December 15 each year, through and including December 15, 2022, and, thereafter, quarterly in arrears on the 15th day of March, June, September and December of each year. 17

(1) Adjustments Related to MVC Shortfall Payments Three Months Ended March 31, 2020 MVC Gathering Adjustments to MVC Net Impact to ($s in 000s) Billings Revenue Shortfall Payments Adjusted EBITDA Net change in deferred revenue related to MVC shortfall payments: Piceance Basin $3,658 $3,658 $- $3,658 Total net change $3,658 $3,658 $- $3,658 MVC shortfall payment adjustments: Williston Basin $1,002 $8,792 ($5,665) $3,127 Piceance Basin 6,956 6,851 2 23 7,074 Marcellus Shale 1,286 1,286 - 1,286 Total MVC shortfall payment adjustments $9,244 $16,929 ($5,442) $11,487 (2) Total $12,902 $20,587 ($5,442) $15,145 (1) Adjustments related to MVC shortfall payments account for (i) the net increases or decreases in deferred revenue for MVC shortfall payments and (ii) our inclusion of expected annual MVC shortfall payments. (2) Exclusive of Ohio Gathering due to equity method accounting. 18(1) Adjustments Related to MVC Shortfall Payments Three Months Ended March 31, 2020 MVC Gathering Adjustments to MVC Net Impact to ($s in 000s) Billings Revenue Shortfall Payments Adjusted EBITDA Net change in deferred revenue related to MVC shortfall payments: Piceance Basin $3,658 $3,658 $- $3,658 Total net change $3,658 $3,658 $- $3,658 MVC shortfall payment adjustments: Williston Basin $1,002 $8,792 ($5,665) $3,127 Piceance Basin 6,956 6,851 2 23 7,074 Marcellus Shale 1,286 1,286 - 1,286 Total MVC shortfall payment adjustments $9,244 $16,929 ($5,442) $11,487 (2) Total $12,902 $20,587 ($5,442) $15,145 (1) Adjustments related to MVC shortfall payments account for (i) the net increases or decreases in deferred revenue for MVC shortfall payments and (ii) our inclusion of expected annual MVC shortfall payments. (2) Exclusive of Ohio Gathering due to equity method accounting. 18

Cash Paid for Capital Expenditures Three Months ended March 31, ($s in 000s) 2020 2019 (1) Cash paid for capital expenditures : Utica Shale $909 $101 Williston Basin 4,943 8,023 DJ Basin 6,298 28,356 Permian Basin 3,281 7,057 Piceance Basin 346 1,226 (2) Barnett Shale 657 (118) Marcellus Shale 422 102 Total $16,856 $44,747 (3) Corporate and Other $1,727 16,101 Total cash paid for capital expenditures $18,583 $60,848 (1) Excludes cash paid for capital expenditures by Ohio Gathering and Double E (after June 2019) due to equity method accounting. (2) For the three months ended March 31, 2019, the amount includes sales tax reimbursements of $1.1 million. (3) For the three months ended March 31, 2019, and through the formation date of the Double E joint venture in June 2019, reflects 100% of the capital expenditures associated with Double E and excludes capital contributions made by our JV partner. 19Cash Paid for Capital Expenditures Three Months ended March 31, ($s in 000s) 2020 2019 (1) Cash paid for capital expenditures : Utica Shale $909 $101 Williston Basin 4,943 8,023 DJ Basin 6,298 28,356 Permian Basin 3,281 7,057 Piceance Basin 346 1,226 (2) Barnett Shale 657 (118) Marcellus Shale 422 102 Total $16,856 $44,747 (3) Corporate and Other $1,727 16,101 Total cash paid for capital expenditures $18,583 $60,848 (1) Excludes cash paid for capital expenditures by Ohio Gathering and Double E (after June 2019) due to equity method accounting. (2) For the three months ended March 31, 2019, the amount includes sales tax reimbursements of $1.1 million. (3) For the three months ended March 31, 2019, and through the formation date of the Double E joint venture in June 2019, reflects 100% of the capital expenditures associated with Double E and excludes capital contributions made by our JV partner. 19