Attached files
| file | filename |
|---|---|
| 8-K - 8-K - Embassy Bancorp, Inc. | emyb-20200618x8k.htm |
Exhibit 99.1

Embassy Bank for the Lehigh Valley
Embassy Bank.com
Member FDIC Equal Housing Lender
Exhibit 99.1
2020 Annual Meeting of Shareholders
June 18, 2020
2
Exhibit 99.1

Welcome-Lynne Neel
3
Embassy Bank For the Lehigh Valley EmbassyBank.com
Member FDIC Equal Housing Lender
Exhibit 99.1
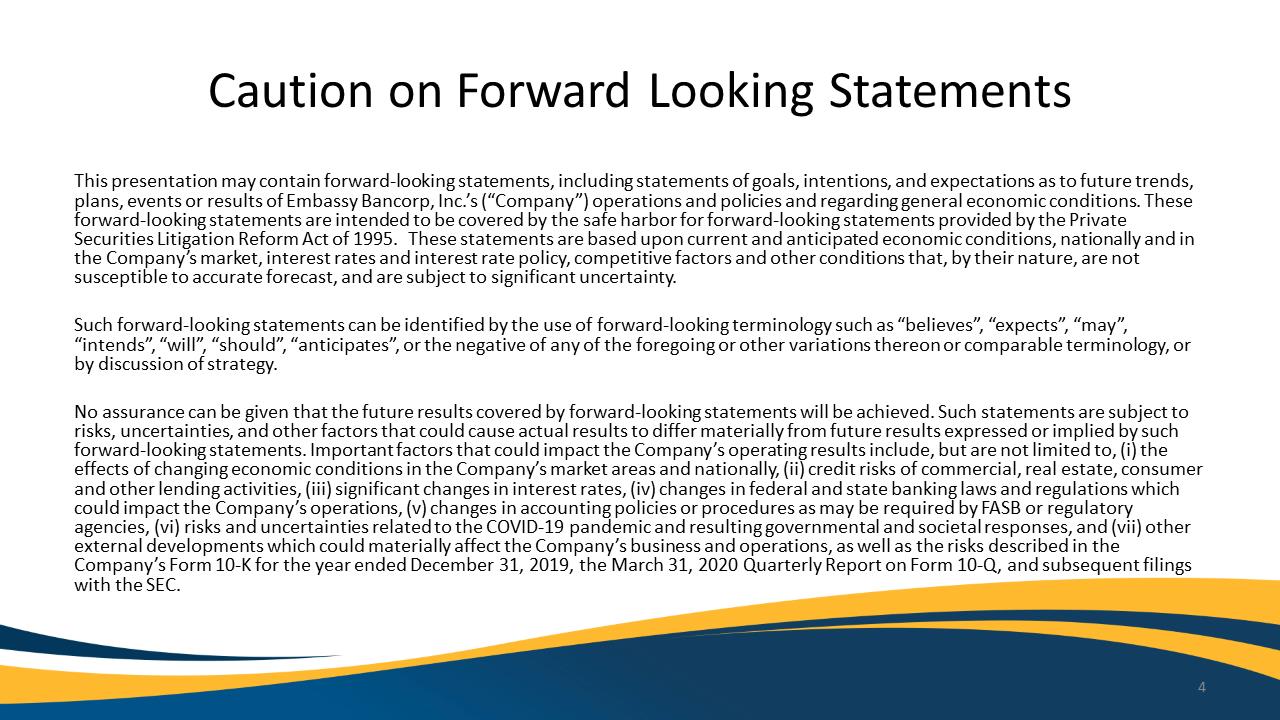
Caution on Forward Looking Statements
This presentation may contain forward-looking statements, including statements of goals, intentions, and expectations as to future trends, plans, events or results of Embassy Bancorp, Inc.’s (“Company”) operations and policies and regarding general economic conditions. These forward-looking statements are intended to be covered by the safe harbor for forward-looking statements provided by the Private Securities Litigation Reform Act of 1995.These statements are based upon current and anticipated economic conditions, nationally and in the Company’s market, interest rates and interest rate policy, competitive factors and other conditions that, by their nature, are not susceptible to accurate forecast, and are subject to significant uncertainty.
Such forward-looking statements can be identified by the use of forward-looking terminology such as “believes”, “expects”, “may”, “intends”, “will”, “should”, “anticipates”, or the negative of any of the foregoing or other variations thereon or comparable terminology, or by discussion of strategy.
No assurance can be given that the future results covered by forward-looking statements will be achieved. Such statements are subject to risks, uncertainties, and other factors that could cause actual results to differ materially from future results expressed or implied by such forward-looking statements. Important factors that could impact the Company’s operating results include, but are not limited to,(i) the effects of changing economic conditions in the Company’s market areas and nationally, (ii) credit risks of commercial, real estate, consumer and other lending activities, (iii) significant changes in interest rates, (iv) changes in federal and state banking laws and regulations which could impact the Company’s operations, (v) changes in accounting policies or procedures as may be required by FASB or regulatory agencies,(vi) risks and uncertainties related to the COVID-19 pandemic and resulting governmental and societal responses,and (vii) other external developments which could materially affect the Company’s business and operations, as well as the risks described in the Company’s Form 10-K for the year ended December 31, 2019, the March 31, 2020 Quarterly Report on Form 10-Q,and subsequent filings with the SEC.
4
Exhibit 99.1

Introductions
5
Embassy Bank For the Lehigh Valley EmbassyBank.com
Member FDIC Equal Housing Lender
Exhibit 99.1
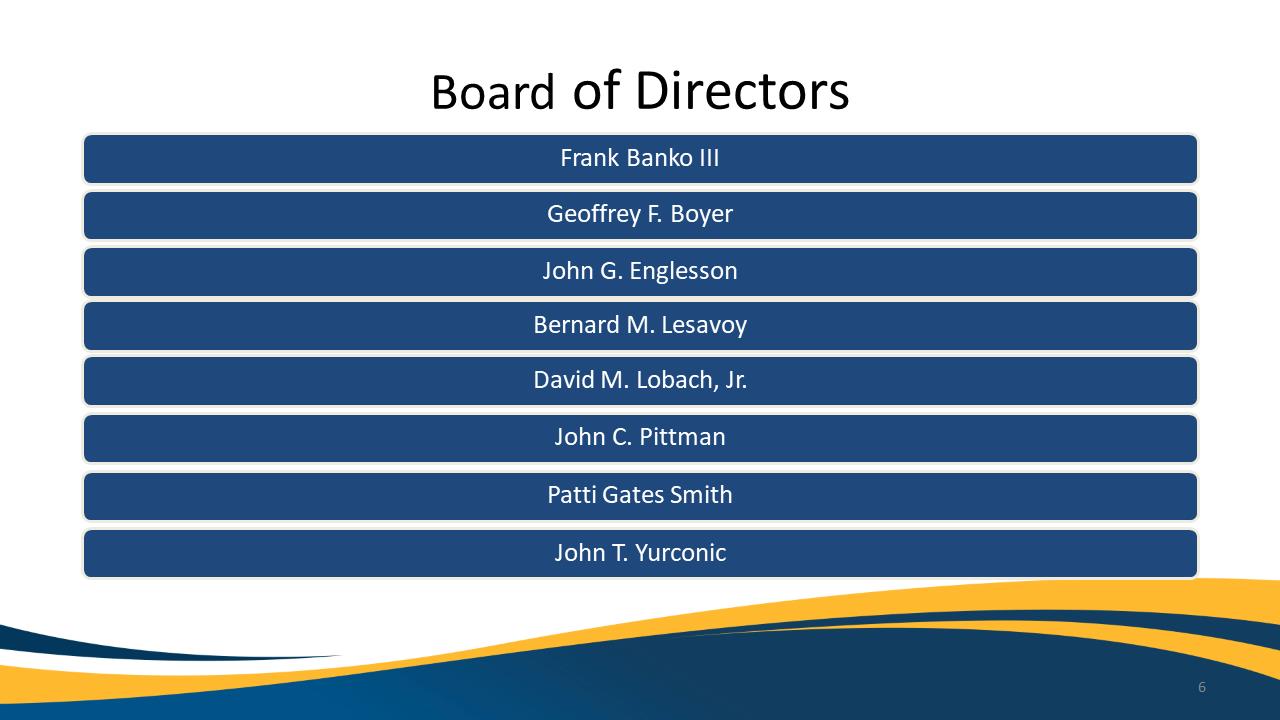
Board of Directors
Frank Banko III
Geoffrey F. Boyer
John G. Englesson
Bernard M. Lesavoy
David M. Lobach, Jr.
John C. Pittman
Patti Gates Smith
John T. Yurconic
6
Exhibit 99.1

Strategic Leadership Team
Dave Lobach
Judy Hunsicker
Jim Bartholomew
Lynne Neel
Diane Cunningham
Mark Casciano
7
Exhibit 99.1
Presentation Agenda
•
Call to Order and Business Meeting
•
Key Drivers of Performance
•
Financial Results
•
Who We Are
•
COVID-19 Pandemic Response
•
Shareholder Value
Please:
No Video / Audio Recording
No Photography
8
Exhibit 99.1
Call to Order
-David Lobach
9
Exhibit 99.1

Business Meeting
-Judith Hunsicker
10
Exhibit 99.1

Business Meeting
|
|
Proposals Proposal No. 1 -Election of Directors Frank “Chip” Banko III |
|
|
Geoffrey Boyer |
|
|
|
|
|
Proposal No. 2 –Ratification of Independent Registered Public Accounting Firm Baker Tilly Virchow Krause, LLP |
|
|
|
|
|
|
11
Exhibit 99.1
Key Drivers of Performance
-David Lobach
12
Exhibit 99.1
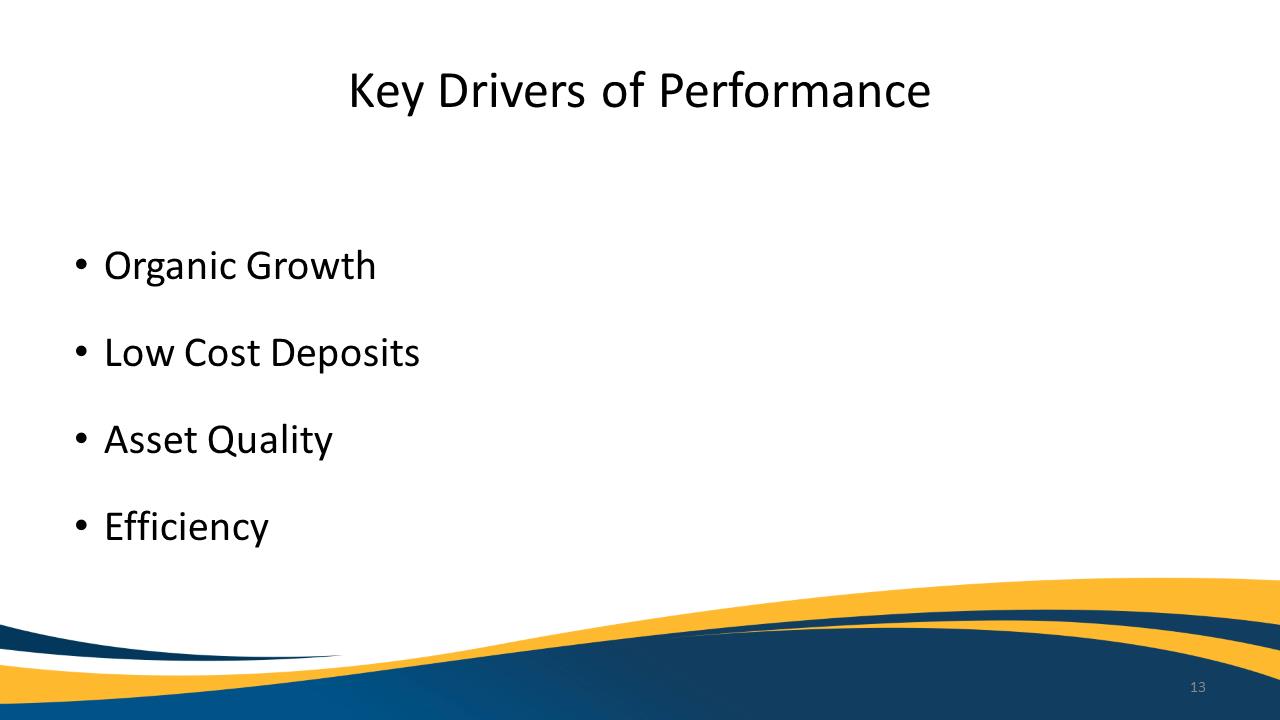
Key Drivers of Performance
|
|
Organic Growth |
|
|
Low Cost Deposits |
|
|
Asset Quality |
|
|
Efficiency |
13
Exhibit 99.1
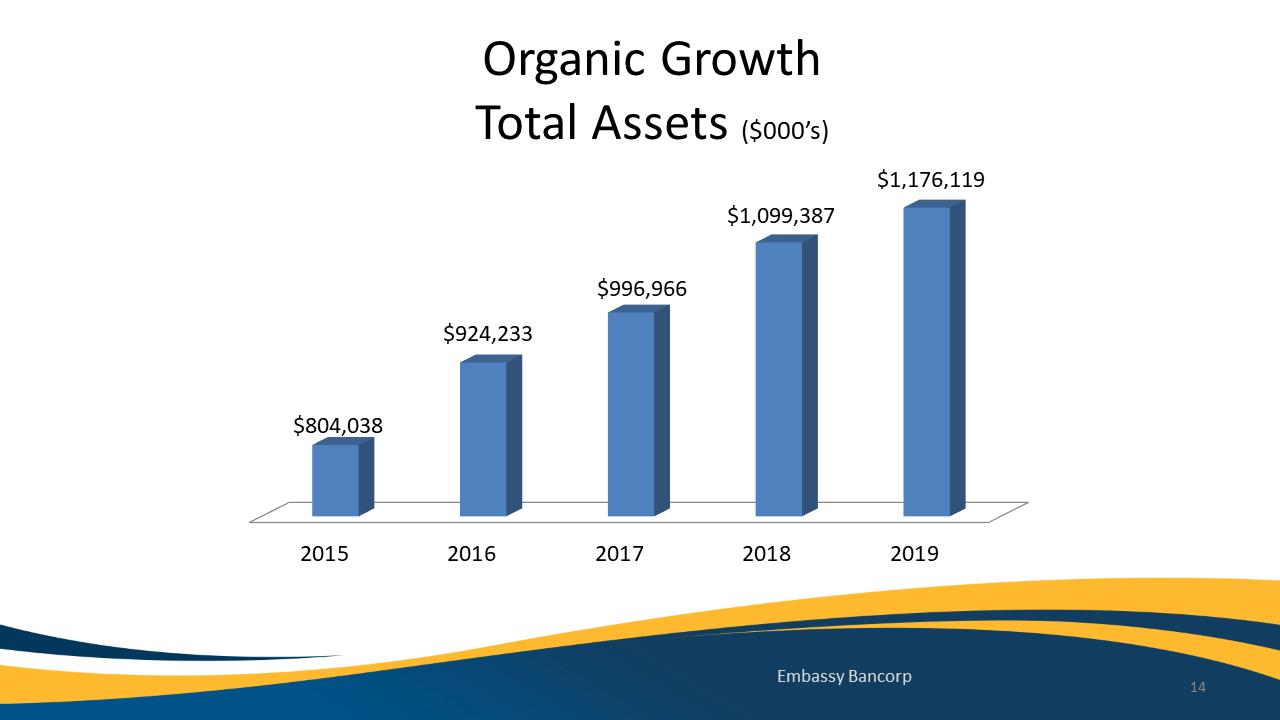
Organic Growth Total Assets ($000’s)
2015
2016
2017
2018
2019
$804,038
$924,233
$996,966
$1,099,387
$1,176,119
Embassy Bancorp
14
Exhibit 99.1
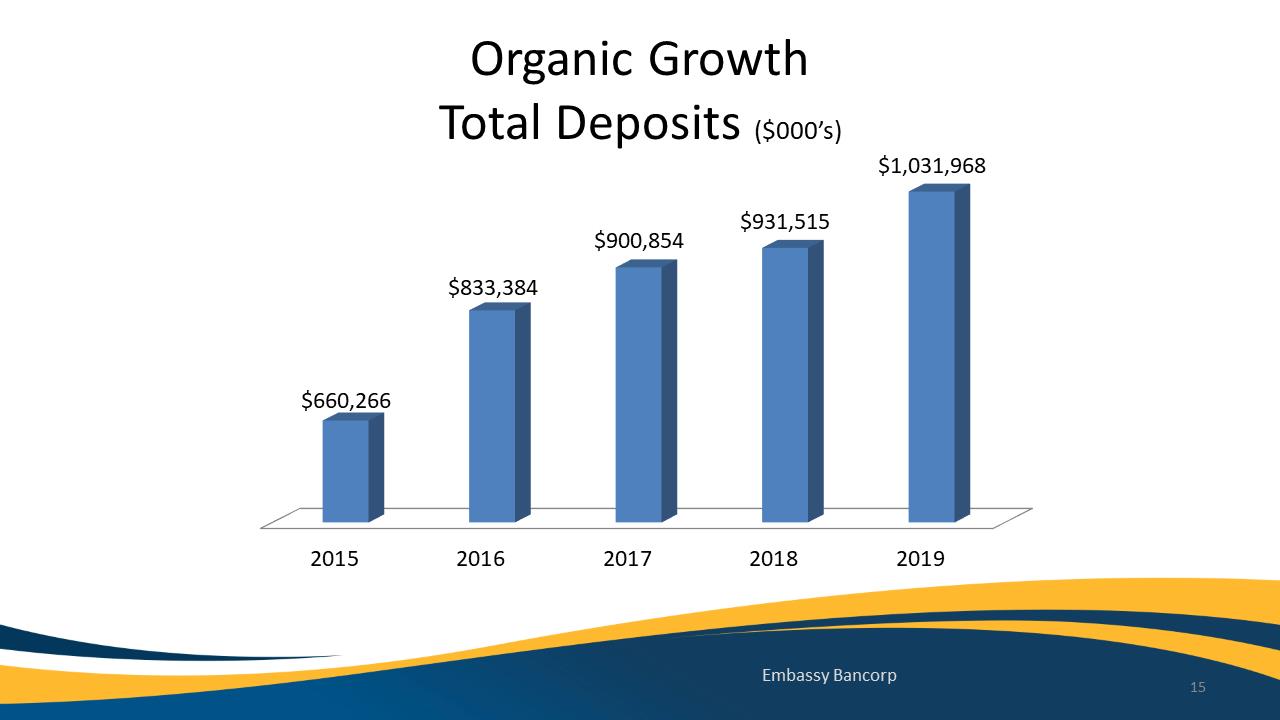
Organic Growth Total Deposits ($000’s)
2015
2016
2017
2018
2019
$660,266
$833,384
$900,854
$931,515
$1,031,968
Embassy Bancorp
15
Exhibit 99.1
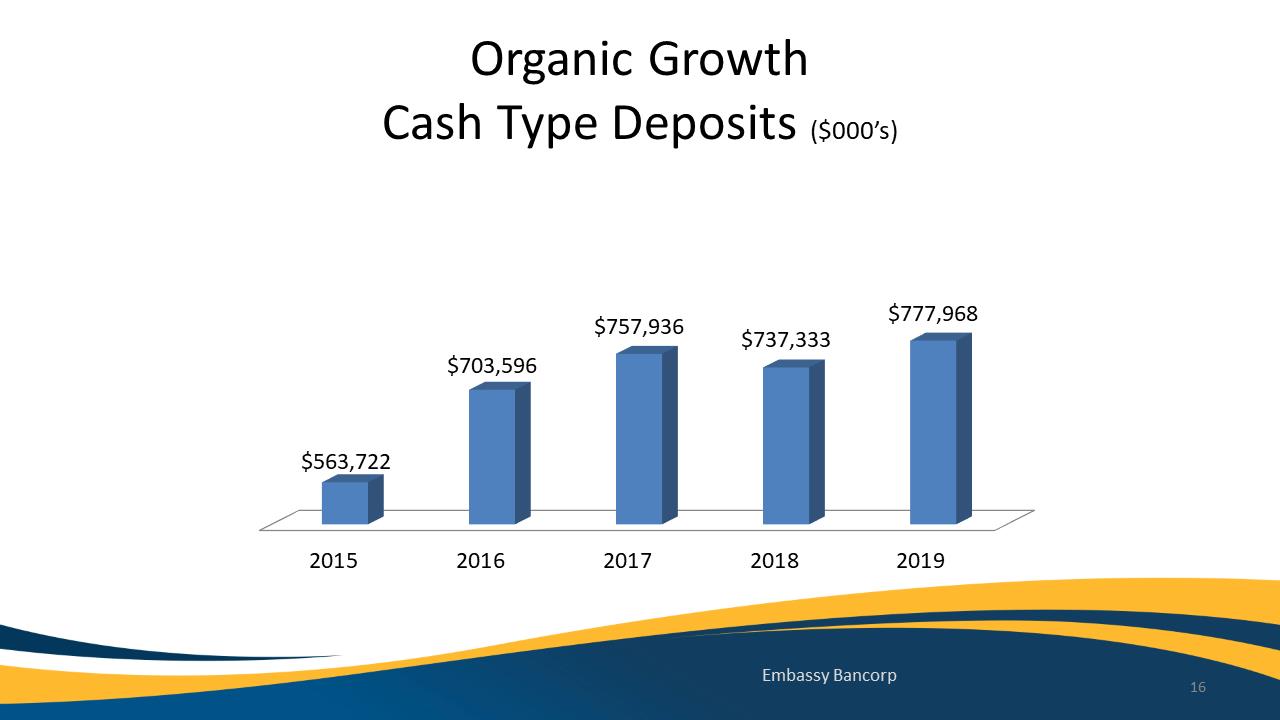
Organic Growth Cash Type Deposits ($000’s)
2015
2016
2017
2018
2019
$563,722
$703,596
$757,936
$737,333
$777,968
Embassy Bancorp
16
Exhibit 99.1
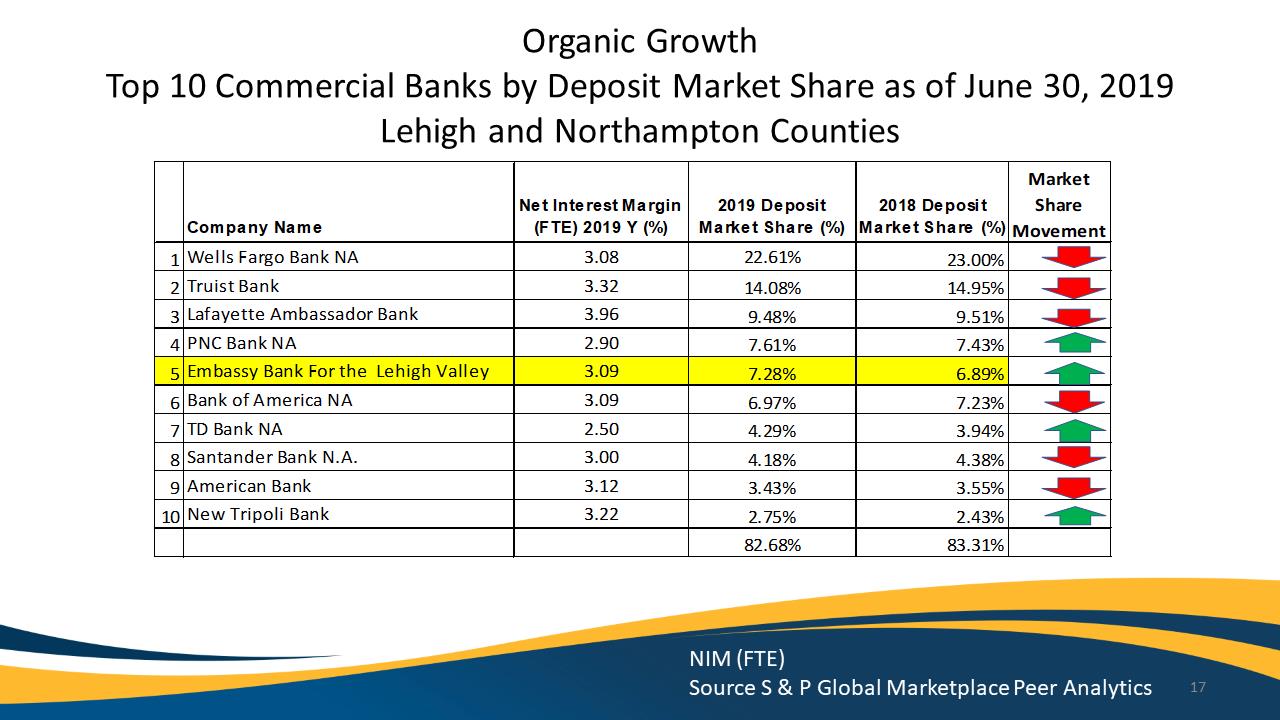
Organic Growth Top 10 Commercial Banks by Deposit Market Share as of June 30, 2019Lehigh and Northampton Counties
NIM (FTE)
Source S & P Global Marketplace Peer Analytics Company Name Net Interest Margin (FTE) 2019 Y (%)2019 Deposit Market Share (%)2018 Deposit Market Share (%)Market Share Movement1Wells Fargo Bank NA3.0822.61%23.00%2Truist Bank3.3214.08%14.95%3Lafayette Ambassador Bank3.969.48%9.51%4PNC Bank NA2.907.61%7.43%5Embassy Bank For the Lehigh Valley3.097.28%6.89%6Bank of America NA3.096.97%7.23%7TD Bank NA2.504.29%3.94%8Santander Bank N.A.3.004.18%4.38%9American Bank3.123.43%3.55%10New Tripoli Bank3.222.75%2.43%82.68%83.31%17
Exhibit 99.1
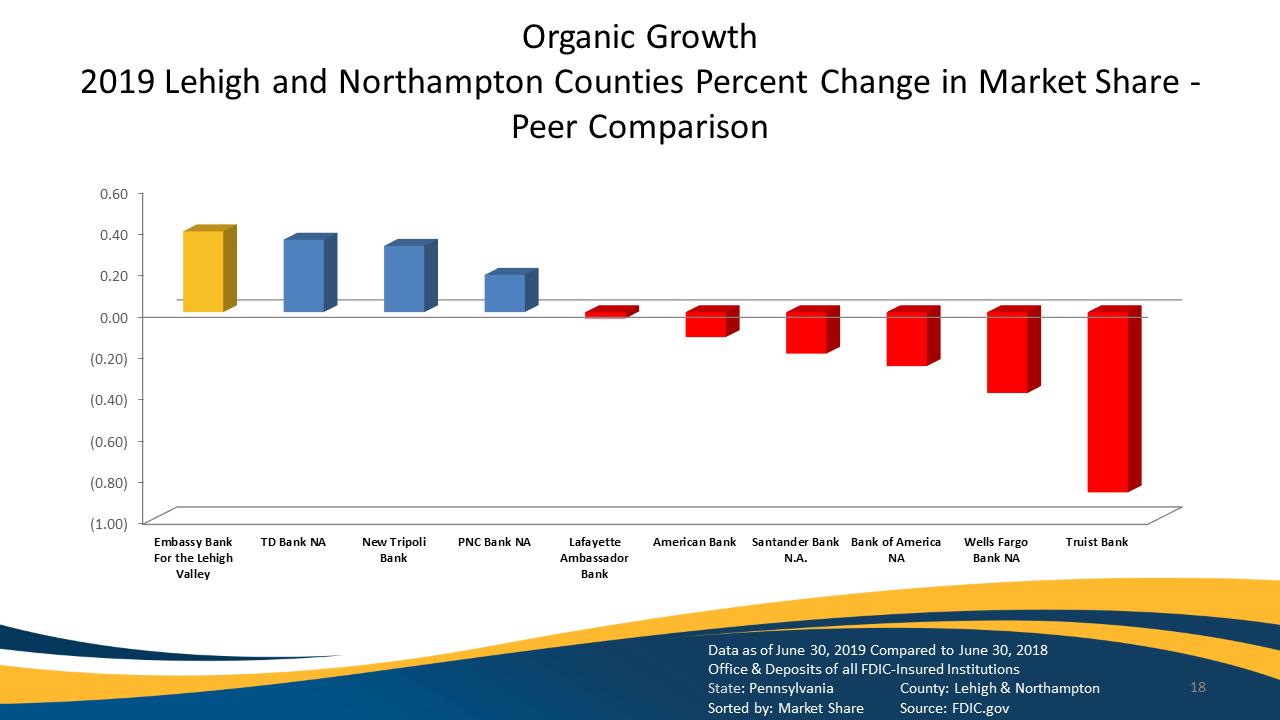
Organic Growth2019 Lehigh and Northampton Counties Percent Change in Market Share -Peer Comparison
Data as of June 30, 2019 Compared to June 30, 2018
Office & Deposits of all FDIC-Insured Institutions
State: Pennsylvania County: Lehigh & Northampton
Sorted by: Market Share Source: FDIC.gov
(1.00)
(0.80)
(0.60)
(0.40)
(0.20)
0.00
0.20
0.40
0.60
Embassy Bank For the Lehigh Valley
TD Bank NA
New Tripoli Bank
PNC Bank NA
LafayetteAmbassadorBank
American Bank
Santander BankN.A.
Bank of AmericaNA
Wells Fargo Bank NA
Truist Bank
18
Exhibit 99.1
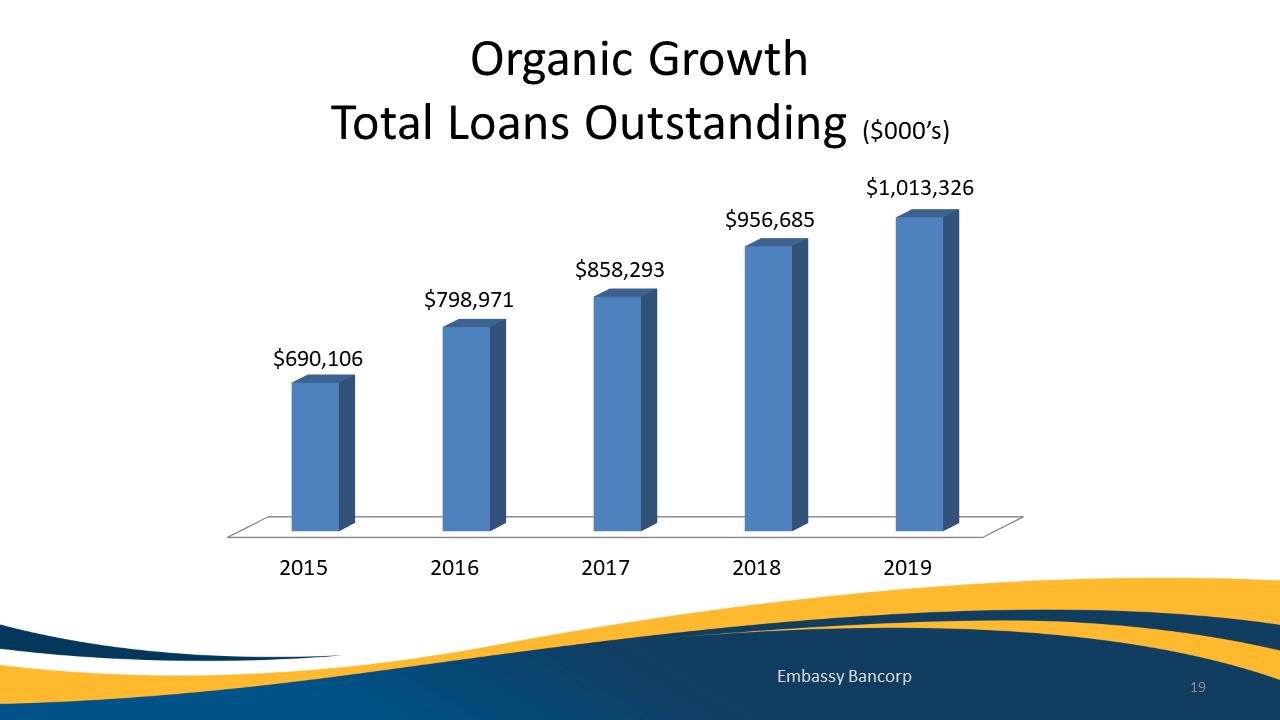
Organic Growth Total Loans Outstanding ($000’s)
2015
2016
2017
2018
2019
$690,106
$798,971
$858,293
$956,685
$1,013,326
Embassy Bancorp 19
Exhibit 99.1
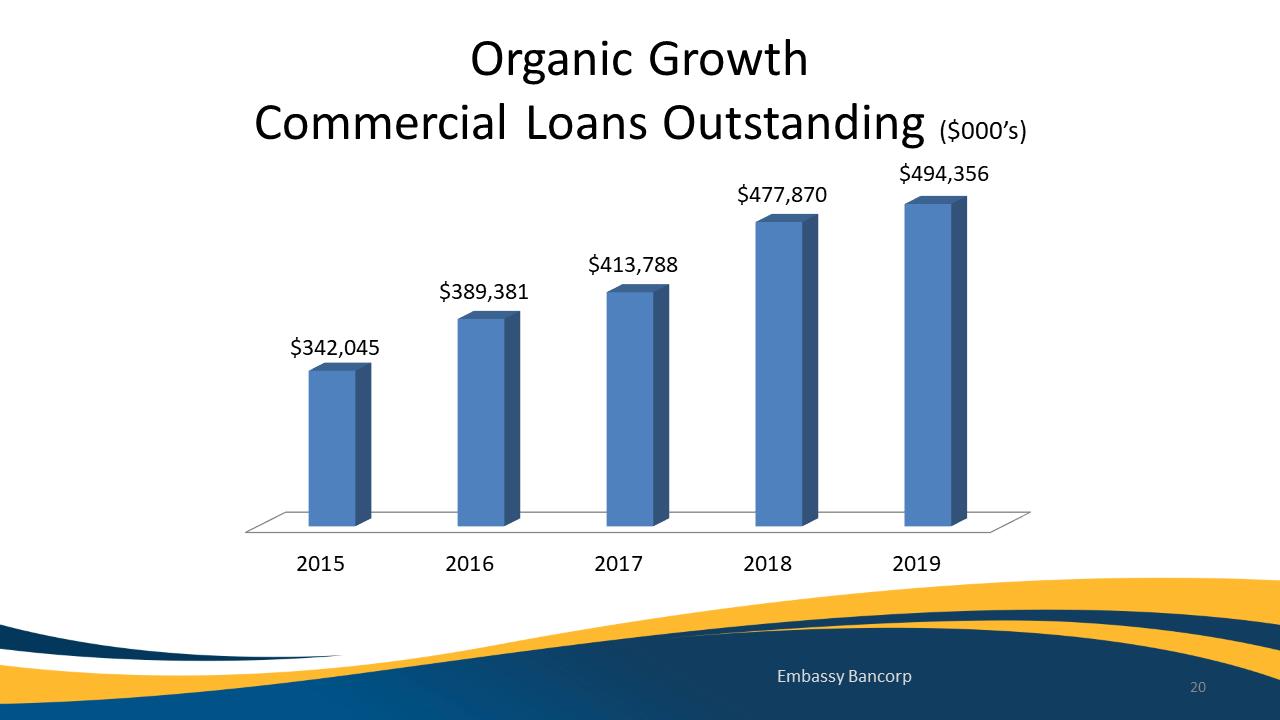
Organic Growth Commercial Loans Outstanding ($000’s)
2015
2016
2017
2018
2019
$342,045
$389,381
$413,788
$477,870
$494,356
Embassy Bancorp 20
Exhibit 99.1
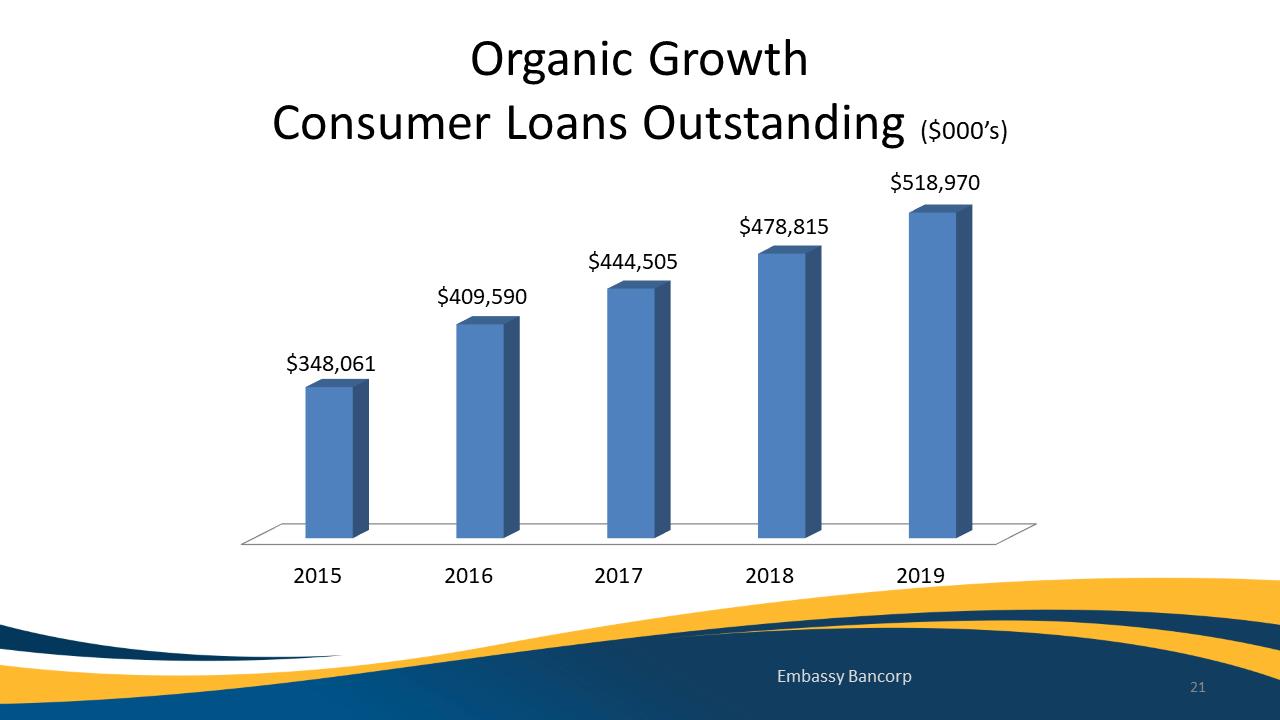
Organic Growth Consumer Loans Outstanding ($000’s)
2015
2016
2017
2018
2019
$348,061
$409,590
$444,505
$478,815
$518,970
Embassy Bancorp 21
Exhibit 99.1
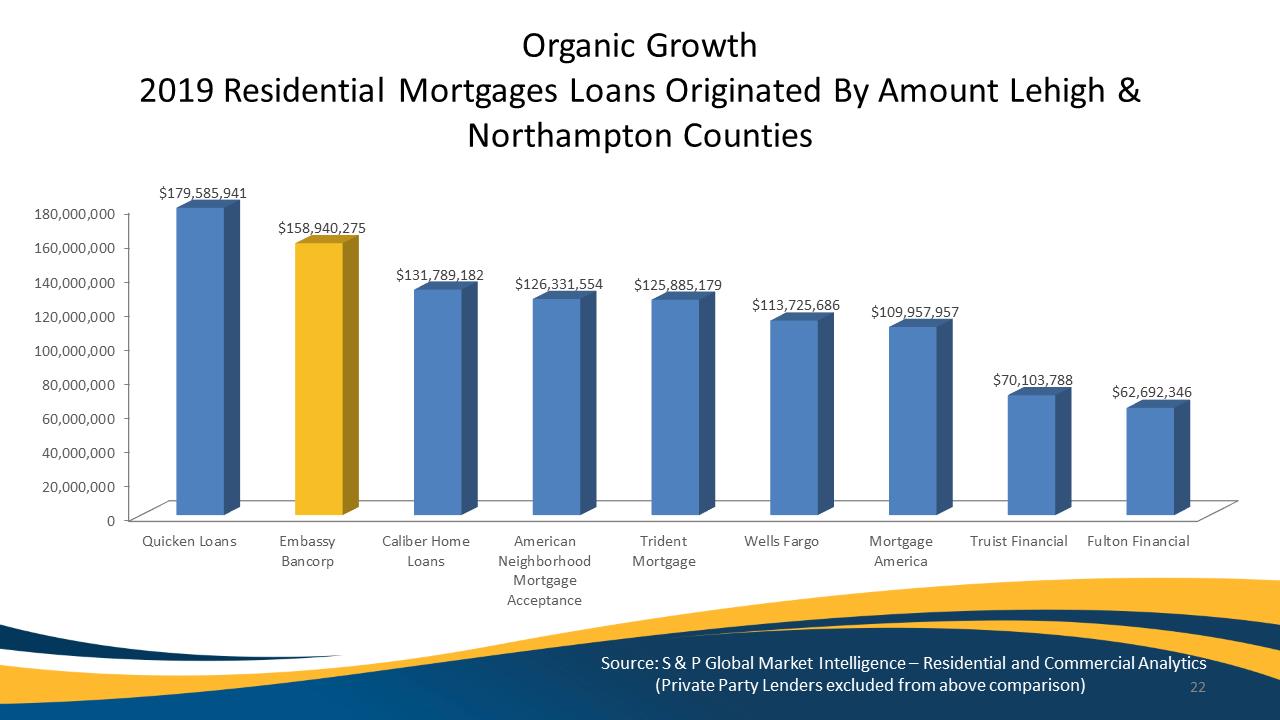
Organic Growth2019 Residential Mortgages Loans Originated By Amount Lehigh & Northampton Counties
Source: S & P Global Market Intelligence –Residential and Commercial Analytics
(Private Party Lenders excluded from above comparison)
0
20,000,000
40,000,000
60,000,000
80,000,000
100,000,000
120,000,000
140,000,000
160,000,000
180,000,000
Quicken Loans
Embassy Bancorp
Caliber Home Loans
AmericanNeighborhoodMortgageAcceptance
Trident Mortgage
Wells Fargo
Mortgage America
Truist Financial
Fulton Financial
$179,585,941
$158,940,275
$131,789,182
$126,331,554
$125,885,179
$113,725,686
$109,957,957
$70,103,788
$62,692,346 22
Exhibit 99.1
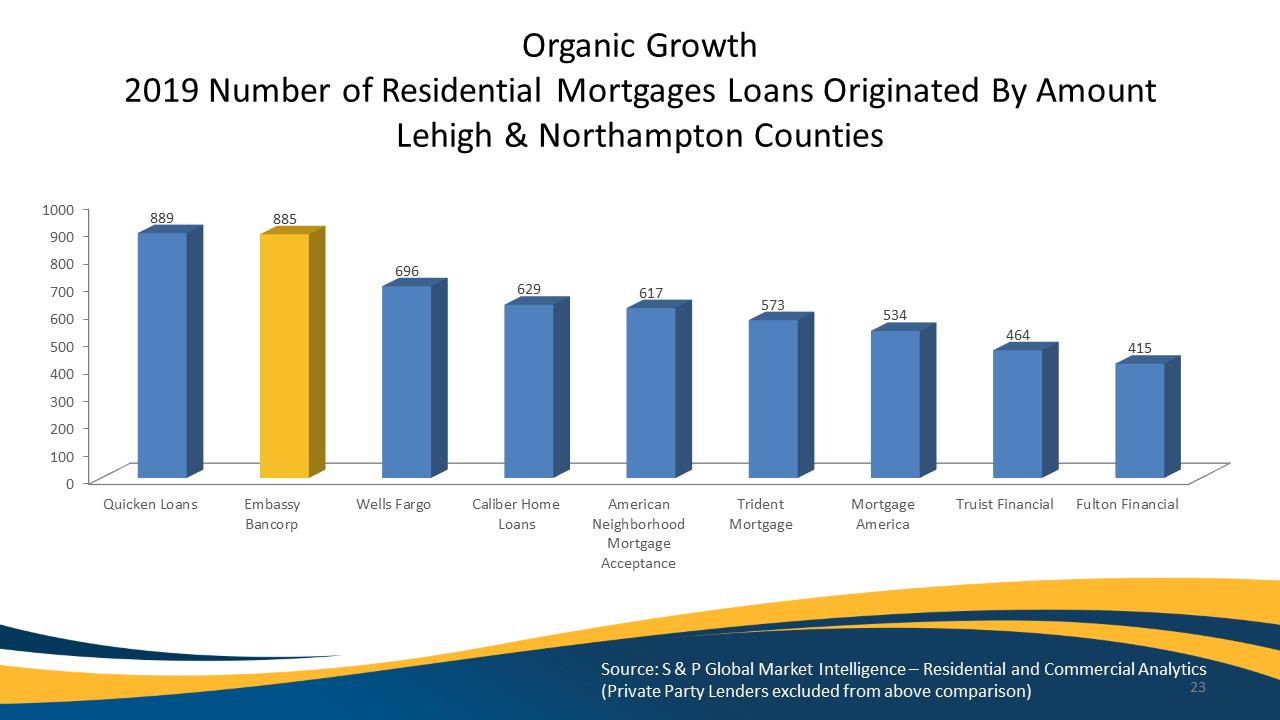
Organic Growth2019 Number of Residential Mortgages Loans Originated By Amount Lehigh & Northampton Counties
Source: S & P Global Market Intelligence –Residential and Commercial Analytics
(Private Party Lenders excluded from above comparison)
0
100
200
300
400
500
600
700
800
900
1000
Quicken Loans
Embassy Bancorp
Wells Fargo
Caliber Home Loans
AmericanNeighborhoodMortgageAcceptance
Trident Mortgage
Mortgage America
Truist Financial
Fulton Financial
889
885
696
629
617
573
534
464
415
23
Exhibit 99.1
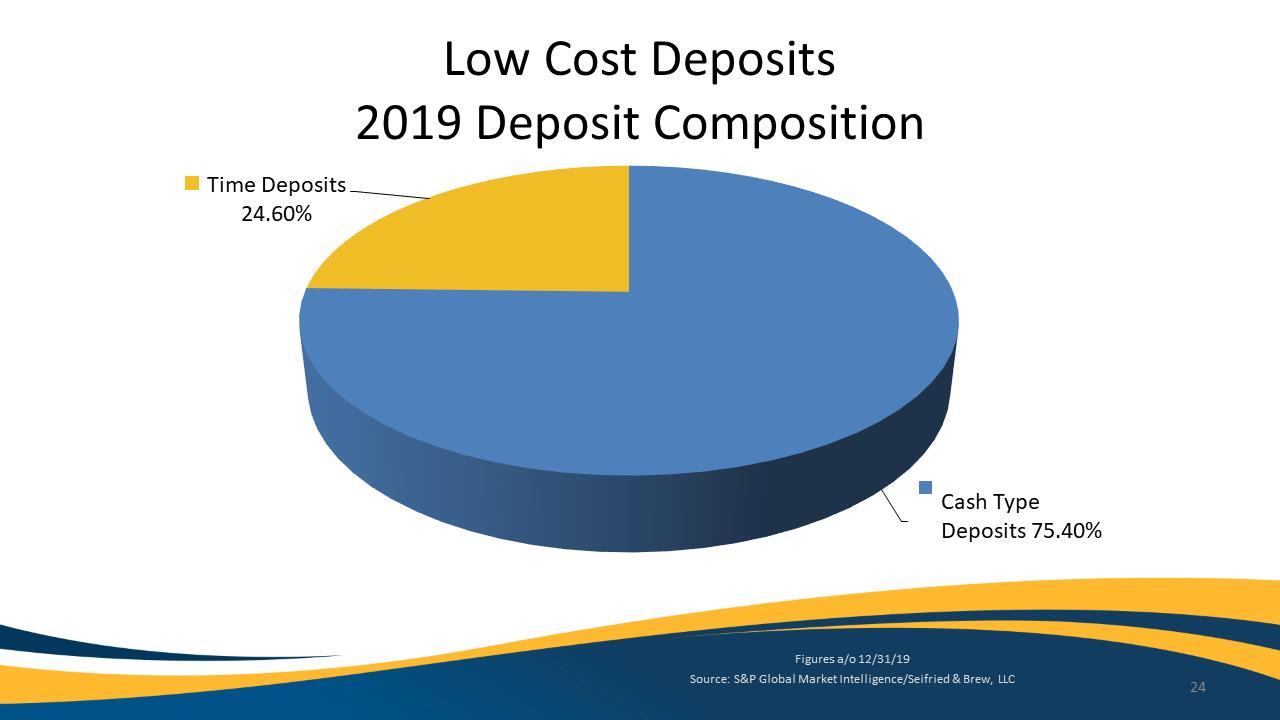
Low Cost Deposits2019 Deposit Composition
Cash Type Deposits75.40%
Time Deposits24.60%
Figures a/o 12/31/19
Source: S&P Global Market Intelligence/Seifried & Brew, LLC 24
Exhibit 99.1
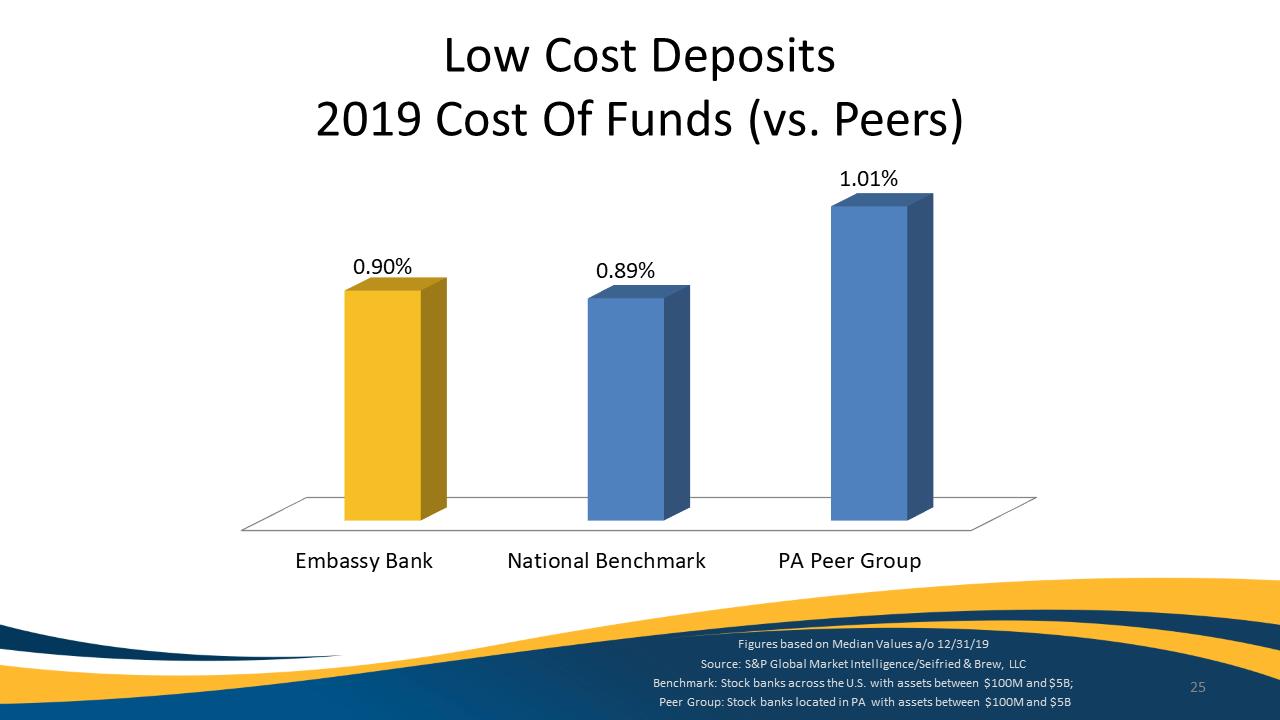
Low Cost Deposits2019 Cost Of Funds (vs. Peers)
Embassy Bank
National Benchmark
PA Peer Group
0.90%
0.89%
1.01%
Figures based on Median Values a/o 12/31/19
Source: S&P Global Market Intelligence/Seifried & Brew, LLC
Benchmark: Stock banks across the U.S. with assets between $100M and $5B;
Peer Group: Stock banks located in PA with assets between $100M and $5B
25
Exhibit 99.1
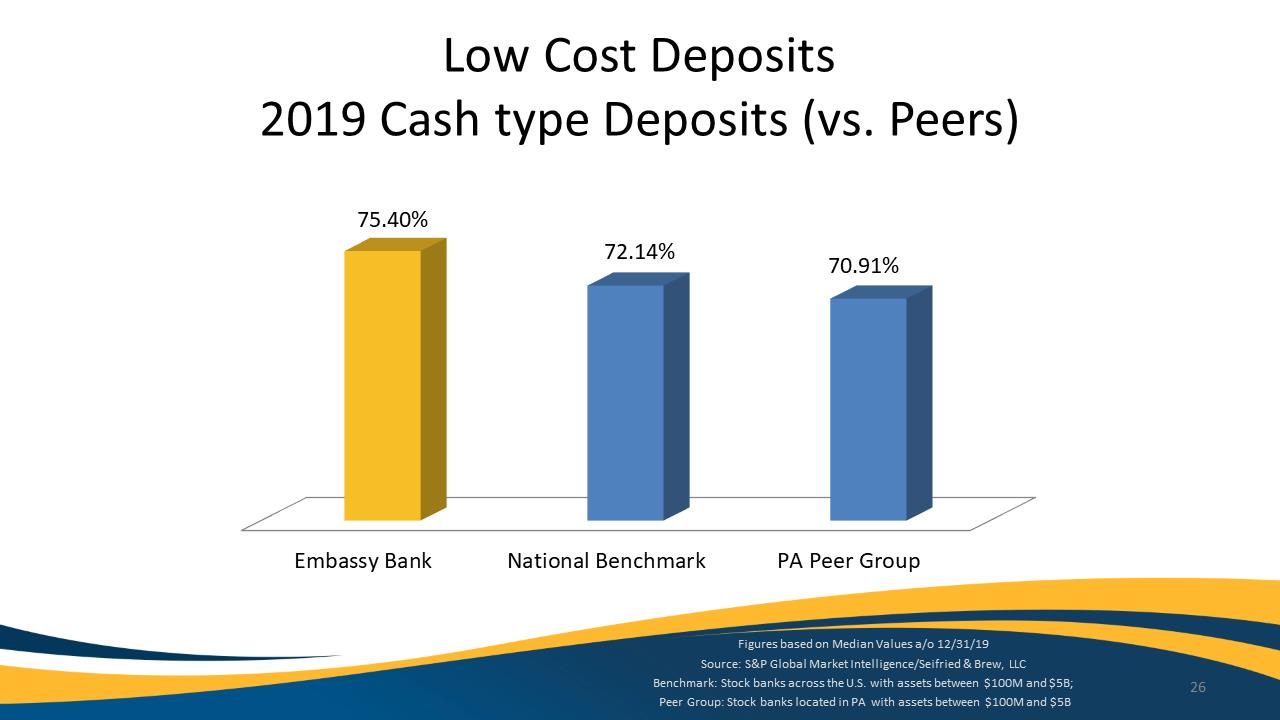
Low Cost Deposits2019 Cash type Deposits (vs. Peers)
Embassy Bank
National Benchmark
PA Peer Group
75.40%
72.14%
70.91%
Figures based on Median Values a/o 12/31/19
Source: S&P Global Market Intelligence/Seifried & Brew, LLC
Benchmark: Stock banks across the U.S. with assets between $100M and $5B;
Peer Group: Stock banks located in PA with assets between $100M and $5B
26
Exhibit 99.1
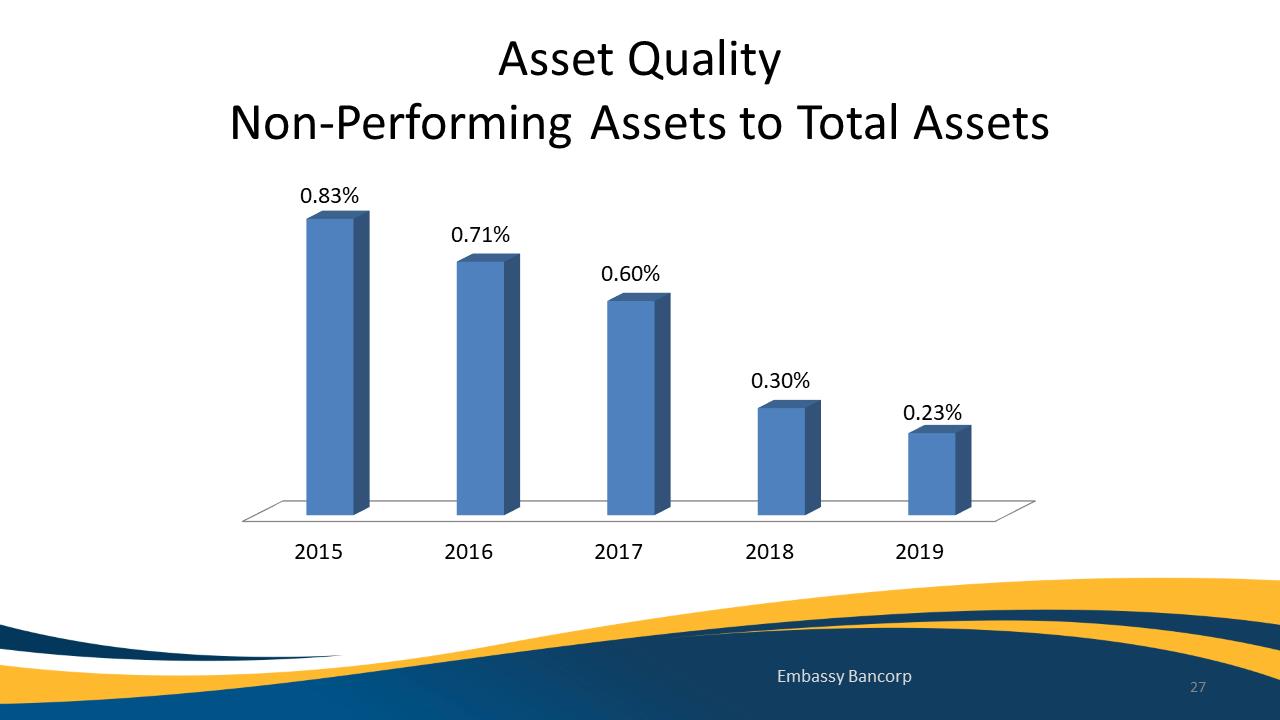
Asset QualityNon-Performing Assets to Total Assets
2015
2016
2017
2018
2019
0.83%
0.71%
0.60%
0.30%
0.23%
Embassy Bancorp 27
Exhibit 99.1
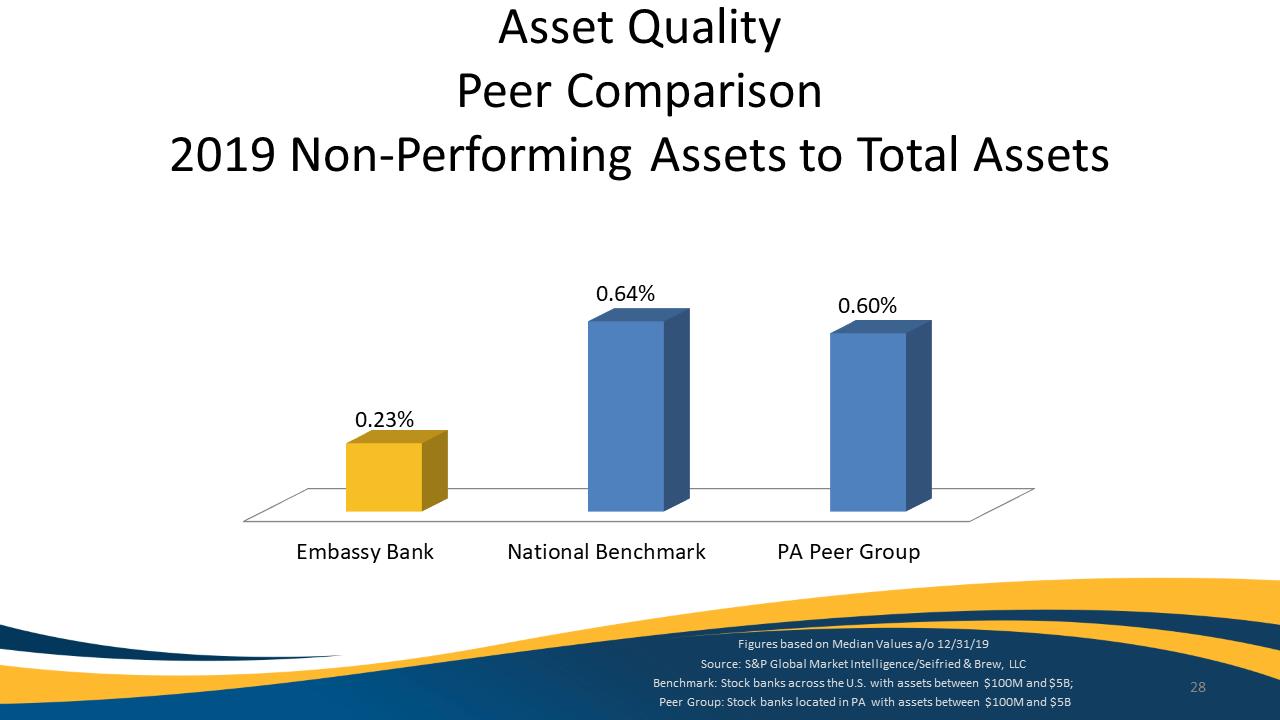
Asset Quality Peer Comparison2019 Non-Performing Assets to Total Assets
Embassy Bank
National Benchmark
PA Peer Group
0.23%
0.64%
0.60%
Figures based on Median Values a/o 12/31/19
Source: S&P Global Market Intelligence/Seifried & Brew, LLC
Benchmark: Stock banks across the U.S. with assets between $100M and $5B;
Peer Group: Stock banks located in PA with assets between $100M and $5B
28
Exhibit 99.1
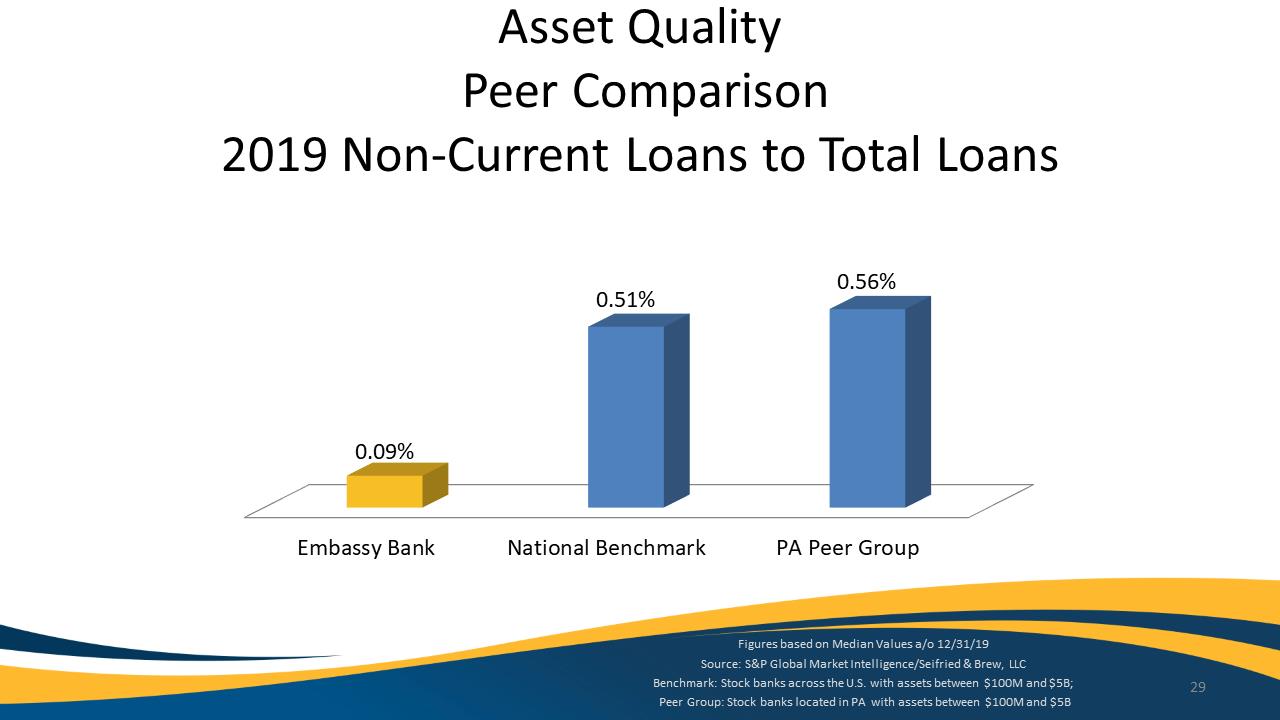
Asset Quality Peer Comparison2019 Non-Current Loans to Total Loans
Embassy Bank
National Benchmark
PA Peer Group
0.09%
0.51%
0.56%
Figures based on Median Values a/o 12/31/19
Source: S&P Global Market Intelligence/Seifried & Brew, LLC
Benchmark: Stock banks across the U.S. with assets between $100M and $5B;
Peer Group: Stock banks located in PA with assets between $100M and $5B
29
Exhibit 99.1
Asset Quality Number of Bank-Owned Properties
ZERO
30
Exhibit 99.1
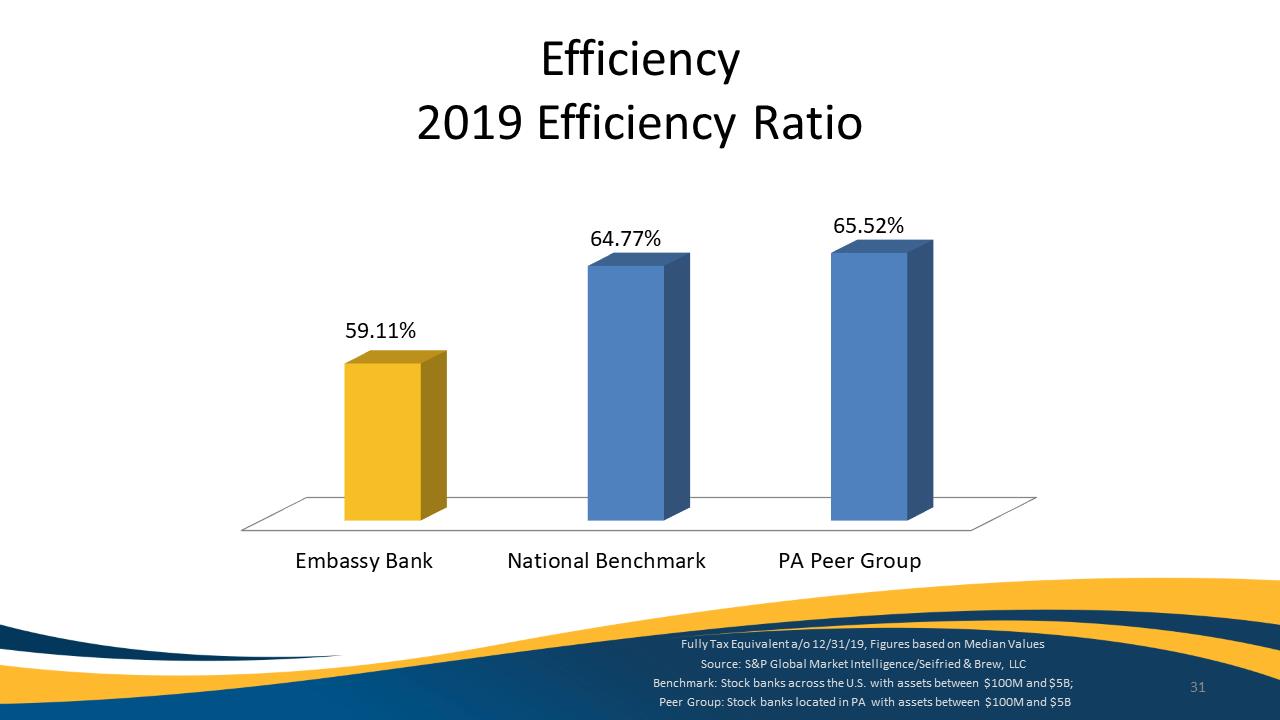
Efficiency2019 Efficiency Ratio
Embassy Bank
National Benchmark
PA Peer Group
59.11%
64.77%
65.52%
Fully Tax Equivalent a/o 12/31/19, Figures based on Median Values
Source: S&P Global Market Intelligence/Seifried & Brew, LLC
Benchmark: Stock banks across the U.S. with assets between $100M and $5B;
Peer Group: Stock banks located in PA with assets between $100M and $5B
31
Exhibit 99.1
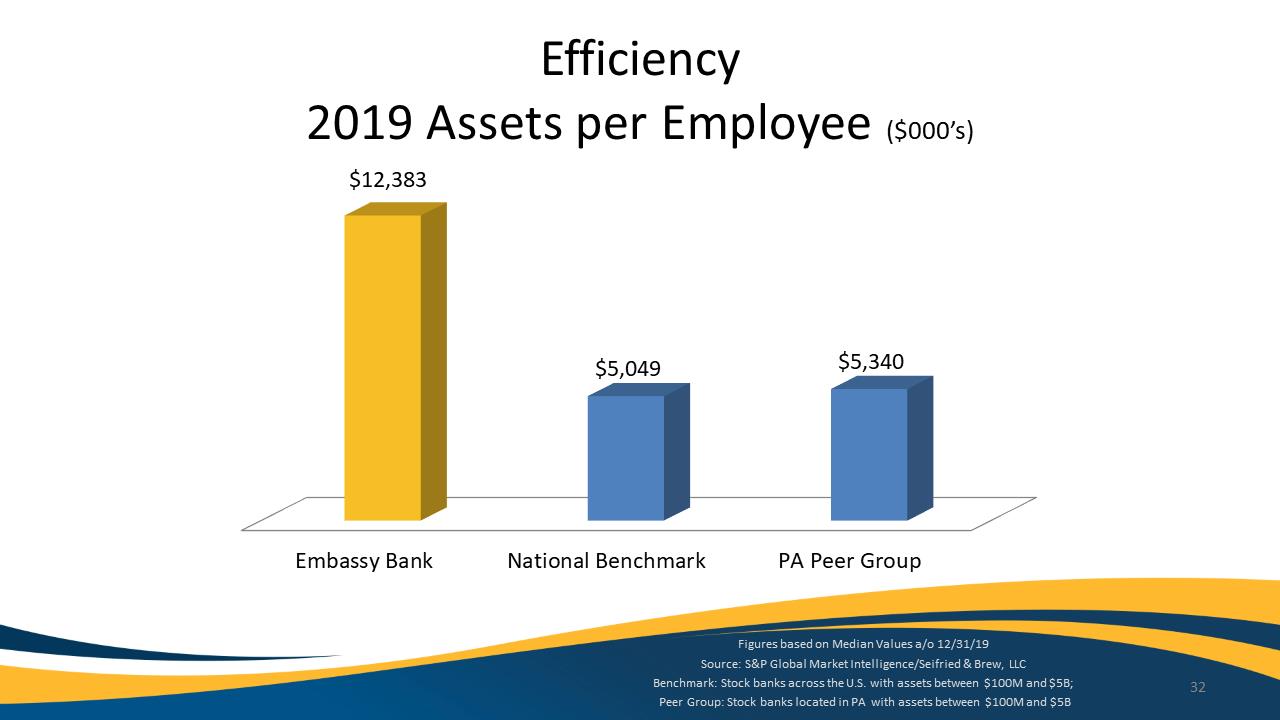
Efficiency2019 Assets per Employee ($000’s)
Embassy Bank
National Benchmark
PA Peer Group
$12,383
$5,049
$5,340
Figures based on Median Values a/o 12/31/19
Source: S&P Global Market Intelligence/Seifried & Brew, LLC
Benchmark: Stock banks across the U.S. with assets between $100M and $5B;
Peer Group: Stock banks located in PA with assets between $100M and $5B
32
Exhibit 99.1
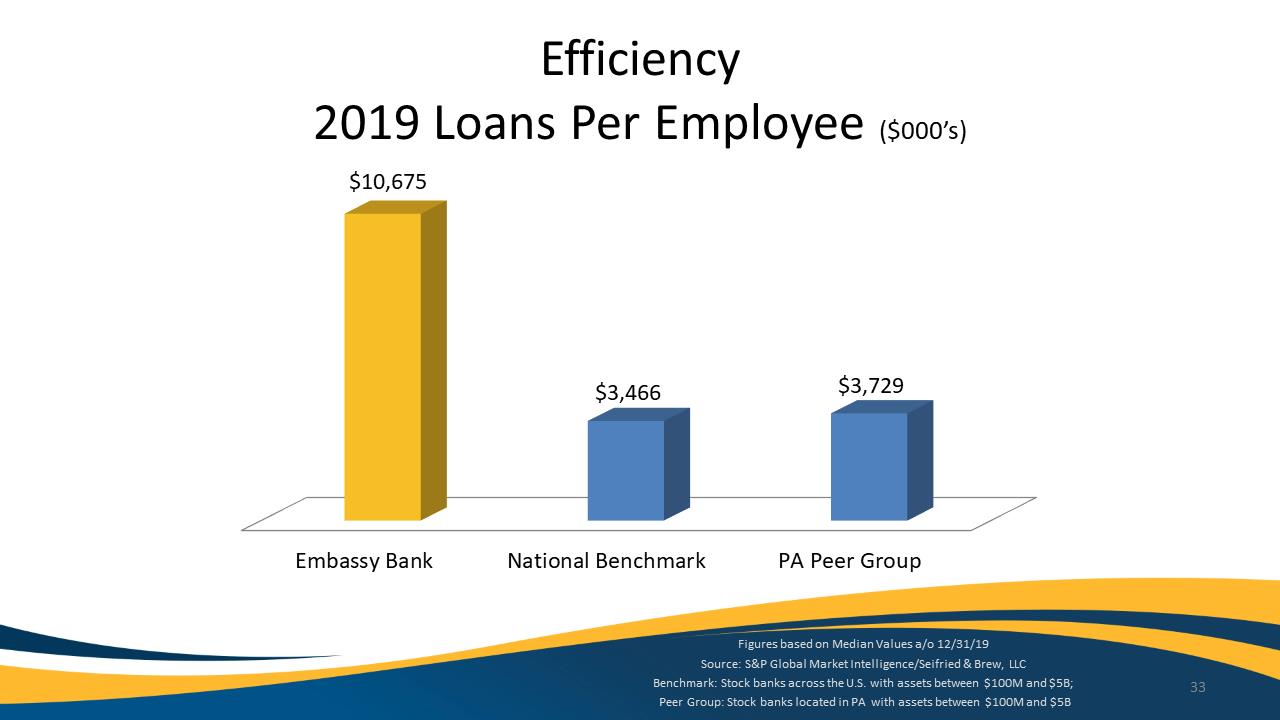
Efficiency2019 Loans Per Employee ($000’s)
Embassy Bank
National Benchmark
PA Peer Group
$10,675
$3,466
$3,729
Figures based on Median Values a/o 12/31/19
Source: S&P Global Market Intelligence/Seifried & Brew, LLC
Benchmark: Stock banks across the U.S. with assets between $100M and $5B;
Peer Group: Stock banks located in PA with assets between $100M and $5B
33
Exhibit 99.1
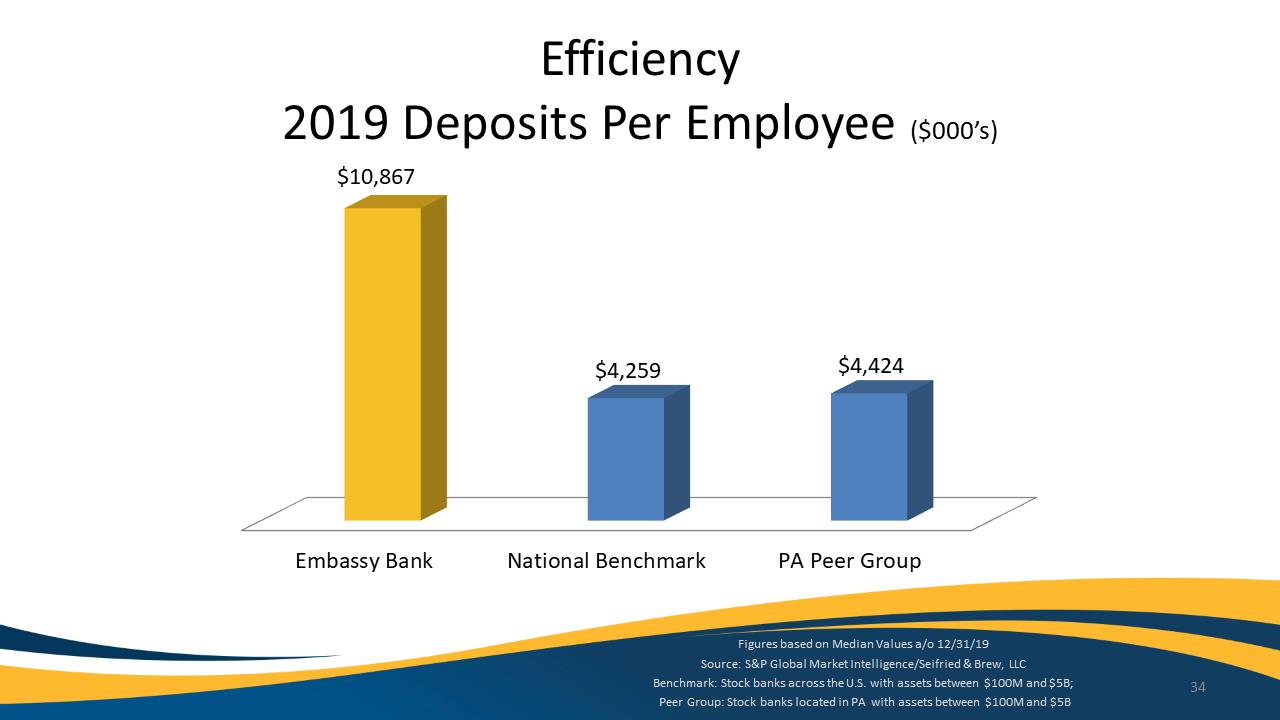
Efficiency2019 Deposits Per Employee ($000’s)
Embassy Bank
National Benchmark
PA Peer Group
$10,867
$4,259
$4,424
Figures based on Median Values a/o 12/31/19
Source: S&P Global Market Intelligence/Seifried & Brew, LLC
Benchmark: Stock banks across the U.S. with assets between $100M and $5B;
Peer Group: Stock banks located in PA with assets between $100M and $5B
34
Exhibit 99.1
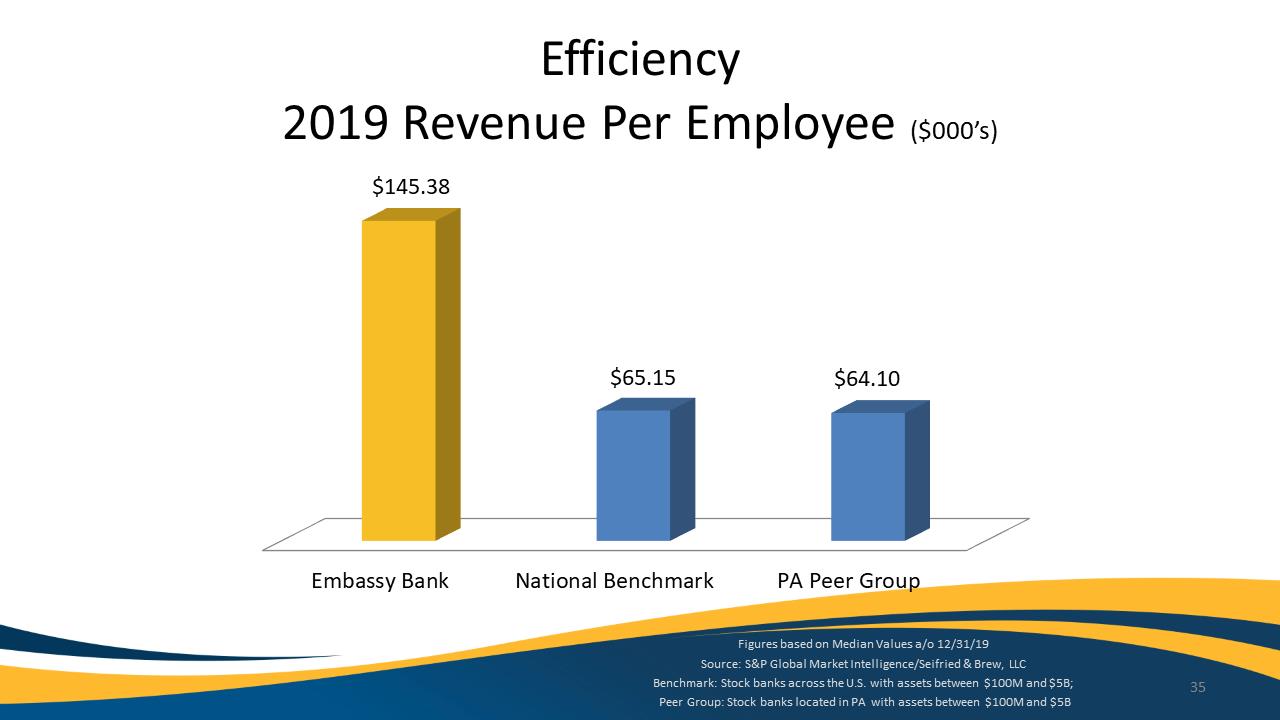
Efficiency2019 Revenue Per Employee ($000’s)
Embassy Bank
National Benchmark
PA Peer Group
$145.38
$65.15
$64.10
Figures based on Median Values a/o 12/31/19
Source: S&P Global Market Intelligence/Seifried & Brew, LLC
Benchmark: Stock banks across the U.S. with assets between $100M and $5B;
Peer Group: Stock banks located in PA with assets between $100M and $5B
35
Exhibit 99.1
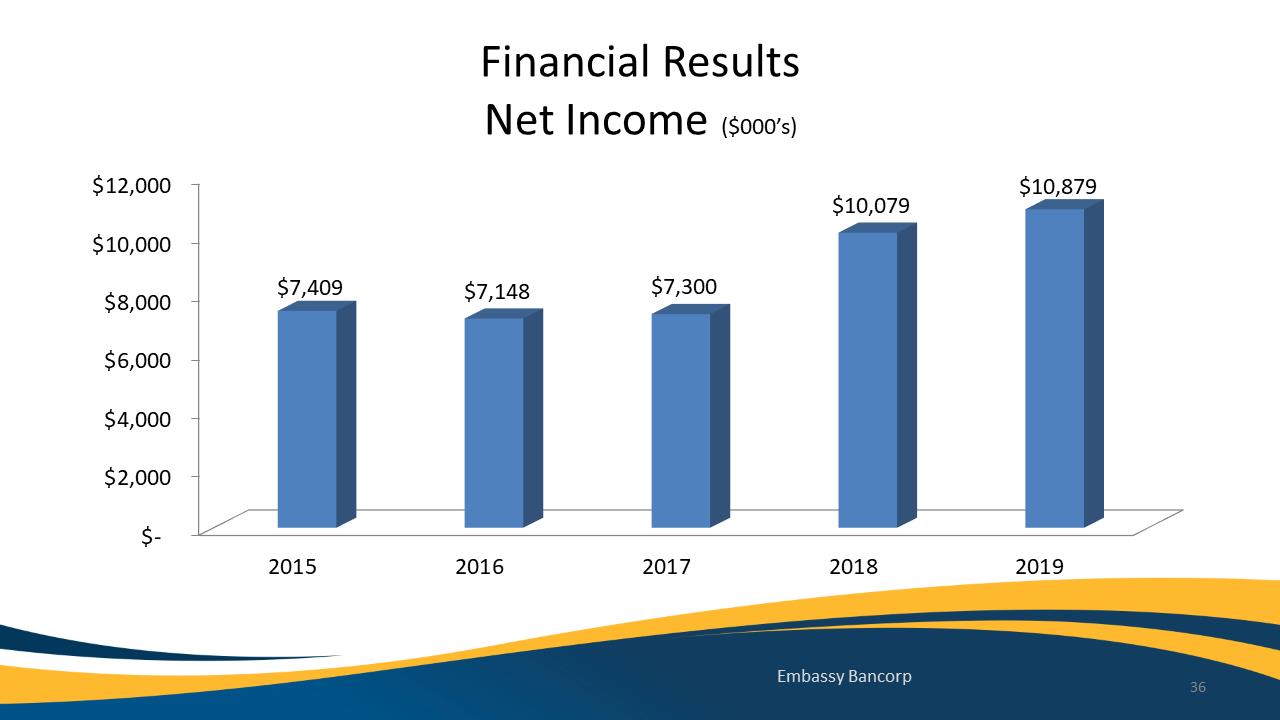
Financial Results Net Income ($000’s)
$-
$2,000
$4,000
$6,000
$8,000
$10,000
$12,000
2015
2016
2017
2018
2019
$7,409
$7,148
$7,300
$10,079
$10,879
Embassy Bancorp 36
Exhibit 99.1
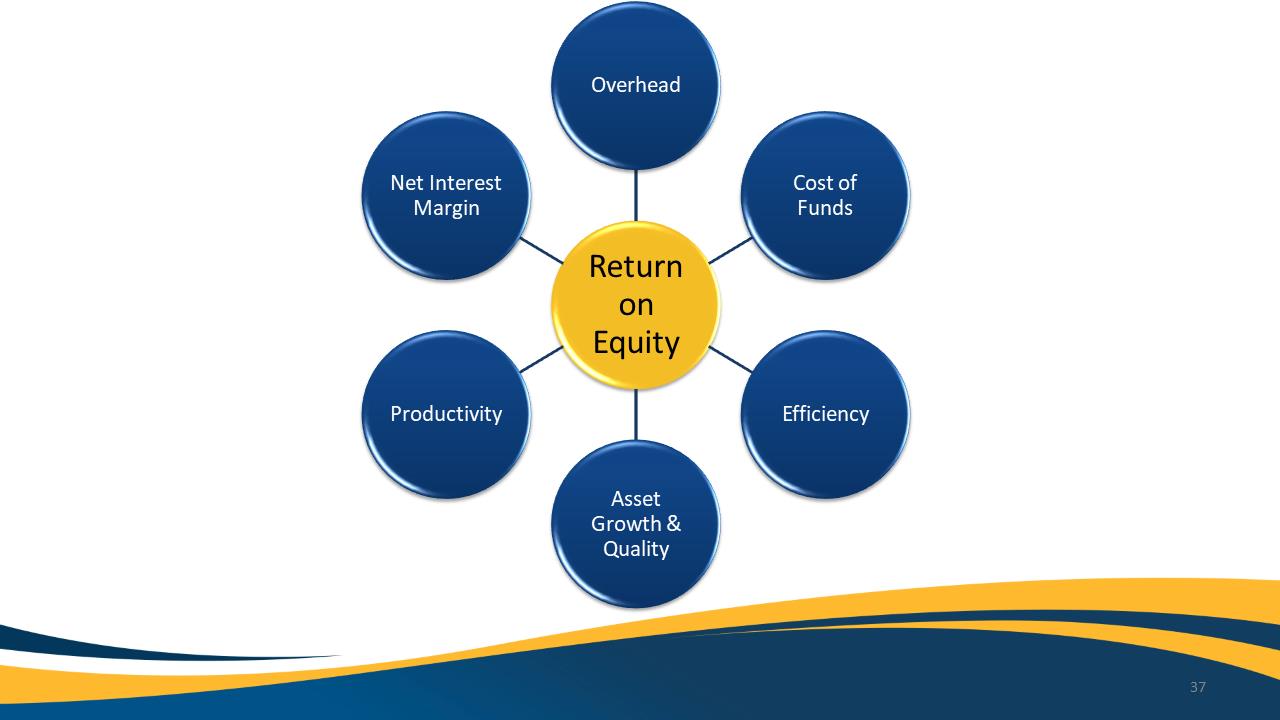
Overhead
Cost of Funds
Efficiency
Asset Growth & Quality
Productivity
Net Interest Margin
Return on Equity
37
Exhibit 99.1
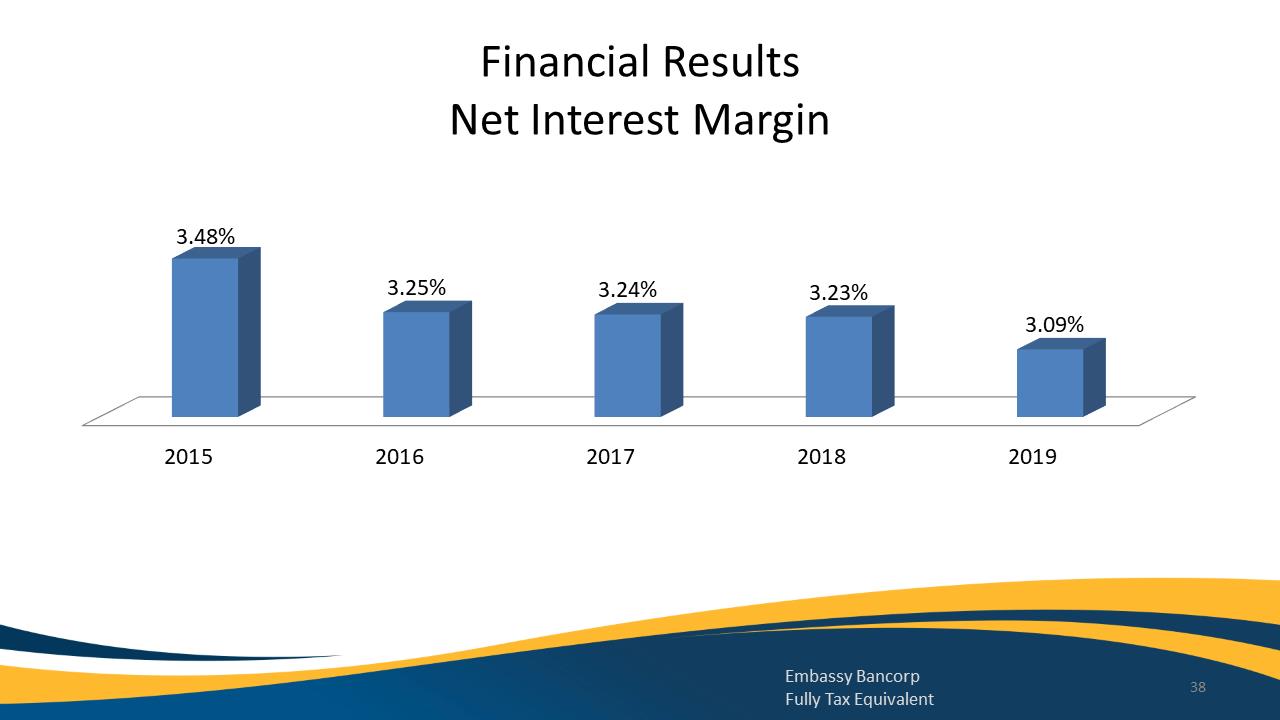
Financial Results Net Interest Margin
2015
2016
2017
2018
2019
3.48%
3.25%
3.24%
3.23%
3.09%
Embassy Bancorp
Fully Tax Equivalent 38
Exhibit 99.1
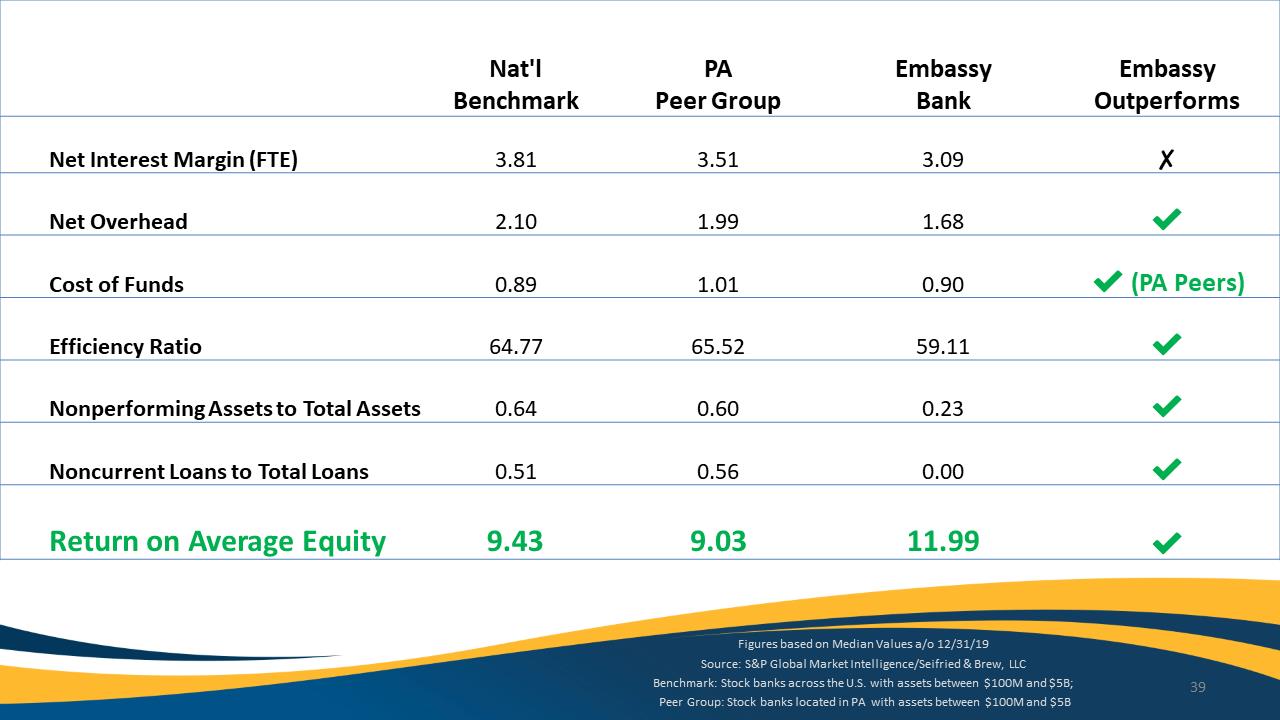
Nat’l Benchmark
PAPeer Group
Embassy Bank
Embassy Outperforms
Net Interest Margin (FTE)
3.81
3.51
3.09
✘
Net Overhead
2.10
1.99
1.68
✔
Cost of Funds
0.89
1.01
0.90
✔(PA Peers)
Efficiency Ratio
64.77
65.52
59.11
✔
Nonperforming Assets to Total Assets
0.64
0.60
0.23
✔
Noncurrent Loans to Total Loans
0.51
0.56
0.00
✔
Return on Average Equity
9.43
9.03
11.99
✔
Figures based on Median Values a/o 12/31/19
Source: S&P Global Market Intelligence/Seifried & Brew, LLC
Benchmark: Stock banks across the U.S. with assets between $100M and $5B;
Peer Group: Stock banks located in PA with assets between $100M and $5B
39
Exhibit 99.1
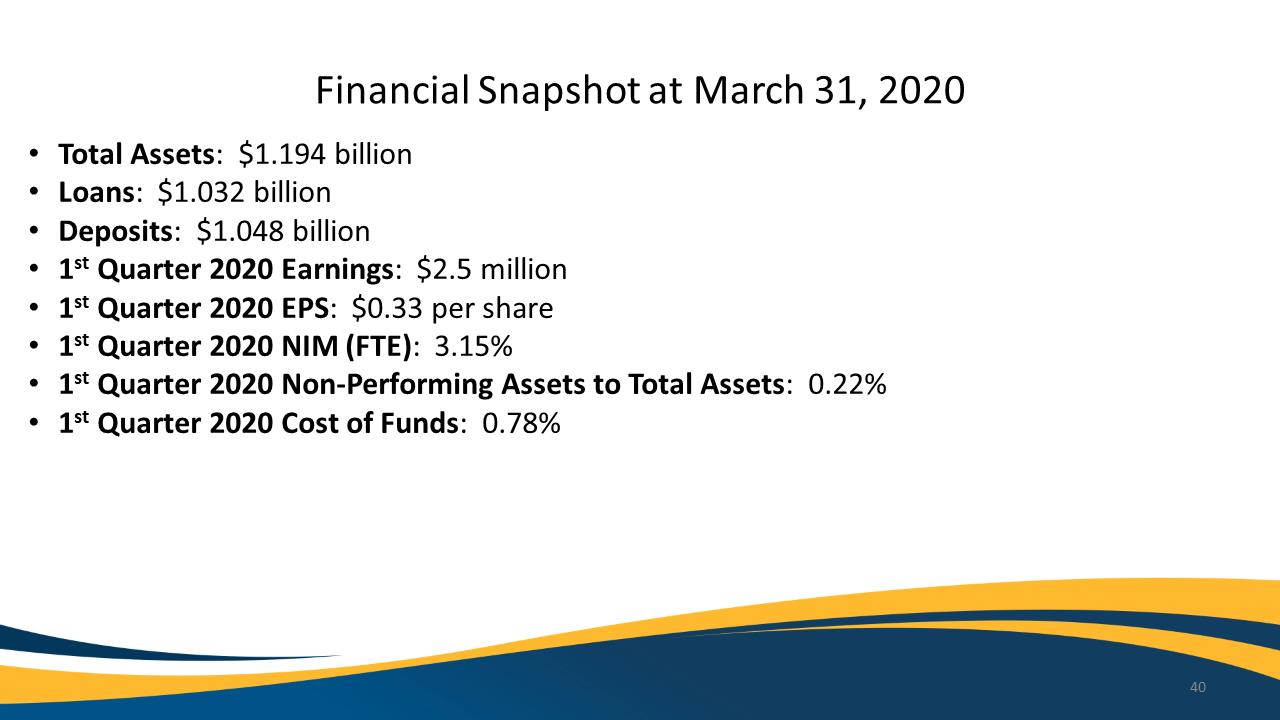
Financial Snapshot at March 31, 2020
•
Total Assets: $1.194 billion
•
Loans: $1.032 billion
•
Deposits: $1.048 billion
•
1stQuarter 2020 Earnings: $2.5 million
•
1stQuarter 2020 EPS: $0.33 per share
•
1stQuarter 2020 NIM (FTE):3.15%
•
1stQuarter 2020 Non-Performing Assets to Total Assets: 0.22%
•
1stQuarter 2020 Cost of Funds: 0.78%
40
Exhibit 99.1
2020
A Position of Strength
-
Diane Cunningham
Embassy Bank For the Lehigh Valley
EmbassyBank.com
Member FDIC
Equal Housing Lender
41
Exhibit 99.1
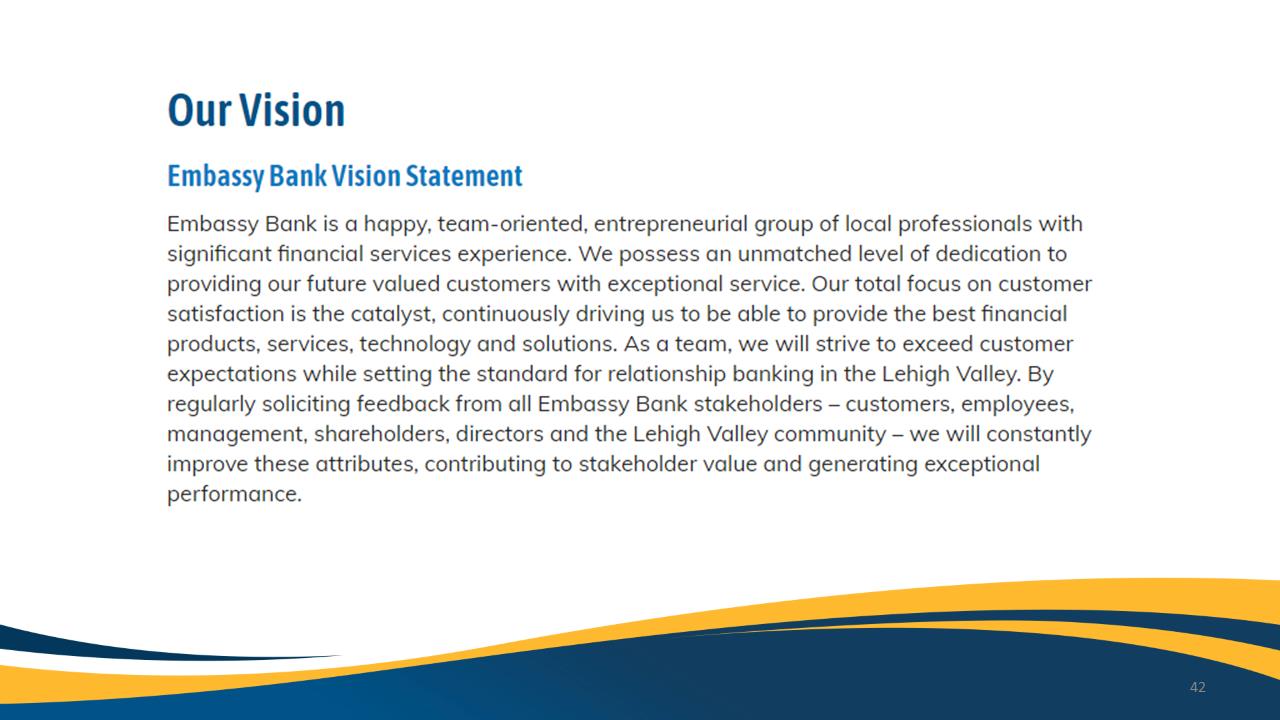
Our Vision
Embassy Bank Vision Statement
Embassy Bank is a happy, team-oriented, entrepreneurial group of local professionals with significant financial services experience. We possess an unmatched level of dedication to providing our future valued customers with exceptional service. Our total focus on customer satisfaction is the catalyst, continuously driving us to be able to provide the best financial products, services, technology and solutions. As a team, we will strive to exceed customer expectations while setting the standard for relationship banking in the Lehigh Valley. By regularly soliciting feedback from all Embassy Bank stakeholders – customers, employees, management, shareholders, directors and the Lehigh Valley community – we will constantly improve these attributes, contributing to stakeholder value and generating exceptional performance.
42
Exhibit 99.1
Financial Strength
Key Drivers of Performance
•
Asset Quality
•
Continued Market Expansion
•
The Right Mix of Deposits
•
Efficiency
43
Exhibit 99.1
Foundational Strength
•
Independent
•
Culture
•
Community Based
•
2019 Giving
–
$1,105,886 Charitable Contributions / Sponsorships
–
103 Organizations
44
Exhibit 99.1

Reputational Strength
Lehigh Valley Business Reader Rankings Lehigh Valley Business 2019 Reader Banking Awards Top Winner
Readers’ 2019 Choice The Morning Call
45
Exhibit 99.1
Reputational Strength
We Analyze Banks & Credit Unions… Very Carefully Bauer Financial www.bauerfinancial.com 4 stars
American Banker Top 200 Community Banks
46
Exhibit 99.1
•
Pricing
•
Products
•
Branch Network
Brand
Competitive Strength
47
Exhibit 99.1
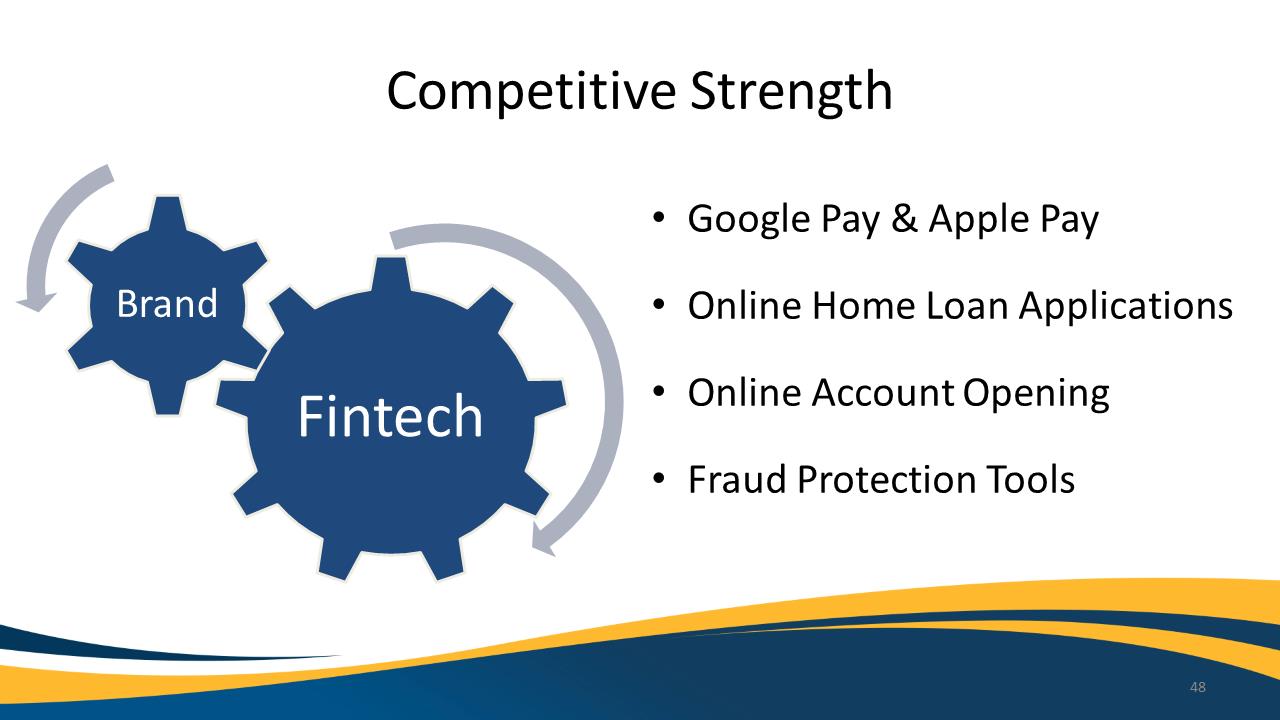
Google Pay & Apple Pay
•
Online Home Loan Applications
•
Online Account Opening
•
Fraud Protection Tools
Competitive Strength
Brand Fintech 48
Exhibit 99.1
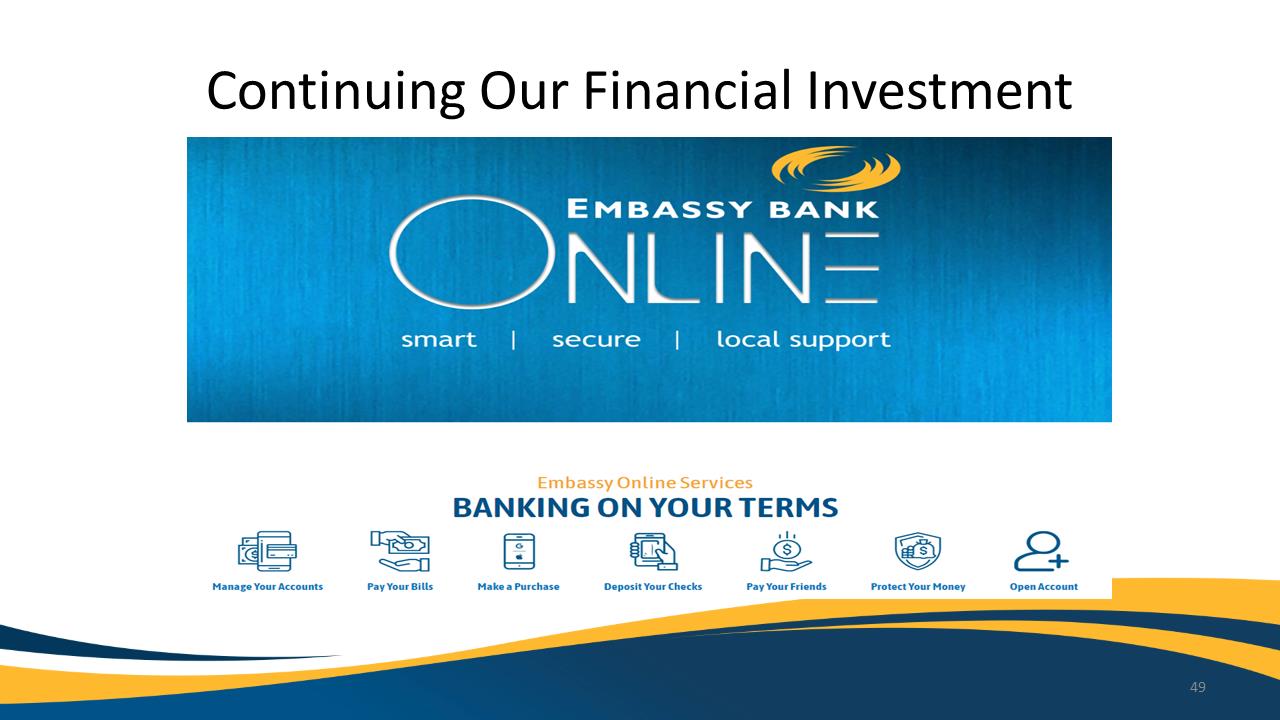
Continuing Our Financial Investment
Embassy Bank Online smart secure local support
Embassy Online Services Banking On Your Terms
Manage Your Accounts Pay Your Bills Make a Purchase Deposit Your Checks Pay Your Friends Protect Your Money Open Account
49
Exhibit 99.1
COVID-19 Pandemic Response
-James Bartholomew
50
Embassy Bank For the Lehigh Valley EmbassyBank.com
Member FDIC Equal Housing Lender
50
Exhibit 99.1
Safeguarding Our Community & Team Branch Offices
•
Agile and ready
•
Amended operating hours locations
•
Banking at drive-up and by-appointment
•
Online banking and ATMs available 24/7
•
Multi-phase re-opening plan
51
Exhibit 99.1

Safeguarding Our Community & Team Personnel
•
Established work from home teams
•
Employee assistance programs
•
Staffing rotations
52
Exhibit 99.1
Helping Our Community Overdraft Fees
•
Worked with deposit customers in need.
•
Immediately implemented a policy of waiving all overdraft fees. 53
Exhibit 99.1
Helping Our Community Loan Payment Accommodations
54
• As of the March 31, 2020 Form 10-Q, through April 29,
2020 provided loan payment accommodations:
- Approximately 275 loans totaling $170 million
- Short term principal and/or interest deferrals
Exhibit 99.1
Helping Our Community PPP Lending
•
500 Paycheck Protection Program (“PPP”) loans
•
Totaling approximately $66 million
•
Average loan size of $133 thousand
•
Over $2 million in SBA fees anticipated to be collected
55
Exhibit 99.1
Helping Our CommunityPPP Lending
•
Forgiveness period to begin in third quarter 2020
•
Software to program participants with forgiveness
•
Federal Reserve Board Paycheck Protection Program Liquidity Facility 56
Exhibit 99.1
Shareholder Value-David Lobach
Embassy Bank For the Lehigh Valley
EmbassyBank.com
Member FDIC Equal Housing Lender
Exhibit 99.1
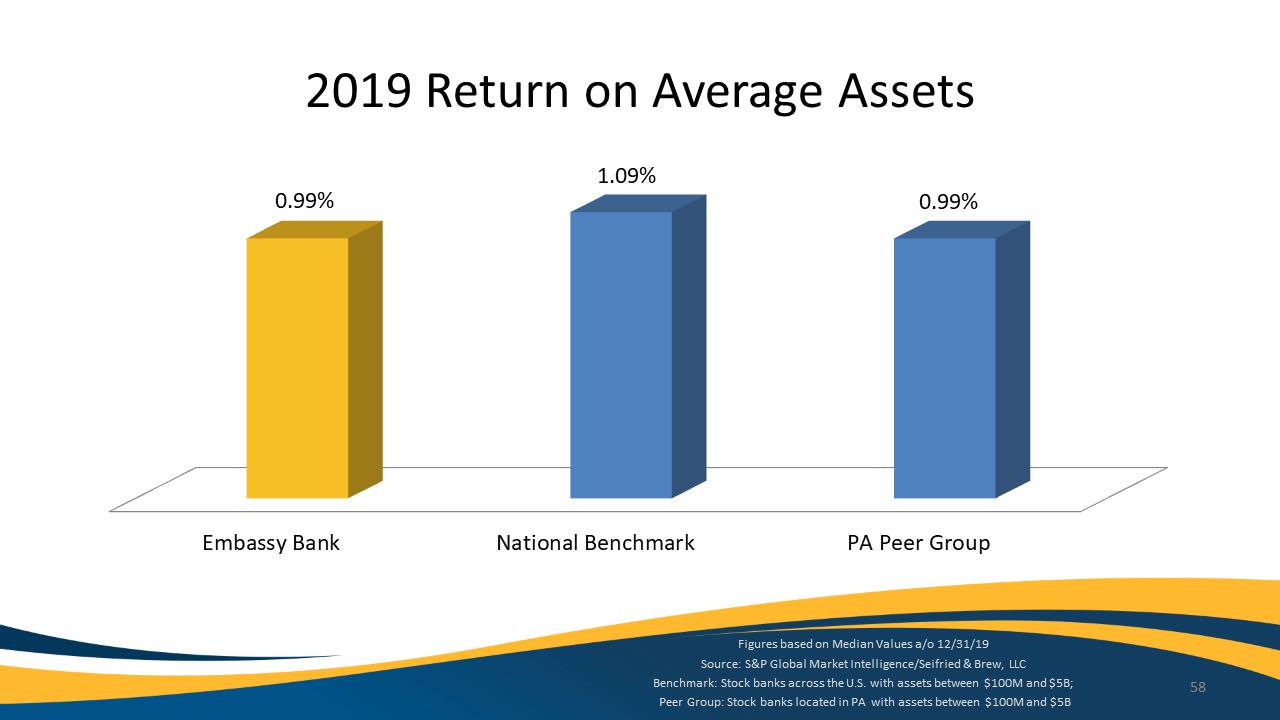
2019 Return on Average Assets
Embassy Bank
National Benchmark
PA Peer Group
0.99%
1.09%
0.99%
Figures based on Median Values a/o 12/31/19
Source: S&P Global Market Intelligence/Seifried & Brew, LLC
Benchmark: Stock banks across the U.S. with assets between $100M and $5B;
Peer Group: Stock banks located in PA with assets between $100M and $5B
58
Exhibit 99.1
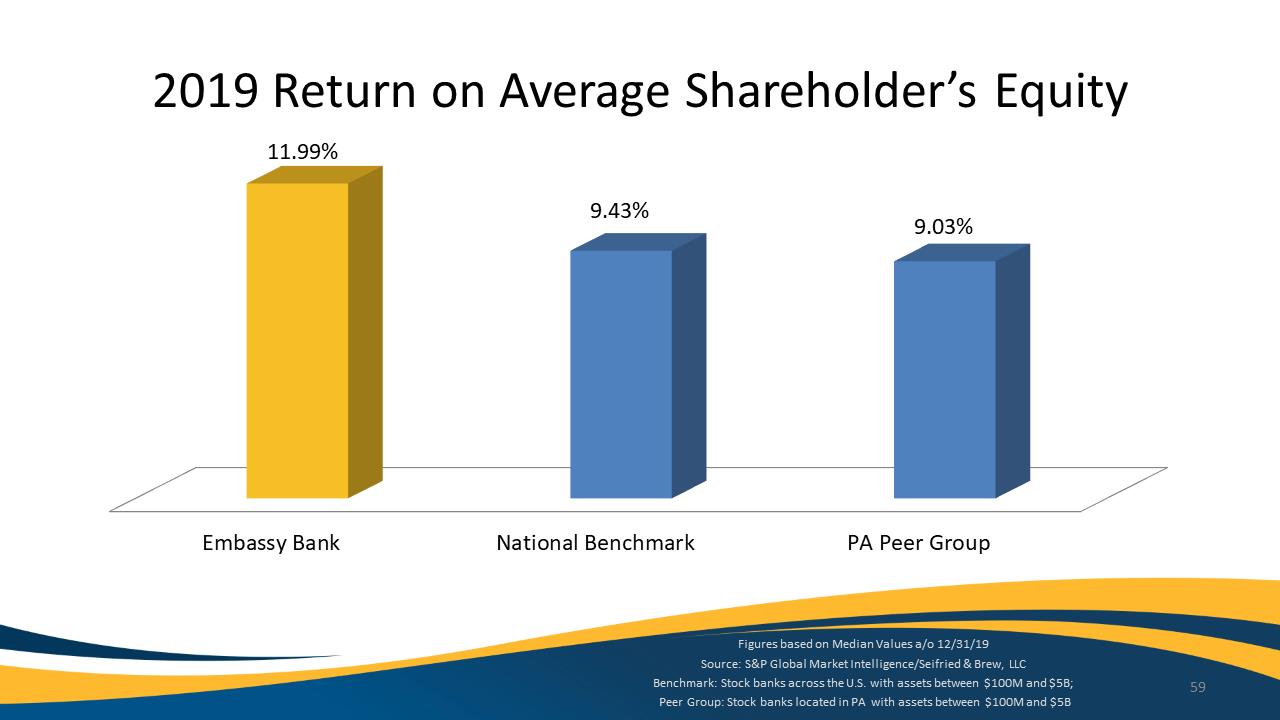
2019 Return on Average Shareholder’s Equity
Embassy Bank
National Benchmark
PA Peer Group
11.99%
9.43%
9.03%
Figures based on Median Values a/o 12/31/19
Source: S&P Global Market Intelligence/Seifried & Brew, LLC
Benchmark: Stock banks across the U.S. with assets between $100M and $5B;
Peer Group: Stock banks located in PA with assets between $100M and $5B
59
Exhibit 99.1
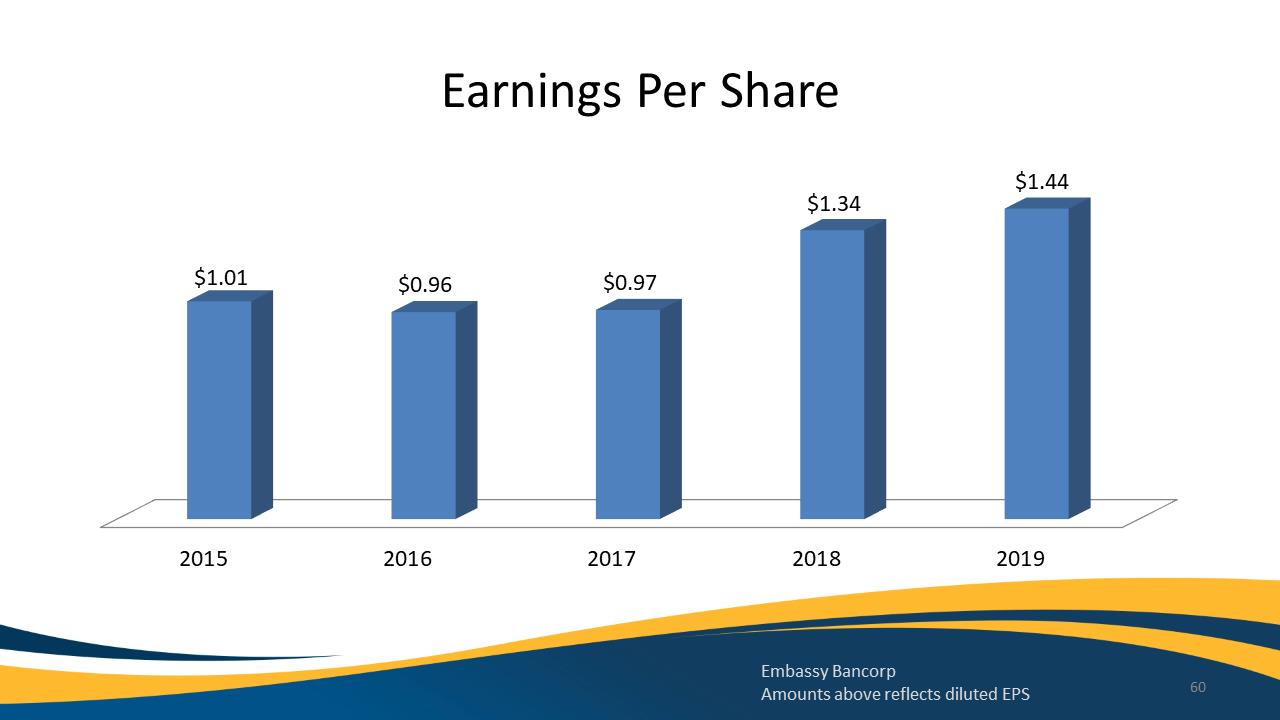
Earnings Per Share
2015
2016
2017
2018
2019
$1.01
$0.96
$0.97
$1.34
$1.44
Embassy Bancorp
Amounts above reflects diluted EPS 60
Exhibit 99.1
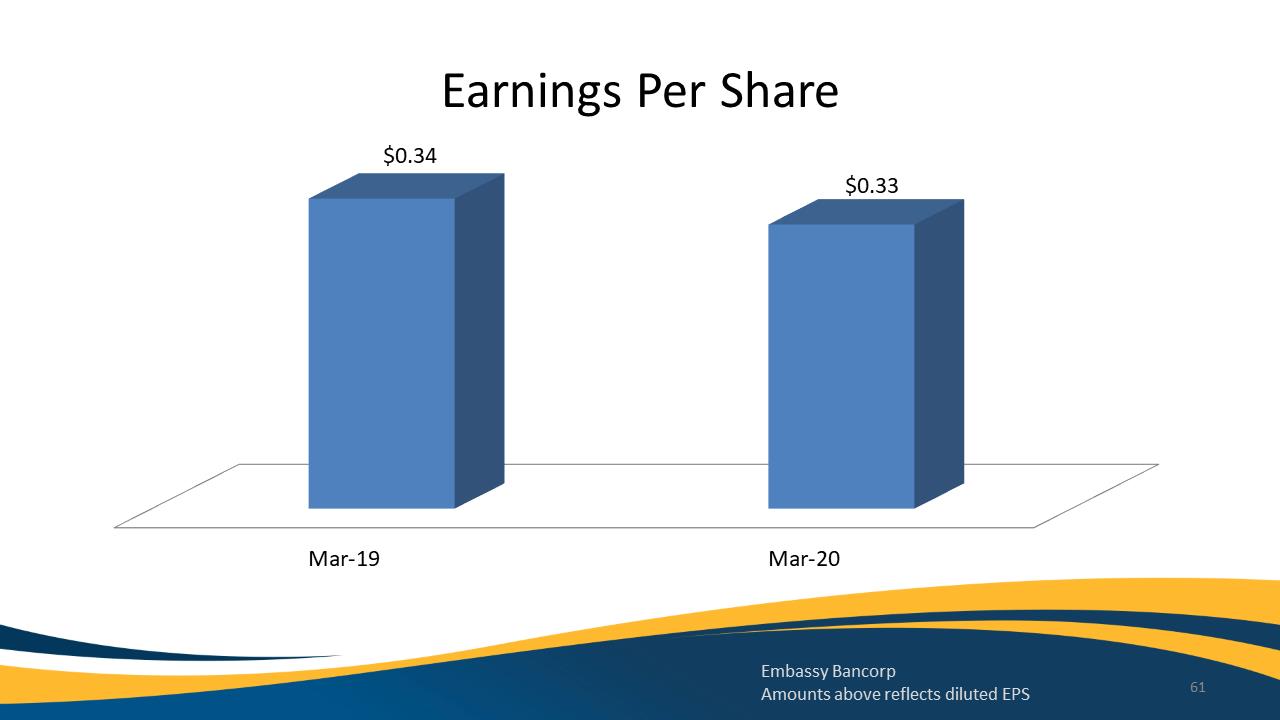
Earnings Per Share
Mar-19
Mar-20
$0.34
$0.33
Embassy Bancorp
Amounts above reflects diluted EPS 61
Exhibit 99.1
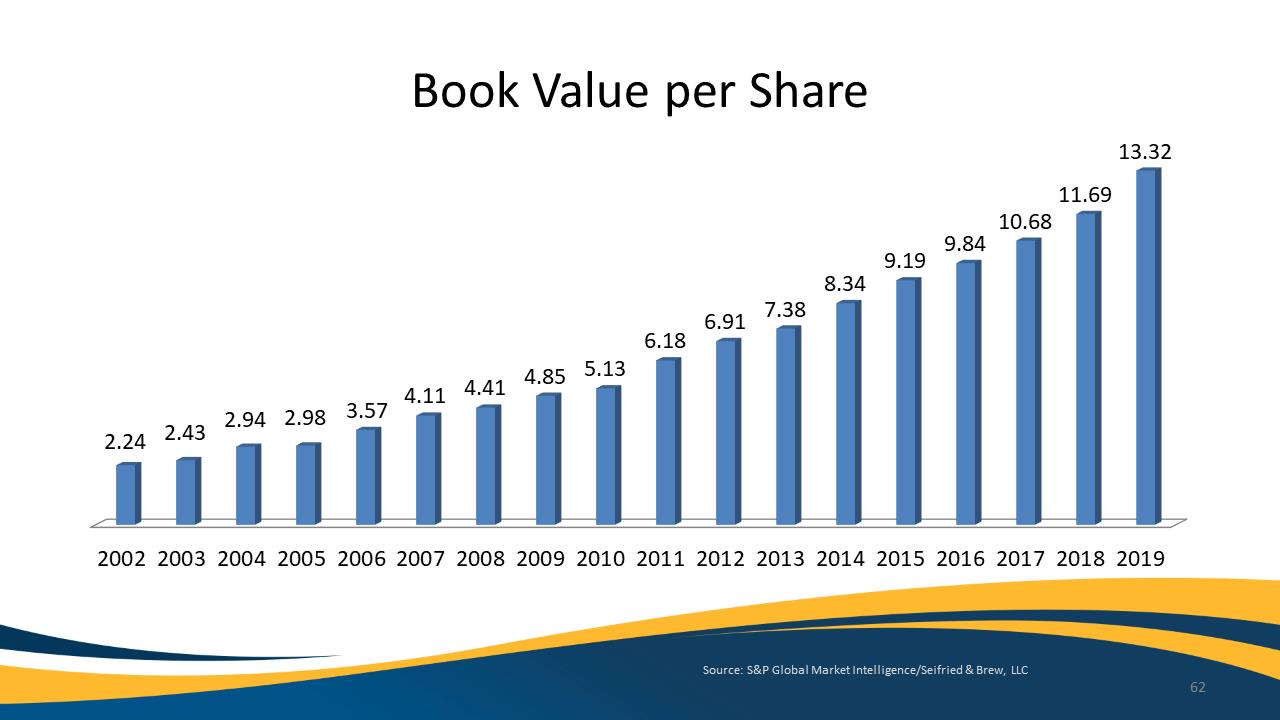
Book Value per Share
2002
2003
2004
2005
2006
2007
2008
2009
2010
2011
2012
2013
2014
2015
2016
2017
2018
2019
2.24
2.43
2.94
2.98
3.57
4.11
4.41
4.85
5.13
6.18
6.91
7.38
8.34
9.19
9.84
10.68
11.69
13.32
Source: S&P Global Market Intelligence/Seifried & Brew, LLC
62
Exhibit 99.1
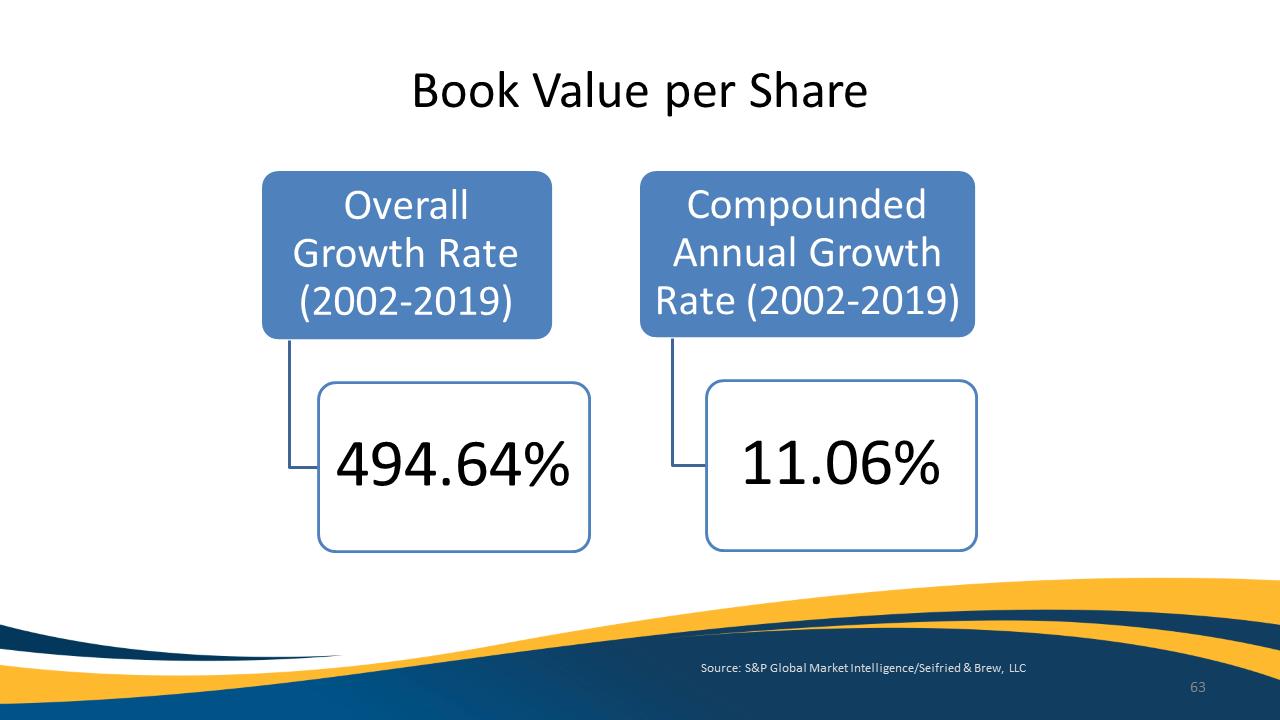
Book Value per Share
Overall Growth Rate (2002-2019)
494.64%
Compounded Annual Growth Rate (2002-2019)
11.06%
Source: S&P Global Market Intelligence/Seifried & Brew, LLC
63
Exhibit 99.1
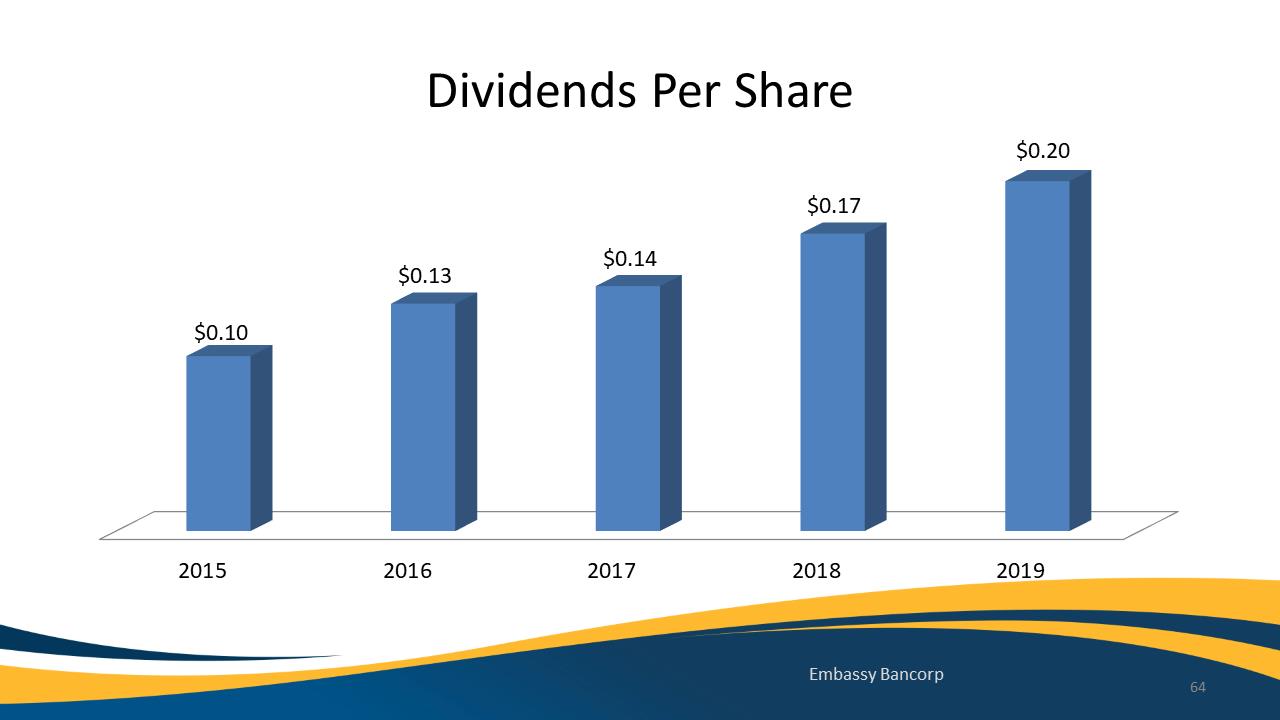
Dividends Per Share
2015
2016
2017
2018
2019
$0.10
$0.13
$0.14
$0.17
$0.20
Embassy Bancorp 64
Exhibit 99.1
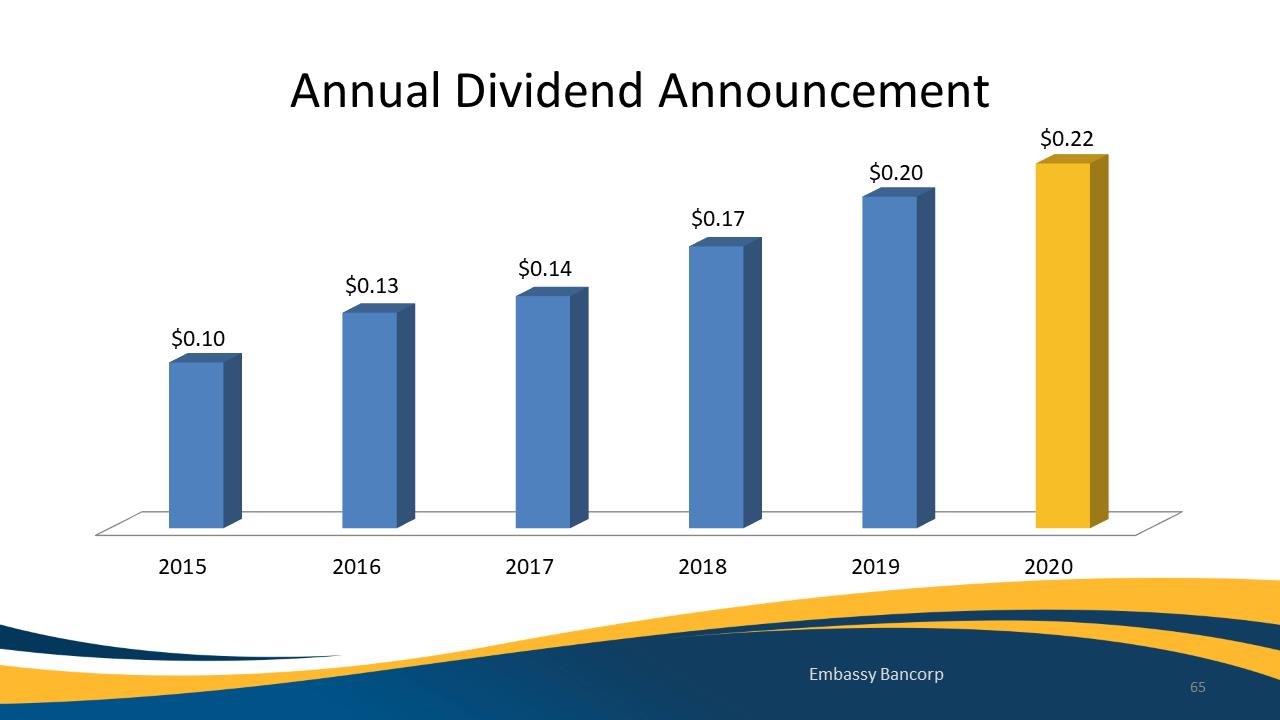
Annual Dividend Announcement
2015
2016
2017
2018
2019
2020
$0.10
$0.13
$0.14
$0.17
$0.20
$0.22
Embassy Bancorp 65
Exhibit 99.1
Closing Items
•
Q&A
•
Results of Voting
•
Conclusion of Meeting
66
Exhibit 99.1
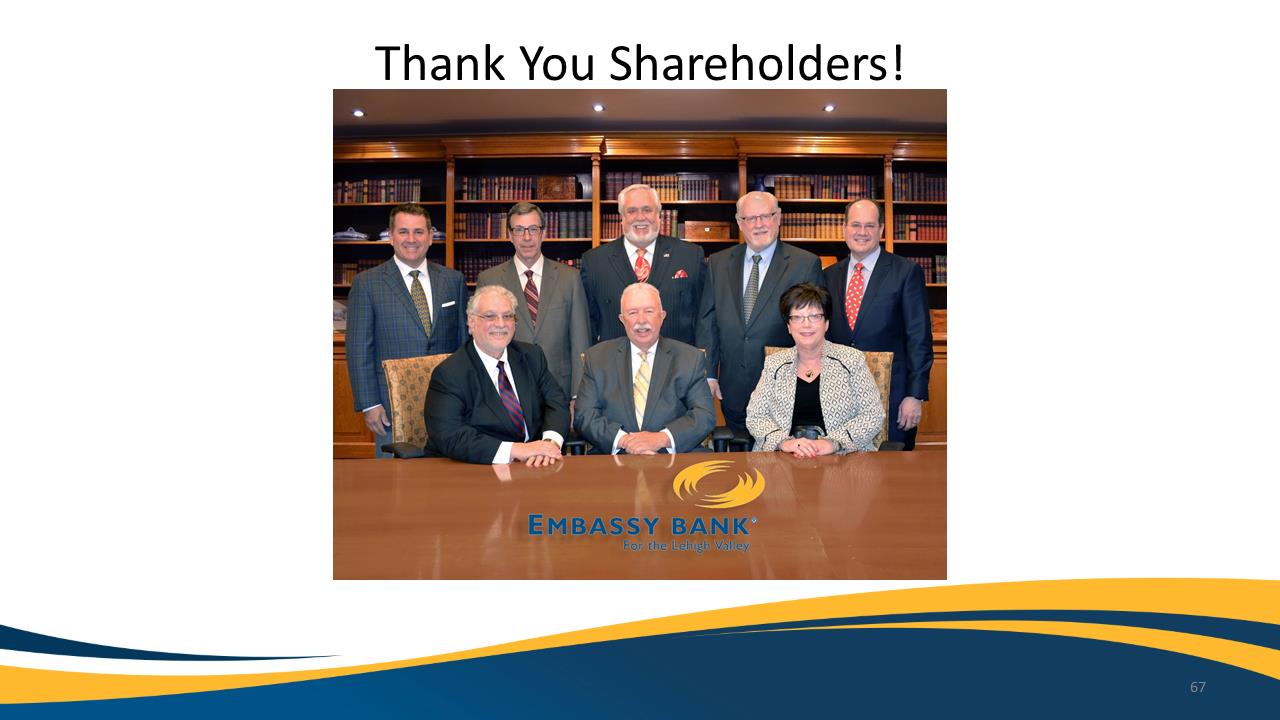
Thank You Shareholders!
67
Embassy Bank For the Lehigh Valley