Attached files
| file | filename |
|---|---|
| 8-K - FORM 8-K - ATLANTIC POWER CORP | tm2022756-1_8k.htm |
Exhibit 99.1

CONFIDENTIAL Annual and Special Meeting of Shareholders June 17, 2020

Cautionary Note Regarding Forward - Looking Statements 2 To the extent any statements made in this presentation contain information that is not historical, these statements are forward - looking statements or forward - looking information, as applicable, within the meaning of Section 27 A of the U . S . Securities Act of 1933 , as amended, and Section 21 E of the U . S . Securities Exchange Act of 1934 , as amended, and under Canadian securities law (collectively “ forward - looking statements”) . Forward - looking statements can generally be identified by the use of words such as “should,” “intend,” “may,” “expect,” “believe,” “anticipate,” “estimate,” “continue,” “plan,” “project,” “will,” “could,” “would,” “target,” “potential” and other similar expressions . In addition, any statements that refer to expectations, projections or other characterizations of future events or circumstances are forward - looking statements . Although Atlantic Power Corporation (“AT”, “Atlantic Power” or the “Company”) believes that the expectations reflected in such forward - looking statements are reasonable, such statements involve risks and uncertainties and should not be read as guarantees of future performance or result s, and will not necessarily be accurate indications of whether or not or the times at or by which such performance or results will be achieved . Please refer to the factors discussed under “Risk Factors” and “Forward - Looking Information” in the Company’s periodic reports as filed with the Securities and Exchange Commission from time to time for a detailed discussion of the risks and uncertainties affecting the Company, including, without limitation, the effects of the coronavirus pandemic on the Company’s business and results, including the measures taken by governmental authorities to address it, which may precipitate or exacerbate other risks and/or uncertainties ; the outcome or impact of the Company’s business strategy to increase the intrinsic value of the Company on a per - share basis through disciplined management of its balance sheet and cost structure and investment of its discretionary cash in a combination of organic and external growth projects, acquisitions, and repurchases of debt and equity securities ; the Company’s ability to enter into new PPAs on favorable terms or at all after the expiration of existing agreements, and the outcome or impact on the Company’s business of any such actions . Although the forward - looking statements contained in this presentation are based upon what are believed to be reasonable assumptions, investors cannot be assured that actual results will be consistent with these forward - looking statements, and the differences may be material . These forward - looking statements are made as of the date of this presentation and, except as expressly required by applicable law, the Company assumes no obligation to update or revise them to reflect new events or circumstances . The Company’s ability to achieve its longer - term goals, including those described in this presentation, is based on significant assumptions relating to and including, among other things, the general conditions of the markets in which it operates, revenues, internal and external growth opportunities, its ability to sell assets at favorable prices or at all and general financial market and interest rate conditions . The Company’s actual results may differ, possibly materially and adversely, from these goals . Disclaimer – Non - GAAP Measures Project Adjusted EBITDA is not a measure recognized under GAAP and does not have a standardized meaning prescribed by GAAP, and is therefore unlikely to be comparable to similar measures presented by other companies . Investors are cautioned that the Company may calculate this non - GAAP measure in a manner that is different from other companies . The most directly comparable GAAP measure is project income (loss) . Project Adjusted EBITDA is defined as project income (loss) plus interest, taxes, depreciation and amortization (including non - cash impairment charges ), and changes in the fair value of derivative instruments . Management uses Project Adjusted EBITDA at the project level to provide comparative information about project performance and believes such information is helpful to investors . All amounts in this presentation are in US $ and approximate unless otherwise stated . Leverage ratio • Consolidated debt to Adjusted EBITDA , calculated for the trailing four quarters . • Consolidated debt includes both long - term debt and the current portion of long - term debt at APLP Holdings, specifically the amount outstanding under the term loan and the amount borrowed under the revolver, if any, the Medium Term Notes, and consolidated project debt (Epsilon Power Partners and Cadillac) . • Adjusted EBITDA is calculated as the Consolidated Net Income of APLP Holdings plus the sum of consolidated interest expense, tax expense, depreciation and amortization expense, and other non - cash charges, minus non - cash gains . The Consolidated Net Income includes an allocation of the majority of Atlantic Power G&A expense . It also excludes earnings attributable to equity - owned projects but includes cash distributions received from those projects . Reference to “ Cdn $ ” and “Canadian dollars” are to the lawful currency of Canada and references to “ $ ”, “US $ ” and “U . S . dollars” are to the lawful currency of the United States . All dollar amounts herein are in U . S . dollars, unless otherwise indicated .

YTD 2020 Highlights 3 Q1 2020 Financial Results • Project Adjusted EBITDA modestly exceeded our expectations (higher water flows at Curtis Palmer) • On track to achieve 2020 guidance • Continued to strengthen balance sheet by repaying $21.6 million of debt Other Financial Developments • Executed favorable changes to both term loan and revolver o Targeted debt balances amended to reflect sale of Manchief in 2022 o Maturity dates for both extended to April 2025 o Spread reduced 25 basis points to LIBOR plus 2.50%; to be reduced another 25 basis points upon achieving leverage ratio of 2.75 times or lower • Received second tranche of insurance recovery for Cadillac ($7.4 million; total $18.6 million through March 31) Capital Allocation Initiatives • Significant repurchases of common and preferred shares under normal course issuer bid (NCIB) • Completed substantial issuer bid (SIB) for common shares on May 1, repurchasing approximately 12% of outstanding shares at a price of $2.00 per share Operational and Commercial Developments • Cadillac repairs on track for a targeted return to service in Q3 2020 • Calstock PPA recently extended six months to mid - December o Provides government additional time to evaluate role of Calstock and biomass in the province • Oxnard PPA expired in May and was not renewed o However, plant is under a Reliability Must Run agreement with California Independent System Operator through end of this year

4 (1) Excludes unamortized discounts and deferred financing costs. 2015 – 2019: Achieved Significant Debt and Cost Reductions ($ millions) More than $1.1 billion net reduction in consolidated debt since YE 2014 $1,755 $1,019 $997 $846 $727 $649 6.9 5.7 5.6 3.3 4.5 3.8 0.0 1.0 2.0 3.0 4.0 5.0 6.0 7.0 8.0 $0 $200 $400 $600 $800 $1,000 $1,200 $1,400 $1,600 $1,800 $2,000 YE 2014 YE 2015 YE 2016 YE 2017 YE 2018 YE 2019 Consolidated debt (millions) (1) Leverage ratio $45 $32 $23 $22 $24 $24 $0 $5 $10 $15 $20 $25 $30 $35 $40 $45 $50 2014 2015 2016 2017 2018 2019 $127 $100 $71 $72 $41 $38 $0 $20 $40 $60 $80 $100 $120 $140 2014 2015 2016 2017 2018 2019 Cash Interest Payments General, Administrative and Development Expense

33% 34% 2015 – 2019: Changes to Portfolio (Number of Operating Plants) 5 27 21 YE 2014 YE 2019 Total investment $44.9 million, 5x average estimated Project Adjusted EBITDA • Koma Kulshan (remaining 6 MW) • Interests in four biomass plants (total of 75 MW) 4 Tunis; new 15 - year PPA San Diego plants; obtained new PPAs but lost site control (3) Sold five wind plants for $347 million cash plus debt : • 14x EBITDA; 13x CAFD • Used proceeds to redeem 9% debt • Cash - accretive Sold Selkirk (merchant plant) (6) (2) 1 Kapuskasing and North Bay due to PPA terminations Sold Closed Mothballed Returned to Service Acquired 2014 1,988 $299 MW Project Adjusted EBITDA (millions) 2019 1,327 $196 2014 – 2019 Debt 63% Cash Interest 70% G&A 44% Balance Sheet and Cost Reshaping Changes to Portfolio and PPA Expirations

6 Capital Allocation: Past, Present and Future

Past: 2015 – 2019 7 Acquisitions • Focus on intrinsic value per share, not absolute size of business • In 2018 and 2019, invested a total of $45 million to acquire ownership interests in a hydro facility and four biomass plants • Added 81 MW net ownership to portfolio • Extended average remaining contract life and increased longer - term cash flows • Expected to contribute $8 to $10 million of Project Adjusted EBITDA annually on average through expiration of first PPA (2027) Investments in the Fleet • From 2013 – 2016, made $25 million of discretionary investments in our power plants • Improved operating efficiency, increased production, reduced operating costs • Attractive cash - on - cash returns • Less need for these investments today Common Dividends • In 2015, paid $10 million of common dividends • Eliminated dividend in early 2016; not consistent with business model or current market conditions Securities Repurchases (through year - end 2019) • Since late 2015, repurchased approximately 17.0 million common shares at a total cost of $38.8 million or an average price of $2.28 per share • Common shares outstanding reduced 11% during this period • Invested $19.1 million (US$ equivalent) in the repurchase of nearly 1.6 million preferred shares, representing an average discount to par of 37%; after - tax yields of between 10% and 12%

Present: 2020: Significant Acceleration of Repurchase Activity 8 Common • NCIB : Repurchased a total of 4.0 million common shares at an average price of $2.16 per share • SIB : o Launched March 25; closed May 1 o Repurchased 12.5 million common shares at a price of $2.00 per share (~12% of shares o/s) • Total investment of $ 33.7 million through May 31, 2020 o 16.5 million common shares o Average price of $2.04 per share 2020 Securities Repurchases (YTD through May 31, 2020) Preferred • Invested $6.4 million (US$ equivalent) to repurchase approximately 564 thousand preferred shares • Average discount to par of 39% Cumulative Securities Repurchases (December 2015 – May 31, 2020) Common □ 33.5 million shares □ Investment of $72.5 million □ Average price of $2.16 per share Preferred □ 2.1 million shares □ Investment of $25.5 million (US$ equivalent) □ Average discount to par of 37% □ After - tax cash yields of 10% to 12%

Future: 2020 – 2024 9 Significant Reduction in Debt Expected • Approximately 95% of cumulative Project Adjusted EBITDA and operating cash flow generated under existing contracts • Expect to allocate majority of operating cash flow and all of Manchief sale proceeds to debt repayment • Expect to repay $423 million of term loan and project debt between YE 2019 and YE 2024 (1) o Represents more than 60% reduction from year - end 2019 level o Expect will result in lower cash interest payments and lower leverage ratios during this period $687 $582 $478 $358 $283 $243 $0 $100 $200 $300 $400 $500 $600 $700 $800 YE 2019 YE 2020 YE 2021 YE 2022 YE 2023 YE 2024 (1) Reduction in debt balances of $444 million from YE 2019 to YE 2024 includes $21 million unrealized foreign exchange gain on Cdn dollar - denominated debt in Q1 2020.

Future: 2020 - 2024 10 Expect to generate cumulative discretionary cash flow of ~$ 115 million to ~$ 165 million (after debt repayment of $423 million, maintenance capex and preferred dividends) Capital Allocation Alternatives: □ Option A: Build - up of discretionary cash on balance sheet • Achieves Net Debt Neutral in 2025 - or - □ Option B: Repurchases of common and / or preferred shares • Common : Current market capitalization of $186 million (1) - or - • Preferred : Current market value $84 million (par value of $121 million) - or - □ Option C: Growth • Revolver another source of liquidity (3/31/20 availability of $102 million ) - or - □ Option D: Combination of the above ** Capital Allocation Benchmark: Accretion to intrinsic value per share ** (1) Based on 6/12/20 closing stock price of $2.00 per share and 92.8 million shares outstanding as of May 31, 2020. Least likely outcome Most likely outcome
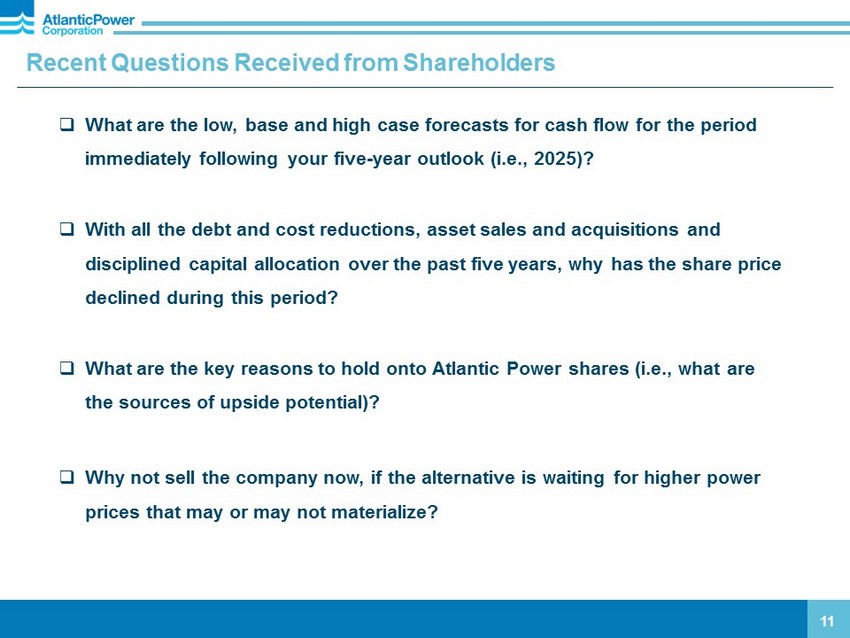
Recent Questions Received from Shareholders 11 □ What are the low, base and high case forecasts for cash flow for the period immediately following your five - year outlook (i.e., 2025)? □ With all the debt and cost reductions, asset sales and acquisitions and disciplined capital allocation over the past five years, why has the share price declined during this period? □ What are the key reasons to hold onto Atlantic Power shares (i.e., what are the sources of upside potential)? □ Why not sell the company now, if the alternative is waiting for higher power prices that may or may not materialize?

Potential Sources of Value for Atlantic Power Plants Post - PPA 12 Macro Trends and Implications □ Trend toward short - term contracts / merchant operations • Fully depreciated plants are better positioned than capital - intensive new - build plants (need long - term revenue stream) □ Current low forward energy and capacity price curves • Illiquid and poor predictors of future prices and values • Potential to increase as renewable tax credits expire, uneconomic plants are retired, supply / demand balance rationalizes □ Continued growth of intermittent wind and solar generation • Increasing need for flexible, dependable gas generation Hydros ( PPAs expiring 2027 (1) – 2037) • Good locations; difficult / impossible to replace • Long physical and economic lives • Price - takers; benefit from higher gas and/or power prices • May be able to capture capacity value in some markets • Positioned to capitalize on renewable / environmental incentives • Renewable value grows with carbon tax regime or tougher RPS (NY) • Cheaper renewable than new - build solar or wind Biomass ( PPAs expiring in 2020 and 2027 – 2043) Though an above - market source of power, could benefit from multiple trends: • Need for firm and reliable renewable energy • Growing need to provide economic / environmental support to forestry sector (waste management) • Concern over forest management and forest fire protection (provide clearing and use of forest residue) Natural Gas ( PPAs expiring 2020 – 2023 and 2033 – 2034) • Provide flexible, lower - cost, longer - duration firm power to backstop renewables compared to batteries or new - build gas plants • Do not require long - term revenue streams to recover fixed costs (unlike batteries or new build gas) • Provide ancillary services and firm hedge in hydro - dependent markets (Pacific NW) • Combined heat and power (CHP) value to industrial customer benefits re - contracting outlook and post - PPA values for Kenilworth and Morris (1) Based on cumulative generation to date, Curtis Palmer’s PPA is expected to expire prior to 2027.

Appendix 13 TABLE OF CONTENTS Page Impact of Coronavirus Pandemic 14 Power Projects and PPA Expiration Dates 15

Business Model and Proactive Steps have Limited the Impact of Coronavirus Pandemic 14 □ Impact to date has been limited • Continuing to operate plants safely and reliably • Zero confirmed cases to date among Atlantic Power employees and plant contractors • Cadillac repair schedule has not been materially impacted • Monitoring fuel supply at biomass plants; expect impact at Calstock due to reduced production by mills due to the downturn in demand • Lower demand has reduced power prices and forward curves, which hurt re - contracting prospects for Oxnard • Overall, we do not anticipate a material impact on operations, financial position or results • Continuing to monitor the evolving situation; ultimate outcome remains uncertain □ Believe we are well positioned overall • Power generation an essential business in the United States and Canada • Substantially contracted business model (capacity payment or contracted energy rate) • Limited financial sensitivity to downturn in demand or spot prices (may hurt re - contracting prospects in near term) • Nearly all of our customers are investment - grade rated (Chemours/Chambers only exception) • Not experiencing any delays in payments • Stable liquidity; no need to access capital markets • Well positioned to withstand extended economic or power market downturn
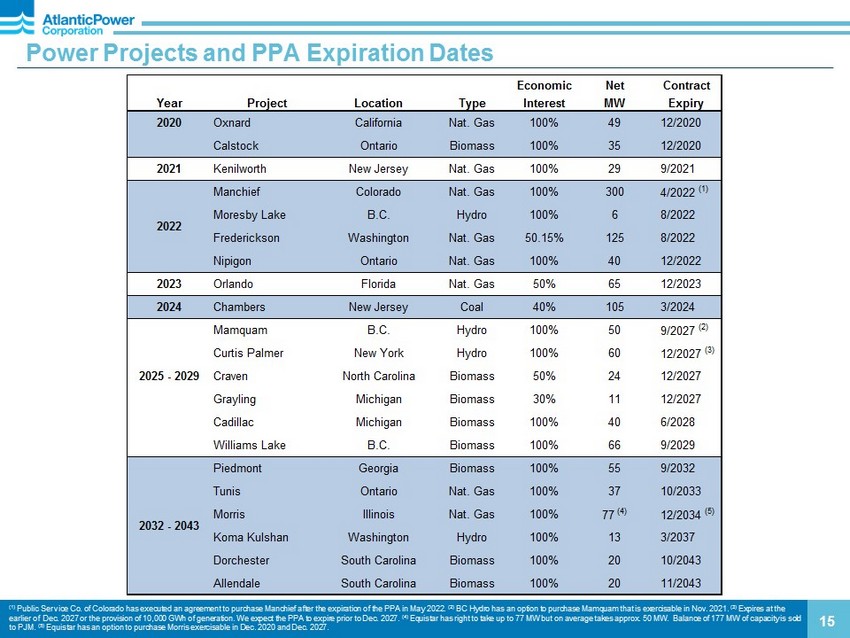
Power Projects and PPA Expiration Dates 15 (1) Public Service Co. of Colorado has executed an agreement to purchase Manchief after the expiration of the PPA in May 2022. (2) BC Hydro has an option to purchase Mamquam that is exercisable in Nov. 2021. (3) Expires at the earlier of Dec. 2027 or the provision of 10,000 GWh of generation . We expect the PPA to expire prior to Dec. 2027 . (4) Equistar has right to take up to 77 MW but on average takes approx. 50 MW. Balance of 177 MW of capacity is sold to PJM. (5) Equistar has an option to purchase Morris exercisable in Dec. 2020 and Dec. 2027. Economic Net Contract Year Project Location Type Interest MW Expiry 2020 Oxnard California Nat. Gas 100% 49 12/2020 Calstock Ontario Biomass 100% 35 12/2020 2021 Kenilworth New Jersey Nat. Gas 100% 29 9/2021 Manchief Colorado Nat. Gas 100% 300 4/2022 (1) Moresby Lake B.C. Hydro 100% 6 8/2022 Frederickson Washington Nat. Gas 50.15% 125 8/2022 Nipigon Ontario Nat. Gas 100% 40 12/2022 2023 Orlando Florida Nat. Gas 50% 65 12/2023 2024 Chambers New Jersey Coal 40% 105 3/2024 Mamquam B.C. Hydro 100% 50 9/2027 (2) Curtis Palmer New York Hydro 100% 60 12/2027 (3) 2025 - 2029 Craven North Carolina Biomass 50% 24 12/2027 Grayling Michigan Biomass 30% 11 12/2027 Cadillac Michigan Biomass 100% 40 6/2028 Williams Lake B.C. Biomass 100% 66 9/2029 Piedmont Georgia Biomass 100% 55 9/2032 Tunis Ontario Nat. Gas 100% 37 10/2033 Morris Illinois Nat. Gas 100% 77 (4) 12/2034 (5) Koma Kulshan Washington Hydro 100% 13 3/2037 Dorchester South Carolina Biomass 100% 20 10/2043 Allendale South Carolina Biomass 100% 20 11/2043 2022 2032 - 2043