Attached files
| file | filename |
|---|---|
| 8-K - 8-K - KENTUCKY BANCSHARES INC /KY/ | ktyb-20200616x8k.htm |
Exhibit 99.1
| Kentucky Bancshares, Inc. Annual meeting Proctor Caudill, Chairman Louis Prichard, President and CEO June 16, 2020 Trading Symbol: KTYB www.kybank.com |
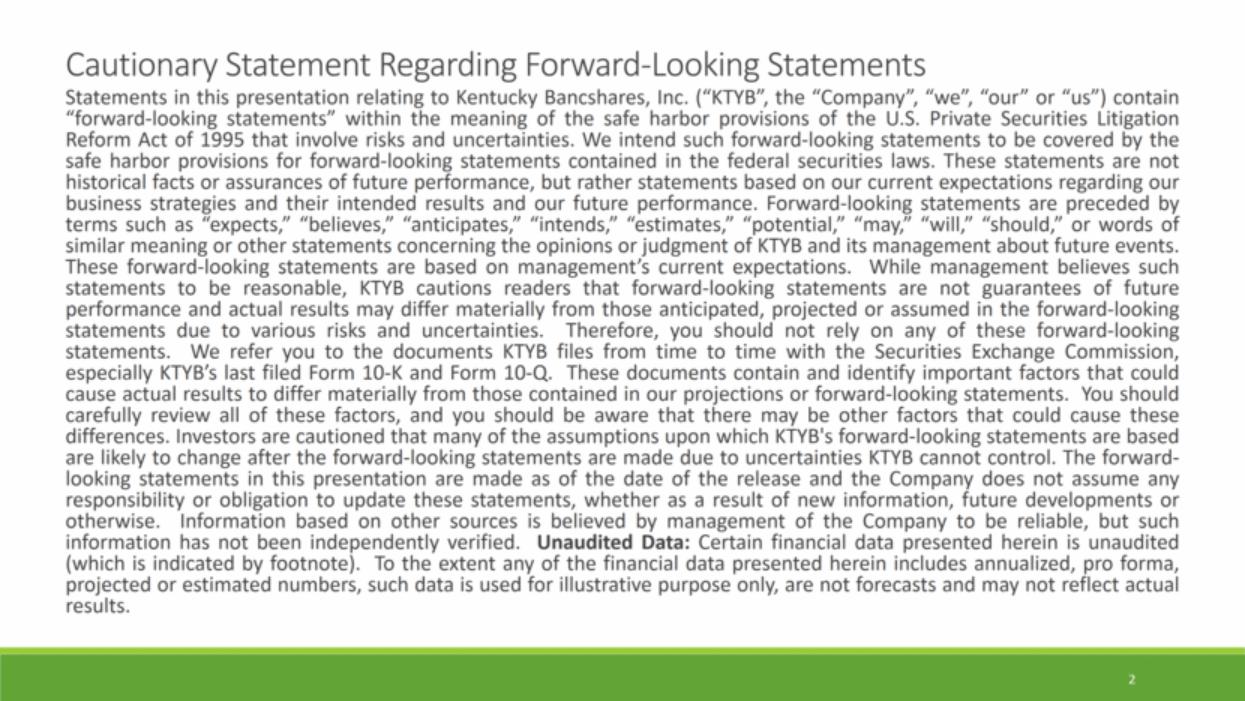
| 2 Cautionary Statement Regarding Forward-Looking Statements Statements in this presentation relating to Kentucky Bancshares, Inc. (“KTYB”, the “Company”, “we”, “our” or “us”) contain “forward-looking statements” within the meaning of the safe harbor provisions of the U.S. Private Securities Litigation Reform Act of 1995 that involve risks and uncertainties. We intend such forward-looking statements to be covered by the safe harbor provisions for forward-looking statements contained in the federal securities laws. These statements are not historical facts or assurances of future performance, but rather statements based on our current expectations regarding our business strategies and their intended results and our future performance. Forward-looking statements are preceded by terms such as “expects,” “believes,” “anticipates,” “intends,” “estimates,” “potential,” “may,” “will,” “should,” or words of similar meaning or other statements concerning the opinions or judgment of KTYB and its management about future events. These forward-looking statements are based on management’s current expectations. While management believes such statements to be reasonable, KTYB cautions readers that forward-looking statements are not guarantees of future performance and actual results may differ materially from those anticipated, projected or assumed in the forward-looking statements due to various risks and uncertainties. Therefore, you should not rely on any of these forward-looking statements. We refer you to the documents KTYB files from time to time with the Securities Exchange Commission, especially KTYB’s last filed Form 10-K and Form 10-Q. These documents contain and identify important factors that could cause actual results to differ materially from those contained in our projections or forward-looking statements. You should carefully review all of these factors, and you should be aware that there may be other factors that could cause these differences. Investors are cautioned that many of the assumptions upon which KTYB's forward-looking statements are based are likely to change after the forward-looking statements are made due to uncertainties KTYB cannot control. The forward-looking statements in this presentation are made as of the date of the release and the Company does not assume any responsibility or obligation to update these statements, whether as a result of new information, future developments or otherwise. Information based on other sources is believed by management of the Company to be reliable, but such information has not been independently verified. Unaudited Data: Certain financial data presented herein is unaudited (which is indicated by footnote). To the extent any of the financial data presented herein includes annualized, pro forma, projected or estimated numbers, such data is used for illustrative purpose only, are not forecasts and may not reflect actual results. |
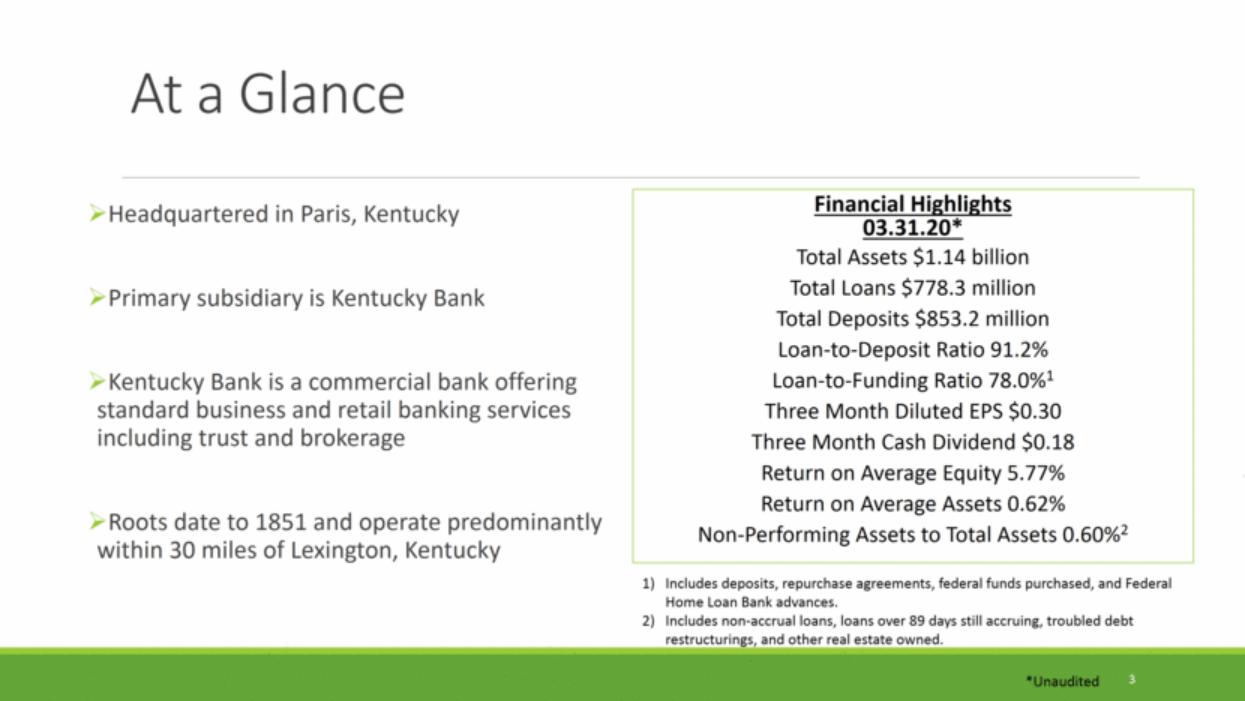
| At a Glance Headquartered in Paris, Kentucky Primary subsidiary is Kentucky Bank Kentucky Bank is a commercial bank offering standard business and retail banking services including trust and brokerage Roots date to 1851 and operate predominantly within 30 miles of Lexington, Kentucky 3 Financial Highlights 03.31.20* Total Assets $1.14 billion Total Loans $778.3 million Total Deposits $853.2 million Loan-to-Deposit Ratio 91.2% Loan-to-Funding Ratio 78.0%1 Three Month Diluted EPS $0.30 Three Month Cash Dividend $0.18 Return on Average Equity 5.77% Return on Average Assets 0.62% Non-Performing Assets to Total Assets 0.60%2 *Unaudited Includes deposits, repurchase agreements, federal funds purchased, and Federal Home Loan Bank advances. Includes non-accrual loans, loans over 89 days still accruing, troubled debt restructurings, and other real estate owned. |
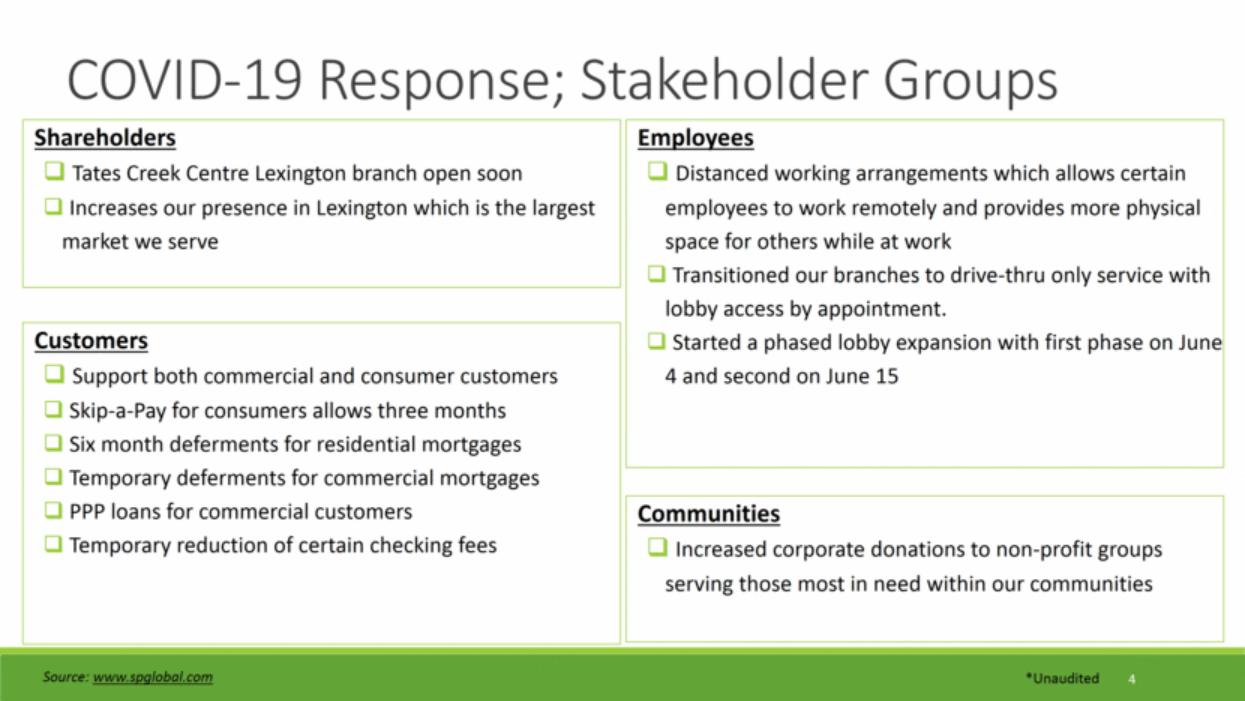
| 4 COVID-19 Response; Stakeholder Groups *Unaudited Source: www.spglobal.com Shareholders Tates Creek Centre Lexington branch open soon Increases our presence in Lexington which is the largest market we serve Employees Distanced working arrangements which allows certain employees to work remotely and provides more physical space for others while at work Transitioned our branches to drive-thru only service with lobby access by appointment. Started a phased lobby expansion with first phase on June 4 and second on June 15 Customers Support both commercial and consumer customers Skip-a-Pay for consumers allows three months Six month deferments for residential mortgages Temporary deferments for commercial mortgages PPP loans for commercial customers Temporary reduction of certain checking fees Communities Increased corporate donations to non-profit groups serving those most in need within our communities |
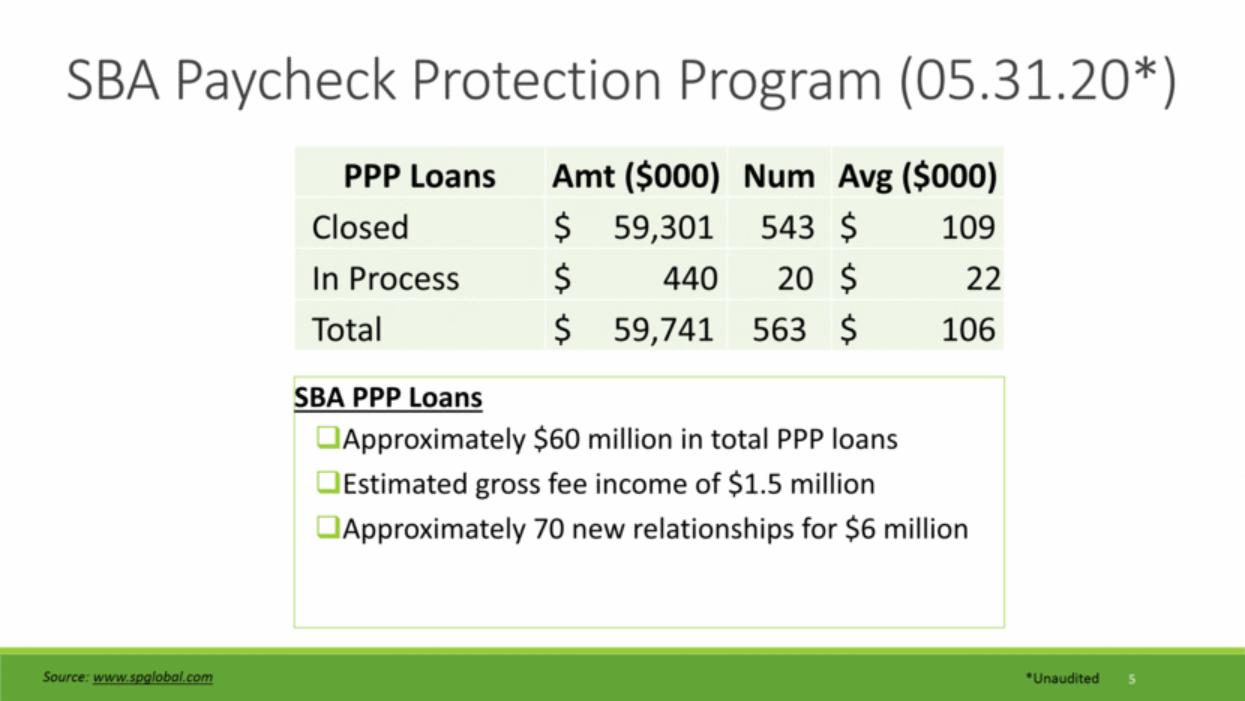
| 5 SBA Paycheck Protection Program (05.31.20*) *Unaudited Source: www.spglobal.com SBA PPP Loans Approximately $60 million in total PPP loans Estimated gross fee income of $1.5 million Approximately 70 new relationships for $6 million PPP Loans Amt ($000) Num Avg ($000) Closed $ 59,301 543 $ 109 In Process $ 440 20 $ 22 Total $ 59,741 563 $ 106 |
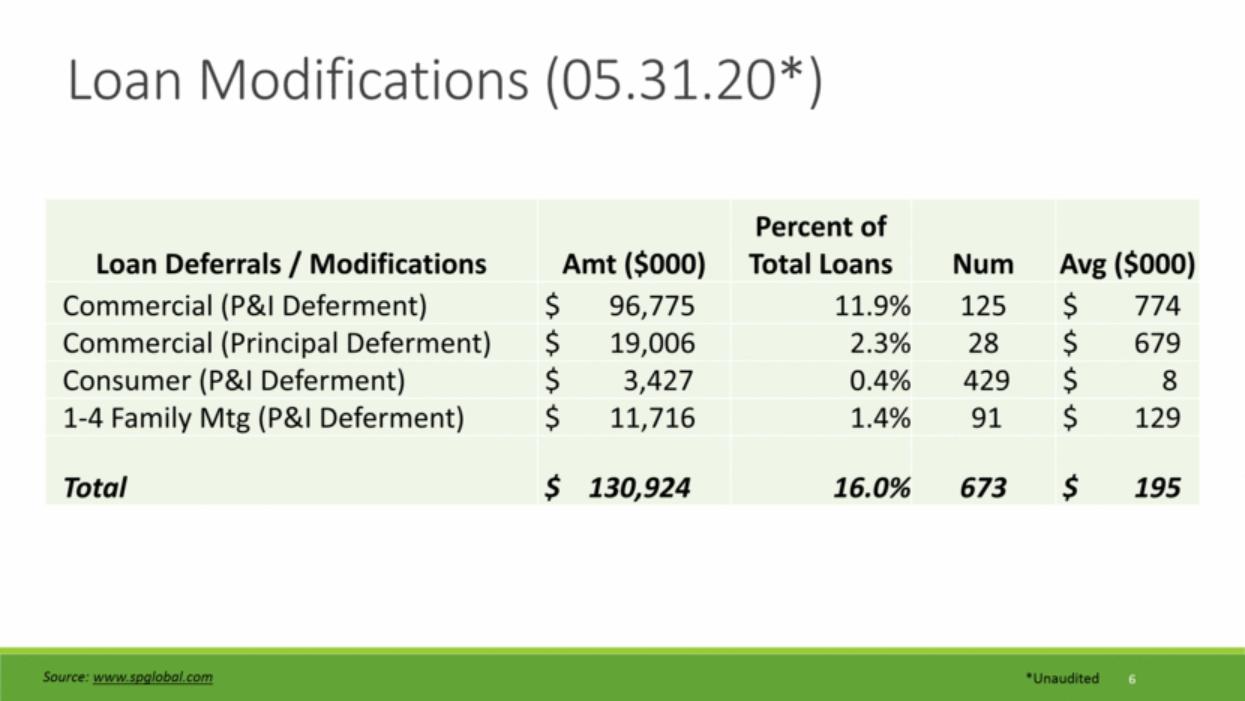
| 6 Loan Modifications (05.31.20*) *Unaudited Source: www.spglobal.com Loan Deferrals / Modifications Amt ($000) Percent of Total Loans Num Avg ($000) Commercial (P&I Deferment) $ 96,775 11.9% 125 $ 774 Commercial (Principal Deferment) $ 19,006 2.3% 28 $ 679 Consumer (P&I Deferment) $ 3,427 0.4% 429 $ 8 1-4 Family Mtg (P&I Deferment) $ 11,716 1.4% 91 $ 129 Total $ 130,924 16.0% 673 $ 195 |
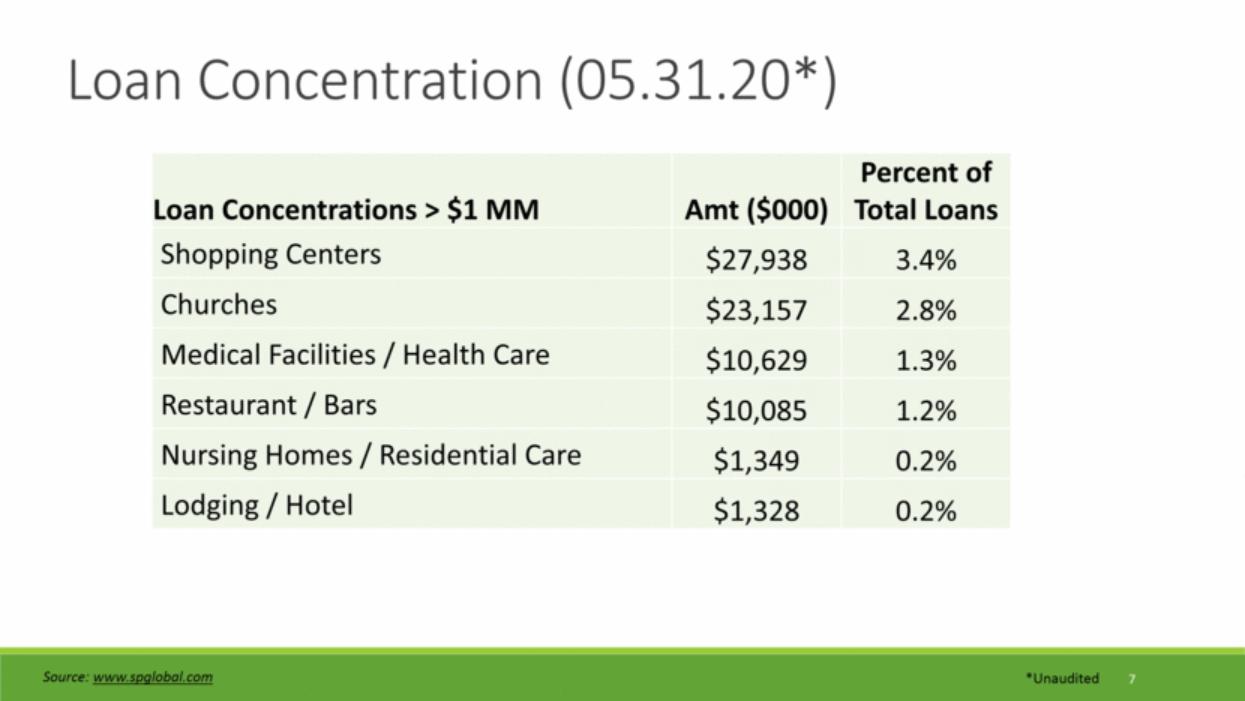
| 7 Loan Concentration (05.31.20*) *Unaudited Source: www.spglobal.com Loan Concentrations > $1 MM Amt ($000) Percent of Total Loans Shopping Centers $27,938 3.4% Churches $23,157 2.8% Medical Facilities / Health Care $10,629 1.3% Restaurant / Bars $10,085 1.2% Nursing Homes / Residential Care $1,349 0.2% Lodging / Hotel $1,328 0.2% |
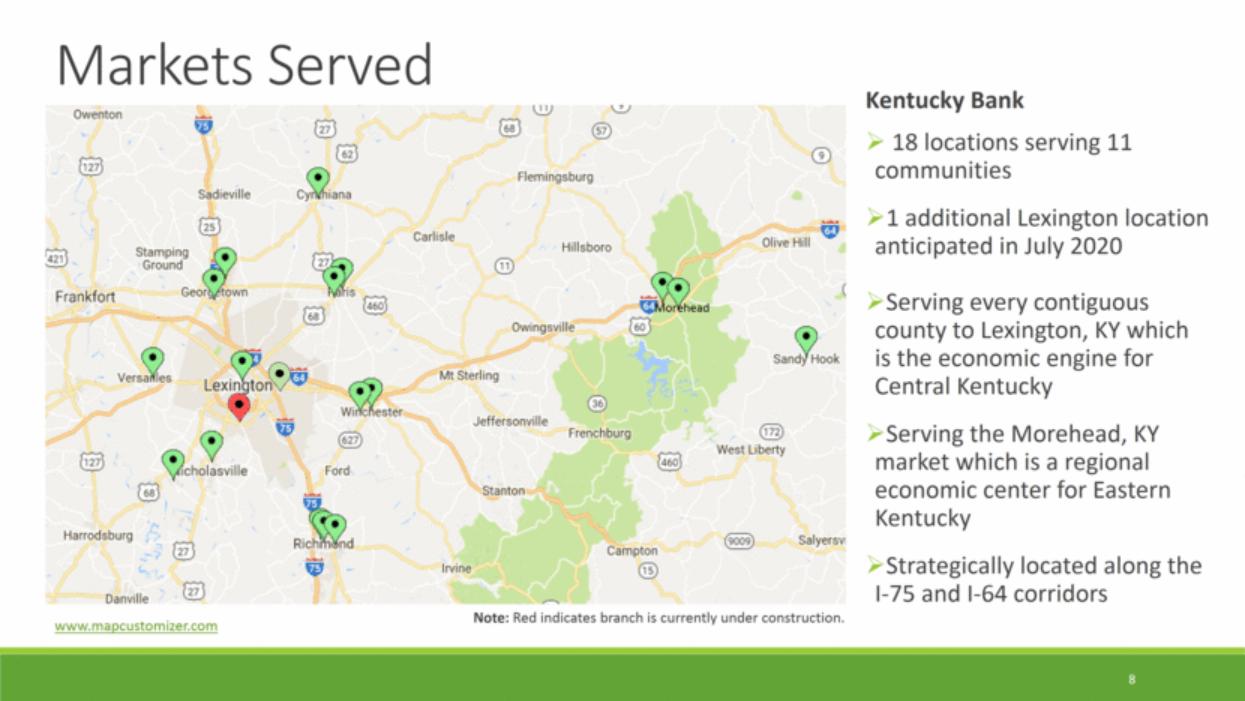
| 8 Markets Served www.mapcustomizer.com Kentucky Bank 18 locations serving 11 communities 1 additional Lexington location anticipated in July 2020 Serving every contiguous county to Lexington, KY which is the economic engine for Central Kentucky Serving the Morehead, KY market which is a regional economic center for Eastern Kentucky Strategically located along the I-75 and I-64 corridors Morehead Note: Red indicates branch is currently under construction. |
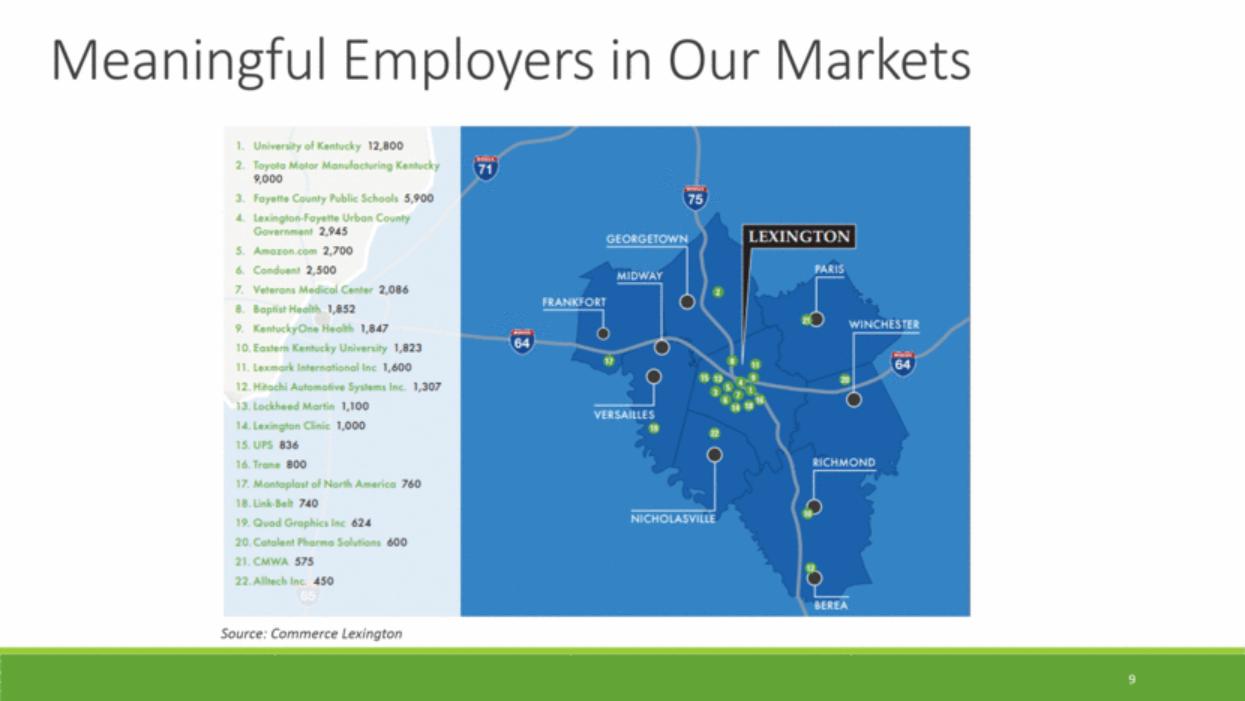
| Meaningful Employers in Our Markets 1. University of Kentucky 12,800 2. Toyota Motor Monufocturing Kentucky 9,000 3. Fayette County Public Schools 5,900 4. Lexington-Fayette Urban County Govemment 2,945 5. Amazon.com 2,700 6. Conduent 2,500 7. Veterans Medical Center 2,086 8. Baptist Health 1,852 9. KentuckyOne Health 1,847 10. Eastern Kentucky University 1,823 11. Lexmark International Inc 1,600 12. Hitachi Automotive Systems Inc. 1,307 13. Lockheed Mart in 1,100 14. Laxingtan Clinic 1,000 15. UPS 836 16. Trane 800 17. Mantaplast of North America 760 18. Link-Belt 740 19 Quad Graphics Inc 624 20.Cata lent Pharma Solutions 600 21. CMWA 575 22.AIItech Inc. 450 Source: Commerce Lexington 9 |
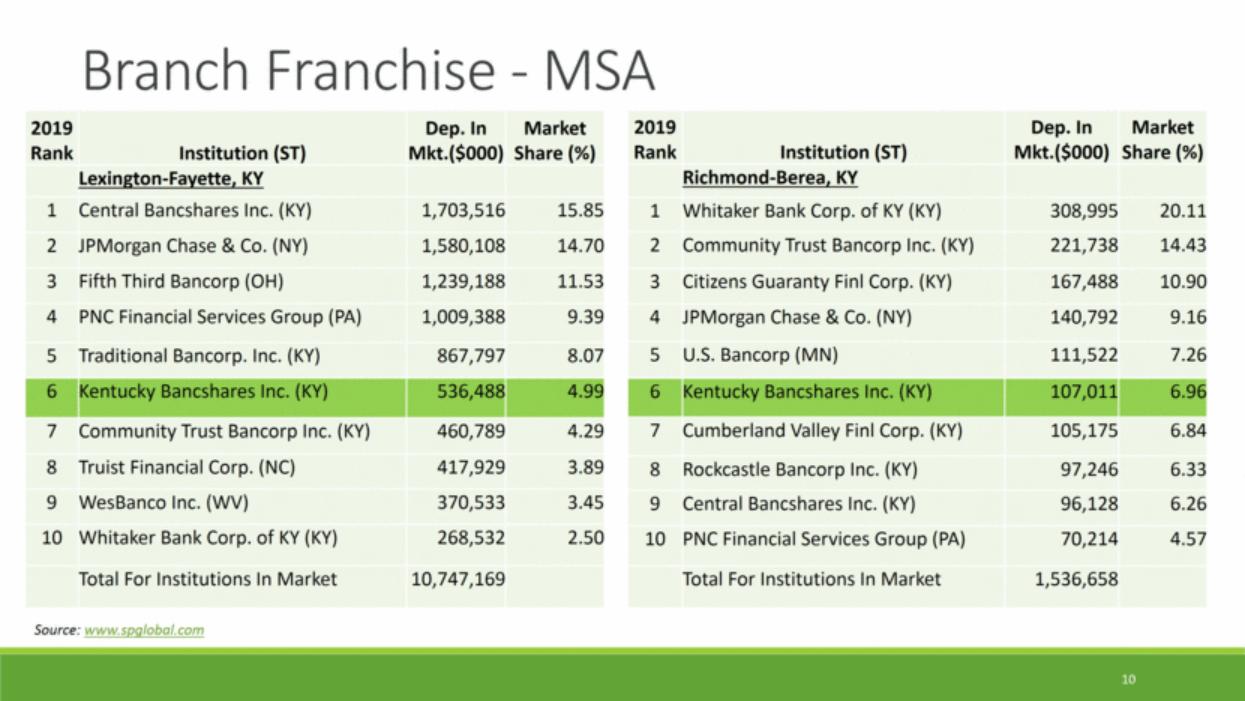
| 10 Branch Franchise - MSA Source: www.spglobal.com 2019 Rank Institution (ST) Dep. In Mkt.($000) Market Share (%) Lexington-Fayette, KY 1 Central Bancshares Inc. (KY) 1,703,516 15.85 2 JPMorgan Chase & Co. (NY) 1,580,108 14.70 3 Fifth Third Bancorp (OH) 1,239,188 11.53 4 PNC Financial Services Group (PA) 1,009,388 9.39 5 Traditional Bancorp. Inc. (KY) 867,797 8.07 6 Kentucky Bancshares Inc. (KY) 536,488 4.99 7 Community Trust Bancorp Inc. (KY) 460,789 4.29 8 Truist Financial Corp. (NC) 417,929 3.89 9 WesBanco Inc. (WV) 370,533 3.45 10 Whitaker Bank Corp. of KY (KY) 268,532 2.50 Total For Institutions In Market 10,747,169 2019 Rank Institution (ST) Dep. In Mkt.($000) Market Share (%) Richmond-Berea, KY 1 Whitaker Bank Corp. of KY (KY) 308,995 20.11 2 Community Trust Bancorp Inc. (KY) 221,738 14.43 3 Citizens Guaranty Finl Corp. (KY) 167,488 10.90 4 JPMorgan Chase & Co. (NY) 140,792 9.16 5 U.S. Bancorp (MN) 111,522 7.26 6 Kentucky Bancshares Inc. (KY) 107,011 6.96 7 Cumberland Valley Finl Corp. (KY) 105,175 6.84 8 Rockcastle Bancorp Inc. (KY) 97,246 6.33 9 Central Bancshares Inc. (KY) 96,128 6.26 10 PNC Financial Services Group (PA) 70,214 4.57 Total For Institutions In Market 1,536,658 |
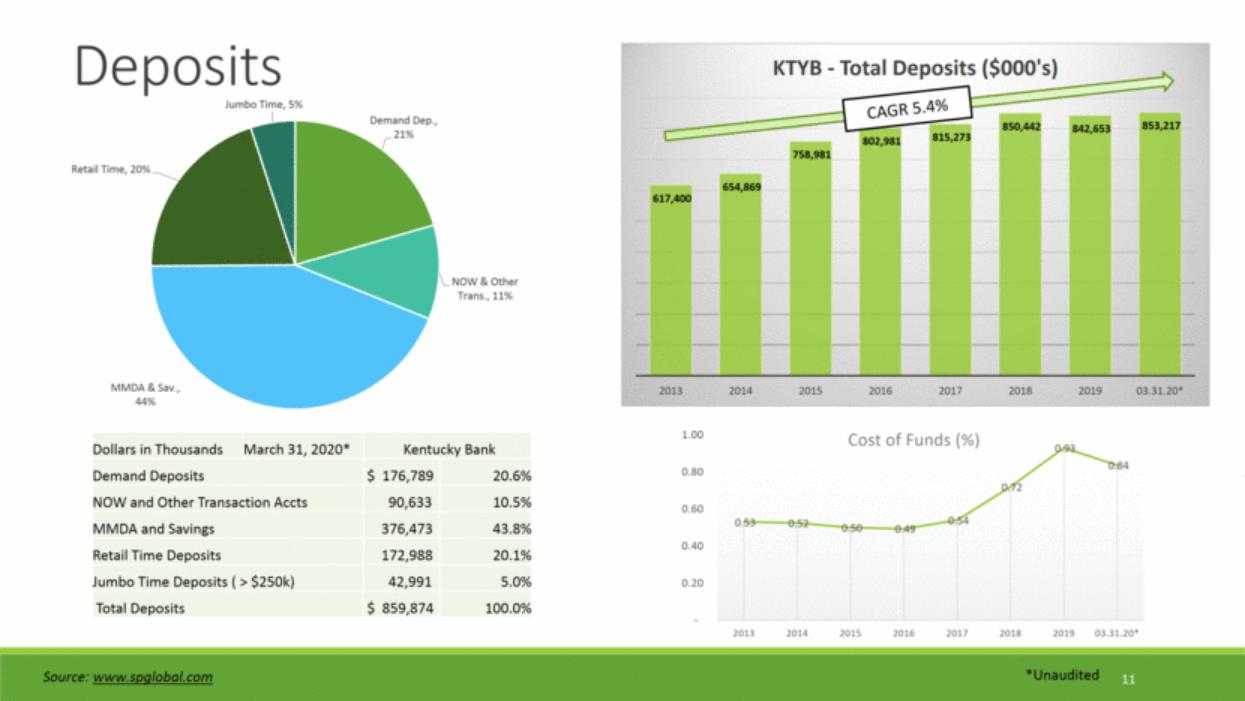
| 11 Deposits *Unaudited Source: www.spglobal.com Dollars in Thousands March 31, 2020* Kentucky Bank Demand Deposits $ 176,789 20.6% NOW and Other Transaction Accts 90,633 10.5% MMDA and Savings 376,473 43.8% Retail Time Deposits 172,988 20.1% Jumbo Time Deposits ( > $250k) 42,991 5.0% Total Deposits $ 859,874 100.0% CAGR 5.4% Demand Dep. , 21% NOW & Other Trans. , 11% MMDA & Sav. , 44% Retail Time , 20% Jumbo Time , 5% 617,400 654,869 758,981 802,981 815,273 850,442 842,653 853,217 2013 2014 2015 2016 2017 2018 2019 03.31.20* KTYB - Total Deposits ($000's) 0.53 0.52 0.50 0.49 0.54 0.72 0.93 0.84 - 0.20 0.40 0.60 0.80 1.00 2013 2014 2015 2016 2017 2018 2019 03.31.20* Cost of Funds (%) |
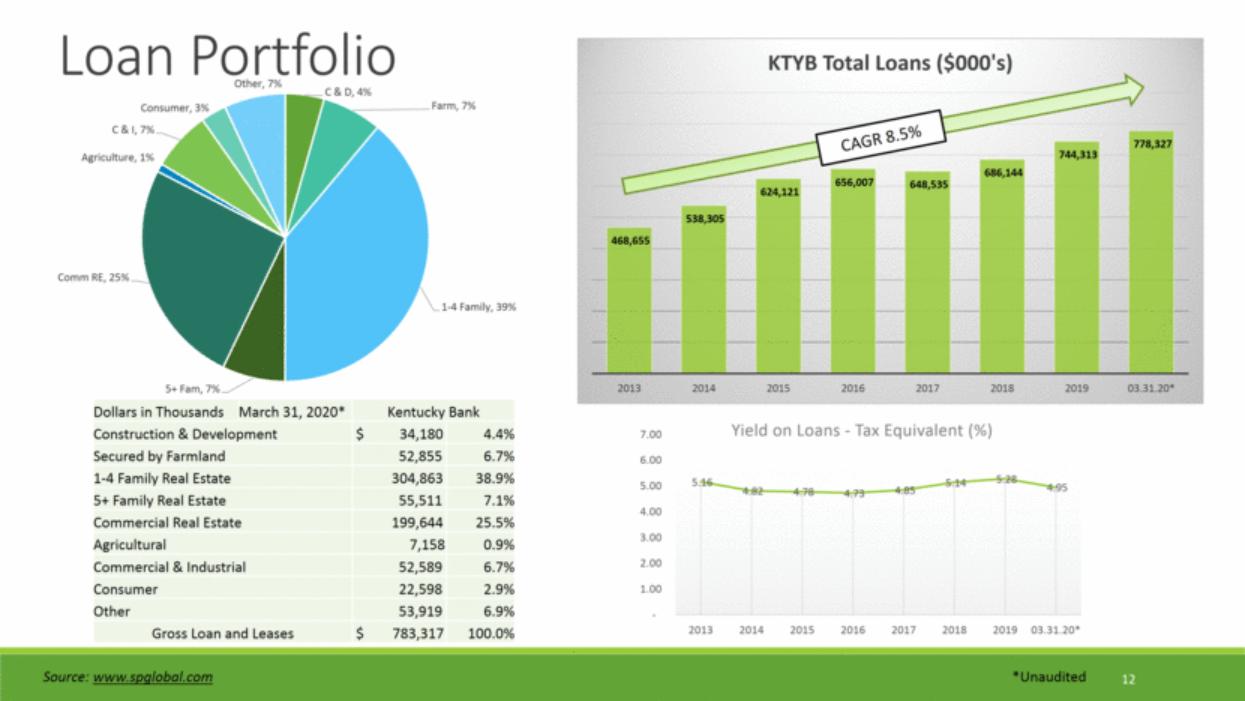
| 12 Loan Portfolio Source: www.spglobal.com *Unaudited Dollars in Thousands March 31, 2020* Kentucky Bank Construction & Development $ 34,180 4.4% Secured by Farmland 52,855 6.7% 1-4 Family Real Estate 304,863 38.9% 5+ Family Real Estate 55,511 7.1% Commercial Real Estate 199,644 25.5% Agricultural 7,158 0.9% Commercial & Industrial 52,589 6.7% Consumer 22,598 2.9% Other 53,919 6.9% Gross Loan and Leases $ 783,317 100.0% CAGR 8.5% C & D , 4% Farm , 7% 1 - 4 Family , 39% 5+ Fam , 7% Comm RE , 25% Agriculture , 1% C & I , 7% Consumer , 3% Other , 7% 468,655 538,305 624,121 656,007 648,535 686,144 744,313 778,327 2013 2014 2015 2016 2017 2018 2019 03.31.20* KTYB Total Loans ($000's) 5.16 4.82 4.78 4.73 4.85 5.14 5.28 4.95 - 1.00 2.00 3.00 4.00 5.00 6.00 7.00 2013 2014 2015 2016 2017 2018 2019 03.31.20* Yield on Loans - Tax Equivalent (%) |
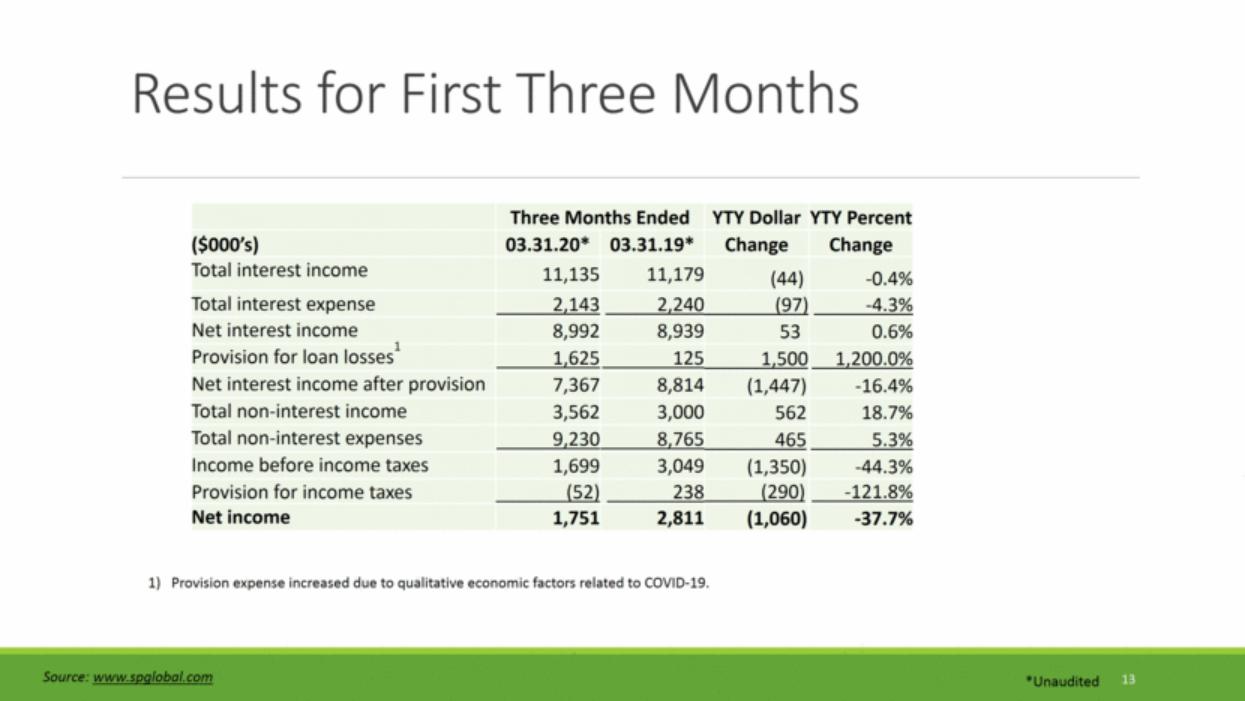
| Results for First Three Months 13 *Unaudited Source: www.spglobal.com Provision expense increased due to qualitative economic factors related to COVID-19. Three Months Ended YTY Dollar YTY Percent ($000’s) 03.31.20* 03.31.19* Change Change Total interest income 11,135 11,179 (44) -0.4% Total interest expense 2,143 2,240 (97) -4.3% Net interest income 8,992 8,939 53 0.6% Provision for loan losses1 1,625 125 1,500 1,200.0% Net interest income after provision 7,367 8,814 (1,447) -16.4% Total non-interest income 3,562 3,000 562 18.7% Total non-interest expenses 9,230 8,765 465 5.3% Income before income taxes 1,699 3,049 (1,350) -44.3% Provision for income taxes (52) 238 (290) -121.8% Net income 1,751 2,811 (1,060) -37.7% |
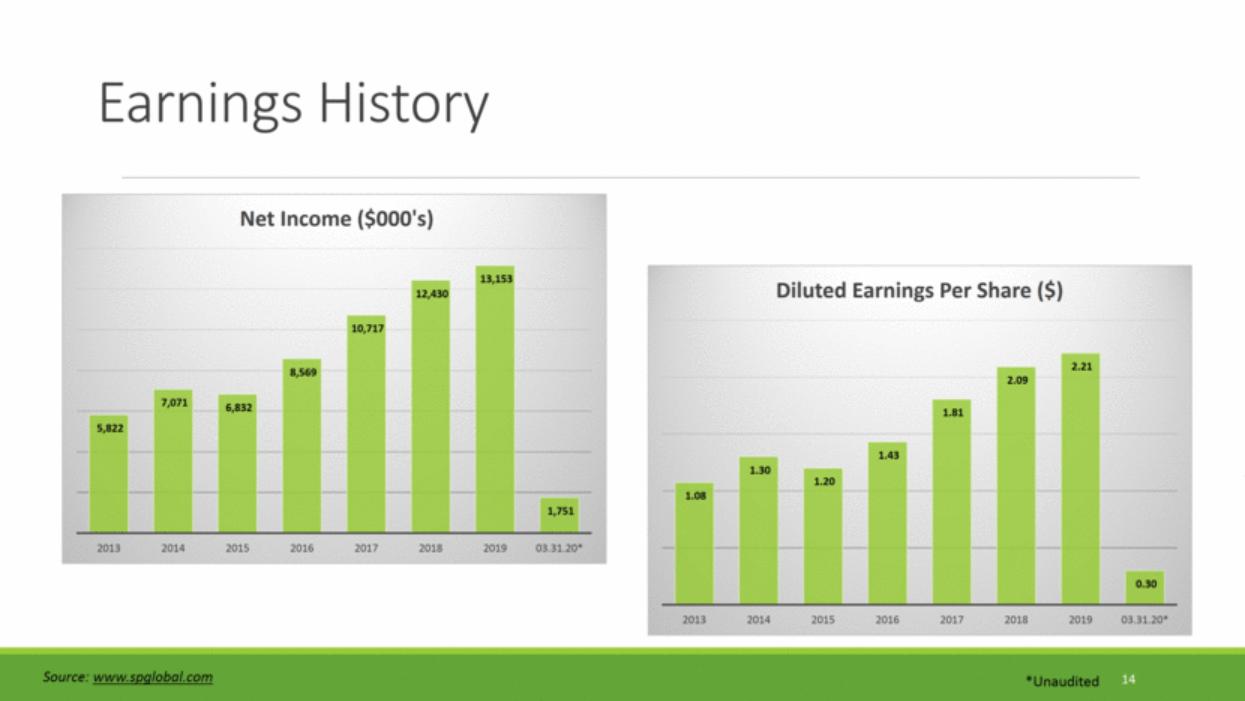
| Earnings History 14 *Unaudited Source: www.spglobal.com 1.08 1.30 1.20 1.43 1.81 2.09 2.21 0.30 2013 2014 2015 2016 2017 2018 2019 03.31.20* Diluted Earnings Per Share ($) 5,822 7,071 6,832 8,569 10,717 12,430 13,153 1,751 2013 2014 2015 2016 2017 2018 2019 03.31.20* Net Income ($000's) |
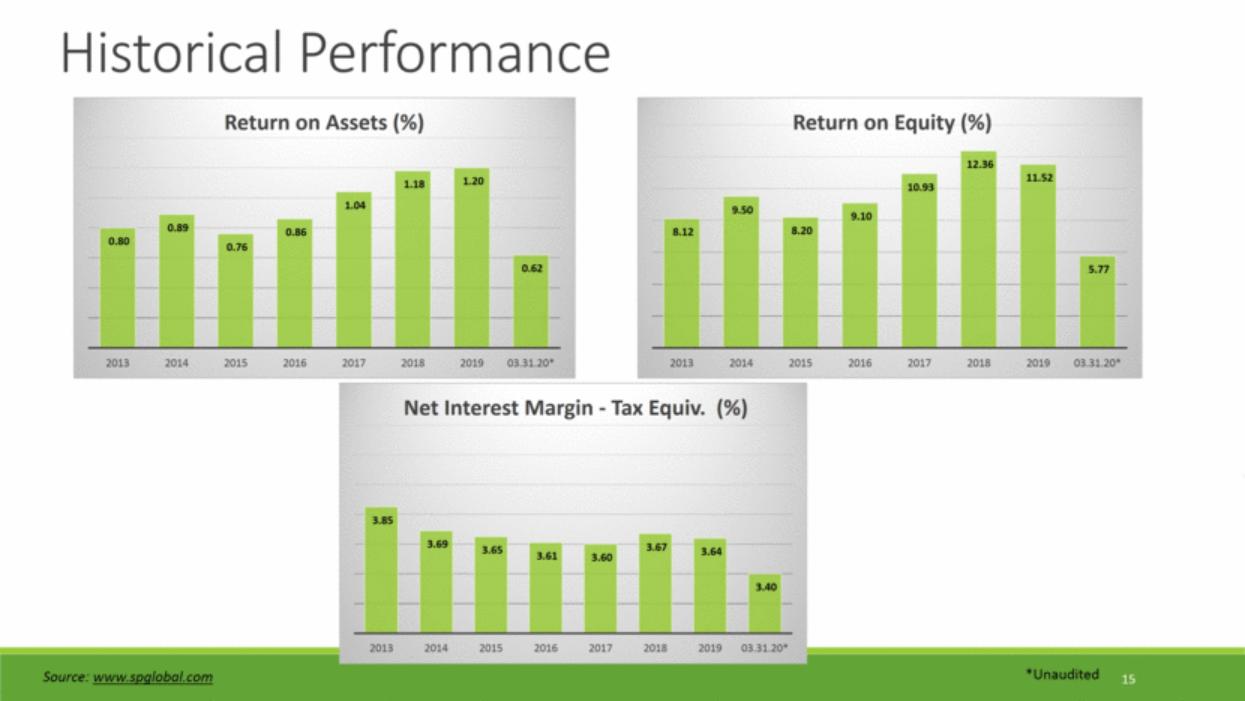
| 15 Historical Performance *Unaudited Source: www.spglobal.com 0.80 0.89 0.76 0.86 1.04 1.18 1.20 0.62 2013 2014 2015 2016 2017 2018 2019 03.31.20* Return on Assets (%) 8.12 9.50 8.20 9.10 10.93 12.36 11.52 5.77 2013 2014 2015 2016 2017 2018 2019 03.31.20* Return on Equity (%) 3.85 3.69 3.65 3.61 3.60 3.67 3.64 3.40 2013 2014 2015 2016 2017 2018 2019 03.31.20* Net Interest Margin - Tax Equiv. (%) |
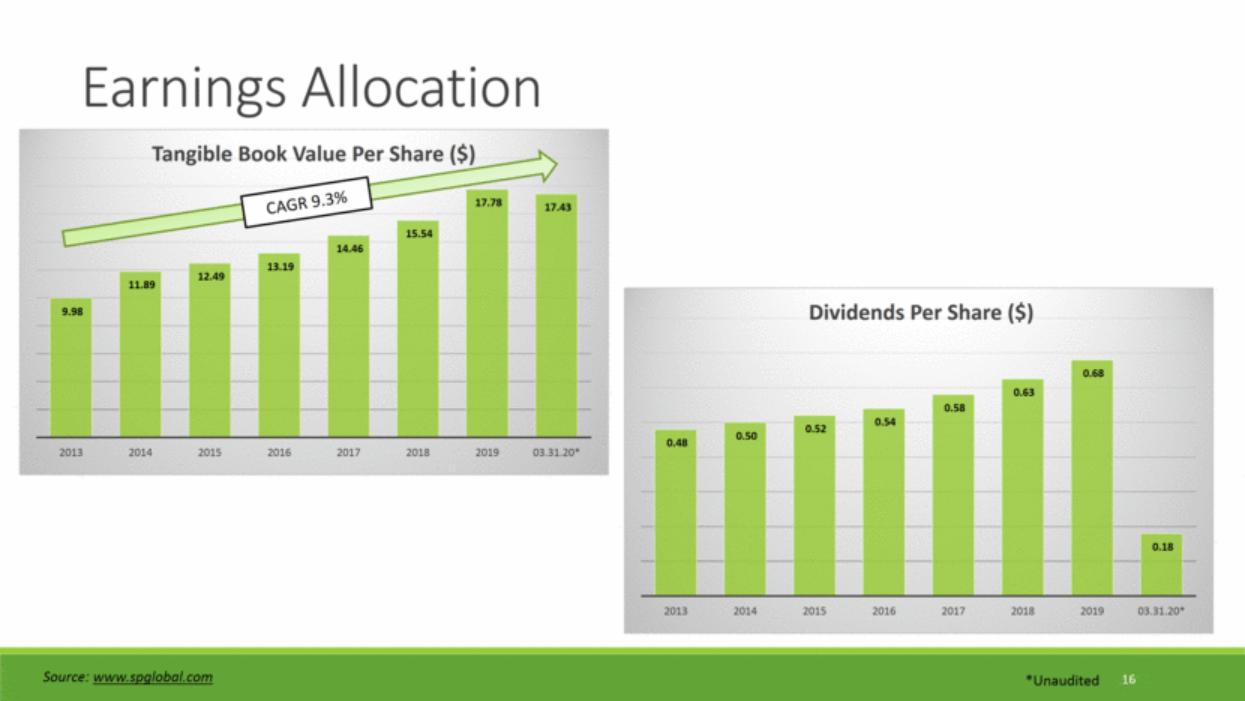
| 16 Earnings Allocation *Unaudited Source: www.spglobal.com CAGR 9.3% 0.48 0.50 0.52 0.54 0.58 0.63 0.68 0.18 2013 2014 2015 2016 2017 2018 2019 03.31.20* Dividends Per Share ($) 9.98 11.89 12.49 13.19 14.46 15.54 17.78 17.43 2013 2014 2015 2016 2017 2018 2019 03.31.20* Tangible Book Value Per Share ($) |
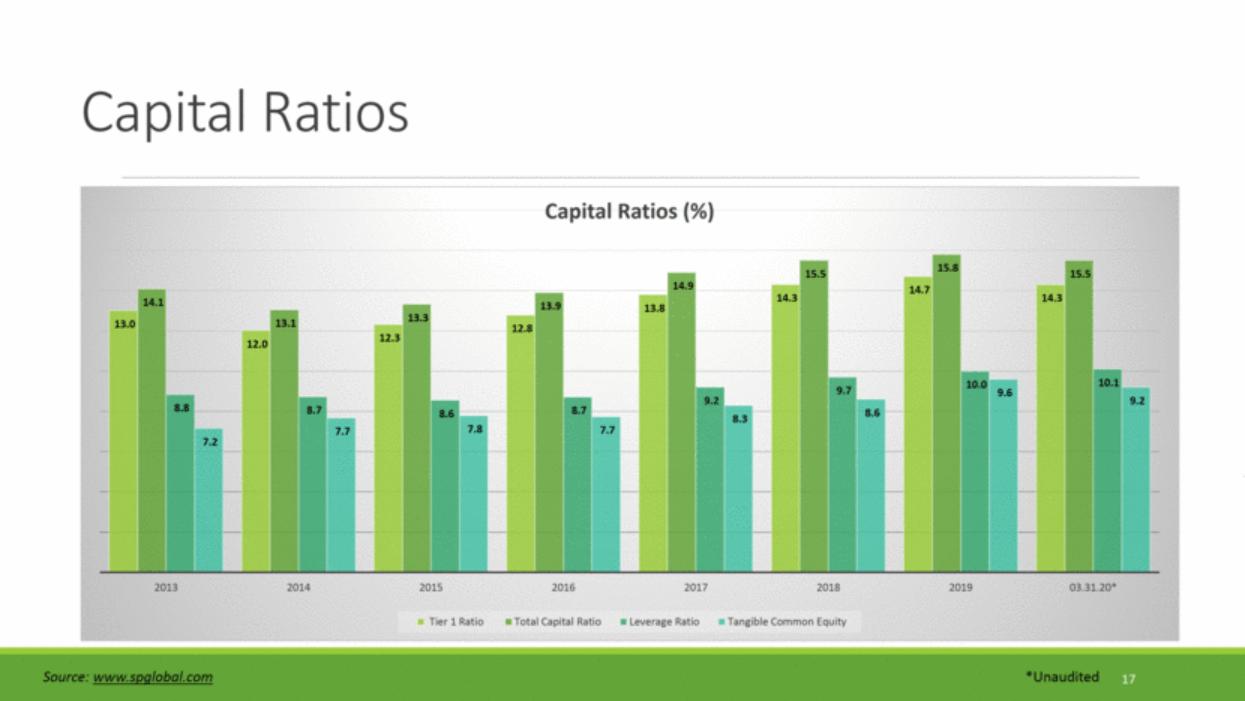
| Capital Ratios 17 *Unaudited Source: www.spglobal.com 13.0 12.0 12.3 12.8 13.8 14.3 14.7 14.3 14.1 13.1 13.3 13.9 14.9 15.5 15.8 15.5 8.8 8.7 8.6 8.7 9.2 9.7 10.0 10.1 7.2 7.7 7.8 7.7 8.3 8.6 9.6 9.2 2013 2014 2015 2016 2017 2018 2019 03.31.20* Capital Ratios (%) Tier 1 Ratio Total Capital Ratio Leverage Ratio Tangible Common Equity |
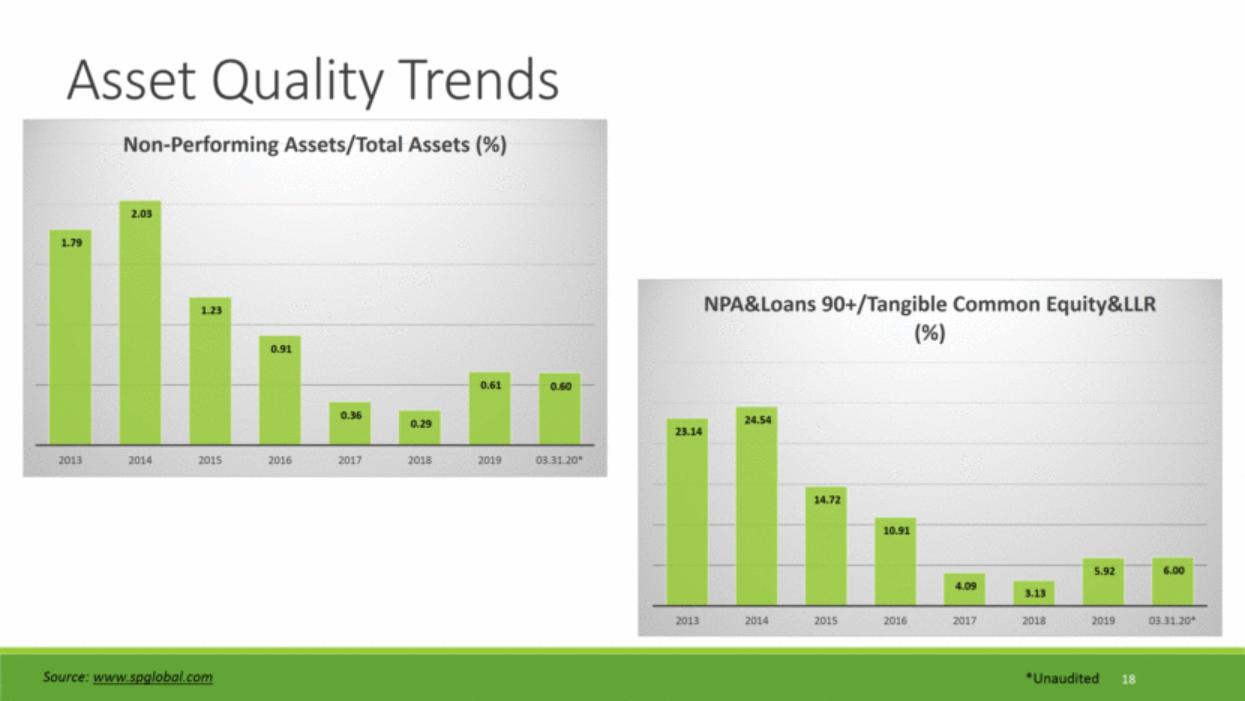
| 18 Asset Quality Trends *Unaudited Source: www.spglobal.com 1.79 2.03 1.23 0.91 0.36 0.29 0.61 0.60 2013 2014 2015 2016 2017 2018 2019 03.31.20* Non - Performing Assets/Total Assets (%) 23.14 24.54 14.72 10.91 4.09 3.13 5.92 6.00 2013 2014 2015 2016 2017 2018 2019 03.31.20* NPA&Loans 90+/Tangible Common Equity&LLR (%) |
| Kentucky Bancshares, Inc. Trading Symbol: KTYB |