Attached files
| file | filename |
|---|---|
| EX-99.2 - EXHIBIT 99.2 - Extraction Oil & Gas, Inc. | tm2021962d1_ex99-2.htm |
| EX-10.2 - EXHIBIT 10.2 - Extraction Oil & Gas, Inc. | tm2021962d1_ex10-2.htm |
| EX-10.1 - EXHIBIT 10.1 - Extraction Oil & Gas, Inc. | tm2021962d1_ex10-1.htm |
| 8-K - FORM 8-K - Extraction Oil & Gas, Inc. | tm2021962-1_8k.htm |
Exhibit 99.1
M a y 2 4 2 0 2 0 OVERVIEW OF UPDA BUSINESS PLAN ASSUMPTIONS HIGHLY CONFIDENTIAL – SUBJECT TO TERMS OF CONFIDENTIALITY AGREEMENTS – SUBJECT TO SUBSTANTIAL REVISION
Important Notice to Recipients THIS CONFIDENTIAL PRESENTATION CONTAINS MATERIAL NON - PUBLIC INFORMATION CONCERNING EXTRACTION OIL & GAS, INC. (“EXTRACTION”) ITS AFFILIATES, OR THEIR RESPECTIVE SECURITIES (COLLECTIVELY, “COMPANY SECURITIES”). BY ACCEPTING THIS CONFIDENTIAL PRESENTATION, YOU AGREE TO USE ANY SUCH INFORMATION (AND TO REFRAIN FROM TRADING IN COMPANY SECURITIES, AS APPROPRIATE) IN ACCORDANCE WITH THE CONFIDENTIALITY AGREEMENT THAT YOU HAVE ENTERED INTO WITH EXTRACTION, YOUR COMPLIANCE POLICIES AND APPLICABLE LAW, INCLUDING FEDERAL AND STATE SECURITIES LAWS. You should consult with your advisors to the extent you deem appropriate in connection with the information contained in this presentation. We make no representation as to the adequacy or appropriateness of the information contained herein for your purposes. We will have no duty to update or supplement this presentation. This presentation is being furnished on the understanding that (i) it will be kept strictly confidential, including in accordance with the confidentiality agreement that you have entered into with Extraction, (ii) any reliance you or your representatives choose to place on the information contained herein is a matter of your respective judgments and at your own respective risks and (iii) neither Extraction nor its advisors or other representatives will have any liability to you or your representatives relating to the information contained in this presentation. This presentation contains statements that Extraction believes to be “forward - looking statements” within the meaning of Section 27A of the Securities Act of 1933 and Section 21E of the Securities Exchange Act of 1934. All statements other than historical facts, including, without limitation, statements regarding our future financial position, business strategy, projected revenues, earnings, costs, capital expenditures and debt levels, and plans and objectives of management for future operations, are forward - looking statements. Such forward - looking statements are subject to risks and uncertainties that could cause actual results to differ materially from those expressed in, or implied by, such statements. These risks and uncertainties include, but are not limited to: declines in, or extended periods of low, oil, NGL or natural gas prices; Extraction’s level of success in exploration, development and production activities; risks related to Extraction’s level of indebtedness, ability to comply with debt covenants and periodic redeterminations of the borrowing base under Extraction’s credit agreement and Extraction’s ability to generate sufficient cash flow from operations to service its indebtedness; the ability to generate sufficient cash flows from operations to meet the internally funded portion of Extraction’s capital expenditures budget; the ability to obtain external capital to finance exploration and development operations; the impact of negative shifts in investor sentiment towards the oil and gas industry; impacts resulting from the allocation of resources among Extraction’s strategic opportunities; the geographic concentration of Extraction’s operations; impacts to financial statements as a result of impairment write - downs and other cash and noncash charges; federal and state initiatives relating to the regulation of hydraulic fracturing and air emissions; revisions to reserve estimates as a result of changes in commodity prices, regulation and other factors; inaccuracies of Extraction’s reserve estimates or assumptions underlying them; the timing of exploration and development expenditures; risks relating to decreases in Extraction’s credit rating; the inability to access oil and gas markets due to market conditions or operational impediments; market availability of, and risks associated with, transport of oil and gas; the ability to successfully complete asset dispositions and the risks related thereto; the ability to drill producing wells on undeveloped acreage prior to its lease expiration; shortages of or delays in obtaining qualified personnel or equipment, including drilling rigs and completion services; weakened differentials impacting the price Extraction receives for oil and natural gas; risks relating to any unforeseen liabilities; the impacts of hedging on Extraction’s results of operations; adverse weather conditions that may negatively impact development or production activities; uninsured or underinsured losses resulting from Extraction’s oil and gas operations; lack of control over non - operated properties; failure of Extraction’s properties to yield oil or gas in commercially viable quantities; the impact and costs of compliance with laws and regulations governing Extraction’s oil and gas operations; the potential impact of changes in laws that could have a negative effect on the oil and gas industry; impacts of local regulations, climate change issues, negative public perception of Extraction’s industry and corporate governance standards; the ability to replace Extraction’s oil and natural gas reserves; negative impacts from litigation and legal proceedings; unforeseen underperformance of or liabilities associated with acquired properties or other strategic partnerships or investments; competition in the oil and gas industry; any loss of Extraction’s senior management or technical personnel; cybersecurity attacks or failures of Extraction’s telecommunication and other information technology infrastructure; and other risks described under the caption “Risk Factors” in Item 1A of Extraction’s Annual Report on Form 10 - K for the period ended December 31, 2019 and any subsequent reports on Form 10 - Q. Extraction assumes no obligation, and disclaims any duty, to update the forward - looking statements in this presentation. This presentation refers to Adjusted EBITDA and Adjusted EBITDAX, which are non - GAAP measures that Extraction believes are helpful in evaluating the performance of its business. 1 HIGHLY CONFIDENTIAL – SUBJECT TO TERMS OF CONFIDENTIALITY AGREEMENTS – SUBJECT TO SUBSTANTIAL REVISION
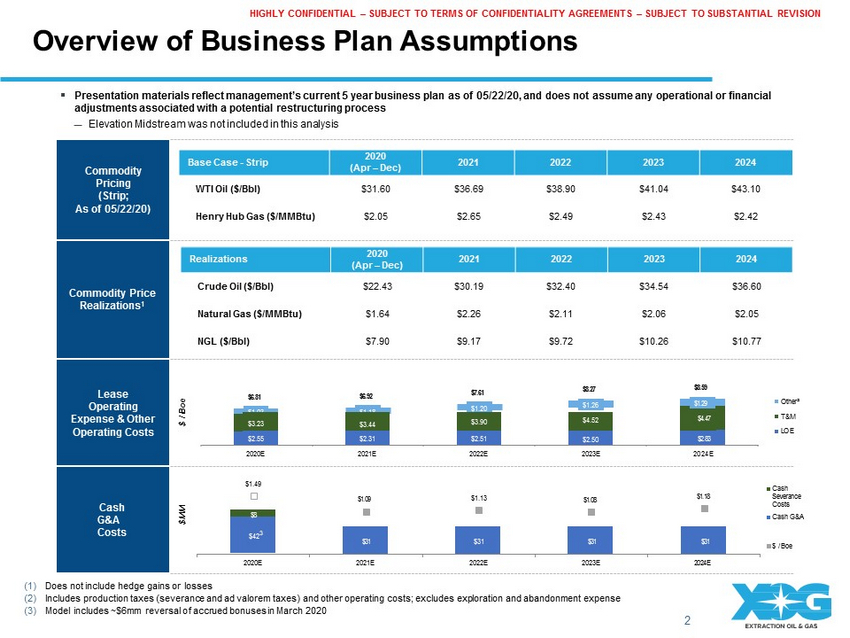
$31 $31 $31 $31 $1 . 0 9 $1 . 1 3 $1 . 0 8 $1 . 1 8 2 0 2 4 E Cash S e v e r a n c e Costs Cash G&A $ / Boe 2020E 2021E 2022E 2023E (1) Does not include hedge gains or losses (2) Includes production taxes (severance and ad valorem taxes) and other operating costs; excludes exploration and abandonment expense (3) Model includes ~$6mm reversal of accrued bonuses in March 2020 Commod ity Pricing (Strip; As of 05/22/20) Commodity Price Realizations 1 Lease Operati ng Expense & Other Operating Costs Cash G&A Costs Overview of Business Plan Assumptions ▪ Presentation materials reflect management’s current 5 year business plan as of 05/22/20, and does not assume any operational or financial adjustments associated with a potential restructuring process ; Elevation Midstream was not included in this analysis 2 Base Case - Strip 2020 (Apr – Dec) 2021 2022 2023 2024 WTI Oil ($/Bbl) $31.60 $36.69 $38.90 $41.04 $43.10 Henry Hub Gas ($/MMBtu) $2.05 $2.65 $2.49 $2.43 $2.42 Realizations 2020 (Apr – Dec) 2021 2022 2023 2024 Crude Oil ($/Bbl) $22.43 $30.19 $32.40 $34 . 5 4 $36.60 Natural Gas ($/MMBtu) $1.64 $2.26 $2.11 $2 . 0 6 $2.05 NGL ($/Bbl) $7.90 $9.17 $9.72 $10 . 2 6 $10.77 HIGHLY CONFIDENTIAL – SUBJECT TO TERMS OF CONFIDENTIALITY AGREEMENTS – SUBJECT TO SUBSTANTIAL REVISION $ M M $ / Boe $8 $42 3 $1.03 $1.18 $1.20 $1 . 2 6 $1 . 2 9 $6 . 8 1 $6 . 9 2 $7 . 6 1 $8 . 2 7 $8 . 5 9 $3.23 $3.44 $3.90 $4.52 $4 . 4 7 $2.55 $2.31 $2.51 $2.50 $2 . 8 3 2020E 2021E 2022E 2023E 2 0 2 4 E $1.49 O t h e r ² T&M L O E
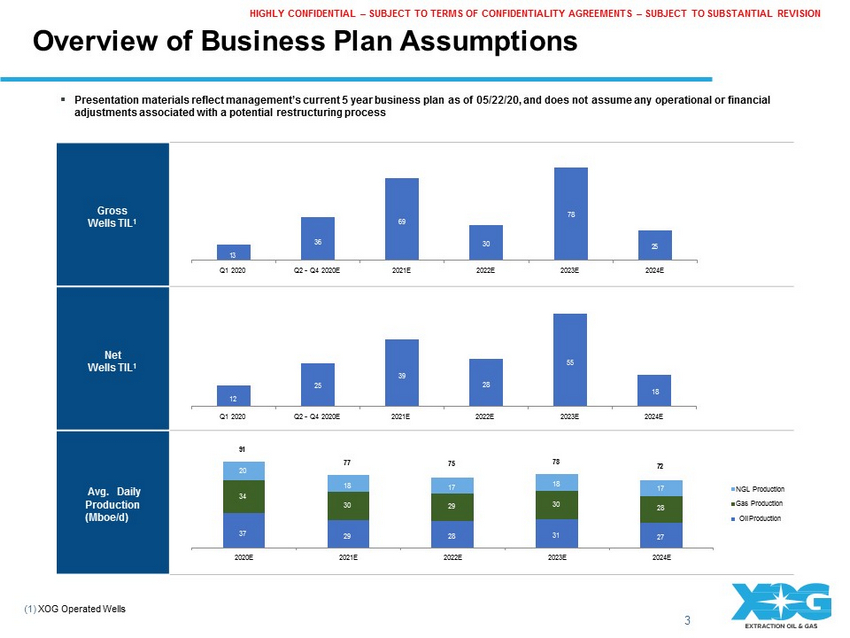
Overview of Business Plan Assumptions 3 HIGHLY CONFIDENTIAL – SUBJECT TO TERMS OF CONFIDENTIALITY AGREEMENTS – SUBJECT TO SUBSTANTIAL REVISION (1) XOG Operated Wells ▪ Presentation materials reflect management’s current 5 year business plan as of 05/22/20, and does not assume any operational or financial adjustments associated with a potential restructuring process Gross Wells TIL 1 78 69 36 30 25 13 Q1 2020 Q2 - Q4 2020E 2021E 2022E 2023E 2024E Net Wells TIL 1 55 39 25 28 18 12 Q1 2020 Q2 - Q4 2020E 2021E 2022E 2023E 2024E Avg . Daily Production (Mboe/d) 91 77 75 78 72 20 18 17 18 17 NGL Production 34 30 29 30 28 Gas Production Oil Production 37 29 28 31 27 2020E 2021E 2022E 2023E 2024E
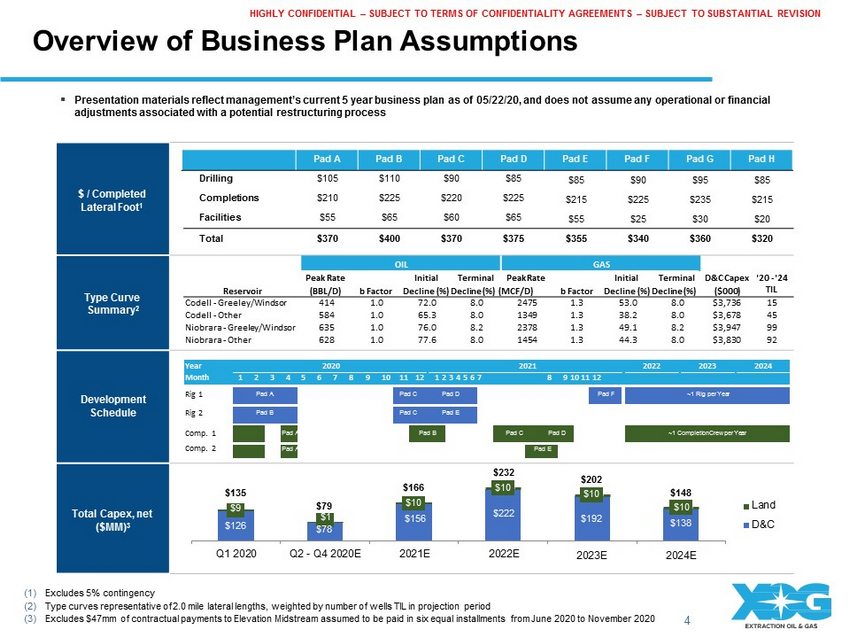
Pad A Pad B Pad C Pad D Pad E Pad F Pad G Pad H Overview of Business Plan Assumptions 4 (1) Excludes 5% contingency (2) Type curves representative of 2.0 mile lateral lengths, weighted by number of wells TIL in projection period (3) Excludes $47mm of contractual payments to Elevation Midstream assumed to be paid in six equal installments from June 2020 to November 2020 HIGHLY CONFIDENTIAL – SUBJECT TO TERMS OF CONFIDENTIALITY AGREEMENTS – SUBJECT TO SUBSTANTIAL REVISION ▪ Presentation materials reflect management’s current 5 year business plan as of 05/22/20, and does not assume any operational or financial adjustments associated with a potential restructuring process $ / Completed Lateral Foot 1 Drilling $ 105 $ 110 $ 90 $ 85 C ompl et ions $ 21 0 $ 22 5 $ 22 0 $ 225 Facilities $ 55 $ 65 $ 60 $ 65 $85 $90 $95 $215 $225 $235 $55 $25 $30 $85 $215 $20 Total $370 $400 $370 $375 $355 $340 $360 $320 Type Curve Summary 2 OIL GAS Peak Rate Initial Terminal Peak Rate Reservoir (BBL/D) b Factor Decline (%) Decline (%) (MCF/D) Initial Terminal b Factor Decline (%) Decline (%) D&C Capex ($000) '20 - '24 TIL Codell - Greeley/Windsor 414 1.0 72.0 8.0 2475 Codell - Other 584 1.0 65.3 8.0 1349 Niobrara - Greeley/Windsor 635 1.0 76.0 8.2 2378 Niobrara - Other 628 1.0 77.6 8.0 1454 1.3 53.0 8.0 1.3 38.2 8.0 1.3 49.1 8.2 1.3 44.3 8.0 $3,736 $3,678 $3,947 $3,830 15 45 99 92 Year 2020 2021 2022 2023 2024 Month 1 2 3 4 5 6 7 8 9 10 11 12 1 2 3 4 5 6 7 8 9 10 11 12 Development Rig 1 Pad A Pad C Pad D Pad F ~1 Rig per Year Schedule Rig 2 Pad B Pad C Pad E Comp. 1 Pad A Pad B Pad C Pad D ~1 Completion Crew per Year Comp. 2 Pad A Pad E Total Capex, net ($MM) 3 $232 $135 $166 $10 $9 $79 $10 $ 1 $15 6 $222 $126 $78 Q 1 20 2 0 Q 2 - Q 4 2 0 20 E 2 0 21 E 2 0 22 E $202 $10 $148 $10 $192 $138 2 0 23 E 2 0 24 E L a n d D & C
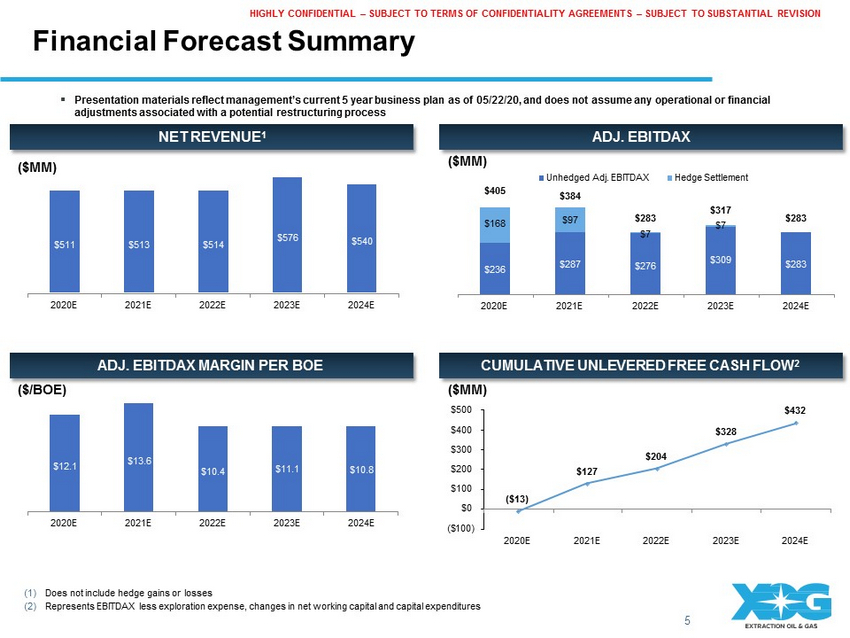
5 Financial Forecast Summary CUMULATIVE UNLEVERED FREE CASH FLOW 2 ADJ. EBITDAX MARGIN PER BOE ($M M ) ($/BOE) ($M M ) (1) Does not include hedge gains or losses (2) Represents EBITDAX less exploration expense, changes in net working capital and capital expenditures ($M M ) HIGHLY CONFIDENTIAL – SUBJECT TO TERMS OF CONFIDENTIALITY AGREEMENTS – SUBJECT TO SUBSTANTIAL REVISION ▪ Presentation materials reflect management’s current 5 year business plan as of 05/22/20, and does not assume any operational or financial adjustments associated with a potential restructuring process NET REVENUE 1 ADJ. EBITDAX $511 $513 $514 $576 $540 2020E 2021E 2022E 2023E 2024E $236 $287 $309 $283 $168 $97 $7 $276 $405 $283 $317 $7 $283 2020E 2021E 2022E 2023E 2024E Unhedged Adj. EBITDAX $384 Hedge Settlement $12.1 $13.6 $10.4 $11.1 $10.8 2020E 2021E 2022E 2023E 2024E ( $13) $127 $204 $328 $432 $500 $400 $300 $200 $100 $0 ( $ 100) 2020E 2021E 2022E 2023E 2024E
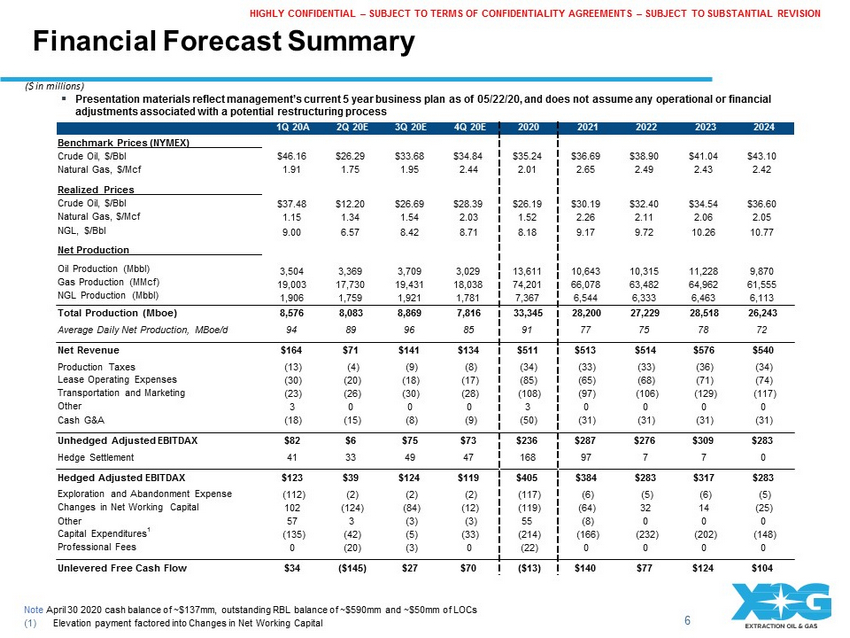
Financial Forecast Summary Note April 30 2020 cash balance of ~$137mm, outstanding RBL balance of ~$590mm and ~$50mm of LOCs (1) Elevation payment factored into Changes in Net Working Capital 6 HIGHLY CONFIDENTIAL – SUBJECT TO TERMS OF CONFIDENTIALITY AGREEMENTS – SUBJECT TO SUBSTANTIAL REVISION ($ in millions) ▪ Presentation materials reflect management’s current 5 year business plan as of 05/22/20, and does not assume any operational or financial adjustments associated with a potential restructuring process 1 Q 20 A 2 Q 20 E 3 Q 20 E 4 Q 20 E 202 0 202 1 202 2 202 3 2024 $46 . 1 6 1.91 $26 . 2 9 1.75 $33 . 6 8 1.95 $34 . 8 4 2.44 $35 . 2 4 2.01 $36 . 6 9 2.65 $38 . 9 0 2.49 $41 . 0 4 2.43 $43 . 1 0 2.42 $37 . 4 8 1.15 9.00 $12 . 2 0 1.34 6.57 $26 . 6 9 1.54 8.42 $28 . 3 9 2.03 8.71 $26 . 1 9 1.52 8.18 $30 . 1 9 2.26 9.17 $32 . 4 0 2.11 9.72 $34 . 5 4 2.06 10.26 $36 . 6 0 2.05 10.77 Benchmark Prices (NYMEX) Crude Oil, $/Bbl Natural Gas, $/Mcf Realized Prices Crude Oil, $/Bbl Natural Gas, $/Mcf NGL, $/Bbl Net Production Oil Production (Mbbl) Gas Production (MMcf) NGL Production (Mbbl) 3,504 19 , 00 3 1,906 3,369 17 , 73 0 1,759 3,709 19 , 43 1 1,921 3,029 18 , 03 8 1,781 13 , 61 1 74 , 20 1 7,367 10 , 64 3 66 , 07 8 6,544 10 , 31 5 63 , 48 2 6,333 11 , 22 8 64 , 96 2 6,463 9,870 61 , 55 5 6,113 Total Production (Mboe) Average Daily Net Production, MBoe/d 8 , 57 6 94 8 , 08 3 89 8 , 86 9 96 7 , 81 6 85 33 , 34 5 91 28 , 20 0 77 27 , 22 9 75 28 , 51 8 78 26 , 24 3 72 Net Revenue Production Taxes Lease Operating Expenses Transportation and Marketing Other Cash G&A $164 (13) (30) (23) 3 (18) $71 (4) ( 20 ) ( 26 ) 0 ( 15 ) $141 (9) (18) (30) 0 (8) $134 (8) (17) (28) 0 (9) $511 (34) (85) ( 108 ) 3 (50) $513 (33) (65) (97) 0 (31) $514 (33) (68) ( 106 ) 0 (31) $576 (36) (71) ( 129 ) 0 (31) $540 (34) (74) ( 117 ) 0 (31) Unhedged Adjusted EBITDAX Hedge Settlement $82 41 $6 33 $75 49 $73 47 $236 168 $287 97 $276 7 $309 7 $283 0 Hedged Adjusted EBITDAX Exploration and Abandonment Expense Changes in Net Working Capital Other Capital Expenditures 1 Professional Fees $123 ( 112 ) 102 57 ( 135 ) 0 $39 (2) ( 124 ) 3 (42) (20) $124 (2) (84) (3) (5) (3) $119 (2) (12) (3) (33) 0 $405 ( 117 ) ( 119 ) 55 ( 214 ) (22) $384 (6) (64) (8) ( 166 ) 0 $283 (5) 32 0 ( 232 ) 0 $317 (6) 14 0 ( 202 ) 0 $283 (5) (25) 0 ( 148 ) 0 Unlevered Free Cash Flow $34 ($145) $27 $70 ( $13 ) $140 $77 $124 $104
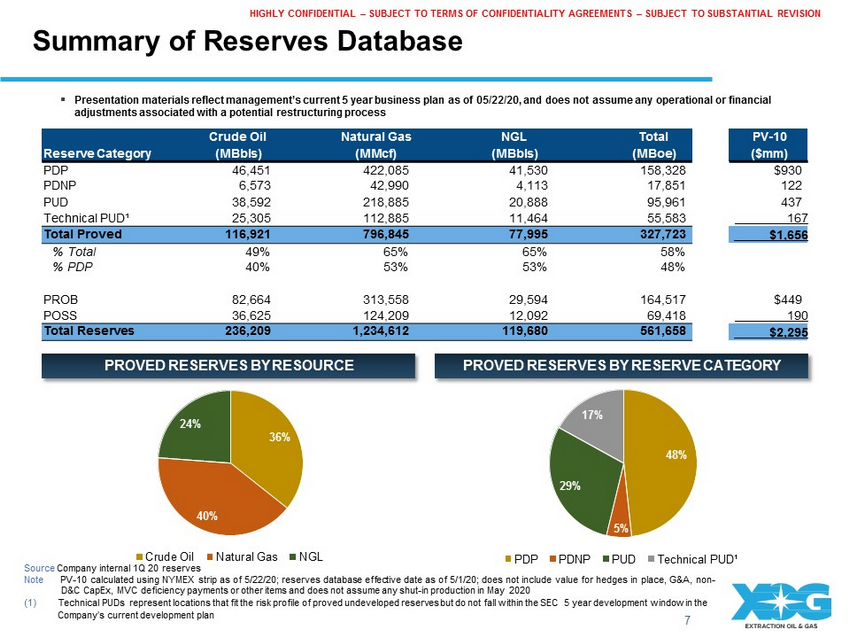
Summary of Reserves Database 7 PROVED RESERVES BY RESERVE CATEGORY PROVED RESERVES BY RESOURCE Note PV - 10 calculated using NYMEX strip as of 5/22/20; reserves database effective date as of 5/1/20; does not include value for hedges in place, G&A, non - D&C CapEx, MVC deficiency payments or other items and does not assume any shut - in production in May 2020 (1) Technical PUDs represent locations that fit the risk profile of proved undeveloped reserves but do not fall within the SEC 5 year development window in the Company’s current development plan ▪ Presentation materials reflect management’s current 5 year business plan as of 05/22/20, and does not assume any operational or financial adjustments associated with a potential restructuring process 36% 40% 24% C r u d e O i l N a t u r a l G a s N G L Source Company internal 1Q 20 reserves 48% 29% 17% 5% PDP PDNP PUD Technical PUD¹ HIGHLY CONFIDENTIAL – SUBJECT TO TERMS OF CONFIDENTIALITY AGREEMENTS – SUBJECT TO SUBSTANTIAL REVISION Reserve Category Crude Oil (MBbls) Natural Gas (MMcf) NGL (MBbls) Total (MBoe) PV - 10 ($mm) PDP 46 , 45 1 422 , 08 5 41 , 53 0 158 , 32 8 $930 PDNP 6 , 57 3 42 , 99 0 4 , 11 3 17 , 85 1 122 PUD 38 , 59 2 218 , 88 5 20 , 88 8 95 , 96 1 437 Technical PUD¹ 25 , 30 5 112 , 88 5 11 , 46 4 55 , 58 3 16 7 Total Proved 116 , 92 1 796 , 84 5 77 , 99 5 327 , 72 3 $1 , 65 6 % Total 49% 65% 65% 58% % PDP 40% 53% 53% 48% PROB 82 , 66 4 313 , 55 8 29 , 59 4 164 , 51 7 $449 POSS 36 , 62 5 124 , 20 9 12 , 09 2 69 , 41 8 19 0 Total Reserves 236 , 20 9 1 , 234 , 61 2 119 , 68 0 561 , 65 8 $2 , 29 5
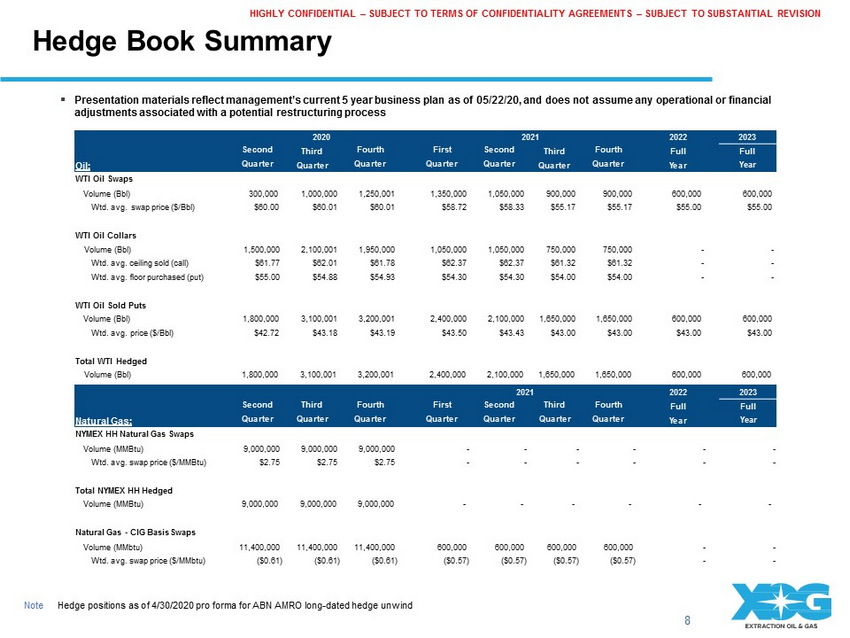
Hedge Book Summary 8 ▪ Presentation materials reflect management’s current 5 year business plan as of 05/22/20, and does not assume any operational or financial adjustments associated with a potential restructuring process Note Hedge positions as of 4/30/2020 pro forma for ABN AMRO long - dated hedge unwind WTI Oil Swaps Volume (Bbl) 300,000 1 , 000 , 00 0 1 , 250 , 00 1 1 , 350 , 00 0 1 , 050 , 00 0 900 , 00 0 900 , 00 0 600,000 600 , 00 0 Wtd. avg. swap price ($/Bbl) $60.00 $60 . 0 1 $60 . 0 1 $58 . 7 2 $58 . 3 3 $55 . 1 7 $55 . 1 7 $55.00 $55 . 0 0 WTI Oil Collars Volume (Bbl) 1 , 500 , 00 0 2 , 100 , 00 1 1 , 950 , 00 0 1 , 050 , 00 0 1 , 050 , 00 0 750 , 00 0 750 , 00 0 - - Wtd. avg. ceiling sold (call) $61 . 7 7 $62 . 0 1 $61 . 7 8 $62 . 3 7 $62 . 3 7 $61 . 3 2 $61 . 3 2 - - Wtd. avg. floor purchased (put) $55 . 0 0 $54 . 8 8 $54 . 9 3 $54 . 3 0 $54 . 3 0 $54 . 0 0 $54 . 0 0 - - WTI Oil Sold Puts Volume (Bbl) 1,800,000 3 , 100 , 00 1 3 , 200 , 00 1 2 , 400 , 00 0 2 , 100 , 00 0 1 , 650 , 00 0 1 , 650 , 00 0 600,000 600 , 00 0 Wtd. avg. price ($/Bbl) $42.72 $43 . 1 8 $43 . 1 9 $43 . 5 0 $43 . 4 3 $43 . 0 0 $43 . 0 0 $43.00 $43 . 0 0 Total WTI Hedged Volume (Bbl) 1,800,000 3,100,001 3,200,001 2,400,000 2,100,000 1,650,000 1,650,000 600 , 00 0 600 , 00 0 NYMEX HH Natural Gas Swaps Volume (MMBtu) 9 , 000 , 00 0 9 , 000 , 00 0 9 , 000 , 00 0 - - - - - - Wtd. avg. swap price ($/MMBtu) $2 . 7 5 $2 . 7 5 $2 . 7 5 - - - - - - Total NYMEX HH Hedged Volume (MMBtu) 9,000,000 9,000,000 9,000,000 - - - - - - Natural Gas - CIG Basis Swaps Volume (MMbtu) 11 , 400 , 00 0 11 , 400 , 00 0 11 , 400 , 00 0 600 , 00 0 600 , 00 0 600 , 00 0 600 , 00 0 - - Wtd. avg. swap price ($/MMbtu) ( $0 . 61 ) ( $0 . 61 ) ( $0 . 61 ) ( $0 . 57 ) ( $0 . 57 ) ( $0 . 57 ) ( $0 . 57 ) - - Oil: S e c ond Q u a r t e r 2020 Third Q u a r t e r Fourth Q u a r t e r First Q u a r t e r S e c ond Q u a r t e r 2021 Third Q u a r t e r Fourth Q u a r t e r 2022 Full Y ea r 2023 Full Year Natural Gas: S e c ond Q u a r t e r Third Q u a r t e r Fourth Q u a r t e r First Q u a r t e r S e c ond Q u a r t e r 2021 Third Q u a r t e r Fourth Q u a r t e r 2022 Full Y ea r 2023 Full Year HIGHLY CONFIDENTIAL – SUBJECT TO TERMS OF CONFIDENTIALITY AGREEMENTS – SUBJECT TO SUBSTANTIAL REVISION
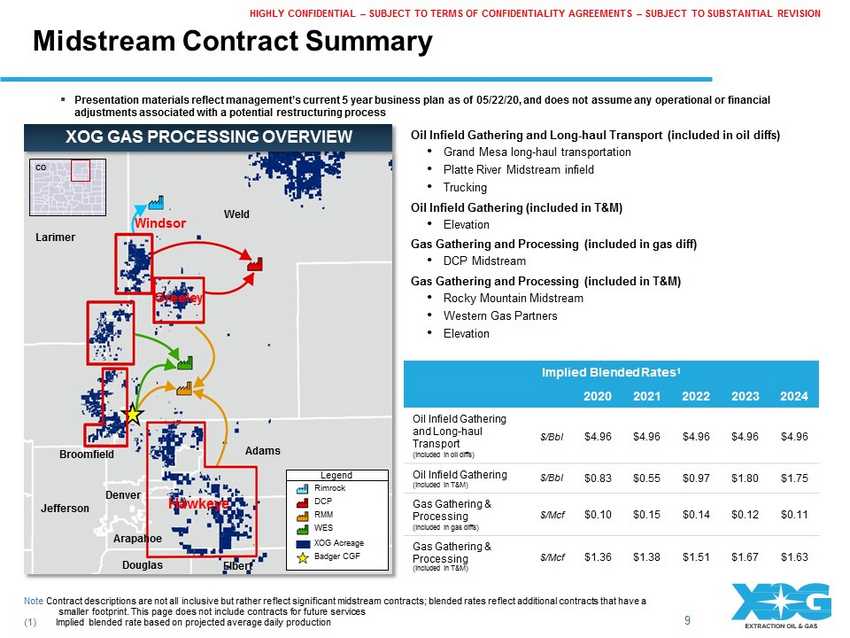
Midstream Contract Summary 9 HIGHLY CONFIDENTIAL – SUBJECT TO TERMS OF CONFIDENTIALITY AGREEMENTS – SUBJECT TO SUBSTANTIAL REVISION ▪ Presentation materials reflect management’s current 5 year business plan as of 05/22/20, and does not assume any operational or financial adjustments associated with a potential restructuring process CO Larimer W eld A dams Den v er Douglas Br oomfield Jefferson Ha w k e y e Legend Elbert Rimrock DCP R M M W ES XOG Acreage Badger CGF Greeley Arapahoe W i n d s o r XOG GAS PROCESSING OVERVIEW Oil Infield Gathering and Long - haul Transport (included in oil diffs) • Grand Mesa long - haul transportation • Platte River Midstream infield • Trucking Oil Infield Gathering (included in T&M) • Elevation Gas Gathering and Processing (included in gas diff) • DCP Midstream Gas Gathering and Processing (included in T&M) • Rocky Mountain Midstream • Western Gas Partners • Elevation Implied Blended Rates 1 2020 2021 2022 2023 2024 Oil Infield Gathering and Long - haul Transport (included in oil diffs) $ /B b l $4.96 $4.96 $4.96 $4.96 $4.96 Oil Infield Gathering (included in T&M) $ /B b l $0.83 $0.55 $0.97 $1.80 $1.75 Gas Gathering & Processing (included in gas diffs) $ /M c f $0.10 $0.15 $0.14 $0.12 $0.11 Gas Gathering & Processing (included in T&M) $ /M c f $1.36 $1.38 $1.51 $1.67 $1.63 Note Contract descriptions are not all inclusive but rather reflect significant midstream contracts; blended rates reflect additional contracts that have a smaller footprint. This page does not include contracts for future services (1) Implied blended rate based on projected average daily production
Ill