Attached files
| file | filename |
|---|---|
| 8-K - FORM 8-K - Schrodinger, Inc. | d926963d8k.htm |
Exhibit 99.1

SCHRÖDINGER
Transforming Discovery of
Therapeutics and Materials
Cautionary Note and Disclaimer
This presentation
contains certain “forward-looking statements” within the meaning of the U.S. Private Securities Litigation Reform Act of 1995 that involve substantial risks and uncertainties. All statements, other than statements of historical fact,
contained in this presentation, including, without limitation, statements regarding the potential advantages of our physics-based computational platform, our strategic plans to accelerate the growth of our software business, our research and
development efforts for our internal drug discovery programs and our computational platform, the initiation, timing, progress, and results of our internal drug discovery programs or the drug discovery programs of our collaborators, our plans to
discover and develop product candidates and to maximize their commercial potential by advancing such product candidates ourselves or in collaboration with others, our plans to leverage the synergies between our businesses, our expectations regarding
our ability to fund our operating expenses and capital expenditure requirements with our cash, cash equivalents, and marketable securities, our marketing capabilities and strategy, and our expectations related to the key drivers of our performance,
are forward-looking statements. The words “anticipate,” “believe,” “contemplate,” “continue,” “could,” “estimate,” “expect,” “intend,” “may,”
“might,” “plan,” “potential,” “predict,” “project,” “should,” “target,” “will,” “would” or the negative of these words or other similar expressions are
intended to identify forward-looking statements, although not all forward-looking statements contain these identifying words.
These forward-looking statements
reflect our current views about our plans, intentions, expectations, strategies and prospects, which are based on the information currently available to us and on assumptions we have made. Actual results may differ materially from those described in
the forward-looking statements and are subject to a variety of assumptions, uncertainties, risks and factors that are beyond our control, including those risks detailed under the caption “Risk Factors” and elsewhere in our Securities and
Exchange Commission filings and reports, including the Quarterly Report on Form 10-Q for the quarter ended March 31, 2020, filed with the Securities and Exchange Commission on May 13, 2020, as well
as future filings and reports by us. Except as required by law, we undertake no duty or obligation to update any forward-looking statements contained in this presentation as a result of new information, future events, changes in expectations or
otherwise.
This presentation includes statistical and other industry and market data that we obtained from industry publications and research, surveys, and studies
conducted by third parties as well as our own estimates of potential market opportunities. All of the market data used in this presentation involves a number of assumptions and limitations, and you are cautioned not to give undue weight to such
data. Neither Schrödinger nor its affiliates, advisors or representatives makes any representation as to the accuracy or completeness of that data or undertakes to update such data after the date of this presentation.
2
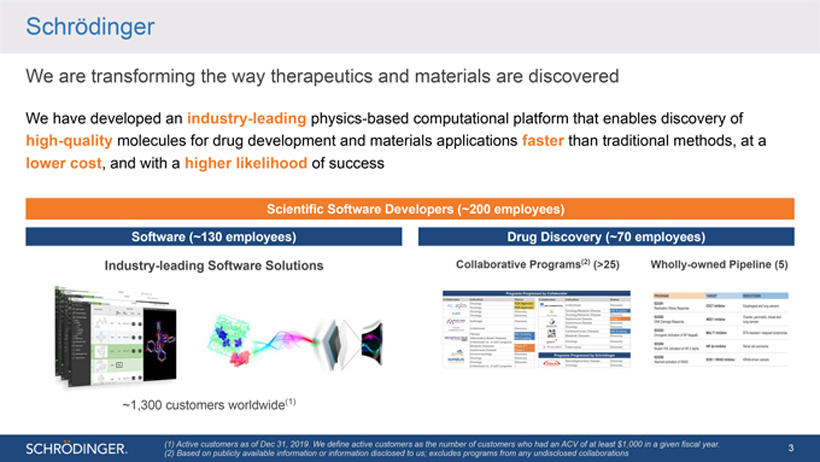
Schrödinger
We are transforming the way
therapeutics and materials are discovered
We have developed an industry-leading physics-based computational platform that enables discovery of high-quality
molecules for drug development and materials applications faster than traditional methods, at a lower cost, and with a higher likelihood of success
Scientific
Software Developers (~200 employees)
Software (~130 employees)
Industry-leading Software Solutions
~1,300 customers worldwide(1)
Drug Discovery (~70 employees)
Collaborative Programs(2) (>25)
Wholly-owned Pipeline (5)
(1) Active customers as of Dec 31, 2019. We define active customers
as the number of customers who had an ACV of at least $1,000 in a given fiscal year. (2) Based on publicly available information or information disclosed to us; excludes programs from any undisclosed collaborations
3
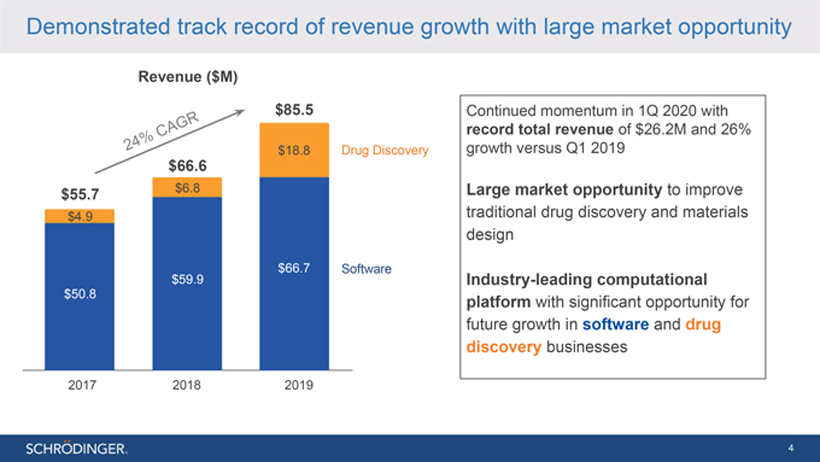
Demonstrated track record of revenue growth with large market opportunity
Revenue ($M)
Continued momentum in 1Q 2020 with record total revenue of $26.2M and 26% growth
versus Q1 2019
Large market opportunity to improve traditional drug discovery and materials design
Industry-leading computational platform with significant opportunity for future growth in software and drug discovery businesses
4
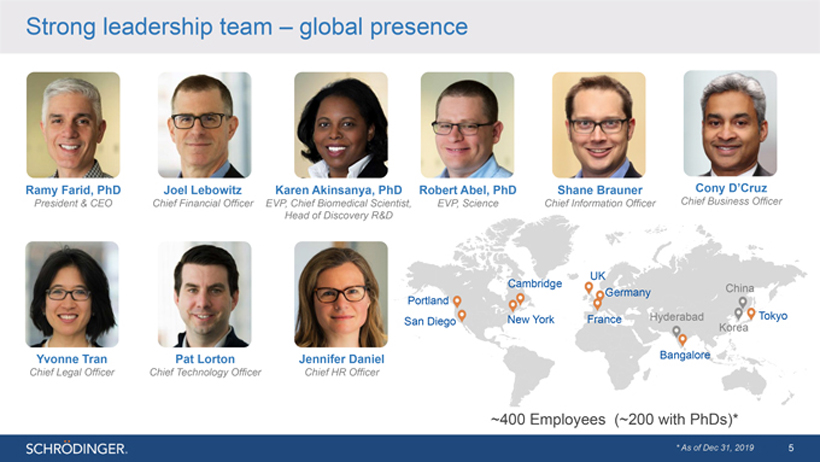
Strong leadership team – global presence
Ramy
Farid, PhD
President & CEO
Joel Lebowitz
Chief Financial Officer
Karen Akinsanya, PhD
EVP, Chief Biomedical Scientist, Head of Discovery R&D
Robert Abel, PhD
EVP, Science
Shane Brauner
Chief Information Officer
Cony D’Cruz
Chief Business Officer
Yvonne Tran
Chief Legal Officer
Pat Lorton
Chief Technology Officer
Jennifer Daniel
Chief HR Officer
~400 Employees (~200 with PhDs)*
* As of Dec 31, 2019 5
5
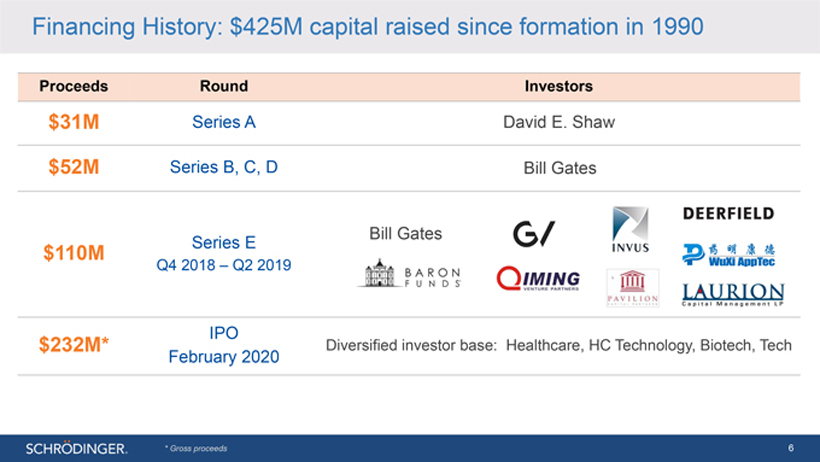
Financing History: $425M capital raised since formation in 1990
Proceeds
$31M
$52M
$110M
$232M*
Round
Series A
Series B, C, D
Series E
Q4 2018 – Q2 2019
IPO February 2020
Investors
David E. Shaw
Bill Gates
Diversified investor base: Healthcare, HC Technology, Biotech, Tech
* Gross proceeds 6
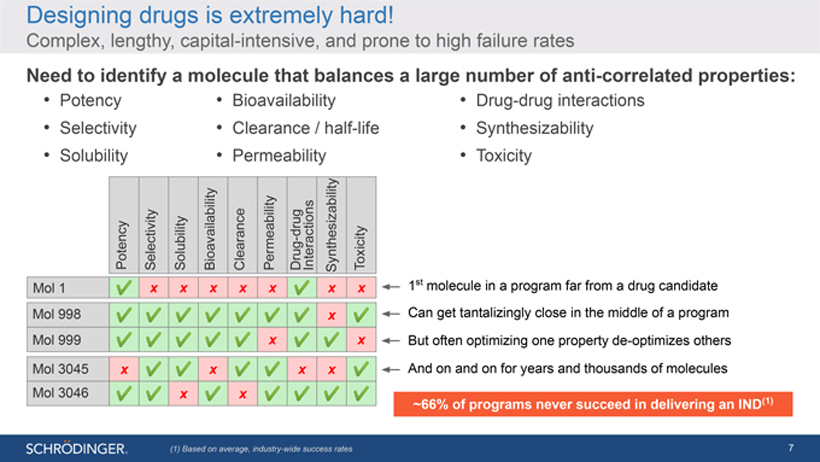
Designing drugs is extremely hard!
Complex,
lengthy, capital-intensive, and prone to high failure rates
Need to identify a molecule that balances a large number of anti-correlated properties:
Potency Selectivity Solubility
Bioavailability
Clearance / half-life
Permeability
Drug-drug interactions Synthesizability
Toxicity
Potency Selectivity Solubility Bioavailability Clearance Permeability
Drug-drug Interactions
Synthesizability
Toxicity
Mol 1 Mol 998 Mol 999 Mol 3045 Mol 3046
1st molecule in a program far from a drug candidate
Can get tantalizingly close in the middle of a program But often optimizing one property de-optimizes others And on and on for years and thousands of molecules
~66% of programs never succeed in delivering an IND(1)
(1) Based on average, industry-wide
success rates 7
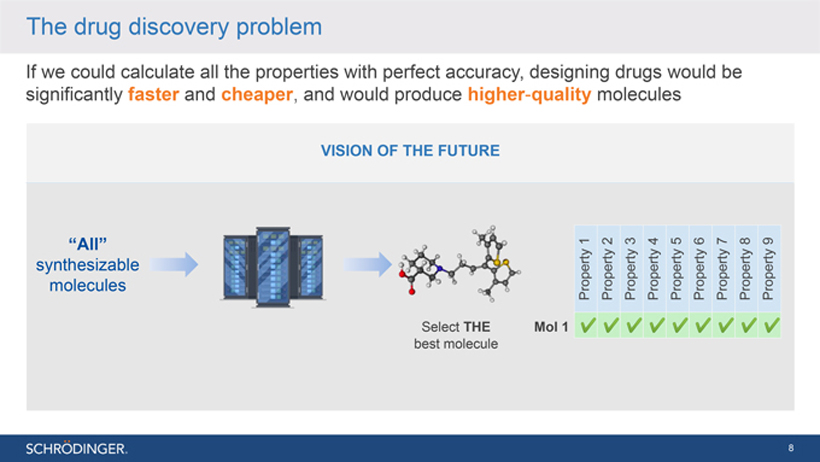
The drug discovery problem
If we could calculate
all the properties with perfect accuracy, designing drugs would be significantly faster and cheaper, and would produce higher-quality molecules
VISION OF THE
FUTURE
“All”
synthesizable molecules
Select THE best molecule
Property 1 Property 2 Property 3 Property 4 Property 5 Property 6
Property 7 Property 8 Property 9
Mol 1
8
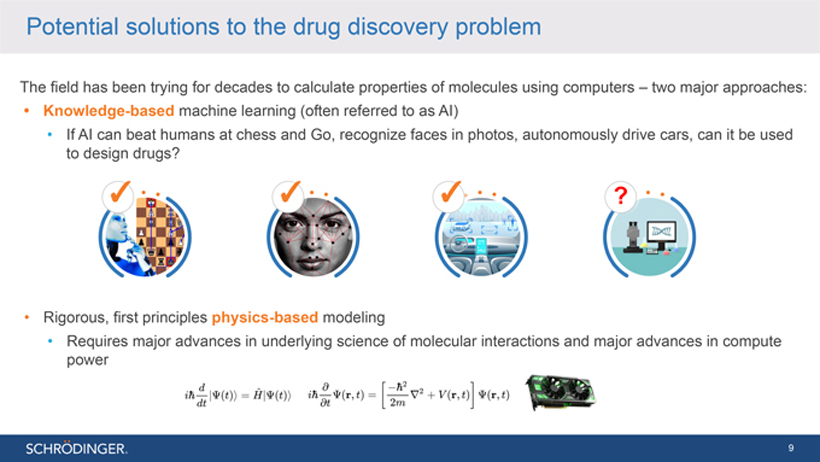
Potential solutions to the drug discovery problem
The field has been trying for decades to calculate properties of molecules using computers – two major approaches:
• Knowledge-based machine learning (often referred to as AI)
• If AI can beat humans
at chess and Go, recognize faces in photos, autonomously drive cars, can it be used to design drugs?
• Rigorous, first principles physics-based modeling
• Requires major advances in underlying science of molecular interactions and major advances in compute power
9
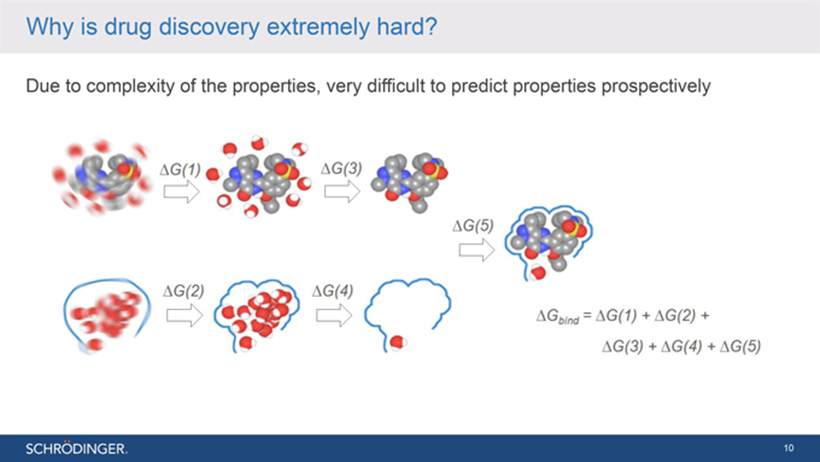
Why is drug discovery extremely hard?
Due to
complexity of the properties, very difficult to predict properties prospectively
10
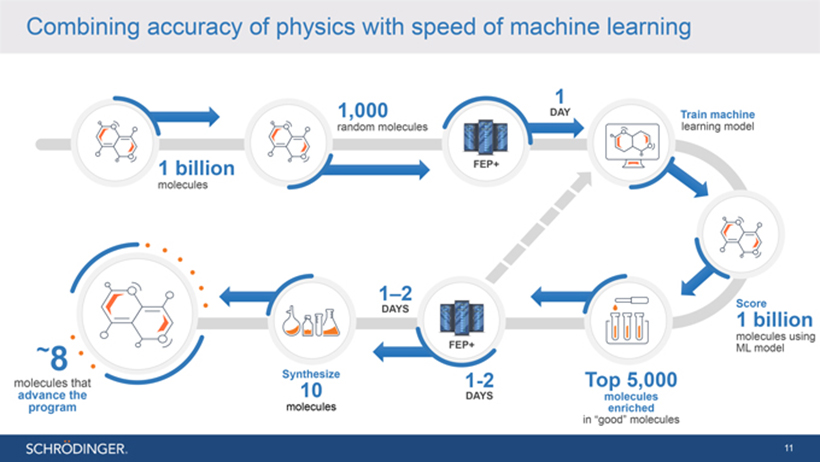
Combining accuracy of physics with speed of machine learning
1 billion
molecules
1,000
random molecules
1
DAY
Train machine learning model
Score
1 billion
molecules using ML model
Top 5,000
molecules enriched
in “good” molecules
1-2
DAYS
Synthesize
10
molecules
~
8
molecules that
advance the program
11
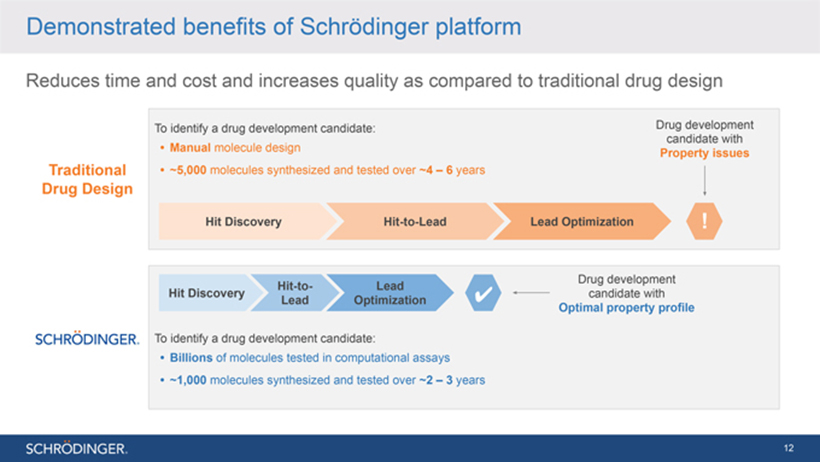
Demonstrated benefits of Schrödinger platform
Reduces time and cost and increases quality as compared to traditional drug design
Traditional Drug Design
To identify a drug development candidate:
• Manual molecule design
• ~5,000 molecules synthesized and tested over ~4 – 6
years
Drug development candidate with
Property issues
Hit Discovery Hit-to-Lead Lead Optimization
Schrödinger
Hit-to- Lead Hit Discovery Lead Optimization
Drug development candidate with
Optimal property profile
To identify a drug development candidate:
• Billions of molecules tested in computational
assays
• ~1,000 molecules synthesized and tested over ~2 – 3 years
12
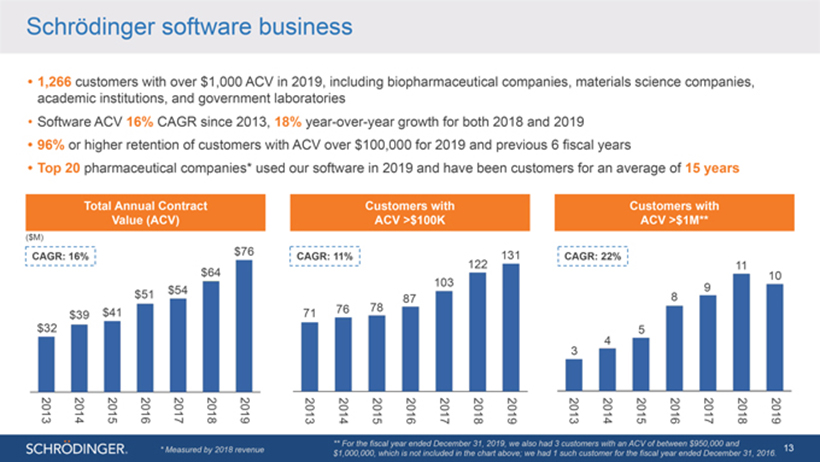
Schrödinger software business
1,266 customers
with over $1,000 ACV in 2019, including biopharmaceutical companies, materials science companies, academic institutions, and government laboratories
Software ACV
16% CAGR since 2013, 18% year-over-year growth for both 2018 and 2019
96% or higher retention of customers with ACV over $100,000 for 2019 and previous 6 fiscal
years
Top 20 pharmaceutical companies* used our software in 2019 and have been customers for an average of 15 years
Total Annual Contract Value (ACV)
($M)
CAGR: 16%
$32 2013
$39 2014
$41 2015
$51 2016
$54 2017
$64 2018
$76 2019
Customers with ACV >$100K
CAGR: 11%
71 2013
76 2014
78 2015
87 2016
103 2017
122 2018
131 2019
Customers with ACV >$1M**
CAGR: 22%
3 2013
4 2014
5 2015
8 2016
9 2017
11 2018
10 2019
* Measured by 2018 revenue
** For the fiscal year ended December 31, 2019, we also had 3
customers with an ACV of between $950,000 and $1,000,000, which is not included in the chart above; we had 1 such customer for the fiscal year ended December 31, 2016.
13
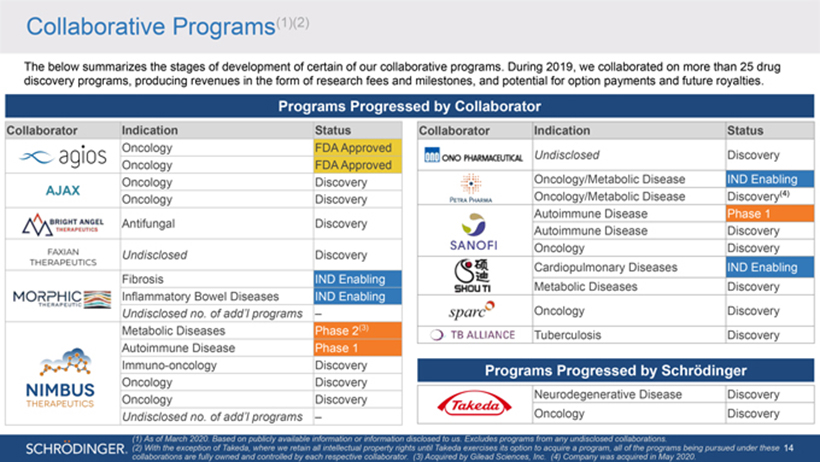
Collaborative Programs(1)(2)
The below summarizes
the stages of development of certain of our collaborative programs. During 2019, we collaborated on more than 25 drug discovery programs, producing revenues in the form of research fees and milestones, and potential for option payments and future
royalties.
Collaborator
Indication
Oncology Oncology Oncology Oncology
Antifungal
Undisclosed
Fibrosis
Inflammatory Bowel Diseases
Undisclosed no. of add’l programs
Metabolic Diseases Autoimmune Disease Immuno-oncology Oncology Oncology
Undisclosed no. of
add’l programs
Status
FDA Approved FDA Approved Discovery Discovery
Discovery
Discovery
IND Enabling IND Enabling
–
Phase 2(3) Phase 1 Discovery Discovery Discovery
–
Collaborator
Indication
Undisclosed
Oncology/Metabolic Disease Oncology/Metabolic Disease Autoimmune Disease
Autoimmune Disease Oncology Cardiopulmonary Diseases Metabolic Diseases
Oncology
Tuberculosis
Status
Discovery
IND Enabling Discovery(4) Phase 1 Discovery Discovery IND Enabling Discovery
Discovery
Discovery
Programs Progressed by Schrödinger
Neurodegenerative Disease Discovery Oncology Discovery
(1) As of March 2020. Based on publicly available information or information disclosed to us. Excludes programs from any undisclosed collaborations.
(2) With the exception of Takeda, where we retain all intellectual property rights until Takeda exercises its option to acquire a program, all of the programs being pursued under
these collaborations are fully owned and controlled by each respective collaborator. (3) Acquired by Gilead Sciences, Inc. (4) Company was acquired in May 2020.
14
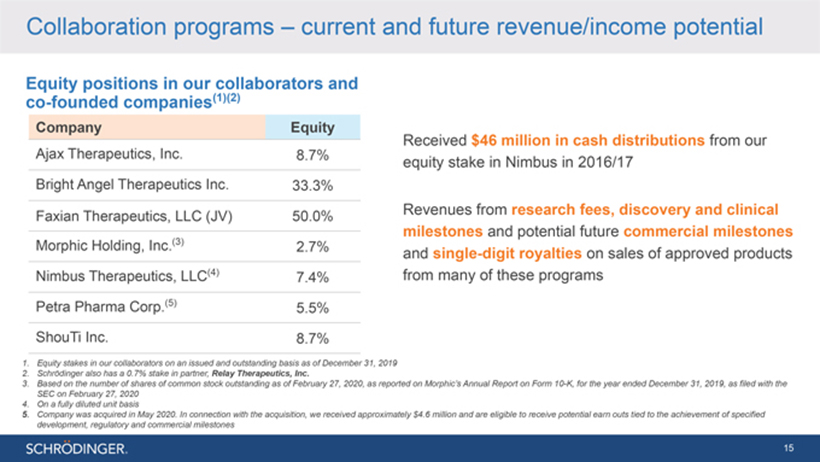
Collaboration programs – current and future revenue/income potential
Equity positions in our collaborators and co-founded companies(1)(2)
Company Equity
Ajax Therapeutics, Inc. 8.7% Bright Angel Therapeutics Inc. 33.3% Faxian
Therapeutics, LLC (JV) 50.0%
Morphic Holding, Inc.(3) 2.7% Nimbus Therapeutics, LLC(4) 7.4% Petra Pharma Corp.(5) 5.5%
ShouTi Inc. 8.7%
Received $46 million in cash distributions from our equity stake in
Nimbus in 2016/17
Revenues from research fees, discovery and clinical milestones and potential future commercial milestones and single-digit royalties on sales of
approved products from many of these programs
1. Equity stakes in our collaborators on an issued and outstanding basis as of December 31, 2019
2. Schrödinger also has a 0.7% stake in partner, Relay Therapeutics, Inc.
3. Based on the
number of shares of common stock outstanding as of February 27, 2020, as reported on Morphic’s Annual Report on Form 10-K, for the year ended December 31, 2019, as filed with the SEC on
February 27, 2020
4. On a fully diluted unit basis
5. Company was
acquired in May 2020. In connection with the acquisition, we received approximately $4.6 million and are eligible to receive potential earn outs tied to the achievement of specified development, regulatory and commercial milestones
15
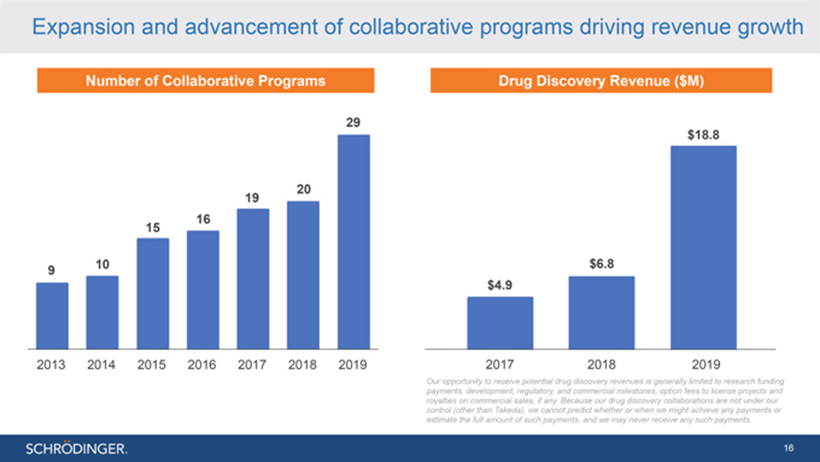
Expansion and advancement of collaborative programs driving revenue growth
Number of Collaborative Programs
2013 9
2014 10
2015 15
2016 16
2017 19
2018 20
2019 29
Drug Discovery Revenue ($M)
2017 $4.9
2018 $6.8
2019 $18.8
Our opportunity to receive potential drug discovery revenues is generally limited to research funding payments, development, regulatory, and commercial milestones, option fees to
license projects and royalties on commercial sales, if any. Because our drug discovery collaborations are not under our control (other than Takeda), we cannot predict whether or when we might achieve any payments or estimate the full amount of such
payments, and we may never receive any such payments.
16
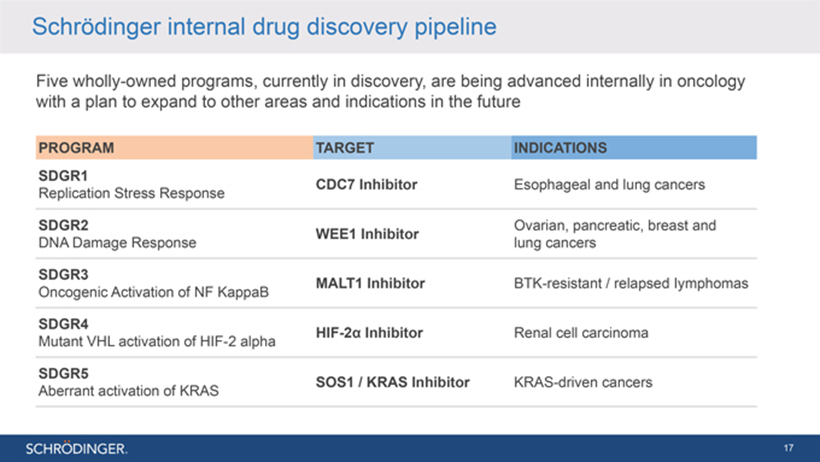
Schrödinger internal drug discovery pipeline
Five wholly-owned programs, currently in discovery, are being advanced internally in oncology with a plan to expand to other areas and indications in the future
PROGRAM
SDGR1
Replication Stress Response
SDGR2
DNA Damage Response
SDGR3
Oncogenic Activation of NF KappaB
SDGR4
Mutant VHL activation of HIF-2 alpha
SDGR5
Aberrant activation of KRAS
TARGET
CDC7 Inhibitor
WEE1 Inhibitor MALT1 Inhibitor
HIF-2α Inhibitor SOS1 / KRAS Inhibitor
INDICATIONS
Esophageal and lung cancers
Ovarian, pancreatic, breast and lung cancers
BTK-resistant / relapsed Iymphomas Renal cell carcinoma KRAS-driven cancers
17
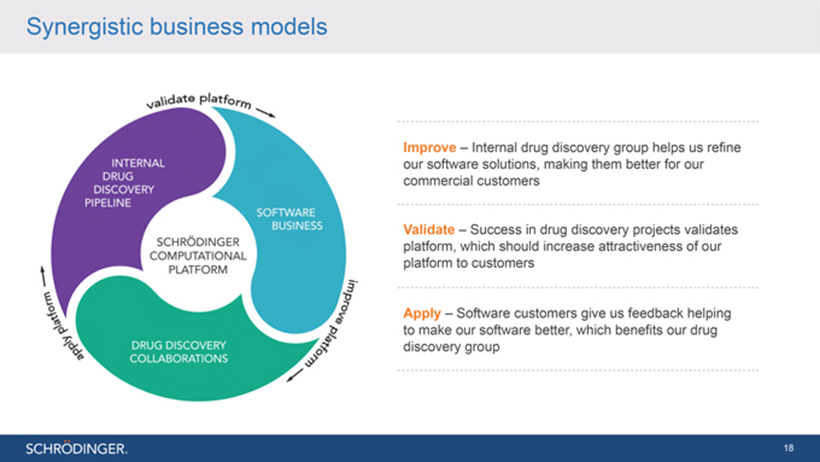
Synergistic business models
Improve –
Internal drug discovery group helps us refine our software solutions, making them better for our commercial customers
Validate – Success in drug discovery
projects validates platform, which should increase attractiveness of our platform to customers
Apply – Software customers give us feedback helping to make our
software better, which benefits our drug discovery group
Drug Discovery
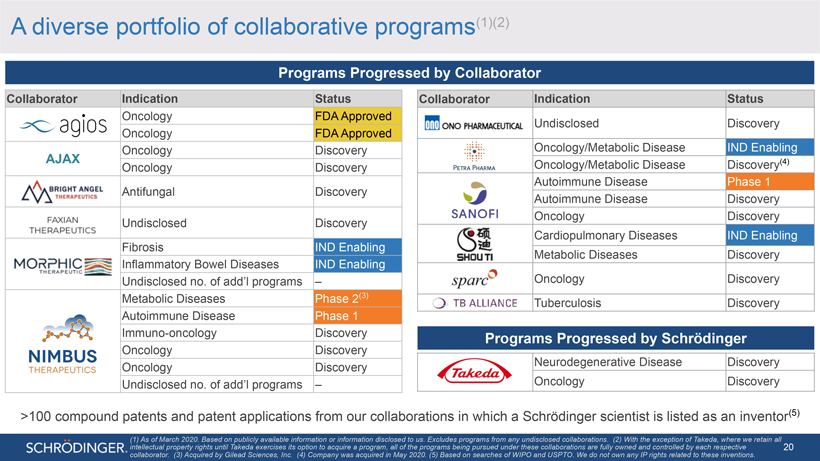
A diverse portfolio of collaborative programs(1)(2)
Programs Progressed by Collaborator
Collaborator Indication Status
Oncology FDA Approved Oncology FDA Approved Oncology Discovery
AJAX
Oncology Discovery Antifungal Discovery
Undisclosed Discovery
Fibrosis IND Enabling Inflammatory Bowel Diseases IND Enabling Undisclosed no. of add’l programs –Metabolic Diseases Phase 2(3) Autoimmune Disease Phase 1 Immuno-oncology
Discovery Oncology Discovery Oncology Discovery Undisclosed no. of add’l programs –
Collaborator Indication Status
Undisclosed Discovery
Oncology/Metabolic Disease IND Enabling Oncology/Metabolic Disease
Discovery(4) Autoimmune Disease Phase 1 Autoimmune Disease Discovery Oncology Discovery Cardiopulmonary Diseases IND Enabling Metabolic Diseases Discovery
Oncology
Discovery
Tuberculosis Discovery
Programs Progressed by Schrödinger
Neurodegenerative Disease Discovery Oncology Discovery
>100 compound
patents and patent applications from our collaborations in which a Schrödinger scientist is listed as an inventor(5)
(1) As of March 2020. Based on publicly
available information or information disclosed to us. Excludes programs from any undisclosed collaborations. (2) With the exception of Takeda, where we retain all intellectual property rights until Takeda exercises its option to acquire a
program, all of the programs being pursued under these collaborations are fully owned and controlled by each respective 20 collaborator. (3) Acquired by Gilead Sciences, Inc. (4) Company was acquired in May 2020. (5) Based on searches of
WIPO and USPTO. We do not own any IP rights related to these inventions.
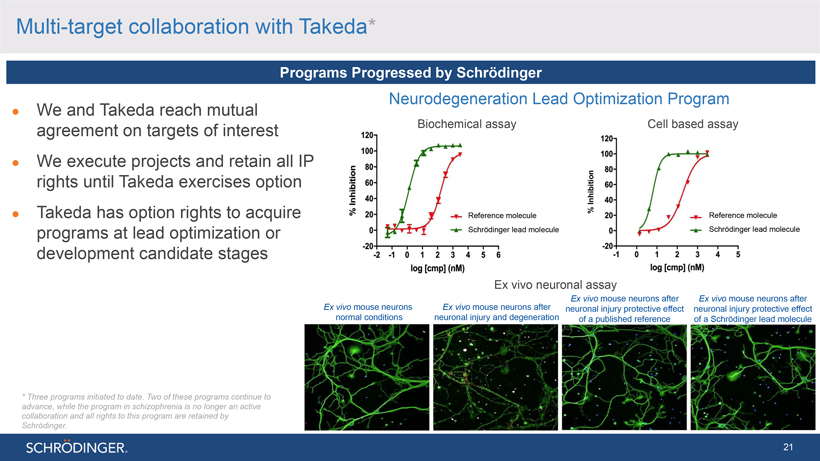
Multi-target collaboration with Takeda*
Programs
Progressed by Schrödinger
We and Takeda reach mutual agreement on targets of interest
We execute projects and retain all IP rights until Takeda exercises option
Takeda has option
rights to acquire programs at lead optimization or development candidate stages
Neurodegeneration Lead Optimization Program
Biochemical assay Cell based assay
Inhibition %
Reference molecule Reference molecule
Schrödinger lead molecule Schrödinger lead
molecule
Ex vivo neuronal assay
Ex vivo
mouse neurons after
Ex vivo
mouse neurons after
Ex vivo
mouse neurons
Ex vivo
mouse neurons after neuronal injury protective effect neuronal injury protective effect normal conditions neuronal injury and degeneration of a published reference of a
Schrödinger lead molecule
* Three programs initiated to date. Two of these programs continue to advance, while the program in schizophrenia is no longer an
active collaboration and all rights to this program are retained by Schrödinger.
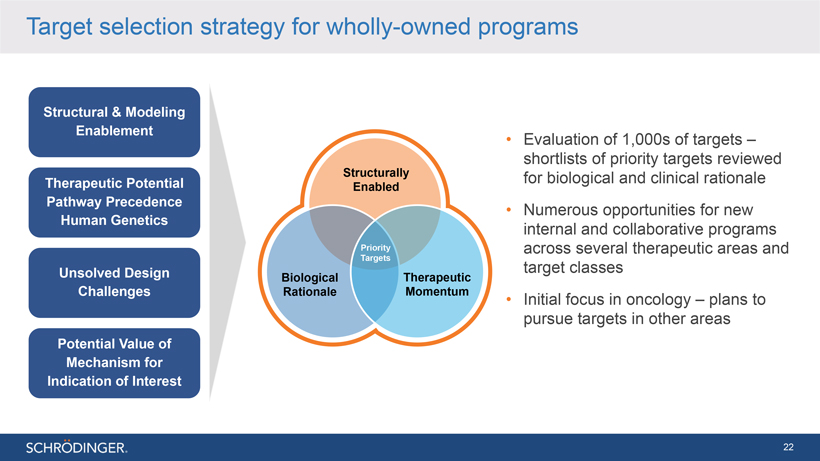
Target selection strategy for wholly-owned programs
Structural & Modeling Enablement
Therapeutic Potential Pathway
Precedence Human Genetics
Unsolved Design Challenges
Potential Value of
Mechanism for Indication of Interest
Structurally Enabled
Biological
Rationale
Priority Targets
Therapeutic Momentum
Evaluation of 1,000s of targets – shortlists of priority targets reviewed for biological and clinical rationale
Numerous opportunities for new internal and collaborative programs across several therapeutic areas and target classes
Initial focus in oncology – plans to pursue targets in other areas
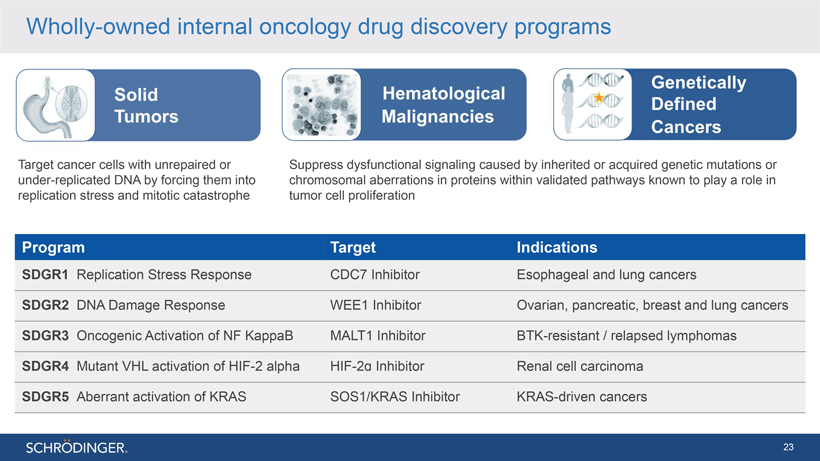
Wholly-owned internal oncology drug discovery programs
Target cancer cells with unrepaired or under-replicated DNA by forcing them into replication stress and mitotic catastrophe
Suppress dysfunctional signaling caused by inherited or acquired genetic mutations or chromosomal aberrations in proteins within validated pathways known to play a role in tumor
cell proliferation
Program Target Indications
SDGR1 Replication Stress
Response CDC7 Inhibitor Esophageal and lung cancers
SDGR2 DNA Damage Response WEE1 Inhibitor Ovarian, pancreatic, breast and lung cancers SDGR3 Oncogenic
Activation of NF KappaB MALT1 Inhibitor BTK-resistant / relapsed lymphomas SDGR4 Mutant VHL activation of HIF-2 alpha HIF-2É‘ Inhibitor Renal cell carcinoma
SDGR5 Aberrant activation of KRAS SOS1/KRAS Inhibitor KRAS-driven cancers
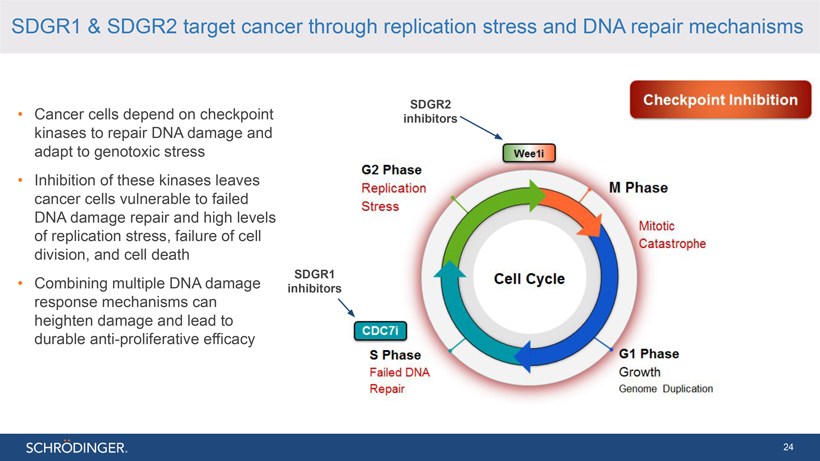
SDGR1 & SDGR2 target cancer through replication stress and DNA repair mechanisms
Cancer cells depend on checkpoint kinases to repair DNA damage and adapt to genotoxic stress
Inhibition of these kinases leaves cancer cells vulnerable to failed DNA damage repair and high levels of replication stress, failure of cell division, and cell
death
Combining multiple DNA damage response mechanisms can heighten damage and lead to durable anti-proliferative efficacy
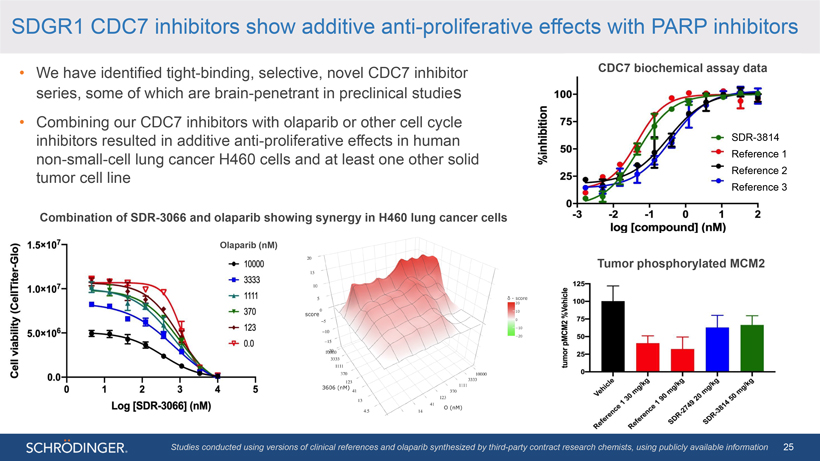
SDGR1 CDC7 inhibitors show additive anti-proliferative effects with PARP inhibitors
We have identified tight-binding, selective, novel CDC7 inhibitor series, some of which are brain-penetrant in preclinical studies
Combining our CDC7 inhibitors with olaparib or other cell cycle inhibitors resulted in additive anti-proliferative effects in human
non-small-cell lung cancer H460 cells and at least one other solid tumor cell line
Combination of SDR-3066 and olaparib showing synergy in H460 lung cancer cells
Studies conducted using versions of clinical references and
olaparib synthesized by third-party contract research chemists, using publicly available information
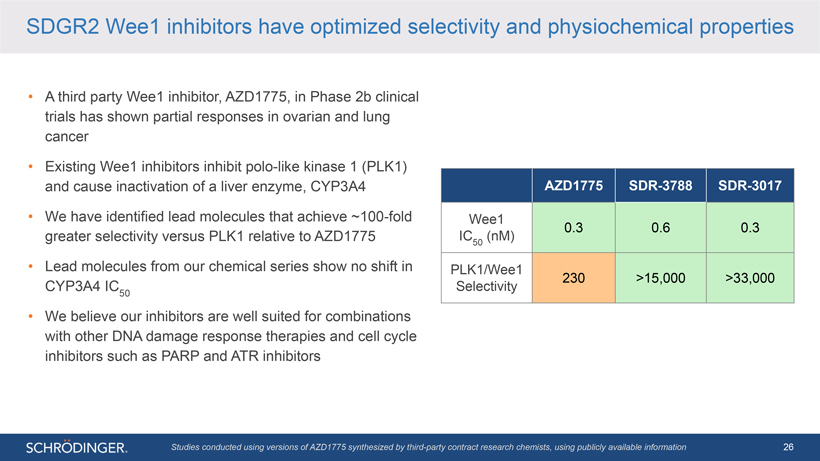
SDGR2 Wee1 inhibitors have optimized selectivity and physiochemical properties
A third party Wee1 inhibitor, AZD1775, in Phase 2b clinical trials has shown partial responses in ovarian and lung cancer
Existing Wee1 inhibitors inhibit polo-like kinase 1 (PLK1) and cause inactivation of a liver enzyme, CYP3A4
We have identified lead molecules that achieve ~100-fold greater selectivity versus PLK1 relative to AZD1775
Lead molecules from our chemical series show no shift in CYP3A4 IC
50
We believe our inhibitors are well suited for combinations with other DNA damage response therapies and cell cycle inhibitors such as PARP and ATR inhibitors
AZD1775 SDR-3788 SDR-3017
Wee1
0.3 0.6 0.3 IC (nM)
50
PLK1/Wee1
230 >15,000 >33,000 Selectivity
Studies conducted using versions of AZD1775 synthesized
by third-party contract research chemists, using publicly available information
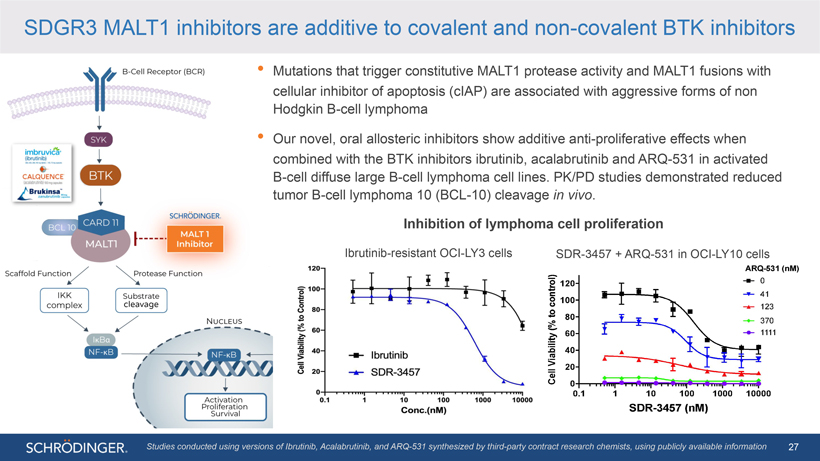
SDGR3 MALT1 inhibitors are additive to covalent and non-covalent BTK inhibitors
Mutations that trigger constitutive MALT1 protease activity and MALT1 fusions with cellular inhibitor of apoptosis (cIAP) are associated with aggressive forms of non Hodgkin B-cell lymphoma
Our novel, oral allosteric inhibitors show additive anti-proliferative effects when combined with the BTK
inhibitors ibrutinib, acalabrutinib and ARQ-531 in activated B-cell diffuse large B-cell lymphoma cell lines. PK/PD studies
demonstrated reduced tumor B-cell lymphoma 10 (BCL-10) cleavage in vivo.
Inhibition
of lymphoma cell proliferation
Ibrutinib-resistant OCI-LY3 cells SDR-3457 + ARQ-531 in OCI-LY10 cells
Studies conducted using versions of Ibrutinib, Acalabrutinib,
and ARQ-531 synthesized by third-party contract research chemists, using publicly available information
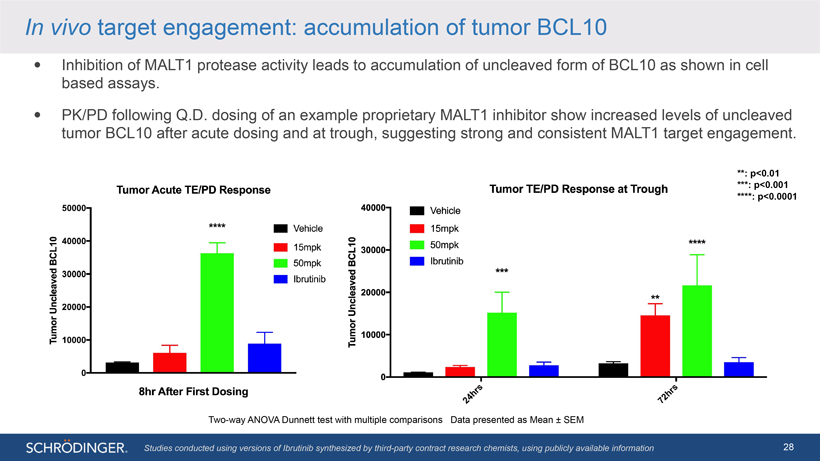
In vivo target engagement: accumulation of tumor BCL10
Inhibition of MALT1 protease activity leads to accumulation of uncleaved form of BCL10 as shown in cell based assays.
PK/PD following Q.D. dosing of an example proprietary MALT1 inhibitor show increased levels of uncleaved tumor BCL10 after acute dosing and at trough, suggesting strong and
consistent MALT1 target engagement.
Two-way ANOVA Dunnett test with multiple comparisons Data presented as Mean ±
SEM
Studies conducted using versions of Ibrutinib synthesized by third-party contract research chemists, using publicly available information
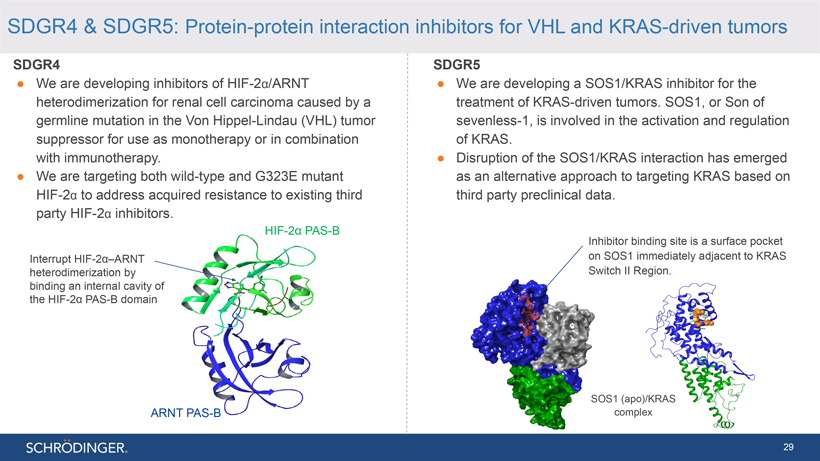
SDGR4 & SDGR5: Protein-protein interaction inhibitors for VHL and KRAS-driven tumors
SDGR4
We are developing inhibitors of
HIF-2á/ARNT heterodimerization for renal cell carcinoma caused by a germline mutation in the Von Hippel-Lindau (VHL) tumor suppressor for use as monotherapy or in combination with immunotherapy.
We are targeting both wild-type and G323E mutant HIF-2á to address acquired resistance to existing third
HIF-2α PAS-B
ARNT PAS-B
SDGR5
We are developing a SOS1/KRAS inhibitor for the treatment of KRAS-driven tumors. SOS1, or Son of sevenless-1, is involved in the activation
and regulation of KRAS.
Disruption of the SOS1/KRAS interaction has emerged as an alternative approach to targeting KRAS based on third party preclinical data.
Inhibitor binding site is a surface pocket on SOS1 immediately adjacent to KRAS Switch II Region.
SOS1 (apo)/KRAS complex
Our strategy: expand and advance collaborative and internal drug discovery programs
Apply our latest technologies to the discovery of small molecules and biologics
Add new
collaborations that offer scientific synergies
Maximize the value and commercial opportunities generated by program IP
Advance our wholly-owned programs into clinical development ourselves or in partnership to maximize success and commercial opportunities

Financials
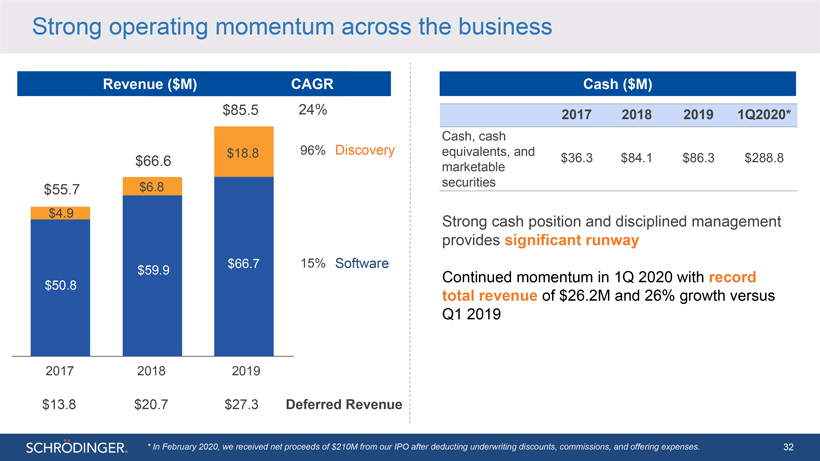
Strong operating momentum across the business
Revenue ($M) CAGR
$85.5 24%
$18.8 96% Discovery
$66.6
$55.7 $6.8
$4.9
$66.7 15% Software
$59.9
$50.8
2017 2018 2019
$13.8 $20.7 $27.3 Deferred Revenue
Cash ($M)
2017 2018 2019 1Q2020*
Cash, cash equivalents, and marketable $36.3 $84.1 $86.3 $288.8
securities
Strong cash position and disciplined management provides significant runway
Continued momentum in 1Q 2020 with record total revenue of $26.2M and 26% growth versus Q1 2019
* In February 2020, we received net proceeds of $210M from our IPO after deducting underwriting discounts, commissions, and offering expenses.
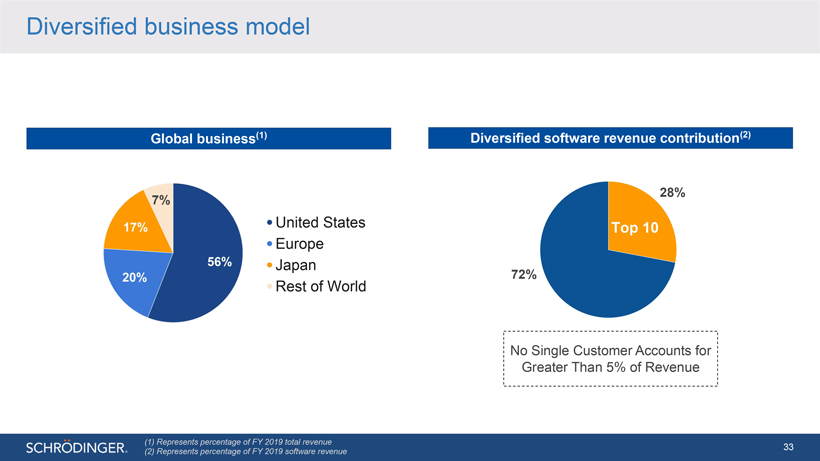
Diversified business model
Global business(1)
7%
Diversified software revenue contribution(2)
28%
72%
No Single Customer Accounts for Greater Than 5% of Revenue
(1) Represents
percentage of FY 2019 total revenue
(2) Represents percentage of FY 2019 software revenue
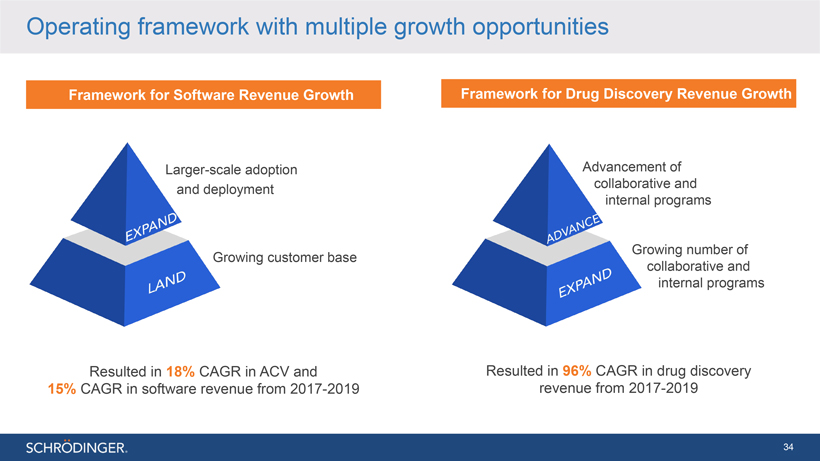
Operating framework with multiple growth opportunities
Framework for Software Revenue Growth
Larger-scale adoption and
deployment
Growing customer base
Resulted in 18% CAGR in ACV and 15% CAGR in
software revenue from 2017-2019
Framework for Drug Discovery Revenue Growth
of and
programs
Growing number of collaborative and internal programs
Resulted in 96% CAGR in drug discovery
revenue from 2017-2019
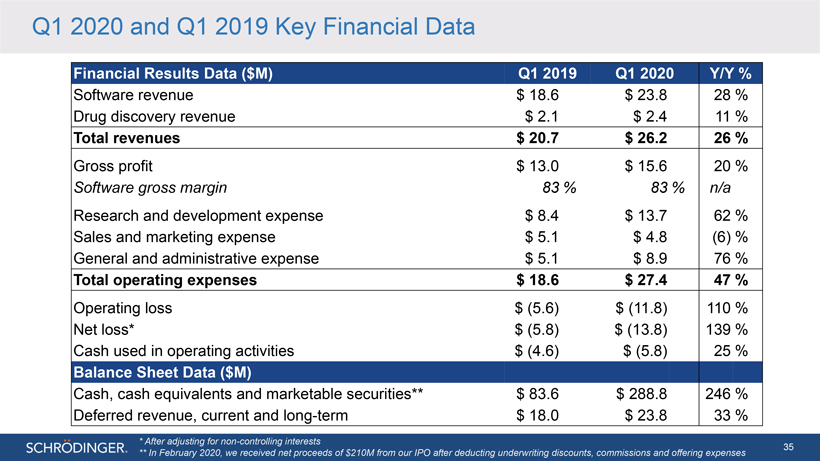
Q1 2020 and Q1 2019 Key Financial Data
Financial
Results Data ($M) Q1 2019 Q1 2020 Y/Y %
Software revenue $ 18.6 $ 23.8 28 % Drug discovery revenue $ 2.1 $ 2.4 11 %
Total revenues $ 20.7 $ 26.2 26 %
Gross profit $ 13.0 $ 15.6 20 %
Software gross margin 83 % 83 % n/a
Research and development expense $ 8.4 $ 13.7
62 % Sales and marketing expense $ 5.1 $ 4.8 (6) % General and administrative expense $ 5.1 $ 8.9 76 %
Total operating expenses $ 18.6 $ 27.4 47 %
Operating loss $ (5.6) $ (11.8) 110 % Net loss* $ (5.8) $ (13.8) 139 % Cash used in operating activities $ (4.6) $ (5.8) 25 %
Balance Sheet Data ($M)
Cash, cash equivalents and marketable securities** $ 83.6 $ 288.8
246 % Deferred revenue, current and long-term $ 18.0 $ 23.8 33 %
* After adjusting for non-controlling interests
** In February 2020, we received net proceeds of $210M from our IPO after deducting underwriting discounts, commissions and offering expenses
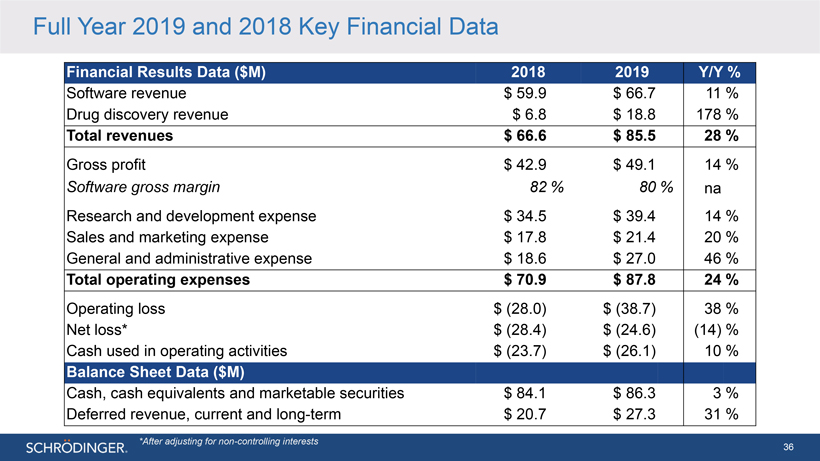
Full Year 2019 and 2018 Key Financial Data
Financial Results Data ($M) 2018 2019 Y/Y %
Software revenue $ 59.9 $ 66.7
11 % Drug discovery revenue $ 6.8 $ 18.8 178 %
Total revenues $ 66.6 $ 85.5 28 %
Gross profit $ 42.9 $ 49.1 14 %
Software gross margin 82 % 80 % na
Research and development expense $ 34.5 $ 39.4 14 % Sales and marketing expense $ 17.8 $ 21.4 20 % General and administrative expense $ 18.6 $ 27.0 46 %
Total operating expenses $ 70.9 $ 87.8 24 %
Operating loss $ (28.0) $ (38.7) 38 %
Net loss* $ (28.4) $ (24.6) (14) % Cash used in operating activities $ (23.7) $ (26.1) 10 %
Balance Sheet Data ($M)
Cash, cash equivalents and marketable securities $ 84.1 $ 86.3 3 % Deferred revenue, current and long-term $ 20.7 $ 27.3 31 %
*After adjusting for non-controlling interests
Schrödinger
We have developed a leading
physics-based software platform
We are transforming discovery of therapeutics and materials
We are leveraging synergies between our multiple businesses
We have a track record of revenue
growth from long-standing, growing customer base
We have diversified software and drug discovery optionality with multiple growth opportunities