Attached files
| file | filename |
|---|---|
| 8-K - FORM 8-K - RPC INC | tm2022246d1_8k.htm |
Exhibit 99

Investor Relations Presentation June 10, 2020
2 Forward - Looking Statement Disclosure Certain statements and information included in this press release constitute "forward - looking statements" within the meaning of the Private Securities Litigation Reform Act of 1995, including all statements that look forward in time or express management’s beliefs, ex pectations or hopes. These statements involve known and unknown risks, uncertainties and other factors which may cause the actual results, per formance or achievements of RPC to be materially different from any future results, performance or achievements expressed or implied in s uch forward - looking statements, including statements that RPC has taken appropriate measures given the numerous secular changes in the oi l a nd gas industry. Such risks include changes in general global business and economic conditions, including volatility of oil and natu ral gas prices; credit risks associated with collections of our accounts receivable from customers experiencing challenging business conditions; dri lli ng activity and rig count; risks of reduced availability or increased costs of both labor and raw materials used in providing our services; t he impact on our operations if we are unable to comply with regulatory and environmental laws; turmoil in the financial markets and the potent ial difficulty to fund our capital needs; the potentially high cost of capital required to fund our capital needs; the impact of the level of unconv ent ional exploration and production activities may cease or change in nature so as to reduce demand for our services; the actions of the OPEC cartel; the ultimate impact of current and potential political unrest and armed conflict in the oil production regions of the world, which could i mpa ct drilling activity; adverse weather conditions in oil and gas producing regions, including the Gulf of Mexico; competition in the oil and gas ind ust ry; an inability to implement price increases; risks of international operations; and our reliance upon large customers. Additional discussion of fa ctors that could cause the actual results to differ materially from management’s projections, forecasts, estimates and expectations is contain ed in RPC's Form 10 - K filed with the Securities and Exchange Commission for the year ended December 31, 2019. This presentation refers to several non - GAAP measures of operating performance. These non - GAAP measures are adjusted net loss, a djusted net income, adjusted loss per share, adjusted earnings per share, adjusted operating loss, adjusted operating profit, EBITDA and adjusted EBITDA. We are using these non - GAAP measures today because they allow us to compare our performance consistently over various p eriods without regard to non - recurring items. In addition, RPC’s required to use EBITDA to report compliance with financial covenants u nder our credit facility. This presentation and our website contain reconciliations of these non - GAAP financial measures to operating loss or income, net loss or income and losses or diluted earnings per share, which are the nearest GAAP financial measures. Please refer to Appendix A at the e nd of this presentation for a more complete explanation. 2
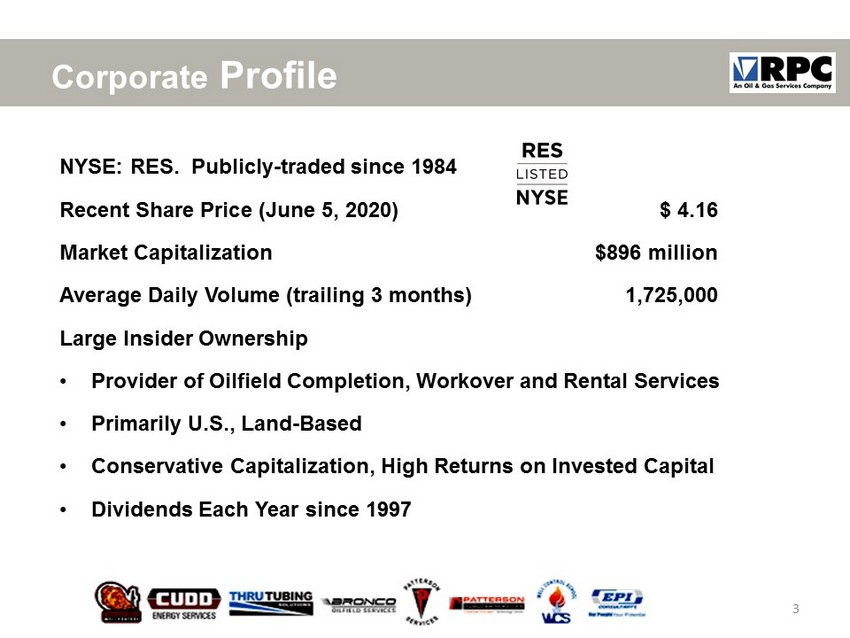
3 Corporate Profile NYSE: RES. Publicly - traded since 1984 Recent Share Price (June 5, 2020) $ 4.16 Market Capitalization $896 million Average Daily Volume (trailing 3 months) 1,725,000 Large Insider Ownership • Provider of Oilfield Completion, Workover and Rental Services • Primarily U.S., Land - Based • Conservative Capitalization, High Returns on Invested Capital • Dividends Each Year since 1997 3
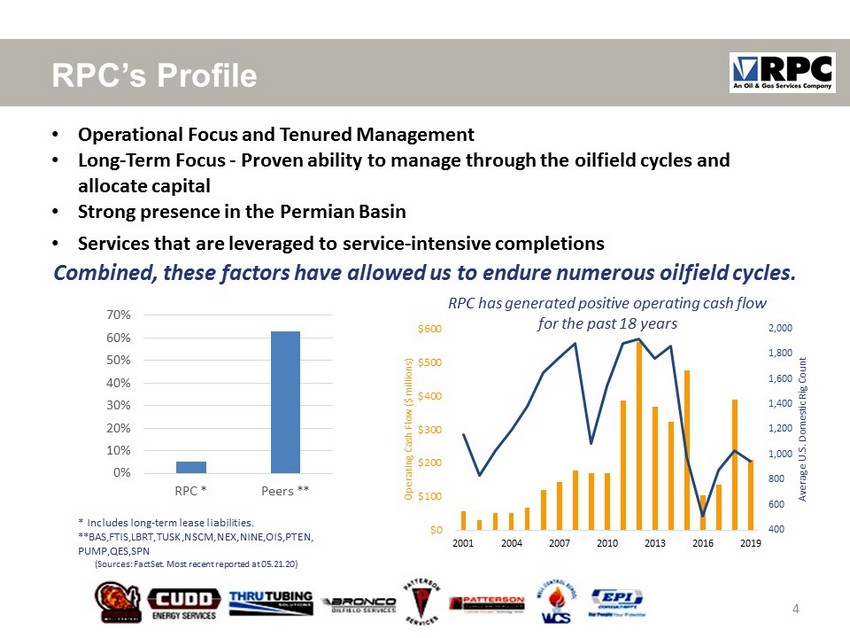
4 RPC’s Profile 4 400 600 800 1,000 1,200 1,400 1,600 1,800 2,000 $0 $100 $200 $300 $400 $500 $600 2001 2004 2007 2010 2013 2016 2019 Average U.S. Domestic Rig Count Operating Cash Flow ($ millions) RPC has generated positive operating cash flow for the past 18 years * Includes long - term lease liabilities. **BAS,FTIS,LBRT,TUSK,NSCM,NEX,NINE,OIS,PTEN, PUMP,QES,SPN (Sources: FactSet. Most recent reported at 05.21.20) • Operational Focus and Tenured Management • Long - Term Focus - Proven ability to manage through the oilfield cycles and allocate capital • Strong presence in the Permian Basin • Services that are leveraged to service - intensive completions Combined, these factors have allowed us to endure numerous oilfield cycles. 0% 10% 20% 30% 40% 50% 60% 70% RPC * Peers **
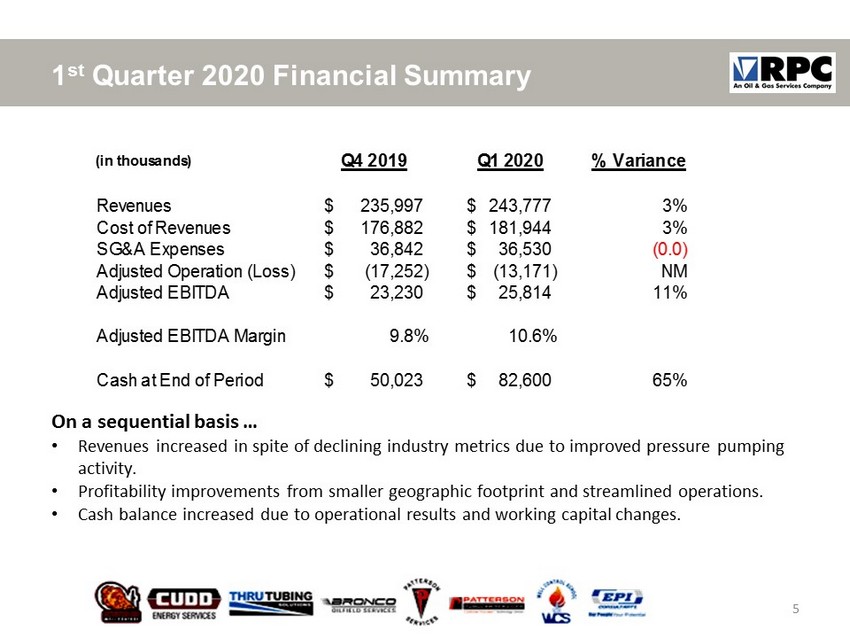
5 1 st Quarter 2020 Financial Summary 5 On a sequential basis … • Revenues increased in spite of declining industry metrics due to improved pressure pumping activity. • Profitability improvements from smaller geographic footprint and streamlined operations. • Cash balance increased due to operational results and working capital changes. (in thousands) Q4 2019 Q1 2020 % Variance Revenues 235,997$ 243,777$ 3% Cost of Revenues 176,882$ 181,944$ 3% SG&A Expenses 36,842$ 36,530$ (0.0) Adjusted Operation (Loss) (17,252)$ (13,171)$ NM Adjusted EBITDA 23,230$ 25,814$ 11% Adjusted EBITDA Margin 9.8% 10.6% Cash at End of Period 50,023$ 82,600$ 65%
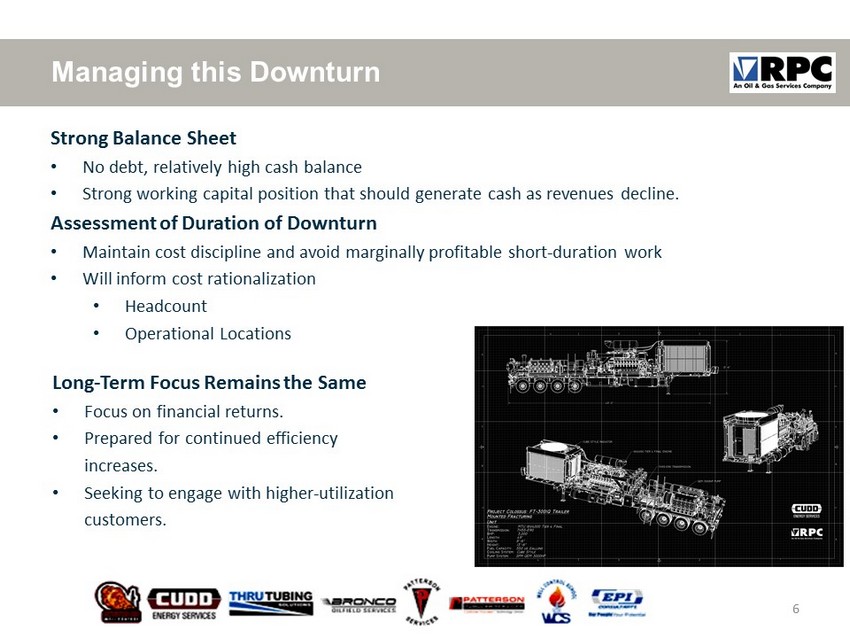
6 Managing this Downturn 6 Strong Balance Sheet • No debt, relatively high cash balance • Strong working capital position that should generate cash as revenues decline. Assessment of Duration of Downturn • Maintain cost discipline and avoid marginally profitable short - duration work • Will inform cost rationalization • Headcount • Operational Locations Long - Term Focus Remains the Same • Focus on financial returns. • Prepared for continued efficiency increases. • Seeking to engage with higher - utilization customers.
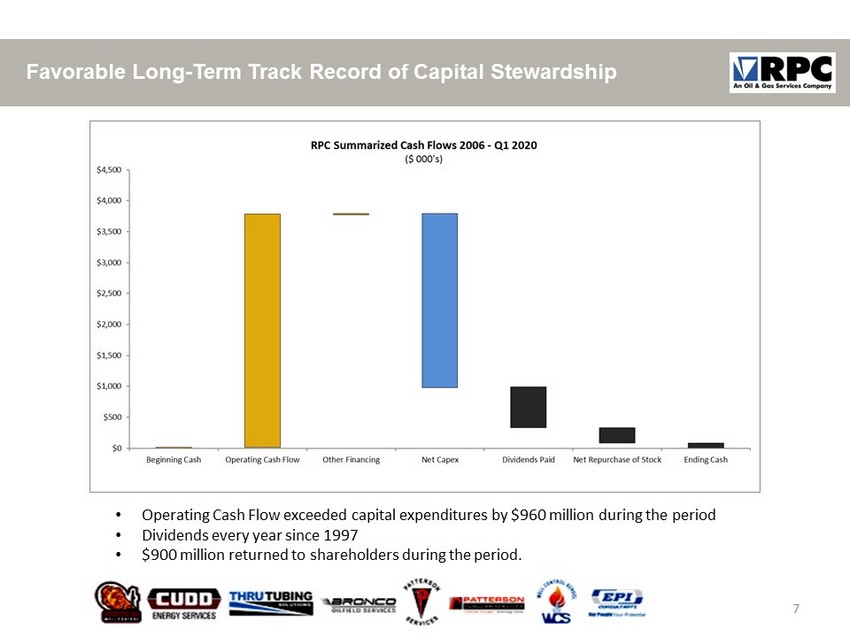
7 Favorable Long - Term Track Record of Capital Stewardship 7 • Operating Cash Flow exceeded capital expenditures by $960 million during the period • Dividends every year since 1997 • $900 million returned to shareholders during the period.
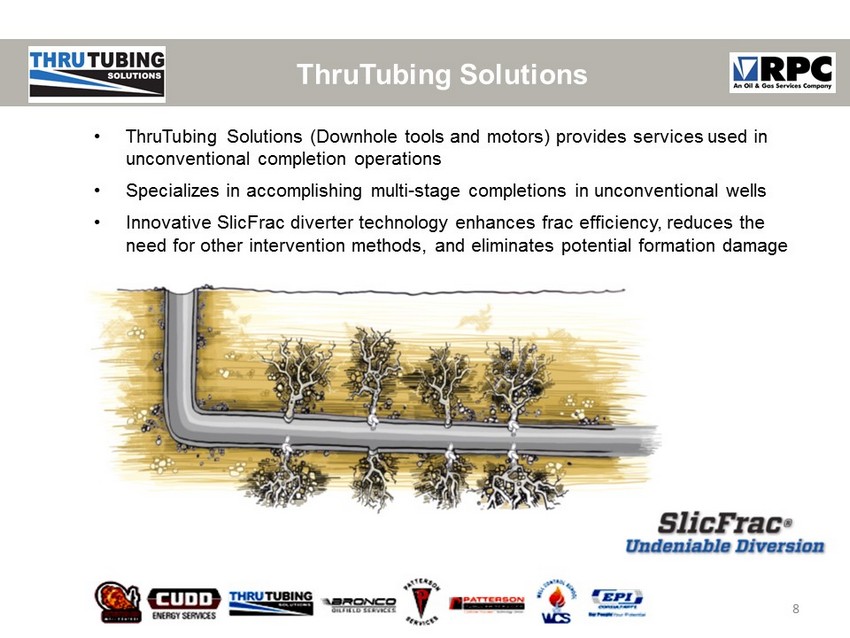
8 ThruTubing Solutions • ThruTubing Solutions (Downhole tools and motors) provides services used in unconventional completion operations • Specializes in accomplishing multi - stage completions in unconventional wells • Innovative SlicFrac diverter technology enhances frac efficiency, reduces the need for other intervention methods, and eliminates potential formation damage 8
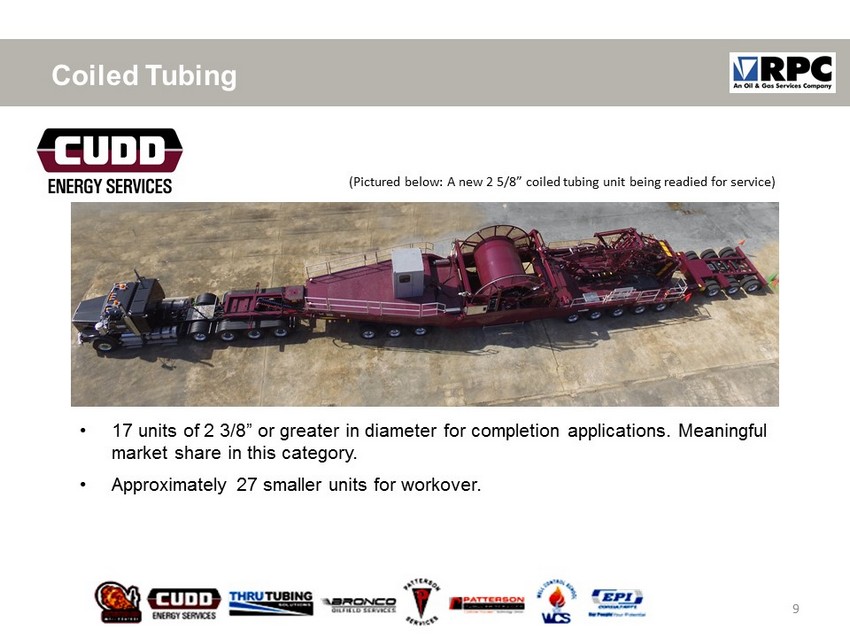
9 Coiled Tubing • 17 units of 2 3/8” or greater in diameter for completion applications. Meaningful market share in this category. • Approximately 27 smaller units for workover. 9 (Pictured below: A new 2 5/8” coiled tubing unit being readied for service)
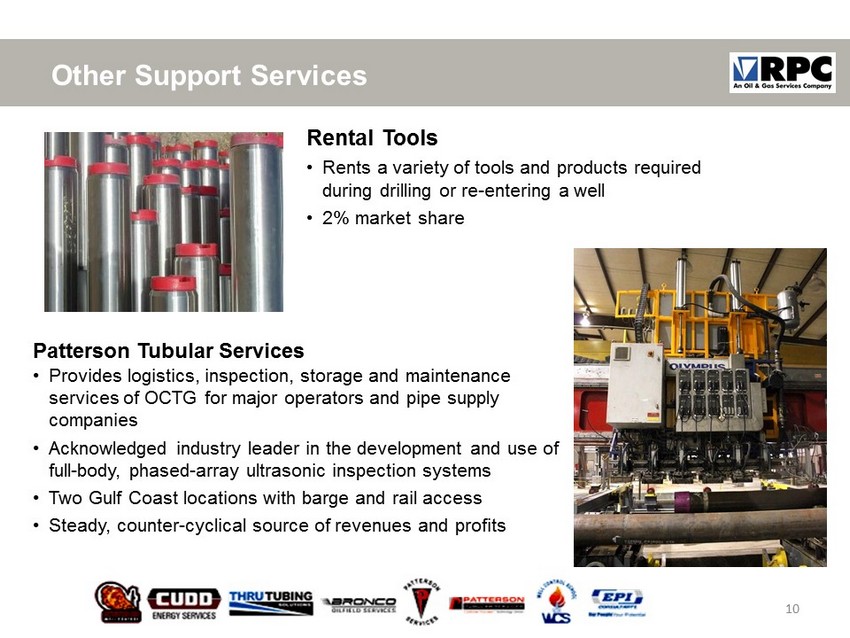
10 Other Support Services Rental Tools • Rents a variety of tools and products required during drilling or re - entering a well • 2% market share 10 Patterson Tubular Services • Provides logistics, inspection, storage and maintenance services of OCTG for major operators and pipe supply companies • Acknowledged industry leader in the development and use of full - body, phased - array ultrasonic inspection systems • Two Gulf Coast locations with barge and rail access • Steady, counter - cyclical source of revenues and profits
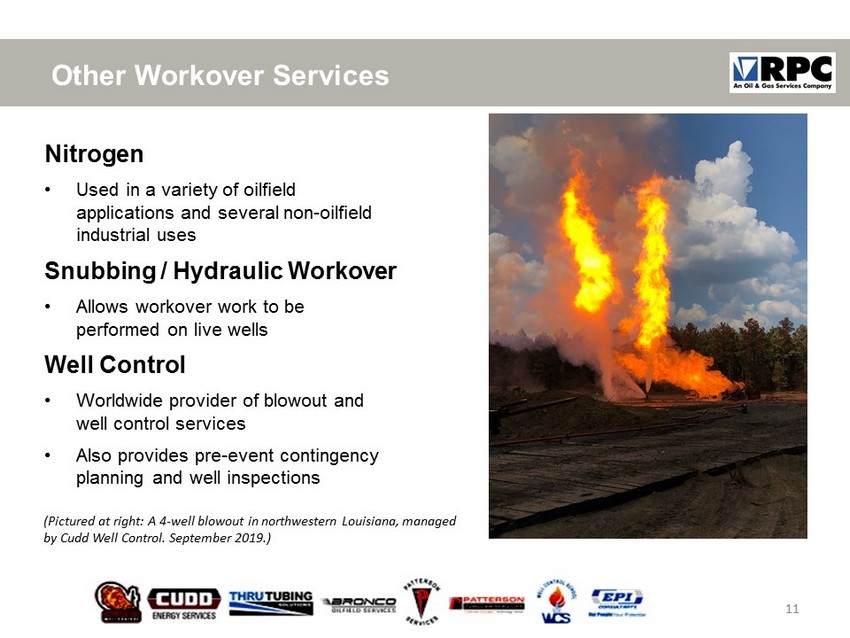
11 Other Workover Services Nitrogen • Used in a variety of oilfield applications and several non - oilfield industrial uses Snubbing / Hydraulic Workover • Allows workover work to be performed on live wells Well Control • Worldwide provider of blowout and well control services • Also provides pre - event contingency planning and well inspections 11 (Pictured at right: A 4 - well blowout in northwestern Louisiana, managed by Cudd Well Control. September 2019.)

12 Contact Us Operational Headquarters: The Woodlands, Texas (right) Corporate Headquarters: 2801 Buford Highway NE Suite 300 Atlanta, GA 30329 (404) 321 - 2140 12 IRDept@RPC.net RPC.net
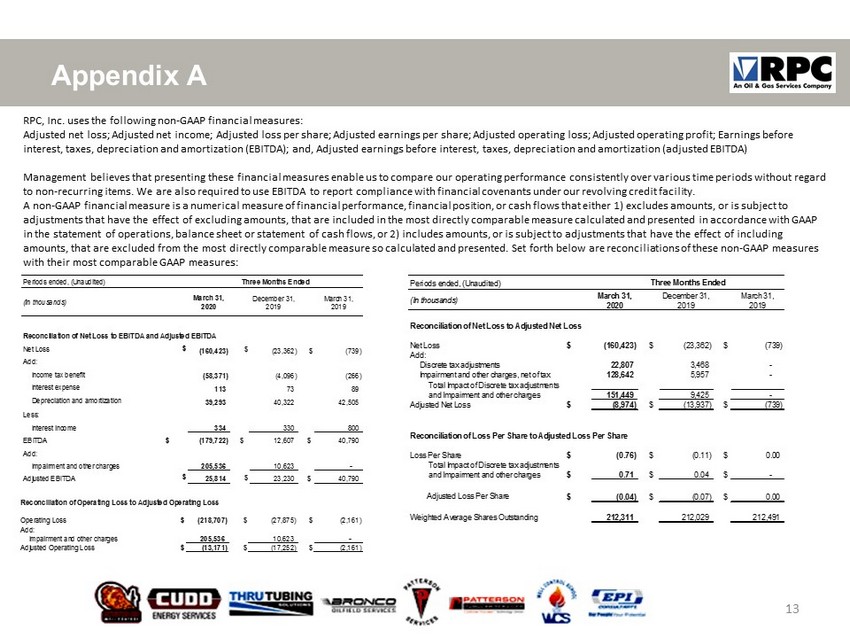
13 Appendix A 13 RPC, Inc. uses the following non - GAAP financial measures: Adjusted net loss; Adjusted net income; Adjusted loss per share; Adjusted earnings per share; Adjusted operating loss; Adjust ed operating profit; Earnings before interest, taxes, depreciation and amortization (EBITDA); and, Adjusted earnings before interest, taxes, depreciation and amor tiz ation (adjusted EBITDA) Management believes that presenting these financial measures enable us to compare our operating performance consistently over va rious time periods without regard to non - recurring items. We are also required to use EBITDA to report compliance with financial covenants under our revolving cre dit facility. A non - GAAP financial measure is a numerical measure of financial performance, financial position, or cash flows that either 1) e xcludes amounts, or is subject to adjustments that have the effect of excluding amounts, that are included in the most directly comparable measure calculated a nd presented in accordance with GAAP in the statement of operations, balance sheet or statement of cash flows, or 2) includes amounts, or is subject to adjustment s t hat have the effect of including amounts, that are excluded from the most directly comparable measure so calculated and presented. Set forth below are reconci lia tions of these non - GAAP measures with their most comparable GAAP measures: Periods ended, (Unaudited) (In thousands) March 31, 2020 December 31, 2019 March 31, 2019 Reconciliation of Net Loss to Adjusted Net Loss Net Loss $ (160,423) $ (23,362) $ (739) Add: Discrete tax adjustments 22,807 3,468 - Impairment and other charges, net of tax 128,642 5,957 - Total Impact of Discrete tax adjustments and Impairment and other charges 151,449 9,425 - Adjusted Net Loss $ (8,974) $ (13,937) $ (739) Reconciliation of Loss Per Share to Adjusted Loss Per Share Loss Per Share $ (0.76) $ (0.11) $ 0.00 Total Impact of Discrete tax adjustments and Impairment and other charges $ 0.71 $ 0.04 $ - Adjusted Loss Per Share $ (0.04) $ (0.07) $ 0.00 Weighted Average Shares Outstanding 212,311 212,029 212,491 Three Months Ended Periods ended, (Unaudited) (In thousands) March 31, 2020 December 31, 2019 March 31, 2019 Reconciliation of Net Loss to EBITDA and Adjusted EBITDA Net Loss $ (160,423) $ (23,362) $ (739) Add: Income tax benefit (58,371) (4,096) (266) Interest expense 113 73 89 Depreciation and amortization 39,293 40,322 42,505 Less: Interest income 334 330 800 EBITDA $ (179,722) $ 12,607 $ 40,790 Add: Impairment and other charges 205,536 10,623 - Adjusted EBITDA $ 25,814 $ 23,230 $ 40,790 Three Months Ended Reconciliation of Operating Loss to Adjusted Operating Loss Operating Loss $ (218,707) $ (27,875) $ (2,161) Add: Impairment and other charges 205,536 10,623 - Adjusted Operating Loss $ (13,171) $ (17,252) $ (2,161)