Attached files
| file | filename |
|---|---|
| EX-99.1 - EXHIBIT 99.1 - HD Supply Holdings, Inc. | tm2020238d2_ex99-1.htm |
| 8-K - FORM 8-K - HD Supply Holdings, Inc. | tm2020238d2_8k.htm |
Exhibit 99.2
FINANCIAL RESULTS AND COMPANY OVERVIEW 2020 First - Quarter Performance June 9 th , 2020

2 Disclaimer Forward - Looking Statements and Preliminary Results This presentation includes “forward - looking statements” within the meaning of Section 27A of the Securities Act of 1933 and Sect ion 21E of the Securities Exchange Act of 1934. Forward - looking statements are based on management’s beliefs and assumptions and informatio n currently available to management and are subject to known and unknown risks and uncertainties, many of which may be beyond o ur control. We caution you that the forward - looking information presented in this presentation is not a guarantee of future results , and that actual results may differ materially from those made in or suggested by the forward - looking information contained in this presen tation. Forward - looking statements generally can be identified by the use of forward - looking terminology such as “may,” “plan,” “seek,” “comfortable with,” “will,” “expect,” “intend,” “estimate,” “anticipate,” “believe” or “continue” or the negative thereof or var iations thereon or similar terminology. A number of important factors could cause actual events to differ materially from those contained in or imp lied by the forward - looking statements, including, without limitation, the impact of the coronavirus disease 2019 outbreak (“COVID - 19”) on t he maintenance, repair and operations and specialty construction sectors, in general, and the financial position and operating r esu lts of our company, in particular, which cannot be predicted and could change rapidly and those “Risk factors” in our annual report on F orm 10 - K, for the fiscal year ended February 2, 2020, filed on March 17, 2020 and those described from time to time in our, and HD Supply, Inc .’s, other filings with the U.S. Securities and Exchange Commission (the “SEC”), which can be found at the SEC’s website www.sec.gov. An y forward - looking information presented herein is made only as of the date of this presentation, and we do not undertake any oblig ation to update or revise any forward - looking information to reflect changes in assumptions, the occurrence of unanticipated events, or o therwise. Estimates for May 2020 Net sales are preliminary estimates and are subject to risks and uncertainties, including, among other s, changes in connection with quarter - end adjustments. Any variation between HD Supply’s actual results and the preliminary financial data set forth herein may be material. Non - GAAP Financial Measures HD Supply supplements its financial results that are determined in accordance with accounting principles generally accepted i n t he United States of America (“GAAP”) with non - GAAP measurements, including Adjusted EBITDA, Adjusted net income, Adjusted net income per diluted share, Net debt and Free cash flow. This supplemental information should not be considered in isolation or as a subst itu te for the GAAP measurements presented herein. Additional information regarding Adjusted EBITDA, Adjusted net income, Adjusted net inco me per diluted share, Net debt, and Free cash flow referred to in this presentation is included at the end of this presentation unde r “ Capital Structure Overview” and “Reconciliation of Non - GAAP Measures.”

3 Q1’20 Overview Solid Start to the Quarter Before COVID - 19 Impact 1 See appendix slides 19 and 20 for a reconciliation of Adjusted EBITDA, Adjusted Net Income and Adjusted Net Income per Diluted Share to Net Income 2 Free Cash Flow is defined as LTM Operating Cash Flow $686M, Less Capital Expenditures $101M 3 As of May 3, 2020, our combined liquidity of approximately $797 million was comprised of $147 million in cash and cash equiva le nts and $650 million of additional available borrowings (excluding $85 million of borrowings on available cash balances) under our Senior ABL Facility, based on qualifying inventory and receivables Note : “VPY” denotes Versus Prior Year, “LTM” denotes Last Twelve Months ▪ 7% Net Sales Decline VPY ▪ 29% Operating Income Decline VPY ▪ 33% Net Income Decline VPY ▪ 20% Adjusted EBITDA 1 Decline VPY ▪ 29% Net Income per Diluted Share Decline VPY ▪ 20% (Legacy) Adjusted Net Income per Diluted Share 1 Decline VPY ▪ $585M LTM Free Cash Flow 2 ▪ Liquidity of $797M 3 ; $169M increase from Feb 2, 2020 Financial ▪ Deemed an Essential Business ▪ Robust Infection Control Action Plan ▪ Targeted Sourcing Improvements ▪ Community Support ▪ Pivot to Reopening Plan ▪ Separation Plan Commitment Operational

4 Facilities Maintenance: COVID - 19 Impact Health and Safety of Our Associates Remains a Priority ▪ No Disruption to Distribution Centers; Seamless Move to Working from Home; Improved Infection Controls in all Customer - Facing Locations ▪ Significant Impact to Performance Post Shelter - in - Place Orders ▪ Pervasive Headwinds to Business include: – Restriction on Economic Activity – Health Concerns – Disruption to Maintenance Schedules: Move to Emergency Maintenance Only – Changing Customer Needs ▪ Hospitality Vertical Significantly Impacted; Decline in Revenue per Available Room of Approximately 80 percent 1 1 Data from STR: "U.S. hotel performance for April 2020"

5 Sequential Declines in each Vertical in Q1, with Improvement in May Facilities Maintenance Vertical Performance 1 Gross Sales after Returns (GSAR) excludes customer rebates, discounts, and allowances GSAR 1 Versus Prior Year Multifamily; ~60% of FM Sales Hospitality; ~18% of FM Sales Healthcare; ~7% of FM Sales 4.7% 1.7% (25.5%) (7.7%) 4.2% (14.0%) (73.1%) (48.4%) 2.2% 7.6% (2.3%) (0.4%) Feb. Mar. Apr. May

6 Construction & Industrial : COVID - 19 Impact Construction Market Rebounding As States Reopen ▪ Shelter - in - Place Orders Impacted Construction Demand: Strong February Sales + 14.2% VPY ▪ Construction Deemed Essential in Majority of U.S. States ▪ California, Washington, Michigan, New York and New Jersey Markets Challenged ▪ Strength Across Central, Midwest, Southeast and Southwest Regions ▪ Home Improvement Solutions Outperformed Company Average ▪ Improved Sanitation Procedures in Branches; Closed Showrooms ▪ Sourcing Focus on Safety and Personal Protective Equipment ▪ Improved May Performance

7 ($ in millions, except per share data) Net Sales 1 See appendix slides 19 and 20 for a reconciliation of Adjusted EBITDA, Adjusted net income and Adjusted net income per dilute d s hare to Net income 6.6% Net Sales Decline in Q1’20 Q1’20 Financial Results $1,493 $1,395 Q1’19 VPY Q1’20 - $98 - 7% Gross Profit $585 $550 - 6% Gross Margin % 39.2% 39.4% +20 BPs Operating Income $170 $121 - 29% Op. Income % 11.4% 8.7% - 270 BPs Net Income $107 $72 - 33% Per Diluted Share $0.63 $0.45 - $0.18 Adj. EBITDA 1 $203 $163 - 20% Adj. EBITDA % 13.6% 11.7% - 190 BPs Adj. Net Income 1 $143 $108 - 24% Per Diluted Share 1 $0.84 $0.67 - $0.17

8 Managing Costs Through COVID - 19 Managing Cash Flow and Profitability ▪ Implemented Company - Wide Hiring Freeze ▪ Reduced Distribution Center and Branch Labor Hours ▪ CEO Voluntarily Waived Remaining 2020 Salary ▪ Independent Directors Waived 100% of Cash Board Retainer for Remainder of the Year ▪ Reduced Salaries for All Salaried Associates ▪ Eliminated or Deferred Discretionary Spending ▪ Reduced Planned Capital Expenditures ▪ Furloughed and Reduced Headcount ▪ Eliminated Travel in Q1’20
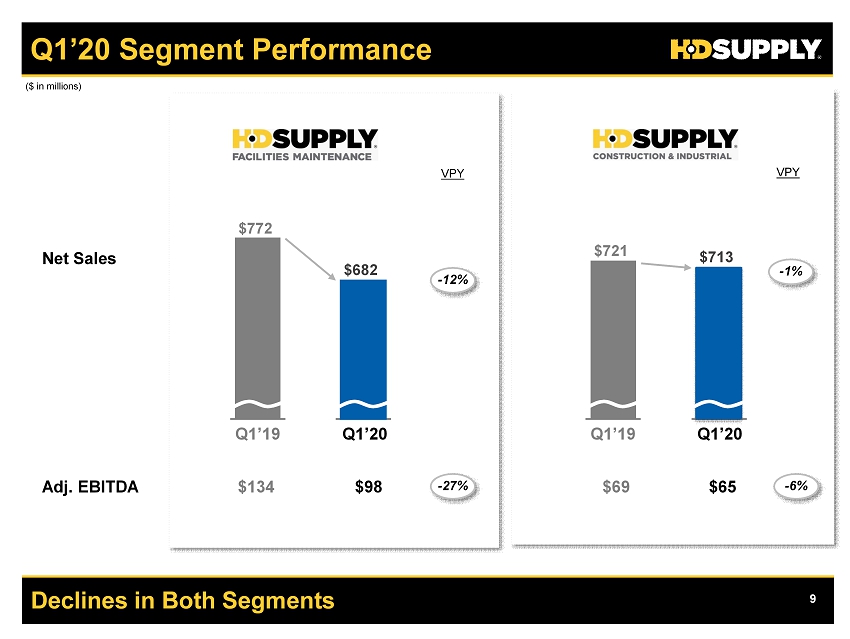
9 Declines in Both Segments Q1’20 Segment Performance Q1’20 Adj. EBITDA $98 $ 65 Net Sales Q1’19 $1 34 VPY - 12% - 27% VPY - 1% - 6% $ 69 Q1’20 Q1’19 $721 $713 $772 $682 organic ($ in millions)

10 Q1’20 Taxes, Cash Flow, and Capitalization ▪ Cash Taxes None in Q1’20 May and July Cash Tax Payments to be Made in Q2’20 ▪ $1,940 Net Debt 1 at the End of Q1’20 2.3x Net Debt to LTM Adj. EBITDA ▪ Free Cash Flow $116 in Q1’20 ▪ Capital Expenditures $21 in Q1’20 1 Reconciled on slide 16. “Net Debt” defined as Total Debt before unamortized deferred financing costs and discounts, plus lett er s of credit, less cash and cash equivalents 2 As of May 3, 2020, our combined liquidity of approximately $797 million was comprised of $147 million in cash and cash equiva len ts and $650 million of additional available borrowings (excluding $85 million of borrowings on available cash balances) under our Senior ABL Facility, based on qualifying inventory and receivables Drawn ABL includes $259 in ABL borrowings and $24 in Letters of Credit Strong Liquidity and No Significant Maturities until 2022 ($ in millions) ’20 ’21 ’22 ’23 ’24 ’25 ’26 ABL Commitment $1,000 $1,024 $750 $283 HD Supply Debt Maturities $11 $11 $1.0 billion ABL Revolver $1.1 billion Term Loan B $750 million Sr. Notes ▪ Liquidity - As of May 3, 2020 was $797 2 , +$169 as compared to Feb. 2, 2020 - No Significant Maturities until Apr. 2022 $11

11 7.3% Preliminary May Average Daily Sales Decline VPY Q1’20 Monthly Average Daily Sales (%) ’18 Selling Days Facilities Maintenance Construction & Industrial Prior Year HD Supply Net Sales HD Supply Average Daily Sales Growth VPY ’19 Selling Days Current Year Note: Contains forward - looking information; please see Disclaimer on slide 2 ’20 Selling Days ($ in millions) (31.9%) (13.0%) (13.4%) (1.4%) (0.4%) 25 20 20 1.4% (Preliminary) 0.5% (22.6%) 4.1% 14.2% 20 0.2% Feb. Apr. $472 $431 $462 $461 8.8% 6.1% Q1’20 (2.4%) 2.8% $464 7.9% 4.3% $610 6.0% 11.9% $460 6.0% 10.5% $423 25 19 20 20 25 19 20 20 Q2’20 (7.3%) 8.6% organic Mar. 8.1% 8.8% 2.2% organic May

12 Change to Adjusted Net income per Share Definition ▪ No Formal Guidance; Commitment to Long - term Mid - Single Digit Sales Growth in Both Businesses ▪ Change to Adjusted Net Income per Share Definition 1 From Q2’20 Onwards - Closer to GAAP and More Consistent with Peer Group - Legacy Adjusted Net Income Definition Adjusted for Federal Net Operating Loss Carryforwards and Significant Amortization of Acquired Intangible Assets (Other Than Software) - No Adjustment for Taxes Under New Definition - Amortization of Acquired Intangible Assets Will Not be Added Back Under the New Definition - Unusual and Non - recurring Items Will Continue to be Added Back and Will be Tax Affected Guidance on Hold Due to COVID - 19 Uncertainty 1 Fully reconciled on slide 21

13 Q&A Q&A

14 Concluding Remarks Priority is Health and Safety of our Associates and Customers ▪ Strong Start to Q1’20 Disrupted by COVID - 19 Impact ▪ No Q2’20 or 2020 Guidance Provided at this Time ▪ Prudently Resuming Operations Interrupted or Impacted by COVID - 19 ▪ Priority Continues to be the Health and Safety of our Communities

15 Q&A APPENDIX

16 2.3x Net Debt to LTM Adjusted EBITDA Capital Structure Overview Debt as of May 3, 2020 Senior ABL Facility Term B - 5 Loans Oct. 2018 Senior Unsecured Notes Outstanding Debt 4 Less: Cash and Cash Equivalents Net Debt Balance Maturity 1 Represents the stated rate of interest, without including the effect of discounts or interest rate swaps 2 Subject to applicable redemption price terms 3 Ratings per Moody’s Investor’s Service (“Moody’s”) and S&P Global Ratings (“S&P”). Corporate family ratings shown for Outsta nd ing Debt. 4 Excludes unamortized discounts of $2 and unamortized deferred financing costs of $17 ($ in millions) Interest Rate 1 Soft Call Date 2 2.08% 2.15% 5.375% 4/5/ 22 10/17/ 23 10/15/ 26 n/a Now 10/15/ 21 Plus: Letters of Credit $259 750 $1,940 (147) $2,063 1,054 24 Moody’s / S&P 3 Not Rated, BBB – Ba1, BBB – Ba2, BB – Ba1 Stable, BB+ Stable

17 0.2% 1.9% 2.1% 1.6% 2.6% 1.7% 2.5% (6.8%) 12.7% 8.8% 0.5% (22.6%) (7.3%) May Jun. Jul. Aug. Sep. Oct. Nov. Dec. Jan. Feb. Mar. Apr. May 7.3% Preliminary Average Daily Sales Decline VPY in May Average Daily Sales – Organic 1 (VPY%) (Preliminary) Facil . Maint . Const. & Ind. HD Supply Organic Average Daily Sales (“ADS”) Growth VPY 1 (VPY%) 1 Adjusted for acquisitions and selling days, but not the 53 rd week in FY’18 2 Contains an extra selling week as compared with other years. Fiscal 2018 contains 53 weeks Note: Contains forward - looking information; please see Disclaimer on slide 2 FY’19 ’20 Selling Days ’19 Selling Days ’18 Selling Days FY’20 (2.4%) 2.2% 3.0% 1.2% 1.7% 2.7% 2.5% (4.9%) 9.6% 4.1% (0.4%) (31.9%) (13.4%) 2.8% 1.7% 1.0% 2.0% 3.5% 0.6% 2.4% (8.6%) 16.1% 14.2% 1.4% (13.0%) (1.4%) 19 20 24 20 19 25 18 19 24 20 20 25 19 19 20 24 20 19 25 18 19 24 20 20 25 19 20 19 24 20 19 25 18 20 28 2 20 20 25 20 Dec. Apr. May

18 $431M Preliminary May Sales Monthly Net Sales ($) (Preliminary) Facil . Maint . Const. & Ind. ’20 Selling Days ’19 Selling Days ’18 Selling Days organic HD Supply Net Sales ($ in millions) 1 Contains an extra selling week as compared with other years. Fiscal 2018 contains 53 weeks Note: Contains forward - looking information; please see Disclaimer on slide 2 FY’20 FY’19 $464 $521 $639 $521 $494 $629 $436 $403 $546 $461 $462 $472 $431 May Jun. Jul. Aug. Sep. Oct. Nov. Dec. Jan. Feb. Mar. Apr. May $228 $268 $334 $266 $249 $311 $216 $205 $281 $235 $236 $211 $198 $237 $253 $305 $255 $245 $318 $221 $198 $266 $226 $226 $261 $234 19 20 24 20 19 25 18 19 24 20 20 25 19 19 20 24 20 19 25 18 19 24 20 20 25 19 20 19 24 20 19 25 18 20 28 1 20 20 25 20

19 Reconciliation of Non - GAAP Measures: Net Income to Adjusted Net Income and Adjusted Net Income Per Share ($ in millions, except share and per share amounts) 1 Represents the costs related to separation activities and personnel changes, primarily severance and other employee - related cos ts. For the three months ended May 5, 2019, the Company recognized a favorable termination of the lease for its former corporate headquarters 2 Represents the costs incurred in the acquisition and integration of business acquisitions, including A.H. Harris Construction Su pplies Three Months Ended May 3, 2020 May 5, 2019 Net income $72 $107 Provision for income taxes 24 35 Cash paid for income taxes - (4) Amortization of acquisition - related intangible assets (other than software) 6 6 Restructuring and separation charges 1 6 (2) Acquisition and integration costs 2 - 1 Adjusted Net Income $108 $143 Weighted average common shares outstanding (in thousands) Basic 160,830 170,000 Diluted 161,190 170,712 Adjusted Net Income Per Share - Basic $0.67 $0.84 Adjusted Net Income Per Share - Diluted $0.67 $0.84

20 Reconciliation of Non - GAAP Measures: Net Income to Adjusted EBITDA ($ in millions) 1 Depreciation and amortization includes amounts recorded within Cost of sales in the Consolidated Statements of Operations 2 Represents the costs related to separation activities and personnel changes, primarily severance and other employee - related costs. For the three months ended May 5, 2019, the Company recognized a favorable termination of the lease for its former corporate headquarters 3 Represents the costs incurred in the acquisition and integration of business acquisitions, including A.H. Harris Construction Su pplies Three Months Ended May 3, 2020 May 5, 2019 Net income $72 $107 Interest expense, net 25 28 Provision for income taxes 24 35 Depreciation and amortization 1 29 27 Restructuring and separation charges 2 6 (2) Stock - based compensation 7 7 Acquisition and integration costs 3 - 1 Adjusted EBITDA $163 $203

21 Reconciliation of Non - GAAP Measures: Net Income to Adjusted Net Income and Adjusted Net Income Per Share 1 Represents the costs incurred for separation activities and strategic alignment of workforce 2 Represents the Represents the loss on extinguishment of debt, including the premium paid to repurchase or call the debt, as w el l as the write - off of unamortized deferred financing costs, original issue discount, and other assets or liabilities associated with such debt. Also includes the costs of debt modifications 3 Represents the costs incurred in the acquisition and integration of business acquisitions, including A.H. Harris Construction Supplies 4 Tax expense calculated using the U.S. combined federal and state statutory rates ($ in millions, except share and per share amounts) REVISED ADJUSTED NET INCOME Net income Income from discontinued operations, net of tax Income from continuing operations Restructuring and separation charges 1 Loss on extinguishment & modification of debt 2 Acquisition and integration costs 3 Tax expense on adjustments 4 Adjusted Net Income Weighted - average common shares outstanding (in thousands) Basic Diluted Adjusted Net Income Per Share - Basic Adjusted Net Income Per Share - Diluted PREVIOUSLY REPORTED ADJUSTED NET INCOME Net income Income from discontinued operations, net of tax Income from continuing operations Provision for income taxes Cash paid for income taxes Amortization of acquisition - related intangible assets (other than software) Restructuring and separation charges 1 Loss on extinguishment & modification of debt 2 Acquisition and integration costs 3 Adjusted Net Income Adjusted Net Income Per Share - Basic Adjusted Net Income Per Share - Diluted Fiscal 2018 Fiscal 2019 Fiscal 2020 Q1 - 18 Q2 - 18 Q3 - 18 Q4 - 18 YTD Q1 - 19 Q2 - 19 Q3 - 19 Q4 - 19 YTD Q1 - 20 $89 $131 $82 $92 $394 $107 $135 $132 $78 $452 $72 -- 1 -- 2 3 -- -- 1 -- -- 89 130 82 90 391 107 135 131 78 451 72 7 2 9 (2) 4 6 6 69 69 2 1 2 1 6 1 4 (2) (1) (18) (21) (2) (2) (1) $96 $132 $135 $91 $454 $106 $135 $137 $82 $461 $77 184,326 182,992 182,730 174,831 181,099 170,000 169,546 164,638 161,436 166,405 160,830 185,155 183,822 183,579 175,593 181,929 170,712 170,057 165,142 162,040 166,989 161,190 $0.52 $0.72 $0.74 $0.52 $2.51 $0.62 $0.80 $0.83 $0.51 $2.77 $0.48 $0.52 $0.72 $0.74 $0.52 $2.50 $0.62 $0.79 $0.83 $0.51 $2.76 $0.48 Fiscal 2018 Fiscal 2019 Fiscal 2020 Q1 - 18 Q2 - 18 Q3 - 18 Q4 - 18 YTD Q1 - 19 Q2 - 19 Q3 - 19 Q4 - 19 YTD Q1 - 20 $89 $131 $82 $92 $394 $107 $135 $132 $78 $452 $72 -- 1 -- 2 3 -- -- 1 -- -- 89 130 82 90 391 107 135 131 78 451 72 29 46 30 30 135 35 48 47 32 162 24 (2) (3) (4) (4) (13) (4) (6) (25) (18) (53) -- 5 6 5 6 22 6 6 5 6 7 2 -- -- 9 (2) -- 4 6 -- -- 69 -- 69 -- -- -- -- 2 1 2 1 6 1 -- 4 6 6 -- -- -- $130 $182 $184 $123 $619 $143 $183 $166 $104 $596 $108 $0.71 $0.99 $1.01 $0.70 $3.42 $0.84 $1.08 $1.01 $0.64 $3.58 $0.67 $0.70 $0.99 $1.00 $0.70 $3.40 $0.84 $1.08 $1.01 $0.64 $3.57 $0.67 23 8 -- 5 -- -- -- -- -- -- -- -- -- -- -- 8 -- 5 -- -- -- -- (3) -- --