Attached files
| file | filename |
|---|---|
| 8-K - FORM 8-K - CITIZENS FINANCIAL GROUP INC/RI | d938021d8k.htm |

Morgan Stanley Financials Conference June 9, 2020 Brendan Coughlin Head of Consumer Banking Exhibit 99.1
Forward-looking statements and use of key performance metrics and non-GAAP financial measures Forward-Looking Statements. This document contains forward-looking statements within the meaning of Private Securities Litigation Reform Act of 1995. Statements regarding potential future share repurchases and future dividends, as well as the potential effects of the COVID-19 pandemic on our business, operations, financial performance and prospects, are forward-looking statements. Also, any statement that does not describe historical or current facts is a forward-looking statement. These statements often include the words “believes,” “expects,” “anticipates,” “estimates,” “intends,” “plans,” “goals,” “targets,” “initiatives,” “potentially,” “probably,” “projects,” “outlook” or similar expressions or future conditional verbs such as “may,” “will,” “should,” “would,” and “could.” Forward-looking statements are based upon the current beliefs and expectations of management, and on information currently available to management. Our statements speak as of the date hereof, and we do not assume any obligation to update these statements or to update the reasons why actual results could differ from those contained in such statements in light of new information or future events. We caution you, therefore, against relying on any of these forward-looking statements. They are neither statements of historical fact nor guarantees or assurances of future performance. While there is no assurance that any list of risks and uncertainties or risk factors is complete, important factors that could cause actual results to differ materially from those in the forward-looking statements include the following, without limitation: Negative economic and political conditions that adversely affect the general economy, housing prices, the job market, consumer confidence and spending habits which may affect, among other things, the level of nonperforming assets, charge-offs and provision expense; The rate of growth in the economy and employment levels, as well as general business and economic conditions, and changes in the competitive environment; Our ability to implement our business strategy, including the cost savings and efficiency components, and achieve our financial performance goals; The COVID-19 pandemic and its effects on the economic and business environments in which we operate; Our ability to meet heightened supervisory requirements and expectations; Liabilities and business restrictions resulting from litigation and regulatory investigations; Our capital and liquidity requirements (including under regulatory capital standards, such as the U.S. Basel III capital rules) and our ability to generate capital internally or raise capital on favorable terms; The effect of changes in interest rates on our net interest income, net interest margin and our mortgage originations, mortgage servicing rights and mortgages held for sale; Changes in interest rates and market liquidity, as well as the magnitude of such changes, which may reduce interest margins, impact funding sources and affect the ability to originate and distribute financial products in the primary and secondary markets; The effect of changes in the level of checking or savings account deposits on our funding costs and net interest margin; Financial services reform and other current, pending or future legislation or regulation that could have a negative effect on our revenue and businesses; A failure in or breach of our operational or security systems or infrastructure, or those of our third party vendors or other service providers, including as a result of cyber-attacks; and Management’s ability to identify and manage these and other risks. In addition to the above factors, we also caution that the actual amounts and timing of any future common stock dividends or share repurchases will be subject to various factors, including our capital position, financial performance, capital impacts of strategic initiatives, market conditions, and regulatory and accounting considerations, as well as any other factors that our Board of Directors deems relevant in making such a determination. Therefore, there can be no assurance that we will repurchase shares or pay any dividends to holders of our common stock, or as to the amount of any such repurchases or dividends. Further, statements about the effects of the COVID-19 pandemic on our business, operations, financial performance and prospects may constitute forward-looking statements and are subject to the risk that the actual impacts may differ, possibly materially, from what is reflected in those forward-looking statements due to factors and future developments that are uncertain, unpredictable and in many cases beyond our control, including the scope and duration of the pandemic, actions taken by governmental authorities in response to the pandemic, and the direct and indirect impact of the pandemic on our customers, third parties and us. More information about factors that could cause actual results to differ materially from those described in the forward-looking statements can be found under “Risk Factors” in our Annual Report on Form 10-K for the year ended December 31, 2019 and our Quarterly Report on Form 10-Q for the period ending March 31, 2020. Key Performance Metrics and Non-GAAP Financial Measures and Reconciliations Key Performance Metrics: Our Management uses certain key performance metrics (KPMs) to gauge our progress against strategic and operational goals, as well as to compare our performance against peers. The KPMs are referred to in our Registration Statements on Form S-1 and our external financial reports filed with the Securities and Exchange Commission. The KPMs include: Return on average tangible common equity (ROTCE); Efficiency ratio; Operating leverage; and Common equity tier 1 capital ratio. Established targets for the KPMs are based on Management-reporting results which are currently referred to by the Company as “Underlying” results. In historical periods, these results may have been referred to as “Adjusted” or “Adjusted/Underlying” results. We believe that Underlying results, which exclude notable items, provide the best representation of our underlying financial progress toward the KPMs as the results exclude items that our Management does not consider indicative of our on-going financial performance. We have consistently shown investors our KPMs on a Management-reporting basis since our initial public offering in September of 2014. KPMs that reflect Underlying results are considered non-GAAP financial measures. Non-GAAP Financial Measures: This document contains non-GAAP financial measures denoted as Underlying results and Underlying excluding the impact of COVID-19 on the provision for credit losses. In historical periods, these results may have been referred to as Adjusted or Adjusted/Underlying results. Underlying results for any given reporting period exclude certain items that may occur in that period which Management does not consider indicative of the Company’s on-going financial performance. We believe these non-GAAP financial measures provide useful information to investors because they are used by our Management to evaluate our operating performance and make day-to-day operating decisions. In addition, we believe our Underlying results in any given reporting period reflect our on-going financial performance in that period and, accordingly, are useful to consider in addition to our GAAP financial results. We further believe the presentation of Underlying results increases comparability of period-to-period results. The Appendix presents reconciliations of our non-GAAP measures to the most directly comparable GAAP financial measures. Underlying excluding the impact of COVID-19 on the provision for credit losses reflects information valuable to investors given the outsized impact of the pandemic which is not expected to have a similar ongoing impact to our results given the timing of the impact of adoption of CECL and the unprecedented nature of the COVID-19 pandemic. Other companies may use similarly titled non-GAAP financial measures that are calculated differently from the way we calculate such measures. Accordingly, our non-GAAP financial measures may not be comparable to similar measures used by such companies. We caution investors not to place undue reliance on such non-GAAP financial measures, but to consider them with the most directly comparable GAAP measures. Non-GAAP financial measures have limitations as analytical tools and should not be considered in isolation or as a substitute for our results reported under GAAP.
Key messages Making strong progress across key Consumer Banking initiatives, with clear momentum and opportunities to improve performance Helping customers navigate current challenges Retail portfolio is highly diversified with a strong super-prime/prime credit profile and currently holding up well Accelerating digitization efforts as COVID-19 drives rapid changes in customer behavior Setting a long-term vision to position CFG to win in a digital world Building a top-performing Consumer Bank focused on helping customers along life’s journey
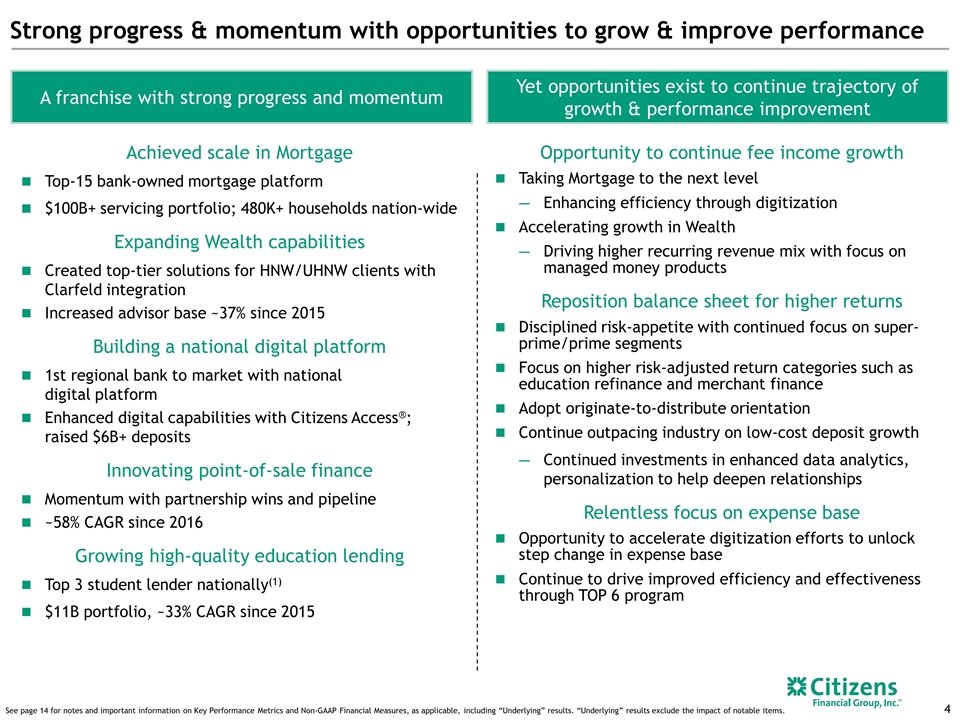
Strong progress & momentum with opportunities to grow & improve performance Opportunity to continue fee income growth Taking Mortgage to the next level Enhancing efficiency through digitization Accelerating growth in Wealth Driving higher recurring revenue mix with focus on managed money products Reposition balance sheet for higher returns Disciplined risk-appetite with continued focus on super-prime/prime segments Focus on higher risk-adjusted return categories such as education refinance and merchant finance Adopt originate-to-distribute orientation Continue outpacing industry on low-cost deposit growth Continued investments in enhanced data analytics, personalization to help deepen relationships Relentless focus on expense base Opportunity to accelerate digitization efforts to unlock step change in expense base Continue to drive improved efficiency and effectiveness through TOP 6 program A franchise with strong progress and momentum Yet opportunities exist to continue trajectory of growth & performance improvement Achieved scale in Mortgage Top-15 bank-owned mortgage platform $100B+ servicing portfolio; 480K+ households nation-wide Expanding Wealth capabilities Created top-tier solutions for HNW/UHNW clients with Clarfeld integration Increased advisor base ~37% since 2015 Building a national digital platform 1st regional bank to market with national digital platform Enhanced digital capabilities with Citizens Access®; raised $6B+ deposits Innovating point-of-sale finance Momentum with partnership wins and pipeline ~58% CAGR since 2016 Growing high-quality education lending Top 3 student lender nationally(1) $11B portfolio, ~33% CAGR since 2015 See page 14 for notes and important information on Key Performance Metrics and Non-GAAP Financial Measures, as applicable, including “Underlying” results. “Underlying” results exclude the impact of notable items.
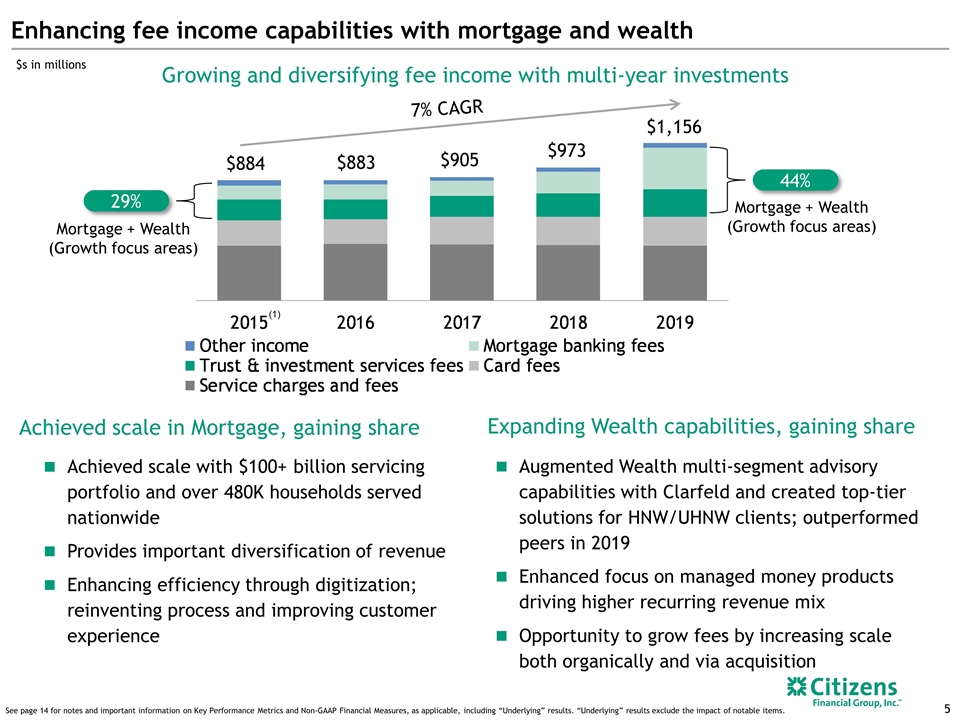
Growing and diversifying fee income with multi-year investments Achieved scale in Mortgage, gaining share Expanding Wealth capabilities, gaining share $s in millions Mortgage + Wealth (Growth focus areas) 7% CAGR Enhancing fee income capabilities with mortgage and wealth $883 $884 $905 $973 $1,156 Augmented Wealth multi-segment advisory capabilities with Clarfeld and created top-tier solutions for HNW/UHNW clients; outperformed peers in 2019 Enhanced focus on managed money products driving higher recurring revenue mix Opportunity to grow fees by increasing scale both organically and via acquisition Achieved scale with $100+ billion servicing portfolio and over 480K households served nationwide Provides important diversification of revenue Enhancing efficiency through digitization; reinventing process and improving customer experience Mortgage + Wealth (Growth focus areas) See page 14 for notes and important information on Key Performance Metrics and Non-GAAP Financial Measures, as applicable, including “Underlying” results. “Underlying” results exclude the impact of notable items. (1) 44% 29%
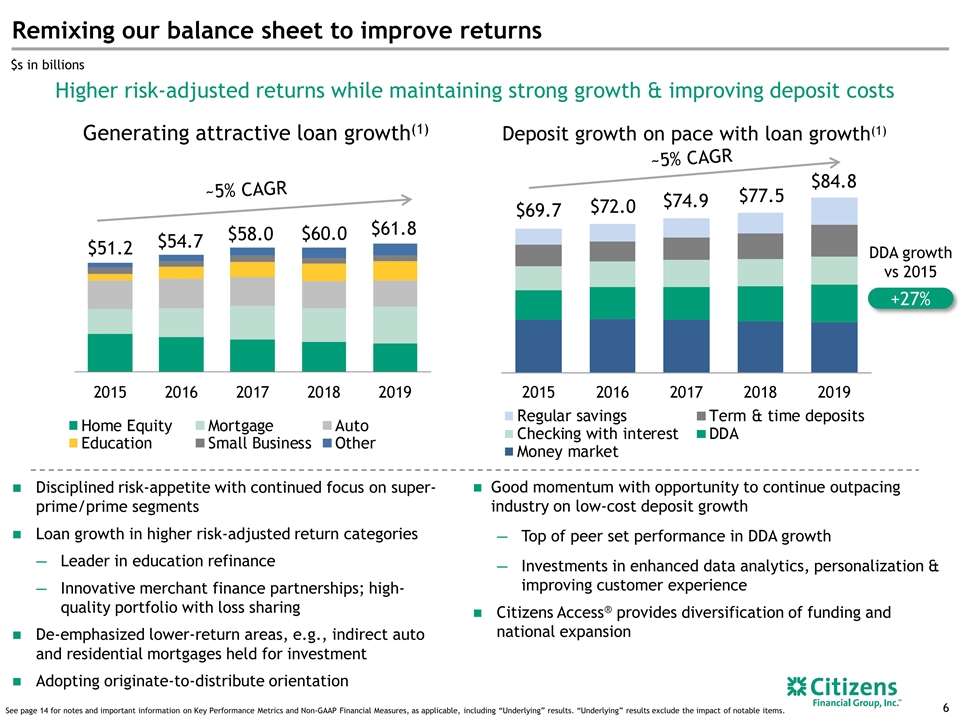
Remixing our balance sheet to improve returns Disciplined risk-appetite with continued focus on super-prime/prime segments Loan growth in higher risk-adjusted return categories Leader in education refinance Innovative merchant finance partnerships; high-quality portfolio with loss sharing De-emphasized lower-return areas, e.g., indirect auto and residential mortgages held for investment Adopting originate-to-distribute orientation Good momentum with opportunity to continue outpacing industry on low-cost deposit growth Top of peer set performance in DDA growth Investments in enhanced data analytics, personalization & improving customer experience Citizens Access® provides diversification of funding and national expansion Deposit growth on pace with loan growth(1) ~5% CAGR Generating attractive loan growth(1) $72.0 $69.7 $74.9 $77.5 ~5% CAGR $s in billions $51.2 $54.7 $60.0 $58.0 $61.8 $84.8 See page 14 for notes and important information on Key Performance Metrics and Non-GAAP Financial Measures, as applicable, including “Underlying” results. “Underlying” results exclude the impact of notable items. DDA growth vs 2015 +27% Higher risk-adjusted returns while maintaining strong growth & improving deposit costs
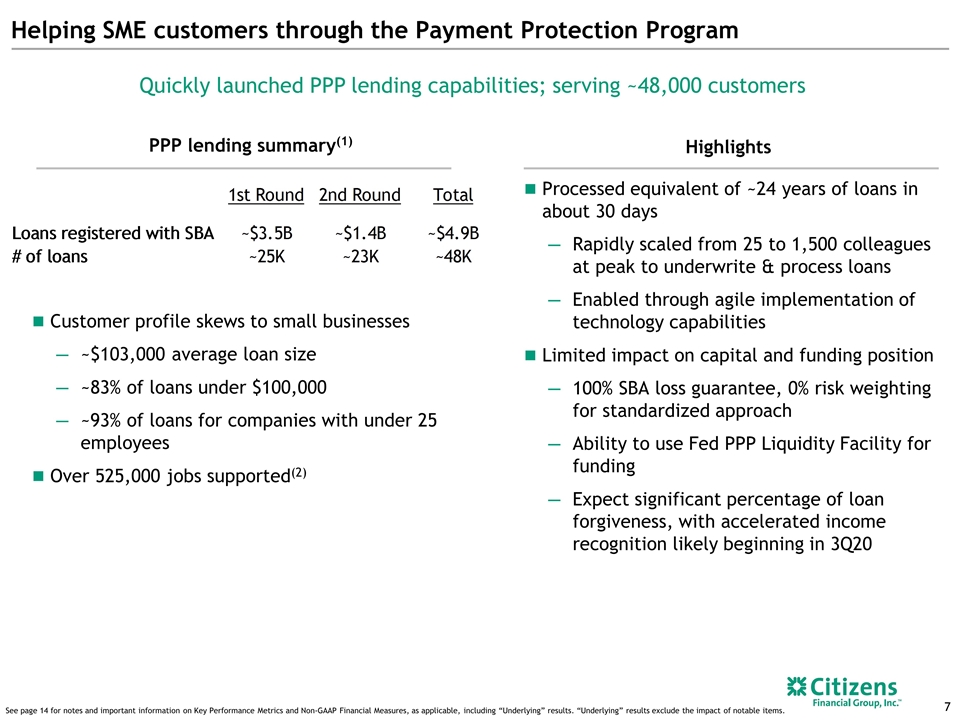
Helping SME customers through the Payment Protection Program Processed equivalent of ~24 years of loans in about 30 days Rapidly scaled from 25 to 1,500 colleagues at peak to underwrite & process loans Enabled through agile implementation of technology capabilities Limited impact on capital and funding position 100% SBA loss guarantee, 0% risk weighting for standardized approach Ability to use Fed PPP Liquidity Facility for funding Expect significant percentage of loan forgiveness, with accelerated income recognition likely beginning in 3Q20 Quickly launched PPP lending capabilities; serving ~48,000 customers Highlights PPP lending summary(1) Customer profile skews to small businesses ~$103,000 average loan size ~83% of loans under $100,000 ~93% of loans for companies with under 25 employees Over 525,000 jobs supported(2) See page 14 for notes and important information on Key Performance Metrics and Non-GAAP Financial Measures, as applicable, including “Underlying” results. “Underlying” results exclude the impact of notable items.
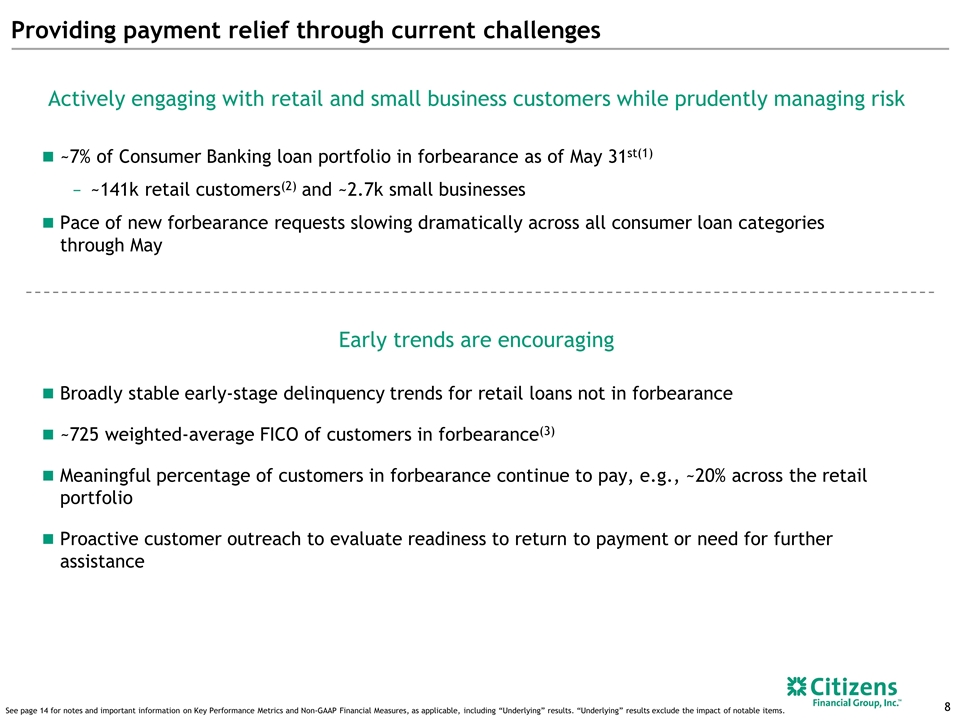
Providing payment relief through current challenges ~7% of Consumer Banking loan portfolio in forbearance as of May 31st(1) ~141k retail customers(2) and ~2.7k small businesses Pace of new forbearance requests slowing dramatically across all consumer loan categories through May Actively engaging with retail and small business customers while prudently managing risk Broadly stable early-stage delinquency trends for retail loans not in forbearance ~725 weighted-average FICO of customers in forbearance(3) Meaningful percentage of customers in forbearance continue to pay, e.g., ~20% across the retail portfolio Proactive customer outreach to evaluate readiness to return to payment or need for further assistance Early trends are encouraging See page 14 for notes and important information on Key Performance Metrics and Non-GAAP Financial Measures, as applicable, including “Underlying” results. “Underlying” results exclude the impact of notable items.
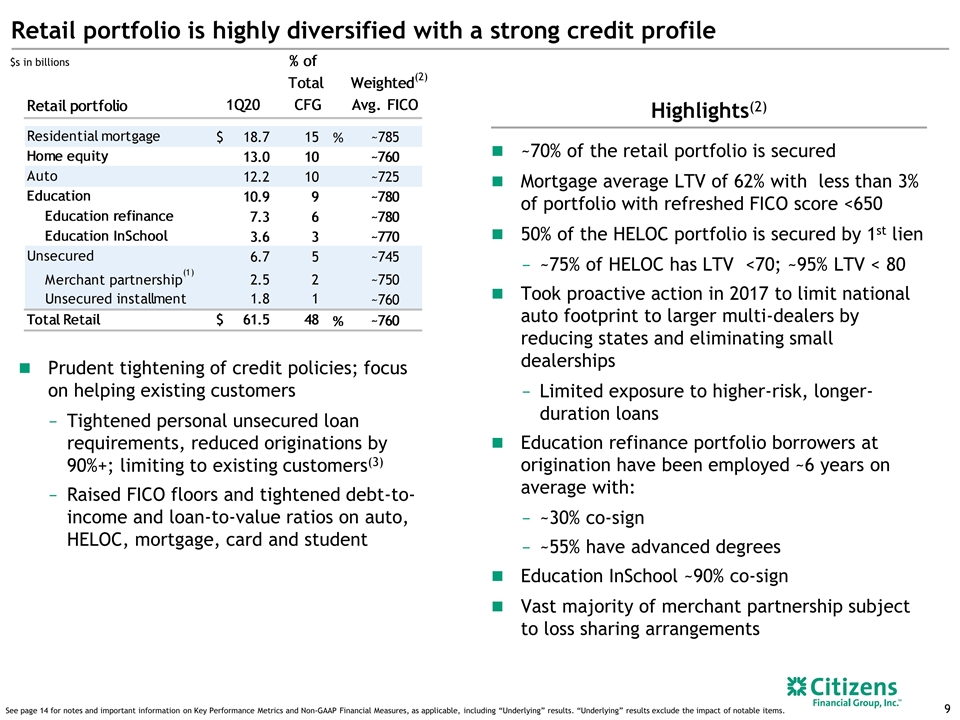
Retail portfolio is highly diversified with a strong credit profile Highlights(2) $s in billions ~70% of the retail portfolio is secured Mortgage average LTV of 62% with less than 3% of portfolio with refreshed FICO score <650 50% of the HELOC portfolio is secured by 1st lien ~75% of HELOC has LTV <70; ~95% LTV < 80 Took proactive action in 2017 to limit national auto footprint to larger multi-dealers by reducing states and eliminating small dealerships Limited exposure to higher-risk, longer- duration loans Education refinance portfolio borrowers at origination have been employed ~6 years on average with: ~30% co-sign ~55% have advanced degrees Education InSchool ~90% co-sign Vast majority of merchant partnership subject to loss sharing arrangements See page 14 for notes and important information on Key Performance Metrics and Non-GAAP Financial Measures, as applicable, including “Underlying” results. “Underlying” results exclude the impact of notable items. Prudent tightening of credit policies; focus on helping existing customers Tightened personal unsecured loan requirements, reduced originations by 90%+; limiting to existing customers(3) Raised FICO floors and tightened debt-to-income and loan-to-value ratios on auto, HELOC, mortgage, card and student (2)
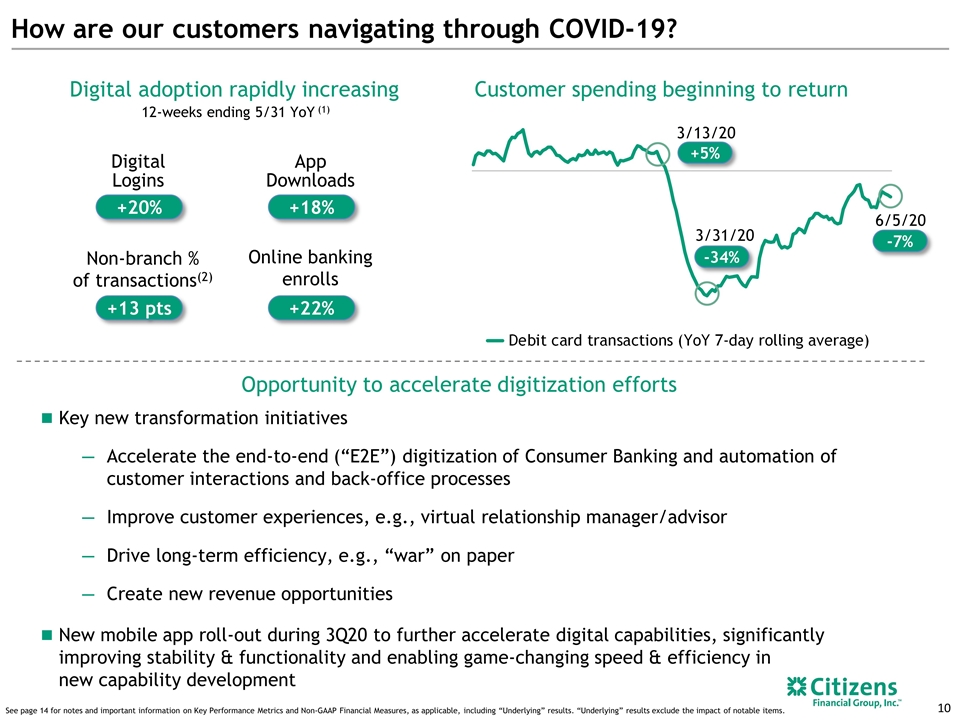
How are our customers navigating through COVID-19? Digital adoption rapidly increasing Customer spending beginning to return Digital Logins +20% App Downloads +18% Online banking enrolls +22% Non-branch % of transactions(2) +13 pts Branch visits declining at an even faster rate Key new transformation initiatives Accelerate the end-to-end (“E2E”) digitization of Consumer Banking and automation of customer interactions and back-office processes Improve customer experiences, e.g., virtual relationship manager/advisor Drive long-term efficiency, e.g., “war” on paper Create new revenue opportunities New mobile app roll-out during 3Q20 to further accelerate digital capabilities, significantly improving stability & functionality and enabling game-changing speed & efficiency in new capability development Opportunity to accelerate digitization efforts 3/13/20 3/31/20 6/5/20 +5% -34% -7% 12-weeks ending 5/31 YoY (1) See page 14 for notes and important information on Key Performance Metrics and Non-GAAP Financial Measures, as applicable, including “Underlying” results. “Underlying” results exclude the impact of notable items.
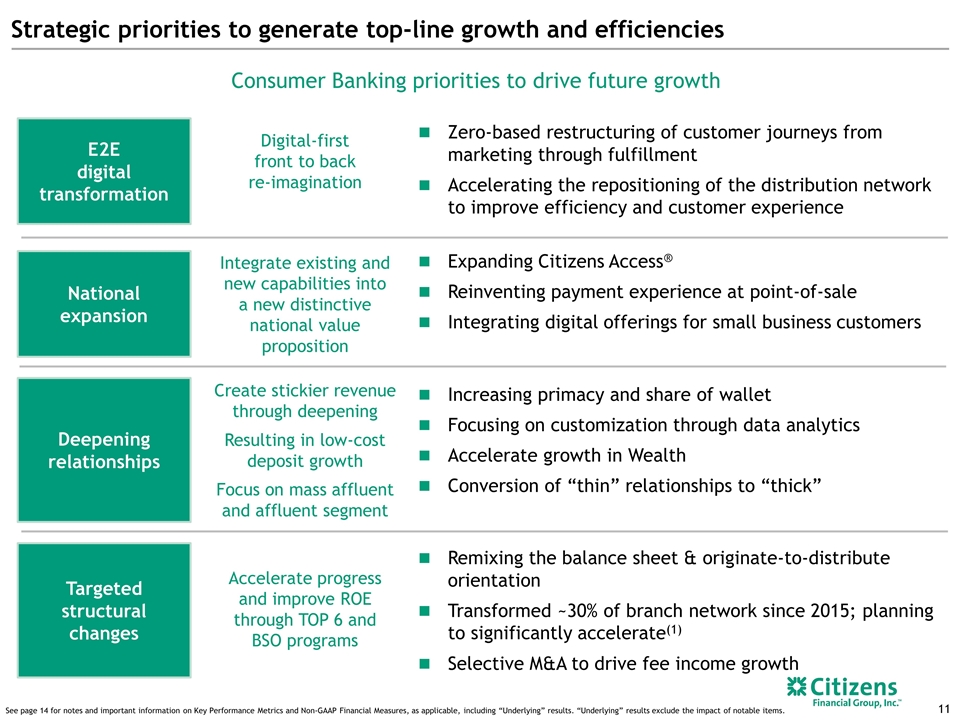
Strategic priorities to generate top-line growth and efficiencies Consumer Banking priorities to drive future growth Digital-first front to back re-imagination Zero-based restructuring of customer journeys from marketing through fulfillment Accelerating the repositioning of the distribution network to improve efficiency and customer experience E2E digital transformation Integrate existing and new capabilities into a new distinctive national value proposition Expanding Citizens Access® Reinventing payment experience at point-of-sale Integrating digital offerings for small business customers National expansion Create stickier revenue through deepening Resulting in low-cost deposit growth Focus on mass affluent and affluent segment Increasing primacy and share of wallet Focusing on customization through data analytics Accelerate growth in Wealth Conversion of “thin” relationships to “thick” Deepening relationships Accelerate progress and improve ROE through TOP 6 and BSO programs Remixing the balance sheet & originate-to-distribute orientation Transformed ~30% of branch network since 2015; planning to significantly accelerate(1) Selective M&A to drive fee income growth Targeted structural changes See page 14 for notes and important information on Key Performance Metrics and Non-GAAP Financial Measures, as applicable, including “Underlying” results. “Underlying” results exclude the impact of notable items.
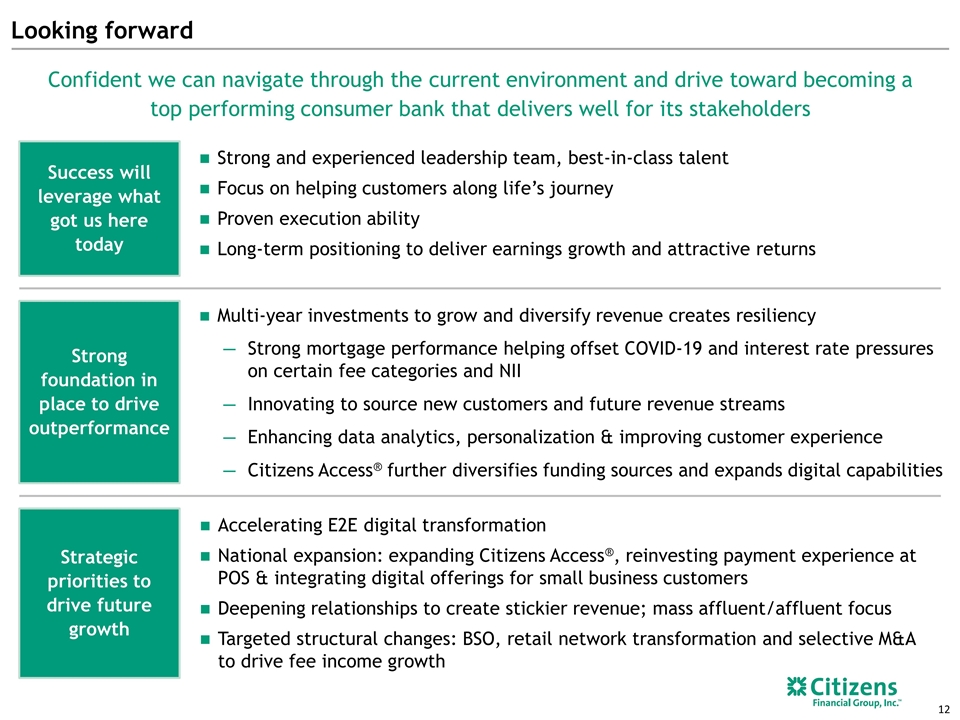
Looking forward Success will leverage what got us here today Strong and experienced leadership team, best-in-class talent Focus on helping customers along life’s journey Proven execution ability Long-term positioning to deliver earnings growth and attractive returns Confident we can navigate through the current environment and drive toward becoming a top performing consumer bank that delivers well for its stakeholders Strong foundation in place to drive outperformance Multi-year investments to grow and diversify revenue creates resiliency Strong mortgage performance helping offset COVID-19 and interest rate pressures on certain fee categories and NII Innovating to source new customers and future revenue streams Enhancing data analytics, personalization & improving customer experience Citizens Access® further diversifies funding sources and expands digital capabilities Strategic priorities to drive future growth Accelerating E2E digital transformation National expansion: expanding Citizens Access®, reinvesting payment experience at POS & integrating digital offerings for small business customers Deepening relationships to create stickier revenue; mass affluent/affluent focus Targeted structural changes: BSO, retail network transformation and selective M&A to drive fee income growth

Appendix
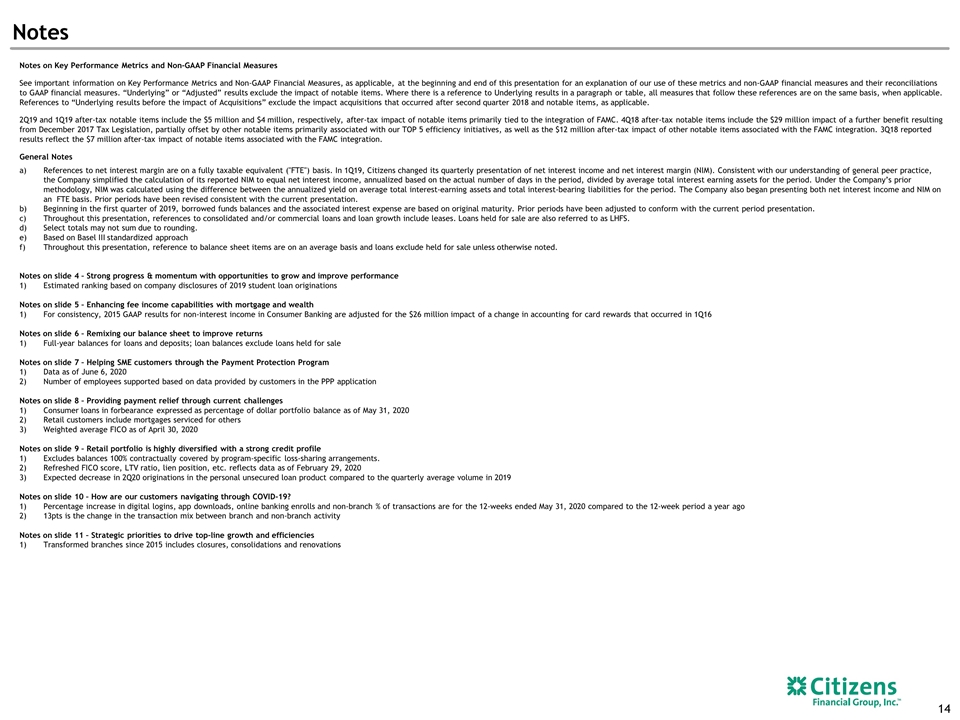
Notes Notes on Key Performance Metrics and Non-GAAP Financial Measures See important information on Key Performance Metrics and Non-GAAP Financial Measures, as applicable, at the beginning and end of this presentation for an explanation of our use of these metrics and non-GAAP financial measures and their reconciliations to GAAP financial measures. “Underlying” or “Adjusted” results exclude the impact of notable items. Where there is a reference to Underlying results in a paragraph or table, all measures that follow these references are on the same basis, when applicable. References to “Underlying results before the impact of Acquisitions” exclude the impact acquisitions that occurred after second quarter 2018 and notable items, as applicable. 2Q19 and 1Q19 after-tax notable items include the $5 million and $4 million, respectively, after-tax impact of notable items primarily tied to the integration of FAMC. 4Q18 after-tax notable items include the $29 million impact of a further benefit resulting from December 2017 Tax Legislation, partially offset by other notable items primarily associated with our TOP 5 efficiency initiatives, as well as the $12 million after-tax impact of other notable items associated with the FAMC integration. 3Q18 reported results reflect the $7 million after-tax impact of notable items associated with the FAMC integration. General Notes References to net interest margin are on a fully taxable equivalent ("FTE") basis. In 1Q19, Citizens changed its quarterly presentation of net interest income and net interest margin (NIM). Consistent with our understanding of general peer practice, the Company simplified the calculation of its reported NIM to equal net interest income, annualized based on the actual number of days in the period, divided by average total interest earning assets for the period. Under the Company’s prior methodology, NIM was calculated using the difference between the annualized yield on average total interest-earning assets and total interest-bearing liabilities for the period. The Company also began presenting both net interest income and NIM on an FTE basis. Prior periods have been revised consistent with the current presentation. Beginning in the first quarter of 2019, borrowed funds balances and the associated interest expense are based on original maturity. Prior periods have been adjusted to conform with the current period presentation. Throughout this presentation, references to consolidated and/or commercial loans and loan growth include leases. Loans held for sale are also referred to as LHFS. Select totals may not sum due to rounding. Based on Basel III standardized approach Throughout this presentation, reference to balance sheet items are on an average basis and loans exclude held for sale unless otherwise noted. Notes on slide 4 – Strong progress & momentum with opportunities to grow and improve performance Estimated ranking based on company disclosures of 2019 student loan originations Notes on slide 5 – Enhancing fee income capabilities with mortgage and wealth For consistency, 2015 GAAP results for non-interest income in Consumer Banking are adjusted for the $26 million impact of a change in accounting for card rewards that occurred in 1Q16 Notes on slide 6 – Remixing our balance sheet to improve returns Full-year balances for loans and deposits; loan balances exclude loans held for sale Notes on slide 7 – Helping SME customers through the Payment Protection Program Data as of June 6, 2020 Number of employees supported based on data provided by customers in the PPP application Notes on slide 8 – Providing payment relief through current challenges Consumer loans in forbearance expressed as percentage of dollar portfolio balance as of May 31, 2020 Retail customers include mortgages serviced for others Weighted average FICO as of April 30, 2020 Notes on slide 9 – Retail portfolio is highly diversified with a strong credit profile Excludes balances 100% contractually covered by program-specific loss-sharing arrangements. Refreshed FICO score, LTV ratio, lien position, etc. reflects data as of February 29, 2020 Expected decrease in 2Q20 originations in the personal unsecured loan product compared to the quarterly average volume in 2019 Notes on slide 10 – How are our customers navigating through COVID-19? Percentage increase in digital logins, app downloads, online banking enrolls and non-branch % of transactions are for the 12-weeks ended May 31, 2020 compared to the 12-week period a year ago 13pts is the change in the transaction mix between branch and non-branch activity Notes on slide 11 – Strategic priorities to drive top-line growth and efficiencies Transformed branches since 2015 includes closures, consolidations and renovations
