Attached files
| file | filename |
|---|---|
| EX-32.2 - EX-32.2 - SURGALIGN HOLDINGS, INC. | d921497dex322.htm |
| EX-32.1 - EX-32.1 - SURGALIGN HOLDINGS, INC. | d921497dex321.htm |
| EX-31.2 - EX-31.2 - SURGALIGN HOLDINGS, INC. | d921497dex312.htm |
| EX-31.1 - EX-31.1 - SURGALIGN HOLDINGS, INC. | d921497dex311.htm |
| EX-23.1 - EX-23.1 - SURGALIGN HOLDINGS, INC. | d921497dex231.htm |
| EX-21.1 - EX-21.1 - SURGALIGN HOLDINGS, INC. | d921497dex211.htm |
| EX-10.51 - EX-10.51 - SURGALIGN HOLDINGS, INC. | d921497dex1051.htm |
| EX-10.50 - EX-10.50 - SURGALIGN HOLDINGS, INC. | d921497dex1050.htm |
| EX-10.49 - EX-10.49 - SURGALIGN HOLDINGS, INC. | d921497dex1049.htm |
| EX-10.48 - EX-10.48 - SURGALIGN HOLDINGS, INC. | d921497dex1048.htm |
| EX-4.4 - EX-4.4 - SURGALIGN HOLDINGS, INC. | d921497dex44.htm |
Table of Contents
UNITED STATES
SECURITIES AND EXCHANGE COMMISSION
Washington, DC 20549
FORM 10-K
| ☒ | ANNUAL REPORT PURSUANT TO SECTION 13 OR 15(D) OF THE SECURITIES EXCHANGE ACT OF 1934 |
For the fiscal year ended December 31, 2019
or
| ☐ | TRANSITION REPORT PURSUANT TO SECTION 13 OR 15(D) OF THE SECURITIES EXCHANGE ACT OF 1934 |
For the transition period from to
Commission file number 001-38832
RTI Surgical Holdings, Inc.
(Exact Name of Registrant as Specified in its Charter)
| Delaware | 83-2540607 | |
| (State or Other Jurisdiction of Incorporation or Organization) |
(I.R.S. Employer Identification No.) |
520 Lake Cook Road, Suite 315, Deerfield, Illinois 60015
(Address of Principal Executive Offices) (Zip Code)
(877) 343-6832
(Registrant’s telephone number, including area code)
Securities registered pursuant to Section 12(b) of the Act:
| Title of each class |
Trading Symbol |
Name of exchange on which registered | ||
| common stock, $0.001 par value | RTIX | Nasdaq Global Select Market |
Securities registered pursuant to Section 12(g) of the Act: None
Indicate by check mark if the registrant is a well-known seasoned issuer, as defined in Rule 405 of the Securities Act. Yes ☐ No ☒
Indicate by check mark if the registrant is not required to file reports pursuant to Section 13 or Section 15(d) of the Act. Yes ☐ No ☒
Indicate by check mark whether the registrant (1) has filed all reports required to be filed by Section 13 or 15(d) of the Securities Exchange Act of 1934 during the preceding 12 months (or for such shorter period that the registrant was required to file such reports), and (2) has been subject to such filing requirements for the past 90 days. Yes ☐ No ☒
Indicate by check mark whether the registrant is a large accelerated filer, an accelerated filer, a non-accelerated filer, a smaller reporting company, or an emerging growth company. See definition of “accelerated filer”, “large accelerated filer”, “smaller reporting company”, and “emerging growth company” in Rule 12b-2 of the Exchange Act. (Check one):
| Large accelerated filer | ☐ | Accelerated filer | ☒ | |||
| Non-accelerated filer | ☐ | Smaller reporting company | ☐ | |||
| Emerging Growth Company | ☐ | |||||
If an emerging growth company, indicate by check mark if the registrant has elected not to use the extended transition period for complying with any new or revised financial accounting standards provided pursuant to Section 13(a) of the Exchange Act. ☐
Indicate by check mark whether the registrant is a shell company (as defined in Rule 12b-2 of the Exchange Act.): Yes ☐ No ☒
The aggregate market value of the Common Stock held by non-affiliates of the registrant, based upon the last sale price of the Common Stock reported on the Nasdaq Stock Market as of the last business day of the registrant’s most recently completed second fiscal quarter (June 28, 2019), was approximately $319.4 million.
The number of shares of Common Stock outstanding as of May 19, 2020 was 74,564,450.
Table of Contents
Explanatory Note
As previously disclosed in the Current Report on Form 8-K filed by RTI Surgical Holdings, Inc. (the “Company” or “RTI”) with the U.S. Securities and Exchange Commission (the “SEC”) on March 16, 2020, the Audit Committee of the Board of Directors (the “Board”) of RTI, with the assistance of independent legal and forensic accounting advisors, conducted an internal investigation of matters relating to the Company’s revenue recognition practices for certain contractual arrangements, primarily with OEM customers, including the accounting treatment, financial reporting and internal controls related to such arrangements (the “Investigation”). The Investigation also examined transactions to understand the practices related to manual journal entries for accrual and reserve accounts. The Investigation was precipitated by an investigation by the SEC initially related to the periods 2014 through 2016. The SEC investigation is ongoing, and the Company is cooperating with the SEC in its investigation.
On April 7, 2020, the Audit Committee of the Board concluded that the Company will restate its unaudited financial statements for the quarterly periods within the 2019 fiscal year (the “Relevant Periods”). Such restated quarters are included in this Form 10-K.
Restatement Background
Based on the results of the Investigation, the Company has concluded that revenue for certain invoices should have been recognized at a later date than when originally recognized. In response to binding purchase orders from certain OEM customers, goods were shipped and received by the customers before requested delivery dates and agreed-upon delivery windows. In many instances, the OEM customers requested or approved the early shipments, but the Company has determined that on other occasions the goods were delivered early without obtaining the customers’ affirmative approval. Some of those unapproved shipments were shipped by employees in order to generate additional revenue and resulted in revenues being pulled from a future quarter into an earlier quarter. In addition, the Company has concluded that in July 2017 an adjustment was improperly made to a product return provision in the Direct Division. The revenue for those shipments is being restated, as well as for other orders that shipped earlier than the purchase order due date in the system for which the Company could not locate evidence that the OEM customers had requested or approved the shipments. In addition, the Company has concluded that in the periods from 2015 through the fourth quarter of 2018, certain adjustments were incorrectly or erroneously made via manual journal entries to accrual and reserve accounts, including an adjustment to a product return provision in the Direct Division, among others. Accordingly, the Company has restated its financial statements to correct these errors. Furthermore, other errors that were unrelated to the SEC investigation were identified that were corrected in the restated financial statements. Additional errors were made in connection with the recording of the acquisition of Paradigm Spine, LLC in 2019.
Accordingly, as discussed further in Note 30 of the “Notes to the Consolidated Financial Statements” contained in Item 8 of this Form 10-K, we restated previously issued unaudited financial statements for the quarters ended March 31, 2019, June 30, 2019, and September 30, 2019, to correct these errors.
Table of Contents
RTI SURGICAL HOLDINGS, INC.
FORM 10-K Annual Report
| Page | ||||||
| Part I |
||||||
| Item 1 |
1 | |||||
| 1 | ||||||
| 1 | ||||||
| 2 | ||||||
| 3 | ||||||
| 3 | ||||||
| 5 | ||||||
| 5 | ||||||
| 5 | ||||||
| 5 | ||||||
| 6 | ||||||
| 6 | ||||||
| 7 | ||||||
| 7 | ||||||
| 10 | ||||||
| 10 | ||||||
| 11 | ||||||
| Item 1A |
11 | |||||
| Item 1B |
27 | |||||
| Item 2 |
27 | |||||
| Item 3 |
28 | |||||
| Item 4 |
29 | |||||
| Part II |
||||||
| Item 5 |
30 | |||||
| Item 6 |
31 | |||||
| Item 7 |
Management’s Discussion and Analysis of Financial Condition and Results of Operations |
33 | ||||
| Item 7A |
48 | |||||
| Item 8 |
48 | |||||
| Item 9 |
Changes in and Disagreements with Accountants on Accounting and Financial Disclosure |
48 | ||||
| Item 9A |
48 | |||||
| Item 9B |
54 | |||||
| Part III |
||||||
| Item 10 |
55 | |||||
| Item 11 |
63 | |||||
| Item 12 |
Security Ownership of Certain Beneficial Owners and Management and Related Stockholder Matters |
86 | ||||
| Item 13 |
Certain Relationships and Related Transactions, and Director Independence |
88 | ||||
| Item 14 |
89 | |||||
| Part IV |
||||||
| Item 15 |
91 | |||||
| Item 16 |
94 | |||||
| 95 | ||||||
Table of Contents
PART I
This Annual Report on Form 10-K and the documents incorporated by reference contain forward-looking statements that have been made pursuant to the provisions of the Private Securities Litigation Reform Act of 1995. These forward-looking statements are based on current expectations, estimates and projections about our industry, our management’s beliefs and certain assumptions made by our management. Words such as “anticipates,” “expects,” “intends,” “plans,” “believes,” “seeks,” “estimates,” “requires,” “hopes,” “may,” “will,” “assumes,” variations of such words and similar expressions are intended to identify such forward-looking statements. Do not unduly rely on forward-looking statements. These statements give our expectations about future performance, but are not guarantees of future performance and are subject to certain risks, uncertainties and assumptions that are difficult to predict; therefore, actual results may differ materially from those expressed or forecasted in any such forward-looking statements. Some of the matters described below in the “Risk Factors” section constitute cautionary statements which identify factors regarding these forward-looking statements, including certain risks and uncertainties that could cause actual results to vary materially from the future results indicated in these forward-looking statements. Other factors could also cause actual results to vary materially from the future results indicated in such forward-looking statements. Forward-looking statements speak only as of the date they are made, and unless required by law, we undertake no obligation to update publicly any forward-looking statements, whether as a result of new information, future events or otherwise.
| Item 1. | BUSINESS. |
RTI Surgical Holdings, Inc. together with its subsidiaries, (“RTI” or the “Company”), is a global surgical implant company that designs, develops, manufactures and distributes biologic, metal and synthetic implants. Our implants are used in orthopedic, spine, sports medicine, plastic surgery, trauma and other surgical procedures to repair and promote the natural healing of human bone and other human tissues and improve surgical outcomes. We manufacture metal and synthetic implants and process donated human musculoskeletal and other tissue and bovine and porcine animal tissue in producing allograft and xenograft implants using our proprietary BIOCLEANSE®, TUTOPLAST® and CANCELLE® SP sterilization processes. We process tissue at our facilities in Alachua, Florida and Neunkirchen, Germany and manufacture metal and synthetic implants in Marquette, Michigan and Greenville, North Carolina, respectively, and we have a distribution and research center in Wurmlingen, Germany. We are accredited in the United States by the American Association of Tissue Banks and we are a member of the Advanced Medical Technology Association (“AdvaMed”). Our implants are distributed directly to hospitals and free-standing surgery centers throughout the United States and in over 50 countries worldwide with the support of both our and third-party representatives as well as through larger purchasing companies.
In 2019, we continued to implement a focused strategy to expand our spine and Original Equipment Manufacturer (“OEM”) operations and create long-term, profitable growth for the company. The core components of our strategy were:
| • | Reduce Complexity. We worked to reduce complexity in our organization by divesting non-core assets and investing in core competencies. |
| • | Drive Operational Excellence. We worked to optimize material cost and drive operational efficiency to reduce other direct costs by pursuing world class manufacturing. |
| • | Accelerate Growth. We invested in innovative, niche high growth product categories leveraging core competency in the spine market; utilizing core technologies to expand OEM relationships and drive organic growth; and building relevant scale in our spinal portfolio to improve our importance to the consolidating healthcare market driven increasingly by integrated delivery networks and group purchasing organizations. |
On January 13, 2020, we entered into an Equity Purchase Agreement as amended by that certain First Amendment to Equity Purchase Agreement dated as of March 6, 2020 and that certain Second Amendment to Equity Purchase Agreement dated as of April 27, 2020 (as amended, the “OEM Purchase Agreement”) with Ardi Bidco Ltd., a Delaware corporation and an entity affiliated with Montagu Private Equity LLP (“Montagu”), in connection with the proposed sale (the “Sale”) of RTI’s business of (a) providing original equipment manufacturing (“OEM”), including the design, development and manufacture, of private label and custom biological-, metal- and polymer-based implants and instruments that are used in spine, sport medicine, plastic and reconstructive, urology, gynecology and trauma surgical procedures, and (b) processing donated human musculoskeletal and other tissue and bovine and porcine animal tissue in producing allograft and xenograft implants using BIOCLEANSE®, TUTOPLAST® and CANCELLE® SP sterilization processes (i) as represented by RTI’s “Sports” line of business and (ii) as otherwise described in RTI Surgical, Inc.’s Annual Report on Form 10-K for the year ended December 31, 2018 filed with the SEC on March 5, 2019, in each case for clauses (a) and (b), as currently produced at RTI’s facilities in Alachua, Florida; Marquette, Michigan; Greenville, North Carolina; and Tutogen Medical GmbH’s facility in Neunkirchen, Germany (together, the “OEM Business”; provided that the “OEM Business” shall not be deemed to include the marketing, sale or direct distribution of surgical implants, instruments, or biologics used in the treatment of conditions affecting the spine (x) as represented by RTI’s “Spine” or “International” lines of business and (y) as otherwise described in RTI Surgical, Inc.’s Annual Report on Form 10-K for the year ended December 31, 2018 filed with the SEC on March 5, 2019) to the Buyer for a purchase price of $440 million of cash, subject to certain adjustments. More specifically, pursuant to the terms of the Purchase Agreement, RTI and its subsidiaries will sell, to the Buyer, all of the issued and outstanding shares (the “Securities”) of RTI OEM, LLC (which, prior to the Sale, is required to convert to a corporation and change its name to “RTI Surgical, Inc.”), Tutogen Medical (United States), Inc. and Tutogen Medical GmbH (the “Companies” and, together RTI Donor Services, Inc. (collectively, the “OEM Group Companies”)).
1
Table of Contents
The OEM Purchase Agreement contemplates that, prior to the closing of the transactions contemplated by the OEM Purchase Agreement (the “OEM Closing”), RTI will undergo an internal reorganization, pursuant to which, in addition to certain inter-company transfers and mergers, RTI and its subsidiaries will transfer to the OEM Group Companies the assets primarily used in the operation of the Business (“Contribution Assets”) and the OEM Group Companies will assume certain liabilities that are related to the OEM Business (collectively, the “Reorganization”). In addition to the Reorganization, RTI is required to use reasonable best efforts to separate the assets and liabilities, and the operating mechanisms, of the U.S. “metals” business and the U.S. “biologics” business into two separate companies prior to the OEM Closing. As part of such separation, another subsidiary of RTI, established to hold the assets and liabilities of the U.S. “metals” business, will constitute a Company and be sold as part of the transactions contemplated by the Purchase Agreement and each of the agreements ancillary to the Purchase Agreement (the “Contemplated Transactions”) to an affiliate of the Buyer. The affiliate of the Buyer established for this purpose would be an additional “Buyer” under the Purchase Agreement.
The Contemplated Transactions are subject to customary closing conditions, including, among other things, the approval of the Contemplated Transactions by the Company’s stockholders. The parties currently expect to close the Contemplated Transactions in the third quarter of 2020. Following the OEM Closing, RTI will focus exclusively on the design, development and distribution of spinal implants to the global market.
Segments
As noted below in Item 8, Note 5, in the fourth quarter of 2019, we reorganized into two business lines, which are also our operating and reportable segments: Spine and OEM. We distribute human tissue, bovine and porcine animal tissue, metal and synthetic implants through various distribution channels: Spine (Direct Domestic and Direct International) and OEM (OEM Domestic, Direct Sports and OEM International).
| For the Year Ended December 31, | Percent Change | |||||||||||||||||||
| 2019 | 2018 | 2017 | 2019/2018 | 2018/2017 | ||||||||||||||||
| Spine |
$ | 118,987 | $ | 94,436 | $ | 92,712 | 26.0 | % | 1.9 | % | ||||||||||
| OEM |
189,397 | 185,926 | 187,637 | 1.9 | % | (0.9 | )% | |||||||||||||
|
|
|
|
|
|
|
|||||||||||||||
| Total Revenues |
$ | 308,384 | $ | 280,362 | $ | 280,349 | 10.0 | % | 0.0 | % | ||||||||||
|
|
|
|
|
|
|
|||||||||||||||
For additional financial information concerning our operating performance, please refer to “Management’s Discussion and Analysis of Financial Condition and Results of Operations” in Part II, Item 7 of this Form 10-K and our Consolidated Financial Statements in Part II, Item 8 of this Form 10-K.
We were incorporated in 1997 in Florida as a wholly-owned subsidiary of the University of Florida Tissue Bank, (“UFTB”). We began operations on February 12, 1998 when UFTB contributed to us its allograft processing operations, related equipment and technologies, distribution arrangements, research and development activities and certain other assets. At the time of our initial public offering in August 2000, we reincorporated in the State of Delaware. In July 2013, we completed our acquisition of Pioneer Surgical Technology, Inc. (“Pioneer”) and, in connection with the acquisition, changed our name from RTI Biologics, Inc. to RTI Surgical, Inc. In August 2017, we completed the sale of substantially all of the assets related to our Cardiothoracic closure business (the “CT Business”) to A&E Advanced Closure Systems, LLC (a subsidiary of A&E Medical Corporation) (“A&E”). On January 4, 2018, we acquired Zyga Technology, Inc. (“Zyga”) through the merger of one of our wholly-owned subsidiaries with and into Zyga. On March 8, 2019, we acquired Paradigm Spine, LLC (“Paradigm”) in a cash and stock transaction. In connection with the Paradigm transaction, the Company was restructured and RTI Surgical, Inc. became a wholly-owned subsidiary of RTI Surgical Holdings, Inc. Our principal office is located at 520 Lake Cook Road, Suite 315, Deerfield, Illinois, and our phone number is (877) 343-6832.
The consolidated financial statements include the accounts of the Company and its wholly owned subsidiaries, RTI Surgical, Inc. (defined as “Legacy RTI” for matters occurring after March 8, 2019, and as the “Company” for matters occurring before March 8, 2019), Paradigm, Pioneer Surgical Technology, Inc. (“Pioneer Surgical”), Tutogen Medical, Inc. (“TMI”), and Zyga. The consolidated financial statements also include the accounts of RTI Donor Services, Inc. (“RTIDS”), which is a controlled entity. Prior to the completion of the acquisition of Paradigm, the financial statements were that of RTI Surgical, Inc. and subsidiaries. Subsequently, RTI Surgical Holdings, Inc. and Subsidiaries is the successor reporting company. See Note 7 for further discussion.
2
Table of Contents
COVID-19
As discussed in more detail throughout this Form 10-K, the coronavirus (COVID-19) pandemic, as well as the corresponding governmental response and the Company’s management of the crisis has had a significant impact on the Company’s business. The consequences of the outbreak and impact on the economy continues to evolve and the full extent of the impact is uncertain as of the date of this filing. The outbreak has already brought a significant disruption to the operations of the Company.
Hospitals and other medical facilities have canceled elective surgeries, reduced and diverted staffing and diverted resources to patients suffering from the infectious disease and limited hospital access for non-patients, including our direct and indirect sales representatives. Because of the COVID-19 pandemic, surgeons and their patients are required, or are choosing, to defer procedures in which our products otherwise would be used, and many facilities that specialize in the procedures in which our products otherwise would be used have closed or reduced operating hours. These circumstances have negatively impacted the ability of our employees and distributors to effectively market and sell our products. In addition, even after the pandemic has subsided and/or governmental orders no longer prohibit or recommend against performing such procedures, patients may continue to defer such procedures out of concern of being exposed to coronavirus or for other reasons.
The COVID-19 pandemic has also caused adverse effects on general commercial activity and the global economy, which has led to an economic slowdown or recession, and which has adversely affected our business, operating results or financial condition. The adverse effect of the pandemic on the broader economy has also negatively affected demand for procedures using our products, and could cause one or more of our distributors, customers, and suppliers to experience financial distress, cancel, postpone or delay orders, be unable to perform under a contract, file for bankruptcy protection, go out of business, or suffer disruptions in their business. This could impact our ability to manufacture and provide products and otherwise operate our business, as well as increase our costs and expenses.
The COVID-19 pandemic has also led to and could continue to lead to severe disruption and volatility in the global capital markets, which could increase our cost of future capital and adversely affect our ability to access the capital markets in the future.
The above and other continued disruptions to our business as a result of COVID-19 has resulted in a material adverse effect on our business, operating results, financial condition, prospects and the trading price of our common stock in the near-term and beyond 2020. The full extent to which the COVID-19 pandemic will impact our business will depend on future developments that are highly uncertain and cannot be accurately predicted, including the possibility that new adverse information may emerge concerning COVID-19 and additional actions to contain it or treat its impact may be required.
Defects in bone and other human tissue can be caused by a variety of sources including trauma, congenital defects, aging, revision of joint replacements, infectious disease, cancer and other similar conditions. The predominant method used to repair injured or defective bone and tissue is surgical intervention, primarily through the use of surgical implants. When considering a surgical procedure for bone or tissue repair, surgeons and patients have a number of treatment options including:
| • | metals and synthetics; |
| • | “xenograft” tissue from an animal source; |
| • | “autograft” tissue from the patient; and |
| • | “allograft” tissue from another human donor. |
Depending on the specific surgery, surgeons may elect to use any number of these treatment options. We offer a broad line of metal, synthetic, xenograft and allograft solutions to meet their needs.
Metals and Synthetics
The medical community has used metal and synthetic materials for implant procedures for many years. Metal and synthetic technologies are used to create both surgical implants as well as instruments used in surgical procedures. These implants are used in a variety of procedures in spine, cardiothoracic, trauma and other areas. Typical metals used include surgical stainless steel and titanium. These materials are chosen for their strength and durability. Synthetic implants provide alternative implant options for surgeons and reliable availability due to the variable supply of xenograft, autograft and allograft. One common example of a synthetic material is polyetheretherketone (“PEEK”). A recent trend has emerged for advanced materials in spinal interbodies. RTI has a position in that space through its Fortilink family of products, which is produced by additive manufacturing (i.e. 3-D printing) using a proprietary polyetherketoneketone (“PEKK”) material called TETRAfuse® 3-D. The Company’s exclusive supplier of TETRAfuse® 3-D is Oxford Performance Materials, Inc.
Xenograft Tissue
Xenograft tissue-based implants are common in many areas of medicine including cardiac and vascular procedures, soft tissue repair and wound care. Xenograft based implants are also used in the repair of bone defects in orthopedic surgery as carriers for demineralized bone matrix and bone morphogenic protein products. The production of xenograft implants involves recovering animal tissue, typically from cattle (bovine) or pigs (porcine), processing and sterilization, and then transplanting the xenograft implant into a human patient.
Autograft and Allograft Tissue
Many surgeons use autograft and allograft tissue in their surgical procedures to take advantage of their natural characteristics. Autograft procedures involve a surgeon harvesting tissue from one part of a patient’s body for transplant to another part of the body. Allograft tissues are recovered from cadaveric donors, processed for certain intended uses and then transplanted by a surgeon into the patient’s body to make the needed repair.
Autograft and allograft bone implants are not only “osteoconductive,” meaning they provide a scaffold for new bone to attach itself to, but can be “osteoinductive” as well, meaning they stimulate the growth of new tissue.
We market and distribute our implants through direct distribution channels and a combination of both exclusive and non-exclusive OEM distributors depending upon the product category. Our implants are used in the following markets: spine, sports medicine, orthobiologics, trauma, dental, plastic surgery and other surgical specialties. Our implants range from metals, synthetics, allografts and xenografts that are precision machined for specific surgical applications, to grafts conventionally processed for general surgical uses.
3
Table of Contents
Direct Channels
Spine
The human spine consists of four regions: cervical (neck region), thoracic (back region attached to the ribs), lumbar (lower back), and sacral (tail bone). We design, manufacture, and distribute surgical implants, instruments, and biologics used in the treatment of conditions affecting the spine caused by degenerative conditions, deformities or traumatic injury. Our principal implant offering includes a wide variety of systems composed of components such as spine screws and rods, spinal spacers, plates, and various biologics offerings all designed to support, enhance, or promote spinal fusion. Our principal implant offerings by market segment are as follows:
| • | Thoracolumbar: Streamline® TL Spinal Fixation System, Quantum® Spinal Fixation System, Streamline® MIS Spinal Fixation System, MIS FusionTM Instrumentation, Contact® Anterior Lumbar Plate System |
| • | Cervical: Streamline® Posterior Cervical Spinal Fixation System, Slimfuse® Anterior Cervical Plate System, Aspect® Anterior Cervical Plate System |
| • | Lateral: Clarity® Retractor System, Lat-FuseTM Lateral Plate System |
| • | Interbody: C PlusTM PEEK IBF System, BulletTM PEEK IBF System, Cross-Fuse II® PEEK VBR/IBF System |
| • | Biologics: The BioSet® DBM, BioReady® DBM, and BioAdapt® DBM families of paste implants |
| • | Synthetics: nanOss® advanced bone graft substitute |
Sports
Many repetitive use and sports-related injuries can be addressed with allograft implants. The most prevalent surgeries in the knee include repairs to the anterior cruciate ligament, articular cartilage repair, and meniscus transplantation. The most prevalent surgeries in the shoulder include rotator cuff repair and articular cartilage repair. Our principal sports medicine allografts are tendons for ligament reconstruction, fresh osteochondral grafts for cartilage repair, and our meniscal allografts for advanced meniscus injuries. Many of our sports medicine tendon allografts utilize our patented pre-shaped technology, which greatly reduces preparation time in the operating room and are generally easier to implant than non pre-shaped allografts. We also distribute Matrix HD human dermis implants for wound repair and soft tissue augmentation. We also market and distribute implants for abdominal wall repair, and plastic and reconstructive surgery. These implants are processed through our validated Tutoplast tissue sterilization process, which has a proven track record of safety and performance. Principal products include Cortiva human dermis, Fortiva porcine dermis and Tutopatch and Tutomesh bovine pericardium.
OEM Channels
We also market and distribute our implants through relationships with OEM distributors.
Our spine interbody allograft implants are marketed and distributed domestically through our non-exclusive relationships with Aesculap Implant Systems, Inc., Integra Life Sciences Corporation (“Integra”), Medtronic, PLC (“Medtronic”), Orthofix International NV (“Orthofix”), Stryker Spine, a division of Stryker Corporation (“Stryker”), and Zimmer Biomet Holdings, Inc. (“Zimmer”).
Our allograft paste implants are marketed and distributed under Puros® DBM by Zimmer and BIO DBMTM by Stryker.
Our surgical specialty implants are marketed and distributed through distributors including: Integra for dural repair applications; Davol, Inc., a subsidiary of C. R. Bard, Inc. (“Davol”) for hernia repair and breast reconstruction; Katena Products, Inc. for ophthalmology and Coloplast A/S of Denmark (“Coloplast”) for urology.
Our allograft dental implants including cancellous and cortical bone and human and bovine membranes primarily for dental procedures related to augmenting ridge restoration are distributed exclusively by Zimmer.
Our trauma implants are distributed through Zimmer and DePuy Synthes (“Synthes”), a Johnson & Johnson Inc. subsidiary. Zimmer across all implants represents approximately 18% of our total revenues.
Our cardiothoracic hardware implants are distributed through A&E.
4
Table of Contents
International
Internationally we market and distribute our implants through a direct distribution organization and a network of independent distributors.
The BIOCLEANSE® Tissue Sterilization Process
We have developed and utilized in the United States the patented BIOCLEANSE® tissue sterilization process, which is an automated, pharmaceutical grade chemical sterilization process for musculoskeletal bone and certain soft tissue. This process is fully validated to kill or inactivate all classes of conventional pathogens, viruses, microbes, bacteria and fungi. Our BIOCLEANSE® process is able to remove greater than 99% of the blood, fats, lipids and other unwanted materials from the tissue we process. An important element of the BIOCLEANSE® process is that while it removes unwanted materials embedded within the tissue, it maintains the tissue’s structural integrity and compression strength. Studies have shown that bone tissue sterilized with the BIOCLEANSE® process maintains the same compression strength as untreated tissue.
The BIOCLEANSE® process has been reviewed by the U.S. Food and Drug Administration (“FDA”) which concluded that BIOCLEANSE® was a validated tissue sterilization process demonstrated to prevent contamination of tissue grafts. To our knowledge, no other tissue sterilization process related to human tissue in our industry has been reviewed or approved by the FDA. It should be noted that the FDA does not have a formal approval process in place for tissue related processing techniques.
Two types of preserved allografts are processed using the BIOCLEANSE® process: soft tissue, consisting of tendons and cartilage; and bone tissue, consisting of various configurations of cancellous and cortical bone material. Tendons and cartilage are used to repair/replace native tissue primarily in sports medicine reconstructive surgeries. Processed cortical and cancellous bone materials are used in a wide variety of applications in spine and orthopedic surgeries.
The TUTOPLAST® Tissue Sterilization Process
The TUTOPLAST® tissue sterilization process utilizes solvent dehydration and chemical inactivation to remove blood, lipids and extraneous materials, and inactivate viruses and break down RNA and DNA into fragments not capable of replication and disease transmission while preserving the biological and mechanical properties.
Two types of preserved allografts are processed using the TUTOPLAST® process: soft tissue, consisting of fascia lata, pericardium, dermis, sclera and cornea; and bone tissue, consisting of various configurations of cancellous and cortical bone material. Processed pericardium, fascia lata and dermis are collagenous tissue used to repair, replace or line native connective tissue primarily in dental, ophthalmology, urology, plastic and reconstructive surgeries. Dermis is also used in hernia repair and pelvic floor reconstruction. Sclera and cornea are used in ophthalmology procedures such as anterior and posterior segment patch grafting applications for glaucoma, retina and trauma surgery and oculoplastics, as well as contour wrapping of an orbital implant. Processed cortical and cancellous bone material is used in a wide variety of applications in spine, orthopedic and dental surgeries.
The CANCELLE® SP DBM Sterilization Process
DBM-based pastes and putties are sterilized through the CANCELLE® SP process, which is designed to preserve protein activity. In their final form, the DBM implants serve as bone void fillers in many applications, including spinal, general orthopedic, joint reconstruction and dental surgeries.
CANCELLE® SP is a proprietary process that sterilizes DBM pastes and putties while simultaneously allowing them to maintain their osteoinductive (“OI”) potential, which is verified by 100% lot testing after sterilization. The determination of OI potential is made by lot release animal studies or testing for certain protein markers. These tests are not necessarily predictive of human clinical results. Through a combination of oxidative treatments and acid or alcohol washes, debris is removed and pathogens are inactivated. Cleansing rinses remove residual chemicals, maintaining biocompatibility and preserving the utility of the graft. The CANCELLE® SP irradiation dose is delivered terminally for most pastes and putties to achieve device-level sterility (“SAL 10-6”).
Tissue recovery is the actual removal of tissue from a donor after legal authorization has been obtained. Authorization is obtained by the tissue recovery group. We contract with independent FDA registered tissue recovery groups that specialize in this activity. Tissue recovery personnel aseptically recover tissue within 24 hours following a donor’s death, using surgical instruments and sterile techniques similar to those used in hospitals for routine surgery. Recovered tissue is placed on wet or dry ice, then transported by the donor recovery agency to the tissue processor or possibly a research institution.
Under U.S. law, human tissue cannot be bought and sold. However, the law permits the recovery of reasonable payments for the provision of certain services, such as those involved in recovering, processing and storing tissue and related to the advancement of tissue processing technologies; all types of activities in which we are involved.
5
Table of Contents
Donor recovery groups recover a variety of tissue types from donors including the fibula, femur, tibia, humerus, ilium, pericardium, fascia lata, dermis, costal cartilage, sclera, tendons and ligaments. We believe that our established relationships with recovery organizations are sufficient to meet our ongoing operation demands. These contracted tissue recovery organizations are responsible for obtaining appropriate authorization and conducting federally-mandated donor screening, such as a donor risk assessment interview with the next of kin. Each donor is evaluated against current acceptance criteria prior to donor tissue being sent to our processing facility. Upon receipt of the tissue, we conduct pre-processing donor screening to determine donor medical suitability for transplantation. Pre-processing screening performed by us includes laboratory testing and a donor medical eligibility assessment. With respect to laboratory testing, we perform an extensive panel of serological and microbiological tests using Clinical Laboratory Improvements Amendment (“CLIA”) approved laboratories and FDA test kits. These results are subject to stringent criteria in order to release the donor tissue to the processing stage.
We have relationships with tissue donor recovery agencies across the United States. We also have relationships outside the United States. We believe additional recovery group relationships would be available if needed and consequently that the loss of any one of our sources of donor tissue would not have a material impact on our operating results.
We continue to develop new xenograft tissue implants. Implants processed from xenograft tissue are regulated by the FDA as devices and require approval or licenses from the FDA prior to marketing in the United States. The sources of our bovine animal tissues are regulated closed herds. We believe that our established relationships with our sources of xenograft animal tissues are sufficient to meet our demands for our ongoing operations. We believe the continued development of our xenograft implants will help us meet unmet demand for certain allografts and also allow us to develop new biological implants that cannot currently be made due to structural limitations of human tissue.
Our strategy has been to develop new implants, technologies and surgical techniques within our current markets, and to develop additional technologies for other markets to address unmet clinical needs. We have done this by building on our core technology platforms: TETRAfuse® 3-D, BIOCLEANSE®, TUTOPLAST®, CANCELLE® SP, precision machining, assembled grafts, tissue-mediated osteoinduction and our metal and synthetics design and production expertise. We have worked and continue to work on developing differentiated technologies and investing in generating the necessary clinical data to drive demand and support appropriate reimbursement. We operate a dedicated research team working on advanced technologies, and have embedded development/technical teams who work with the business/marketing teams focused on expanding the scope and scale of existing competencies such as tissue machining and sterilization, and metal and synthetics manufacturing to meet specific surgical needs.
In 2019, we launched 6 new implants and product enhancements in spine, sports, and general orthopedics developed by our research and development teams. January 2018 marked the first clinical use of the Fortilink-TS and Fortilink-L product systems, which were followed by the full commercial launch of the Fortilink-TS system in May 2018. The Fortilink systems are the second and third in a family of devices to incorporate our TETRAfuse 3D Technology. Additionally, 2018 began the manufacture and initial commercial use of the Thorecon sternal closure system in association with our partner A&E. Enhancements were made to Streamline OCT system, continuing the history of continuously improved features and options; performance improvements were made to our synthetic biologic line with the release of nanOss 3D Plus.
Our business depends upon the significant know-how and proprietary technology we have developed. To protect this know-how and proprietary technology, we rely on a combination of trade secret laws, patents, licenses, trademarks and confidentiality agreements. The effect of these intellectual property rights is to define zones of exclusive use of the covered intellectual property. The duration of patent rights generally is 20 years from the date of filing of priority application, while trademarks, once registered, are essentially perpetual. Our trademarks and service marks provide us and our implants with a certain amount of brand recognition in our markets. However, we do not consider any single patent, trademark or service mark material to our business strategy, financial condition or results of operations. We have also entered into exclusive and non-exclusive licenses relating to a wide array of third-party technologies. In addition, we rely on our substantial body of know-how, including proprietary tissue recovery techniques and processes, research and development, tissue processing and quality assurance.
Our proprietary BIOCLEANSE®, TUTOPLAST® and CANCELLE® SP sterilization processes are covered by one or more U.S. and/or foreign patents, patent applications or trade secrets. Other U.S. and foreign holdings include, without limitation, patents, patent applications or trade secrets relating to or covering certain precision machined allograft intervertebral spacers and other spinal implants; matrix compositions including various bone graft substitutes; membrane tissue implants; and ligament, tendon or meniscus reconstruction and repair with certain precision shaped and/or assembled bone and soft tissue implants, synthetic bone graft substitutes; interbody fusion and motion implants; spinal and orthopedic plates; spinal rods, cables and screws and spinal fixation systems and related instrumentation.
6
Table of Contents
The medical device industry is characterized by the existence of a large number of patents and frequent litigation based on allegations of patent infringement. As the number of entrants into our market increases, the risk of an infringement claim against us, as well as the risk of a third party infringing on our patents, grows. While we attempt to ensure that our implants and methods do not infringe other parties’ patents and proprietary rights, our competitors may assert that our implants, and the methods we employ, are covered by patents held by them. In addition, our competitors may assert that future implants and methods we may employ infringe their patents. If third parties claim that we infringe upon their intellectual property rights, we may incur liabilities and costs and may have to redesign or discontinue selling the affected implant. Even if we were to prevail, any litigation could be costly and time-consuming and would divert the attention of our management and key personnel from our business operations. We have in the past been, and may in the future be, involved in litigation relating to our intellectual property.
Competition in the medical implant industry is intense and subject to rapid technological change and evolving industry requirements and standards. Companies within the industry compete on the basis of design of related instrumentation, efficacy of implants, relationships with the surgical community, depth of range of implants, scientific and clinical results and pricing. Many of our competitors are substantially larger than we are, with much greater resources. In some cases, our customers compete with us in certain product categories.
Our principal competitors in the conventional allograft market include the Musculoskeletal Transplant Foundation (“MTF”), AlloSource Inc., Community Tissue Services (“CTS”), LifeLink Tissue Bank (“LifeLink”), JRF Ortho (“JRF”), LifeCell, Inc., a subsidiary of Allergan PLC and LifeNet Health, Inc. (“LifeNet”). Among our competitors in precision machined allograft are MTF, LifeNet and AlloSource. Other companies who process and distribute allograft pastes include Medtronic, AlloSource, Integra, Wright Medical Inc. and MTF. Companies who process and distribute xenograft tissue include Baxter, Inc., LifeCell, Cook Surgical, Becton Dickenson, Integra MTF, and Medtronic.
We consider our principal competitors in the metal and synthetic markets to include Medtronic, Stryker, Zimmer, Synthes, Globus Medical Group, Inc., NuVasive, Inc., Alphatec Holdings Inc., Spinal Elements Inc., Xtant Medical Holdings, Inc., SeaSpine Holdings Corporation, and Orthofix International NV.
Government Regulation and Corporate Compliance
Government Regulation
Government regulation plays a significant role in the processing/manufacturing and distribution of allograft tissue implants and medical devices. We procure, where applicable, process/manufacture, and market our allograft tissue implants and medical devices worldwide. Although some standardization exists, each country in which we do business has its own specific regulatory requirements. These requirements are dynamic in nature and, as such, are continually changing. New regulations may be promulgated at any time and with limited notice. While we believe that we are in material compliance with all existing pertinent international and domestic laws and regulations, there can be no assurance that changes in governmental administrations and regulations, or their interpretation or application, will not adversely affect our operations. Failure to comply with applicable requirements could result in fines, injunctions, civil penalties, recall or seizure of products, suspension of production, inability to market current products, criminal prosecution, and/or refusal of the government to authorize the marketing of new products.
In the United States, most of our allograft implants are regulated by the FDA solely under Title 21 of the Code of Federal Regulations (“CFR”), Parts 1270 and 1271, “Current Good Tissue Practice for Human Cell, Tissue, and Cellular and Tissue-Based Products” (“cGTPs”). Xenograft tissues and some of our allograft-containing implants are regulated as medical devices and subject to FDA 21 CFR, Part 820 Current Good Manufacturing Practices (“cGMPs”) for Medical Devices and related statutes from the FDA. In addition, our U.S. operation is subject to certain state and local regulations, as well as compliance to the standards of the tissue bank industry’s accrediting organization, the American Association of Tissue Banks (“AATB”).
In Germany, allografts are classified as drugs and the German government regulates such implants in accordance with German Drug Law. On April 7, 2004, the European Commission issued a human tissue directive to regulate allografts within the European Union (“EU”). Our Neunkirchen facility is presently licensed by the German Health Authorities and in compliance with applicable international laws and regulations, allowing us to market our human and animal tissue implants globally.
The FDA and international regulatory bodies conduct periodic compliance inspections of both our U.S. and our German processing facilities. All operations are registered with the FDA Center for Devices and Radiological Health (the “CDRH”) for device manufacturing locations and the Center for Biologics Evaluation and Research (the “CBER”) for human tissue recovery, processing and distribution locations and are certified to ISO 13485:2003 and transitioning to ISO 13485:2016. The Alachua facility is also accredited by the AATB and is licensed in the states of Florida, New York, California, Maryland, Delaware and Illinois. The Neunkirchen facility is registered with the German Health Authority as a pharmaceutical and medical device manufacturer and is subject to German Drug Law. We believe that worldwide regulation of allografts and xenografts is likely to intensify as the international regulatory community focuses on the growing demand for these implants and the attendant safety and efficacy issues of citizen recipients.
7
Table of Contents
We currently market and distribute allografts that are subject to the FDA’s “Human Tissue Intended for Transplantation” and “Human Cells, Tissues, and Cellular and Tissue-Based Products” regulations. Under these regulations, we are required to perform donor screening and infectious disease testing and to document this screening and testing for each donor from whom we process tissue, and to process tissues in compliance with cGTP. The FDA has authority under the rules to inspect human tissue processing facilities, and to detain, recall, or destroy tissues for which appropriate documentation and evidence of compliance is not available. We are not required to obtain pre-market approval or clearance from the FDA for allografts that meet the regulation’s definition of “human tissue.”
The FDA may regulate certain allografts as medical devices, drugs, or biologics, which would require that we obtain approval or product licensure from the FDA. This would occur in those cases where the allograft is deemed to have been “more than minimally manipulated or indicated for non-homologous use.” In general, “homologous use” occurs when tissue is used for the same basic function that it fulfilled in the donor. The definitional criteria for making these determinations appear in the FDA’s rules. If the FDA decides that certain of our current or future allografts are more than minimally manipulated or indicated for non-homologous use, it would require licensure, approval or clearances of those allografts. Allografts requiring such pre-market review are subject to pervasive and continuing regulation by the FDA. We would be required to list these allografts as a drug, as a medical device, or as a biologic, and to manufacture them in specifically registered or licensed facilities in accordance with cGMPs. We would also be subject to post-marketing surveillance and reporting requirements. In addition, our manufacturing facilities and processes would be subject to periodic inspection to assess compliance with cGMPs. Our labeling and promotional activities would be subject to scrutiny by the FDA and, in certain instances, by the Federal Trade Commission. The export of drugs, devices, and biologics is also subject to more intensive regulation than is the case for human tissue implants.
Our research, development and clinical programs, as well as our manufacturing and marketing operations, are subject to extensive regulation in the United States and other countries. Most notably, all of our implants distributed in the United States are subject to the federal Food, Drug, and Cosmetic Act and the Public Health Services Act as implemented and enforced by the FDA. The regulations that cover our implants and facilities vary widely based on implant type and classification both in the United States, and from country to country. The amount of time required to obtain approvals or clearances from regulatory authorities also differs from country to country.
Unless an exemption applies, each medical device that we wish to commercially distribute in the United States will be covered by premarket notification (“510(k)”) clearance from the FDA. The FDA classifies medical devices into one of three classes. Devices deemed to pose lower risks are placed in either Class I or II, with the Class II devices typically requiring the manufacturer to submit to the FDA a premarket notification requesting permission to commercially distribute the device. This process is generally known as 510(k) clearance. Some low risk devices are exempted from this requirement. Devices deemed by the FDA to pose the greatest risks, such as life-sustaining, life-supporting or implantable devices, or devices deemed not substantially equivalent to a previously cleared 510(k) device, are placed in Class III, requiring approval through the lengthy premarket approval application (“PMA”) process. Manufacturers of most Class II medical devices are required to obtain 510(k) clearance prior to marketing their devices. To obtain 510(k) clearance, a company must submit a premarket notification demonstrating that the proposed device is “substantially equivalent” in intended use and in technological and performance characteristics to another legally marketed 510(k)-cleared “predicate device.” By regulation, the FDA’s performance goals are to clear or deny a 510(k) premarket notification within 90 FDA review days of submission of the application. As a practical matter, clearance may take longer. The FDA may require further information, including clinical data, to make a determination regarding substantial equivalence. After a device receives 510(k) clearance, any modification that could significantly affect its safety or effectiveness, or that would constitute a major change in its intended use, requires a new 510(k) clearance or could require a PMA approval.
Class III medical devices are required to undergo the PMA approval process in which the manufacturer must establish the safety and effectiveness of the device to the FDA’s satisfaction. A PMA application must provide extensive preclinical and clinical trial data as well as information about the device and its components regarding, among other things, device design, manufacturing, and labeling. Also, during the review period, an advisory panel of experts from outside the FDA may be convened to review and evaluate the application and provide recommendations to the FDA as to the approvability of the device. In addition, the FDA will typically conduct a preapproval inspection of the manufacturing facility to ensure compliance with the FDA’s Quality System Regulations (21 CFR Part 820) (“QSR”). FDA reviews of PMA applications generally can take between one and three years, or longer.
The medical devices that we develop, manufacture, distribute, and market are subject to rigorous regulation by the FDA and numerous other federal, state, and foreign governmental authorities. The process of obtaining FDA clearance and other regulatory approvals to develop and market a medical device, particularly from the FDA, can be costly and time-consuming, and there can be no assurance that such approvals will be granted on a timely basis, if at all. While we believe that we have obtained, or will be able to obtain, all necessary clearances and approvals for the manufacture and sale of our implants and that they are, or will be, in material compliance with applicable FDA and other material regulatory requirements, there can be no assurance that we will be able to continue such compliance. After an implant is placed on the market, numerous regulatory requirements continue to apply. Those regulatory requirements may include, as applicable: product listing and establishment registration; QSRs, which requires manufacturers, including third-party manufacturers, to follow stringent design, testing, control, documentation and other quality assurance procedures during all aspects of the manufacturing process; labeling regulations (including unique device identification (“UDI”) requirements), and FDA prohibitions against the promotion of products for uncleared, unapproved, or off-label uses or indications; clearance of product modifications that could significantly affect safety or efficacy or that would constitute a major change in intended use of one of our cleared devices; Medical Device Reporting regulations, which require that manufacturers report to FDA if their device may have caused or contributed to a death or serious injury, or has malfunctioned in a way that would likely cause or contribute to a death or serious injury if the malfunction of the device or a similar device were to recur; post-approval restrictions or conditions, including post-approval study commitments; post-market surveillance regulations, which apply when necessary to protect the public health or to provide additional safety and effectiveness data for the device; the FDA’s recall authority, whereby it can ask, or under certain conditions order, device manufacturers to recall from the market a product that is in violation of governing laws and regulations; regulations pertaining to voluntary recalls; and notices of corrections or removals.
8
Table of Contents
We and certain of our suppliers also are subject to announced and unannounced inspections by the FDA to determine our compliance with FDA’s QSR and other regulations. If the FDA were to find that we or certain of our suppliers have failed to comply with applicable regulations, the agency could institute a wide variety of enforcement actions, ranging from a public Warning Letter to more severe sanctions such as: fines and civil penalties against us, our officers, our employees or our suppliers; unanticipated expenditures to address or defend such actions; delays in clearing or approving, or refusal to clear or approve, our products; withdrawal or suspension of approval of our products or those of our third-party suppliers by the FDA or other regulatory bodies; product recall or seizure; interruption of production; operating restrictions; injunctions; and criminal prosecution. Moreover, governmental authorities outside the United States have become increasingly stringent in their regulation of medical devices, and our products may become subject to more rigorous regulation by non-U.S. governmental authorities in the future. U.S. or non-U.S. government regulations may be imposed in the future that may have a material adverse effect on our business and operations. The EU has nationally transposed regulations based on the European Commission (“EC”) Medical Device Directives for the control of medical devices with which manufacturers must comply. New medical device regulation (“MDR”) replaced the medical device directives effective May 26, 2020. The MDR manufacturing plants must have received Conformitè Europèene (“CE”) certification from a “notified body” in order to be able to sell products within the member states of the EU. Certification allows manufacturers to stamp the products of certified plants with a CE mark. Products covered by the EC directives that do not bear the CE mark cannot be sold or distributed within the EU. We have received certification for all currently existing manufacturing facilities and products that we distribute in the EU.
Effective May 26, 2020, the EU’s new MDR (“EU MDR”) replaced the current medical device directives. All medical devices currently distributed in the EU under the medical device directives are likely impacted. The MDR may also include products, such as human tissue, not traditionally considered medical devices in the EU. Additionally, the MDR, among other things, increases regulatory requirements for several medical device groupings applicable to our implants distributed in the EU, including strengthening notified body oversight for Class I reusable surgical instruments, and up-classifying spinal devices in contact with the spinal column. As of April 23, 2020, implementation of the EU MDR has been delayed until May 26, 2021.
Our products may be reimbursed by third-party payers, such as government programs, including Medicare, Medicaid, and Tricare or private insurance plans and healthcare networks. Third-party payers may deny reimbursement if they determine that a device provided to a patient or used in a procedure does not meet applicable payment criteria or if the policy holder’s healthcare insurance benefits are limited. Also, third-party payers may challenge the medical necessity and prices paid for our products and services.
The False Claims Act, Anti-Kickback Statute, Foreign Corrupt Practices Act, and United Kingdom Bribery Act of 2010, as well as state and international anti-bribery and anti-corruption legislation, regulate the conduct of medical device companies’ interactions with the healthcare industry. Among other things, these laws and others generally: (1) prohibit the provision of anything of value in exchange for the referral of patients for, or the purchase, order, or recommendation of, any item or service reimbursed by a federal healthcare program, (including Medicare and Medicaid); (2) require that claims for payment submitted to federal healthcare programs be truthful; and (3) prohibit inappropriate payment to foreign officials for the purpose of obtaining or retaining business. RTI maintains a Compliance Program that incorporates the seven fundamental elements as set forth by the Office of the Inspector General within the U.S. Department of Health and Human Services. This facilitates RTI’s compliance with requirements regarding the prohibition of inappropriate transfers of value in exchange for referrals or obtaining or retaining foreign business engagements, prohibition regarding the submission of inappropriate claims for reimbursement to federal healthcare programs, as well as generally ensuring ethical interactions with the healthcare industry both domestically and internationally.
Under Section 6002 of The Patient Protection and Affordable Care Act of 2010 (known as the Physician Payment Sunshine Act) and similar state and international transparency reporting legislation, RTI is required to collect data regarding payments or other transfers of value to physicians, teaching hospitals, and other persons in the healthcare industry. RTI’s Compliance Program ensures all such payments and transfers of value are appropriate per the requirements of applicable anti-bribery or anti-corruption legislation and that all required data is reported to relevant governmental entities as called for by applicable transparency reporting legislation.
In addition, U.S. federal, state, and international laws protect the confidentiality of certain health information, in particular individually identifiable information such as medical records and restrict the use and disclosure of that protected information. RTI complies with the Health Insurance Portability and Accountability Act of 1996 (“HIPAA”) due to its status as a covered entity related to the provision of a health plan for its employees. RTI is not otherwise regulated by HIPAA, but voluntarily incorporates many HIPAA standards in its corporate policies regarding handling of health data it receives. At the international level, the General Data Protection Regulation (EU 2016/679) (“GDPR”) applies to RTI’s processing of personal data of residents of the EU. This law protects processing of all personal data by regulating collection, use, and disclosure as well as privacy and security requirements and imposes penalties for violations. RTI complies with this regulation for both general personal data as well as the higher sensitivity standards for health data and is implementing the standards of this regulation as part of corporate policy for processing of personal data from all jurisdictions.
9
Table of Contents
During the third quarter of 2018, we decided to stop procurement, manufacturing and distributing the map3® implants. This activity was completed in the fourth quarter of 2018. The map3® product is now off the market.
Corporate Compliance
We have a comprehensive compliance program. It is a fundamental policy of our company to conduct business in accordance with the highest ethical and legal standards. Our corporate compliance and ethics program is designed to promote legal compliance and ethical business practices throughout our domestic and international businesses.
Our compliance program is designed to substantially meet U.S. Sentencing Commission Guidelines for effective organizational compliance and ethics programs and to prevent and detect violations of applicable federal, state and local laws. Our compliance program is additionally responsible for compliance with relevant international laws and implementation of corporate programs to ensure compliance with multi-jurisdictional legislation on similar topics, i.e. HIPAA and GDPR.
Key elements of our compliance program include:
| • | Organizational oversight by senior-level personnel responsible for the compliance functions within our company; |
| • | Written standards and procedures, including a Code of Conduct; |
| • | Methods for communicating compliance concerns, including anonymous reporting mechanisms; |
| • | Investigation and remediation measures to ensure prompt response to reported matters and timely corrective action; |
| • | Compliance education and training for employees and contracted business associates such as distributors; |
| • | Auditing and monitoring controls to promote compliance with applicable laws and assess program effectiveness; |
| • | Oversight of interactions with healthcare professionals to ensure compliance with healthcare fraud & abuse laws, including mandated reporting of transfers of value to healthcare professionals under the Affordable Care Act; |
| • | Oversight of corporate handling of personal data to ensure compliance with data protection legislation; |
| • | Disciplinary guidelines to enforce compliance and address violations; |
| • | Screening of employees and relevant contracted business associates; and |
| • | Risk assessments to identify areas of regulatory compliance risk. |
Our allografts and xenografts, as well as the chemicals used in processing natural tissues and also in the manufacturing of metal and synthetic implants, are handled and disposed of in accordance with country-specific, federal, provincial, regional, state and/or local regulations, as applicable. We contract with independent third parties to perform all gamma irradiation of our surgical implants. In view of the engagement of a third party to perform irradiation services, the requirements for compliance with radiation hazardous waste do not apply, and therefore we do not anticipate that having any material adverse effect upon our capital expenditures, results of operations or financial condition. However, we are responsible for assuring that the service is being performed in accordance with applicable regulations.
As of December 31, 2019, we had a total of 935 employees of which 190 were employed outside of the United States. Management believes its relations with its employees are good.
10
Table of Contents
Seasonality
Our business is generally not seasonal in nature; however, the number of orthopedic implant surgeries and elective procedures generally declines during the summer months.
Our Internet address is www.rtix.com. Information included on our website is not incorporated by reference in our Form 10-K. We make available, free of charge, on or through the investor relations portion of our website, our annual reports on Form 10-K, quarterly reports on Form 10-Q and current reports on Form 8-K and amendments to such reports filed or furnished pursuant to Section 13(a) or 15(d) of the Securities Exchange Act of 1934, as amended (the “Exchange Act”), as soon as reasonably practicable after we file such material with, or furnish it to the SEC. These filings are also available on the SEC’s website at www.sec.gov. Also available on our website is our Corporate Governance Guidelines, our Code of Conduct, our Code of Ethics for Senior Financial Professionals, and the charters for our Audit Committee, Compensation Committee and Nominating and Governance Committee. Within the time period required by the SEC and Nasdaq, we will post any amendment to our Code of Ethics for our senior financial professionals and any waiver of our Code of Conduct applicable to our senior financial professionals, executive officers and directors.
| Item 1A. | RISK FACTORS |
An investment in our common stock involves a high degree of risk. You should consider each of the risks and uncertainties described in this section and all of the other information in this document before deciding to invest in our common stock. Any of the risk factors we describe below could severely harm our business, financial condition and results of operations. The market price of our common stock could decline if any of these risks or uncertainties develops into actual events and you may lose all or part of your investment.
COVID-19 has had and may continue to have a material, adverse impact on us.
A novel strain of coronavirus, COVID-19, has spread to multiple countries, including the United States, and several European countries, including Germany where we have significant operations. The COVID-19 pandemic has directly and indirectly materially and adversely impacted the Company’s business, financial condition and operating results. The extent to which these adverse impacts will continue will depend on numerous evolving factors that are highly uncertain, rapidly changing and cannot be predicted with precision or certainty at this time.
The spread of COVID-19 has caused many hospitals and other healthcare providers to refocus their care on the surge of the COVID-19 cases and to postpone elective and non-emergent procedures, restrict access to these facilities, and in some cases re-allocate scarce resources to their critically ill patients. These efforts have impacted and could continue to impact our business activities, including our product sales, as many of our products are used in connection with elective surgeries. Further, disruptions in the manufacture and/or distribution of our products or in our supply chain may occur as a result of the pandemic or pandemic-related events that result in staffing shortages, production slowdowns, stoppages, or disruptions in delivery systems, any of which could materially and adversely affect our ability to manufacture and/or distribute our products, or to obtain the raw materials and supplies necessary to manufacture and/or distribute our products, in a timely manner, or at all.
Many of our employees have been furloughed and although our operations are beginning to increase towards normal levels, we continue to have many employees working remotely. COVID-19 has had an adverse effect on the overall productivity of our workforce, and we may be required to continue to take extraordinary measures to ensure the safety of our employees and those of our business partners. In addition, our employees may be required to take time off for extended periods of time due to illness or as a result of government-imposed changes to daily routines, including school closures. Additionally, these measures are hindering our ability to recruit, vet and hire personnel for key positions. It is unknown how long these disruptions could continue.
As the global outbreak of COVID-19 continues to rapidly evolve, it could continue to materially and adversely affect our revenues, financial condition, profitability, and cash flows for an indeterminate period of time. We are unable to accurately predict the full impact that the ongoing COVID-19 pandemic will have due to numerous factors that are not within our control, including the duration and severity of the pandemic. Stay-at-home/shelter-in-place orders, business closures, travel restrictions, supply chain disruptions, employee illness or quarantines, and other extended periods of interruption to our business have resulted and could continue to result in disruptions to our operations, which have had and could continue to have adverse impacts on the growth of our business, have and could continue to cause us to cease or delay operations, and could prevent our customers from receiving shipments or processing payments. Some experts expect a second, more severe phase of the pandemic in the Fall of 2020 and Winter of 2021. Such a severe second phase would result in additional material adverse impacts upon the Company.
If our essential employees who are unable to telework become ill or otherwise incapacitated, our operations may be adversely impacted.
As a medical device manufacturer, we fall generally within a “critical essential infrastructure” sector, and we are considered exempt under most stay at home/shelter in place orders. Accordingly, our employees may continue to work because of the importance of our operations to the health and well-being of citizens in the states in which we operate. Consistent with these stay at home/shelter in place orders, we have implemented telework policies wherever possible for appropriate categories of “nonessential” employees. “Essential” employees that are unable to telework continue to work at our facilities, and we have implemented appropriate safety measures, including social distancing, face covering, temperature checking and increased sanitation standards. We are following guidance from the Center for Disease Control and the Occupational Safety and Health Administration regarding suspension of nonessential travel, self-isolation recommendations for employees returning from certain geographic areas, confirmed reports of any COVID-19 diagnosis among our employees, and the return of such employees to our workplace. Pursuant to updated guidance from the Equal Employment Opportunity Commission, we are engaging in limited and appropriate inquiries of employees regarding potential COVID-19 exposure, based on the direct threat that such exposure may present to our workforce. We continue to address other unique situations that arise among its workforce due to the COVID-19 pandemic on a case-by-case basis. While we believe that we have taken appropriate measures to ensure the health and wellbeing of our “essential” employees, there can be no assurances that our measures will be sufficient to protect our employees in our workplace or that they may otherwise be exposed to COVID-19 outside of our workplace. If a number of our essential employees become ill, incapacitated or are otherwise unable to continue working during the current or any future epidemic, our operations may be adversely impacted.
We are involved in an ongoing government investigation by the SEC, the results of which may have a material adverse effect on our financial condition and business.
The Audit Committee of the Board, with the assistance of independent legal and forensic accounting advisors, conducted an internal investigation of matters relating to the Company’s revenue recognition practices for certain contractual arrangements, primarily with OEM customers, including the accounting treatment, financial reporting and internal controls related to such arrangements (the “Investigation”). The Investigation also examined transactions to understand the practices related to manual journal entries for accrual and reserve accounts. The Investigation was precipitated by an investigation that the SEC is currently conducting of current and prior period matters relating to RTI’s revenue recognition practices (the “SEC Investigation”). The SEC has subpoenaed certain documents in connection with its investigation. We are cooperating with the SEC in connection with its investigation. Investigations of this nature are inherently uncertain and their results cannot be predicted. Regardless of the outcome, the SEC Investigation can have an adverse impact on us because of legal costs, diversion of management resources, and other factors. The SEC Investigation could also result in reputational harm to RTI, which, among other things, may limit the Company’s ability to obtain new customers and enter into new agreements with our existing customers and have a material adverse effect on RTI’s current and future business.
Our auditors have issued a “going concern” audit opinion.
As discussed in Note 1 of the Consolidated Financial Statements in Part II, Item 8, “Financial Statements and Supplementary Data”, our independent auditors have indicated in their report on our financial statements for the year ended December 31, 2019 that there is substantial doubt about our ability to continue as a going concern. A “going concern” opinion indicates that the financial statements have been prepared assuming we will continue as a going concern and do not include any adjustments to reflect the possible future effects on the recoverability and classification of assets, or the amounts and classification of liabilities that may result if we do not continue as a going concern. Therefore, you should not rely on our consolidated balance sheet as an indication of the amount of proceeds that would be available to satisfy claims of creditors, and potentially be available for distribution to stockholders, in the event of liquidation.
11
Table of Contents
The SEC Investigation and the restatement of our previously issued financial statements, the errors that resulted in such restatement, the material weakness that was identified in our internal control over financial reporting and the determination that our internal control over financial reporting and disclosure controls and procedures were not effective, could result in loss of investor confidence, and additional litigation or governmental proceedings or investigations, any of which could cause an adverse effect on our business, results of operations and financial condition.
In connection with the filing of RTI’s Form 10-K/A for fiscal year end December 31, 2018, we corrected certain historical errors related to the timing of our revenue recognition for certain contractual arrangements, primarily with OEM customers, including the accounting treatment, financial reporting and internal controls related to such arrangements. As a result, we have determined that revenue for certain invoices should have been recognized at a later date than when originally recognized. In response to binding purchase orders from certain OEM customers, goods were shipped and received by the customers before requested delivery dates and agreed-upon delivery windows. In many instances, the OEM customers requested or approved the early shipments, but on other occasions the goods were delivered early without obtaining the customers’ affirmative approval. Some of those unapproved shipments were shipped by employees in order to generate additional revenue and resulted in shipments being pulled from a future quarter into an earlier quarter. In addition, the Company has concluded that, in July 2017, an adjustment was improperly made to a product return provision in the Direct Division. The revenue for those shipments is being restated, as well as for other orders that shipped earlier than the purchase order due date in the system for which the Company could not locate evidence that the OEM customers had requested or approved the shipments. In addition, the Company has concluded that, in the periods from 2015 through the fourth quarter of 2018, certain adjustments were incorrectly or erroneously made via manual journal entries to accrual/reserve accounts, including a July 2017 adjustment to a product return provision in the Direct Division, among others. Due to these determinations, we concluded that our previously issued consolidated financial statements for fiscal years ended December 31, 2016, 2017 and 2018, and selected financial data for the years ended December 31, 2014 and 2015, and each of our unaudited condensed consolidated financial statements and related disclosures for the quarterly and year-to-date periods during such years, as well as the first three quarters of 2019, should be restated.
In connection with this restatement of our prior consolidated financial statements, we have also identified material weaknesses in our internal control over financial reporting, and management has concluded that our internal control over financial reporting and disclosure controls and procedures were not effective as of December 31, 2018. For further discussion of the material weaknesses, please see “Item 9A. Controls and Procedures”. Remediation efforts place a significant burden on management and add increased pressure to our financial resources and processes.
If we are unable to successfully remediate our existing or any future material weaknesses or other deficiencies in our internal control over financial reporting or disclosure controls and procedures, investors may lose confidence in our financial reporting and the accuracy and timing of our financial reporting and disclosures and our business, reputation, results of operations, financial condition, market value of our debt securities, and ability to access the capital markets through debt issuances could be adversely affected.
We depend heavily upon sources of human tissue, and any failure to obtain tissue from these sources in a timely manner will interfere with our ability to process and distribute allografts.
The supply of human tissue has at times limited our growth, and may not be sufficient to meet our future needs. In addition, due to seasonal changes in mortality rates, some scarce tissues that we currently use for allografts are at times in particularly short supply. Other factors, some of which are unpredictable, such as negative publicity and regulatory actions in the industry in which we operate (and which may not involve us) also could unexpectedly reduce the available supply of tissue.
We rely on donor recovery groups for their human tissue supplies and we have relationships with tissue donor recovery groups across the country. We also have relationships outside the United States. Donor recovery groups are part of relatively complex relationships. They provide support to donor families, are regulated by the FDA and applicable foreign equivalents, and are often affiliated with hospitals, universities or organ procurement organizations. Our relationships with donor recovery groups, which are critical to our supply of tissue, could be affected by relationships recovery groups have with other organizations. Any negative impact arising from potential regulatory and disease transmission issues facing the industry, as well as the negative publicity that these issues could create, could adversely affect our ability to negotiate contracts with recovery groups.
We cannot be sure that the supply of human tissue will continue to be available at current levels or will be sufficient to meet our needs. If we are not able to obtain tissue from current sources sufficient to meet our needs, we may not be able to locate additional replacement sources of tissue on commercially reasonable terms, if at all. Any interruption of our business caused by the need to locate additional sources of tissue could significantly impact our revenues. We expect that our revenues from allografts would decline in proportion to any decline in tissue supply.
12
Table of Contents
We depend on various third-party suppliers and, in some cases, a single third-party supplier for key raw materials and component parts, apart from human tissue, used in our tissue processing and manufacturing processes, and the loss of any of these third-party suppliers, or their inability to supply us with adequate raw materials, could harm our business.
We use a number of raw materials in addition to human tissue, including titanium, titanium alloys, stainless steel, PEEK, PEKK, and animal tissue. We rely from time to time on a number of suppliers and, in some cases, on a single source vendor. Our dependence on single third-party suppliers, or even a limited number of third-party suppliers in certain instances, creates several risks, including limited control over pricing, availability, quality and delivery schedules. In addition, any supply interruption or cancellation in a limited or sole sourced component or raw material could materially harm our ability to manufacture our products until a new source of supply, if any, could be found. We may be unable to find a sufficient alternative supply channel in a reasonable time period or on commercially reasonable terms, if at all, which would have an adverse effect on our business, financial condition and results of operations. In addition, a change in manufactures will require qualification of the new supplier to ensure they comply with our quality standards. Delays in qualifying a new supplier or re-qualifying an existing supplier could have an adverse effect on our business, financial condition and results of operations.
Consolidation in the healthcare industry could lead to demands for price concessions or to the exclusion of some suppliers from certain of our markets, which could have an adverse effect on our business, financial condition or results of operations.
Numerous initiatives and reforms initiated by legislators, regulators and third-party payers to curb rising healthcare costs, in addition to other economic factors, have resulted in a consolidation trend in the healthcare industry to create new companies with greater market power, including hospitals. As the healthcare industry consolidates, competition to provide products and services to industry participants has become, and will likely continue to become, more intense. This in turn has resulted, and will likely continue to result in, greater pricing pressures and the exclusion of certain suppliers from various market segments as group purchasing organizations, independent delivery networks, and large single accounts continue to use their market power to consolidate purchasing decisions for some of our existing and prospective customers. We expect the market demand, government regulation, and third-party reimbursement policies, among other potential factors, will continue to change the worldwide healthcare industry, resulting in further business consolidations and alliances among our customers and prospective customers, which may reduce competition among our existing and prospective customers, exert further downward pressure on the prices of our implants and may adversely impact our business, financial condition or results of operations.
Our health insurance and prescription drug coverage, along with our self-insurance reserves, may not cover future claims.
We currently self-insure for our U.S. employees’ medical and prescription drug insurance coverage. We are responsible for losses up to certain retention limits on both a per-claim and aggregate basis.
For policies under which we are responsible for losses, we record a liability that represents our estimated cost of claims incurred and unpaid as of the balance sheet date. Our estimated liability is not discounted and is based on a number of assumptions and factors, including historical trends and economic conditions, and is closely monitored and adjusted when warranted by changing circumstances. Fluctuating healthcare costs, severity of claims, increases in the employee population, and deviations from our expectations could affect the accuracy of estimates based on historical experience. If actual claims are greater in number and/or severity compared to what was estimated or medical costs increase beyond what was expected, our accrued liabilities might not be sufficient and we may be required to record additional expense. Unanticipated changes may produce materially different amounts of expense than that reported under these programs, which could adversely impact our operating results.
We operate in a highly regulated industry. An inability to meet current or future regulatory requirements in the United States or foreign jurisdictions, or any deficiencies with our manufacturing or quality systems and processes identified by regulatory agencies, could disrupt our business, subject us to regulatory action and costly litigation, damage our reputation for high quality production, cause a loss of confidence in the Company and our implants and negatively impact our financial position and operating results.
The FDA and several states have statutory authority to regulate allograft processing, including our BIOCLEANSE®, TUTOPLAST® and CANCELLE® SP processes, and allograft-based materials. We must register our facilities, whether located in the United States or elsewhere, with the FDA as well as regulators outside the United States, and our implants must be made in a manner consistent with current good tissue practices (“cGTP”) or similar standards in each jurisdiction in which we manufacture. In addition, the FDA and other agencies perform periodic audits to ensure that our facilities remain in compliance with all appropriate regulations, including primarily the quality system regulations and medical device reporting regulations. Following an inspection, an agency may issue a notice listing conditions that are believed to violate cGTP or other regulations (such as an FDA report on Form 483, Notice of Observations), or a warning letter for violations of “regulatory significance” that may result in enforcement action if not promptly and adequately corrected.
13
Table of Contents
Since 2009, the FDA has significantly increased its oversight of companies’ subject to its regulations, including medical device companies, by hiring new investigators and stepping up inspections of manufacturing facilities. In recent years, the FDA has also significantly increased the number of warning and untitled letters issued to companies. If the FDA were to conclude that we are not in compliance with applicable laws or regulations, or that any of our implants are ineffective or pose an unreasonable health risk, the FDA could ban such implants, detain or seize adulterated or misbranded implants, order a recall, repair, replacement, or refund of such implants, refuse to grant pending premarket approval applications or require certificates of foreign governments for exports and/or require us to notify health professionals and others that the implants present unreasonable risks of substantial harm to the public health. The FDA may also impose operating restrictions, enjoin and restrain certain violations of applicable law pertaining to medical devices and assess civil or criminal penalties against our officers, employees or us. The FDA may also recommend prosecution to the U.S. Department of Justice (“DOJ”). Any adverse regulatory action, depending on its magnitude, may restrict us from effectively marketing and selling our implants. Any inability to meet current or future regulatory requirements in the United States or foreign jurisdictions, or any deficiencies with our manufacturing or quality systems and processes identified by regulatory agencies would likely disrupt our business, subject us to regulatory action and costly litigation, damage our reputation for high quality production, cause a loss of confidence in the Company and our implants and negatively impact our financial position and operating results.
If any of our allografts fall under the FDA’s definitions of “more than minimally manipulated or indicated for non-homologous use,” we would be required to obtain medical device approval or clearance or biologics licenses, which could require clinical testing and could result in disapproval of our license applications and restricted distribution of any of our allografts which may become subject to pre-market approval. The FDA could require post-market testing and surveillance to monitor the effects of such allografts, could restrict the commercial applications of these allografts, and could conduct periodic inspections of our facilities and our suppliers. Delays encountered during the FDA approval process could shorten the patent protection period during which we have the exclusive right to commercialize such technologies or could allow others to come to market before us with similar technologies.
cGTP covers all stages of allograft processing, from procurement of tissue to distribution of final allografts. In addition, these regulations have a significant effect upon recovery agencies which supply us with tissue and have increased the cost of recovery activities. These increases have translated into increased costs for us, because we are expected to reimburse the recovery agencies based on their cost of recovery.
In addition to the FDA, several state agencies regulate tissue banking. Regulations issued by Florida, New York, California and Maryland are particularly relevant to our business. Most states do not currently have tissue banking regulations, but it is possible that others may make allegations against us or against donor recovery groups or tissue banks, including those with which we have relationships, about non-compliance with applicable FDA regulations or other relevant statutes and regulations. Allegations like these could cause regulators or other authorities to take investigative or other action, or could cause negative publicity for our business and the industry in which we operate.
Most of our metal, synthetic, and xenograft products, and a few allograft products, fall into an FDA classification that requires the submission of a 510(k). This process requires us to demonstrate that the device to be marketed is at least as safe and effective as, that is, substantially equivalent to, a legally marketed device. We must submit information that supports our substantial equivalency claims. Before we can market the new device, we must receive an order from the FDA finding substantial equivalence and clearing the new device for commercial distribution in the United States.
We are also subject to periodic inspection by the FDA for compliance with its QSR, among other FDA requirements, such as restrictions on advertising and promotion. Our manufacturing operations, and those of our third-party manufacturers, are required to comply with the QSR, which addresses a company’s responsibility for product design, testing and manufacturing quality assurance and the maintenance of records and documentation. The QSR requires that each manufacturer establish a quality system by which the manufacturer monitors the manufacturing process and maintains records that show compliance with FDA regulations and the manufacturer’s written specifications and procedures relating to the devices. QSR compliance is necessary to receive and maintain FDA clearance or approval to market new and existing products. The FDA makes announced and unannounced periodic and on-going inspections of medical device manufacturers to determine compliance with the QSR. If in connection with these inspections the FDA believes the manufacturer has failed to comply with applicable regulations and/or procedures, it may issue inspectional observations on Form 483 that would necessitate prompt corrective action. If FDA inspectional observations are not addressed and/or corrective action is not taken in a timely manner and to the FDA’s satisfaction, the FDA may issue a warning letter (which would similarly necessitate prompt corrective action) and/or proceed directly to other forms of enforcement action, including the imposition of operating restrictions, including a ceasing of operations, on one or more facilities, enjoining and restraining certain violations of applicable law pertaining to medical devices and assessing civil or criminal penalties against our officers, employees or us. The FDA could also issue a warning letter or a consent decree. The FDA may also recommend prosecution to the DOJ. Any adverse regulatory action, depending on its magnitude, may restrict us from effectively manufacturing, marketing and selling our products and could have a material adverse effect on our business, financial condition and results of operations.
14
Table of Contents
The FDA, in cooperation with U.S. Customs and Border Protection (“CBP”), administers controls over the import of medical devices into the United States. The CBP imposes its own regulatory requirements on the import of our products, including inspection and possible sanctions for noncompliance. We are also subject to foreign trade controls administered by certain U.S. government agencies, including the Bureau of Industry and Security within the Commerce Department and the Office of Foreign Assets Control within the Treasury Department. There are also requirements of state, local and foreign governments that we must comply with in the manufacture and marketing of our products. In many of the foreign countries in which we market our products, we are subject to local regulations affecting, among other things, design and product standards, packaging requirements and labeling requirements. Many of the regulations applicable to our devices and products in these countries are similar to those of the FDA. The member countries of the EU have adopted the European Medical Device Directive, which creates a single set of medical device regulations for products marketed in all member countries. Compliance with the Medical Device Directive and certification to a quality system (e.g., ISO 13485 certification) enable the manufacturer to place a CE mark on its products. To obtain authorization to affix the CE mark to a product, a recognized organization that has been designated by the member country to assess the conformity of certain products (a “European Notified Body”) must assess a manufacturer’s quality system and the product’s conformity to the requirements of the Medical Device Directive. We are subject to inspection by European notified bodies for compliance with these requirements. In addition, many countries, such as Germany, have very specific additional regulatory requirements for quality assurance and manufacturing with which we must comply.
Effective May 26, 2020, the MDR replaced the current medical device directives. All medical devices currently distributed in the EU under the medical device directives are likely impacted. The MDR may also include products, such as human tissue, not traditionally considered medical devices in the EU. Additionally, the MDR, among other things, increases regulatory requirements for several medical device groupings applicable to the Company’s implants distributed in the EU, including strengthening notified body oversight for Class I reusable surgical instruments, and up-classifying spinal devices in contact with the spinal column. Additional pre-clinical testing or clinical studies may be required to meet new MDR requirements. As notified bodies are preparing for certification under the MDR, a trend has been observed among industry participants that the notified bodies are becoming more rigorous and conservative in their interpretation and application of currently existing directives, resulting in observations requiring corrective actions, particularly with respect to clinical evaluation reports, that cause industry members, including the Company, to incur additional costs. Further, with the implementation of the MDR the demand for notified body services is anticipated to increase while the number of eligible entities qualified as notified bodies is anticipated to decrease, thereby creating for the foreseeable future an imbalance in supply and demand that is anticipated to increase the cost of notified body services. Meeting the requirements of the MDR will likely cause us to incur additional costs and/or require us to discontinue distributing certain products in the EU and other countries outside the EU that rely on the CE mark for distribution into such countries. If we are unable to timely meet the requirements of the new MDR we may be prohibited from distributing our affected products in the EU and other countries that rely on the CE mark, which could cause us to lose revenue. Further, notified bodies are subject to new certification. If the Company’s notified body is not re-certified, or if they are certified for a narrower range of product types, the Company may have to engage a new or additional notified body which could cause a delay in meeting the new MDR requirements. Individually or cumulatively, these changes associated with the MDR could cause us to incur costs or require us to change our business practices in a manner adverse to our business. As of April 23, 2020, implementation of the EU MDR has been delayed until May 26, 2021.
Our business is subject to complex and evolving U.S. and international laws and regulation regarding privacy and data protection. Many of these laws and regulations are subject to change and uncertain interpretation and could result in claims, changes to our business practices, penalties, increased cost of operations, or declines in user growth or engagement, or otherwise harm our business.
Regulatory authorities around the world are considering a number of legislative and regulatory proposals concerning data protection. The interpretation and application of consumer and data protection laws in the United States, EU and elsewhere are often uncertain and subject to change. It is possible that these laws may be interpreted and applied in a manner that is inconsistent with our data practices. These legislative and regulatory proposals, if adopted, and such interpretations could, in addition to the possibility of fines, result in an order requiring that we change our data practices, which could have an adverse effect on our business and results of operations. Complying with these various laws could cause us to incur substantial costs or require us to change our business practices in a manner adverse to our business.
Recent legal developments in Europe have created compliance uncertainty regarding certain transfers of personal data from Europe to the United States. For example, the GDPR, which became effective in the EU on May 25, 2018, applies to our activities conducted from an establishment in the EU or related to products and services that we offer to EU customers. The GDPR will create a range of new compliance obligations, which could cause us to change our business practices, and will significantly increase financial penalties for noncompliance.
15
Table of Contents
In addition, the EC in July 2016 and the Swiss Government in January 2017 approved the EU-U.S. and the Swiss-U.S. Privacy Shield frameworks, respectively, which are designed to allow U.S. companies that self-certify to the U.S. Department of Commerce and publicly commit to comply with the Privacy Shield requirements to freely import personal data from the EU and Switzerland. However, these frameworks face a number of legal challenges and their validity remains subject to legal, regulatory and political developments in both the EU and the United States. This has resulted in some uncertainty, and compliance obligations could cause us to incur costs or require us to change our business practices in a manner adverse to our business.
A majority of all of our allograft processing facilities are currently conducted in locations that may be at risk of damage from hurricanes, fire, or other natural disasters. If a natural disaster strikes our administrative headquarters or any of our other processing or manufacturing facilities, our operations may be interrupted and we may be unable to process or manufacture certain products for a substantial amount of time.
A majority of all of our allograft processing facilities are located in Alachua, Florida, in an area with historical occurrences of hurricane damage and wild fires. We have taken precautions to safeguard our facilities, including obtaining property, casualty and business interruption insurance. We have also developed an information technology disaster recovery plan. However, any future natural disaster at this or our other locations could cause substantial delays in our operations, damage or destroy our facilities, equipment or inventory, and cause us to incur additional expenses. A disaster could seriously harm our business, financial condition and results of operations. Our facilities would be difficult to replace and would require substantial lead time to repair or replace. The insurance we maintain may not be adequate to cover our losses in any particular case and may not continue to be available to us on acceptable terms, or at all.
If we fail to maintain existing strategic relationships or are unable to identify distributors of our implants, revenues may decrease.
We currently derive a significant amount of our revenues through distributors such as Zimmer, Medtronic and Synthes. In addition, our spine distributors provide nearly all of the instrumentation, surgeon training, distribution assistance and marketing materials for the lines of spinal implants that we produce and they distribute.
Variations in the timing and volume of orders by our distributors, particularly those who distribute a significant amount of our implants, may have a material effect upon our revenues. If our relationships with our distributors are terminated or reduced for any reason and we are unable to replace these relationships with other means of distribution, we could suffer a material decrease in revenues.
We may need, or decide it is otherwise advantageous to us, to obtain the assistance of additional distributors to market and distribute our new implants and technologies, as well as to market and distribute our existing implants and technologies, to new markets or geographical areas. We may not be able to find additional distributors who will agree to and are able to successfully market and distribute our implants and technologies on commercially reasonable terms, if at all. If we are unable to establish additional distribution relationships on favorable terms, our revenues may decline.
Also, our financial results are dependent upon the service efforts of our distributors. If our distributors are unsuccessful in adequately servicing our products, our sales could significantly decrease.
If third-party payers fail to provide appropriate levels of reimbursement for the use of our implants, revenues could be adversely affected.
The impact of U.S. healthcare reform legislation on our business remains uncertain. In 2010 federal legislation to reform the U.S. healthcare system was enacted into law. The impact of this far-reaching legislation, including Medicare provisions purportedly aimed at improving quality and decreasing costs, comparative effectiveness research, an independent payment advisory board, and pilot programs to evaluate alternative payment methodologies, could meaningfully change the way healthcare is designed and delivered. It is possible that aspects of currently enacted legislation may change or be struck down by the courts. The extent of any such changes and the impact on our business is uncertain. We therefore cannot predict what other healthcare programs and regulations will be ultimately implemented at the federal or state level, or the effect of any future legislation, court rulings or regulation in the United States. Amendments to, or rescissions of, existing laws and regulations, or the implementation of new ones, could meaningfully change the way healthcare is designed and delivered. Any change that lowers reimbursement for an implant, our services, or our other technologies, or that reduces medical procedure volumes, would likely adversely impact our business and results of operations.
16
Table of Contents
If we fail to maintain the high processing standards that implants require or if we are unable to develop processing capacity as required, our commercial opportunity will be reduced or eliminated.
Implants require careful calibration and precise, high-quality processing and/or manufacturing. Achieving precision and quality control requires skill and diligence by our personnel. If we fail to achieve and maintain these high standards, including avoiding processing and manufacturing errors, and, depending on the nature of the complaint, design defects or component failures; we could be forced to recall, withdraw or suspend distribution of our implants; our implants and technologies could fail quality assurance and performance tests; production and deliveries of our implants could be delayed or cancelled and our processing and/or manufacturing costs could increase.
Further, to be successful, we will need to manage our human tissue processing capacity related to tissue recovery and demand for our allografts. It may be difficult for us to match our processing capacity to demand due to problems related to the amount of suitable tissue, quality control and assurance, tissue availability, adequacy of control policies and procedures and lack of skilled personnel. If we are unable to process and produce our implants on a timely basis, at acceptable quality and costs, and in sufficient quantities, or if we experience unanticipated technological problems or delays in processing, it may reduce revenues, increase our cost per allograft processed or both.
The allograft industry is subject to additional local, state, federal and international government regulations and any increased regulations of our activities could significantly increase the cost of doing business, thereby reducing profitability.
Some aspects of our business are subject to additional local, state, federal or international regulation. Changes in the laws or new interpretations of existing laws could negatively affect our business, revenues or prospects, and increase the costs associated with conducting our business. In particular, the procurement and transplantation of allograft tissue is subject to federal regulation under the National Organ Transplant Act (“NOTA”), a criminal statute that prohibits the purchase and sale of human organs, including bone and other tissue. NOTA permits the payment of reasonable fees associated with the transportation, processing, preservation, quality control and storage of human tissue. If NOTA were amended or interpreted in a way that made us unable to include some of these costs in the amounts we charge our customers, it could reduce our revenues and therefore negatively impact our business. It is possible that more restrictive interpretations or expansions of NOTA could be adopted which could require us to change one or more aspects of our business, at a substantial cost, in order to continue to comply with this statute.
A variety of additional local, state, federal and international government laws and regulations govern our business, including those relating to the storage, handling, generation, manufacture and disposal of medical wastes from the processing of tissue and collaborations with health care professionals. If we fail to conduct our business in compliance with these laws and regulations, we could be subject to significant liabilities for which our insurance may not be adequate. Moreover, such insurance may not always be available in the future on commercially reasonable terms, if at all. If our insurance proves to be inadequate to pay a damage award, we may not have sufficient funds to do so, which would harm our financial condition and liquidity.
Our success depends on the continued acceptance of our surgical implants and technologies by the medical community.
New allograft, xenograft, metal or synthetic implants, technologies or enhancements to our existing implants may never achieve broad market acceptance, which can be affected by numerous factors, including lack of clinical acceptance of implants and technologies; introduction of competitive treatment options which render implants and technologies too expensive or obsolete; lack of availability of third-party reimbursement; and difficulty training surgeons in the use of tissue implants and technologies.
Market acceptance will also depend on our ability to demonstrate that our existing and new implants and technologies are an attractive alternative to existing treatment options. Our ability to do so will depend on surgeons’ evaluations of the clinical safety, efficacy, ease of use, reliability and cost-effectiveness of these treatment options and technologies. For example, we believe that some in the medical community have lingering concerns over the risk of disease transmission through the use of allografts.
Furthermore, we believe that even if the medical community generally accepts our implants and technologies, acceptance and recommendations by influential surgeons will be important to the broad commercial success of our implants and technologies. If our implants and technologies are not broadly accepted in the marketplace, we may not remain competitive in the market.
Rapid technological changes could result in reduced demand for our implants and products.
Technologies change rapidly in the industry in which we operate. For example, steady improvements have been made in synthetic human tissue substitutes which compete with our tissue implants. Unlike allografts, synthetic tissue technologies are not dependent on the availability of tissue. If one of our competitors successfully introduces synthetic technologies using recombinant technologies, which stimulate the growth of tissue surrounding an implant, it could result in a decline in demand for tissue implants. We may not be able to respond effectively to technological changes and emerging industry standards, or to successfully identify, develop or support new technologies or enhancements to existing implants in a timely and cost-effective manner, if at all. If we are unable to achieve the improvements in our implants necessary for their successful commercialization, the demand for our implants will suffer.
17
Table of Contents
We face intense competition, which could result in reduced acceptance and demand for our implants and technologies.
The medical technology/biotechnology industry is intensely competitive. We compete with companies in the United States and internationally that engage in the development and production of medical technologies and processes including biotechnology, orthopedic, pharmaceutical, biomaterial and other companies; academic and scientific institutions; and public and private research organizations.
Many of our competitors have much greater financial, technical, research, marketing, distribution, service and other resources than we do. Moreover, our competitors may offer a broader array of tissue repair treatment products, medical devices, surgical instruments and technologies or may have greater name recognition in the marketplace. We compete with a number of companies with significantly greater resources and brand recognition than ours. Our competitors, including several development stage companies, may develop or market technologies that are more effective or commercially attractive than our technologies, or that may render our technologies obsolete. For example, the development of a synthetic tissue implant that permits remodeling of bones could reduce the demand for allograft and xenograft-based implants and technologies.
If we do not manage the medical release of donor tissue into processing in an effective and efficient manner, it could adversely affect profitability.
Many factors affect the level and timing of donor medical releases, including the effectiveness of donor screening performed by donor recovery groups, the timely receipt, recording and review of required medical documentation, and employee loss and turnover in our medical records department. We can provide no assurance that releases will occur at levels which maximize our processing efficiency and minimize our cost per allograft processed.
Negative publicity concerning methods of human tissue recovery and screening of donor tissue in the industry in which we operate may reduce demand for our allografts and impact the supply of available donor tissue.
Media reports or other negative publicity concerning both methods of tissue recovery from donors and actual or potential disease transmission from donated tissue may limit widespread acceptance of our allografts, whether directed to allografts generally or our allografts specifically. Unfavorable reports of improper or illegal tissue recovery practices by any participant in the industry, both in the United States and internationally, as well as incidents of improperly processed tissue leading to transmission of disease, may broadly affect the rate of future tissue donation and market acceptance of allograft technologies.
Potential patients may not be able to distinguish our allografts, technologies and the tissue recovery and the processing procedures from those of our competitors or others engaged in tissue recovery. In addition, families of potential donors may become reluctant to agree to donate tissue to for-profit tissue processors.
If our patents and the other means we use to protect our intellectual property prove to be inadequate, our competitors could exploit our intellectual property to compete more effectively against us.
The law of patents and trade secrets is constantly evolving and often involves complex legal and factual questions. The U.S. government may deny or significantly reduce the coverage we seek for our patent applications before or after a patent is issued. We cannot be sure that any particular patent for which we apply will be issued, that the scope of the patent protection will be comprehensive enough to provide adequate protection from competing technologies, that interference, derivation, reexamination, post-grant review or inter parties review proceedings regarding any of our patent applications will not be filed, or that we will achieve any other competitive advantage from a patent. In addition, it is possible that one or more of our patents will be held invalid or reduced in scope of claims if challenged or that others will claim rights in or ownership of our patents and other proprietary rights. If any of these events occur, our competitors may be able to use our intellectual property to compete more effectively against us.
Because patent applications remain secret until published (typically 18 months after first filing) and the publication of discoveries in the scientific or patent literature often lag behind actual discoveries, we cannot be certain that our patent application was the first application filed disclosing or potentially covering a particular invention. If another party’s rights to an invention are superior to ours, we may not be able to obtain a license to use that party’s invention on commercially reasonable terms, if at all. In addition, our competitors, many of which have greater resources than ours, could obtain patents that will prevent, limit or interfere with our ability to make use of our inventions either in the United States or in international markets. Further, the laws of some foreign countries do not always protect our intellectual property rights to the same extent as the laws of the United States. Litigation or regulatory proceedings in the United States or foreign countries also may be necessary to enforce our patent or other intellectual property rights or to determine the scope and validity of the proprietary rights of our competitors. These proceedings may prove unsuccessful and may also be costly, result in development delays, and divert the attention of our management.
18
Table of Contents
We rely upon unpatented proprietary techniques and processes in tissue recovery, research and development, tissue processing, manufacturing and quality assurance. It is possible that others will independently develop technology similar to our technology or otherwise gain access to or disclose our proprietary technologies. We may not be able to meaningfully protect our rights in these proprietary technologies, which would reduce our ability to compete.
Our success depends in part on our ability to operate without infringing on or misappropriating the proprietary rights of others, and if we are unable to do so we may be liable for damages.
We cannot be certain that U.S. or foreign patents or patent applications of other companies do not exist or will not be issued that would prevent us from commercializing our allografts, xenografts, medical devices, surgical instruments and other technologies. Third parties may sue us for infringing or misappropriating their patent or other intellectual property rights. Intellectual property litigation is costly. If we do not prevail in litigation, in addition to any damages we might have to pay, we could be required to cease the infringing activity or obtain a license requiring us to make royalty payments. It is possible that a required license may not be available to us on commercially acceptable terms, if at all. In addition, a required license may be non-exclusive, and therefore our competitors may have access to the same technology licensed to us. If we fail to obtain a required license or are unable to design around another company’s patent, we may be unable to make use of some of the affected technologies or distribute the affected allografts, xenografts or surgical implants, which would reduce our revenues.
The defense costs and settlements for patent infringement lawsuits are not covered by insurance. Patent infringement lawsuits can take years to settle. If we are not successful in our defenses or are not successful in obtaining dismissals of any such lawsuit, legal fees or settlement costs could have a material adverse effect on our results of operations and financial position.
We or our competitors may be exposed to product or professional liability claims which could cause us to be liable for damages or cause investors to think we will be liable for similar claims in the future.
The development, manufacture, and distribution of implants, medical devices, surgical instruments, and other technologies for surgical and medical treatment entails an inherent risk of product or professional liability claims, and substantial product or professional liability claims may be asserted against us. We are party to a number of legal proceedings relating to professional liability. The prevailing view among the states throughout the United States is that providing allografts is a service and not the sale of a product. As such, allografts are not typically subject to product liability causes of action. However, the law of a particular state could change in response to legislative changes or by judicial interpretation in a state where such issue has either not been previously addressed or prior precedent is overturned or subject to different interpretations by a court of higher precedential authority. In addition, due to the international scope of our activities we are subject to the laws of foreign jurisdictions which may treat allografts as products in those jurisdictions.
The implantation of donated human tissue implants creates the potential for transmission of communicable diseases. Although we comply with federal, state and foreign regulations and guidelines intended to prevent communicable disease transmission, and our tissue suppliers are also required to comply with such regulations, there can be no assurances that: (i) our tissue suppliers will comply with such regulations intended to prevent communicable disease transmissions; (ii) even if such compliance is achieved, that our implants have not been or will not be associated with transmission of disease; or (iii) a patient otherwise infected with disease would not erroneously assert a claim that the use of our implants resulted in disease transmission.
Our business of designing, manufacturing and marketing metal, synthetic, and xenograft medical devices and surgical instruments exposes us to potential product liability risks that are inherent in such activities. In the ordinary course of business, we are the subject of product liability lawsuits alleging that component failures, manufacturing flaws, design defects or inadequate disclosure of product-related risks or product-related information resulted in an unsafe condition or injury to patients.
We currently have $30 million of product and professional liability insurance to cover claims. This amount of insurance may not be adequate for potential claims if we are not successful in our defenses. Moreover, insurance covering our business may not always be available in the future on commercially reasonable terms, if at all. If our insurance proves to be inadequate to pay a damage award, we may not have sufficient funds to do so, which would harm our financial condition and liquidity. In addition, successful product liability claims made against one of our competitors could cause claims to be made against us or expose us to a perception that we are vulnerable to similar claims. Claims against us, regardless of their merit or potential outcome, may also hurt our ability to obtain surgeon acceptance of our implants or to expand our business.
19
Table of Contents
We are subject to federal, state and foreign laws and regulations, including fraud and abuse laws, as well as anti-bribery laws, and could face substantial penalties if we fail to fully comply with such regulations and laws.
Our relationship with foreign and domestic government entities and healthcare professionals, such as physicians, hospitals and those to whom and through whom we may market our implants and technologies, are subject to scrutiny under various federal, state and territorial laws in the United States and other jurisdictions in which we conduct business. These include, for example, anti-kickback laws, physician self-referral laws, false claims laws, criminal health care fraud laws, and anti-bribery laws (e.g., the United States Foreign Corrupt Practices Act). Violations of these laws are punishable by criminal and/or civil sanctions, including, in some instances, fines, imprisonment and, within the United States, exclusion from participation in government healthcare programs, including Medicare, Medicaid and Veterans Administration health programs. These laws are administered by, among others, the DOJ, the Office of Inspector General of the Department of Health and Human Services, state attorneys general, and their respective counterparts in the applicable foreign jurisdictions in which we conduct business. Many of these agencies have increased their enforcement activities with respect to medical device manufacturers in recent years.
If we are not successful in expanding our distribution activities into international markets, we will not be able to pursue one of our strategies for increasing revenues.
Our international distribution strategies vary by market, as well as within each country in which we operate. For example, we distribute only a portion of our line of allograft and xenograft implants within each foreign country where we operate. Our international operations will be subject to a number of risks which may vary from the risks we face in the United States, including the need to obtain regulatory approvals in additional foreign countries before we can offer our implants and technologies for use; the potential burdens of complying with a variety of foreign laws; longer distribution-to-collection cycles, as well as difficulty in collecting accounts receivable; dependence on local distributors; limited protection of intellectual property rights; fluctuations in the values of foreign currencies; and political and economic instability.
Security breaches, loss of data and other disruptions could compromise sensitive information related to our business, prevent us from accessing critical information or expose us to liability, which could adversely affect our business and our reputation.
In the ordinary course of our business, we collect and store sensitive data, including patient health information, personally identifiable information about our employees, intellectual property, and proprietary business information. We manage and maintain our applications and data utilizing on-site and off-site systems. These applications and data encompass a wide variety of business-critical information including research and development information, commercial information and business and financial information.
The secure processing, storage, maintenance and transmission of this critical information is vital to our operations and business strategy, and we devote significant resources to protecting such information. Although we take measures to protect sensitive information from unauthorized access or disclosure, our information technology and infrastructure may be vulnerable to attacks by hackers, viruses, breaches or interruptions due to employee error or malfeasance, terrorist attacks, hurricanes, fire, flood, other natural disasters, power loss, computer systems failure, data network failure, internet failure, or lapses in compliance with privacy and security mandates. Any such virus, breach or interruption could compromise our networks and the information stored there could be accessed by unauthorized parties, publicly disclosed, lost or stolen. We have measures in place that are designed to detect and respond to such security incidents and breaches of privacy and security mandates. Any such access, disclosure or other loss of information could result in legal claims or proceedings, liability under laws that protect the privacy of personal information, government enforcement actions and regulatory penalties. Unauthorized access, loss or dissemination could also interrupt our operations, including our ability to receive and ship orders from customers, bill our customers, provide customer support services, conduct research and development activities, process and prepare company financial information, manage various general and administrative aspects of our business and damage our reputation, any of which could adversely affect our business.
Adverse litigation judgments or settlements resulting from legal proceedings in which we may be involved could expose us to monetary damages or limit our ability to operate our business.
We are currently involved in stockholder litigation and have in the past and may in the future become involved in other class actions, derivative actions, private actions, collective actions, investigations, and various other legal proceedings by stockholders, customers, employees, suppliers, competitors, government agencies, or others. The results of any such litigation, investigations, and other legal proceedings are inherently unpredictable and expensive. Any claims against us, whether meritorious or not, could be time consuming, result in costly litigation, damage our reputation, require significant amounts of management time, and divert significant resources. If any of these legal proceedings were to be determined adversely to us, or we were to enter into a settlement arrangement, we could be exposed to monetary damages or limits on our ability to operate our business, which could have an adverse effect on our business, financial condition, and operating results.
20
Table of Contents
We may be subject to suit under a state or federal whistleblower statute.
Those who engage in business with the federal government, directly or indirectly, may be sued under a federal whistleblower statute designed to combat fraud and abuse in the healthcare industry. These lawsuits, known as qui tam suits, are authorized under certain circumstances by the False Claims Act and can involve significant monetary damages and award bounties to private plaintiffs who successfully bring these suits. If any of these lawsuits were to be brought against us, such suits combined with increased operating costs and substantial uninsured liabilities could have a material adverse effect on our financial condition and operations.
The Affordable Care Act has sought to link the violations of the Anti-Kickback Statute with violations of the False Claims Act, making it arguably easier for the government or for whistleblowers, acting in the name of the government, to sue medical manufactures under the False Claims Act.
In addition to federal whistleblower laws, various states in which we operate also have separate whistleblower laws to which we may be subject.
Our business could be negatively affected as a result of actions of activist stockholders, and such activism could impact the trading value of our securities.
Responding to actions by activist stockholders can be costly and time-consuming, disrupting our operations and diverting the attention of management and our employees. Such activities could interfere with our ability to execute our strategic plan. In addition, a proxy contest for the election of directors at our annual meeting would likely require us to incur significant legal fees and proxy solicitation expenses and require significant time and attention by management and our Board of Directors. The perceived uncertainties as to our future direction also could affect the market price and volatility of our securities.
The tax treatment of corporations could be subject to potential legislative, administrative or judicial changes or interpretations.
The present federal income tax treatment of corporations may be modified by legislative, administrative or judicial changes or interpretations at any time. For example, on December 22, 2017, the Tax Cuts and Jobs Act of 2017 (the “Tax Legislation”) was enacted. The Tax Legislation significantly revises the U.S. corporate income tax code.
We are unable to predict whether future modifications will be made to the U.S. corporate income tax code. Any such future changes could materially adversely affect us.
We are dependent on our key management and technical personnel for continued success.
Our senior management team is concentrated in a small number of key members, and our future success depends to a meaningful extent on the services of our executive officers and other key team members, including members of our scientific staff. Generally, our executive officers and employees can terminate their employment relationship at any time. The loss of any key employees or our inability to attract or retain other qualified personnel could materially harm our business and prospects.
Competition for qualified leadership and scientific personnel in our industry is intense, and we compete for leadership and scientific personnel with other companies that have greater financial and other resources than we do. Our future success will depend in large part on our ability to attract, retain, and motivate highly qualified leadership and scientific personnel, and there can be no assurance that we are able to do so. Any difficulty in hiring or retaining needed personnel, or increased costs related thereto, could have a material adverse effect on our business, results of operations, and financial condition.
Additionally, the successful implementation of our growth strategy post-OEM Closing will depend in large part upon the ability and experience of members of our senior management and other personnel. Our performance will be dependent on our ability to identify, hire, train, motivate and retain qualified management and personnel with experience in the medical technology industry. We may be unable to attract and retain such personnel on acceptable terms, or at all. If we lose the service of qualified management or other personnel or are unable to attract and retain the necessary members of senior management or personnel post-OEM Closing, we may not be able to successfully execute on our business strategy, which could have an adverse effect on our business. Further, in response to the COVID-19 novel coronavirus pandemic and the resulting federal and local guidelines, RTI furloughed or reduced the hours of over 500 of its U.S.-based employees, beginning on April 6, 2020. Although our operations are beginning to increase towards normal levels, we continue to have many employees working remotely. RTI cannot predict when it will be able to resume normal operations and will continue to carefully monitor the situation.
21
Table of Contents
Water Street may exercise significant influence over us, including through its ability to elect up to two members of our Board of Directors.
We issued 50,000 shares of Series A convertible preferred stock (“Preferred Stock”) to WSHP Biologics Holdings, LLC, an affiliate of Water Street Healthcare Partners (“WSHP”), a leading healthcare-focused private equity firm (“Water Street”), in connection with the closing of the Pioneer acquisition. As holders of this Preferred Stock, Water Street is entitled to vote on an as-converted basis, up to a maximum number of as-converted shares, upon all matters upon which holders of our common stock have the right to vote. The shares of Preferred Stock owned by Water Street currently represent approximately 18% of the voting rights in respect of our share capital on an as-converted basis; accordingly, Water Street has the ability to significantly influence the outcome of any matter submitted for the vote of our stockholders (also, Water Street is not prohibited from buying shares of our common stock). In addition, the dividends which have accrued on each outstanding share of Preferred Stock are added to the liquidation value with respect to such share of Preferred Stock. On August 1, 2018, we amended and restated the Certificate of Designation of Series A Convertible Preferred Stock (the “Amended and Restated Certificate of Designation”). Pursuant to the terms of the Amended and Restated Certificate of Designation, dividends on our Preferred Stock ceased accruing as of July 16, 2018. We did not pay dividends on the Preferred Stock from the fourth quarter of 2013 through June 16, 2018. Consequently, we have accrued $16.5 million in preferred dividends payable as of December 31, 2019.
In connection with the Paradigm transaction, on March 8, 2019, the Company adopted a certificate of designation (the “Certificate of Designation”) containing provisions identical to the Amended and Restated Certificate of Designation in effect immediately prior to the transaction except with respect to the name of the Company, which was changed to “RTI Surgical Holdings, Inc.”, pursuant to the Company’s Amended and Restated Certificate of Incorporation.
Water Street may have interests that diverge from, or even conflict with, those of our other stockholders. In addition, our Amended and Restated Certificate of Incorporation and Investor Rights Agreement with Water Street provide that Water Street’s consent is required before we may take certain actions for so long as Water Street and its permitted transferees beneficially own in the aggregate at least 10% of our issued share capital.
In addition, our Amended and Restated Certificate of Incorporation and our Investor Rights Agreement with Water Street provide that Water Street has the right to designate and nominate, respectively, directors to our Board such that the percentage of the members of our Board so designated or nominated is approximately equal to Water Street’s percentage equity ownership interest in the Company. The maximum number of directors that Water Street is able to designate or nominate is two, with at least one of such directors to serve on each of our Board committees. If Water Street’s ownership of our share capital on an as-converted basis falls below 5% (calculated on a fully diluted basis, assuming conversion of the Preferred Stock at the then-existing conversion price), Water Street would have no further director designation or nomination rights under our Amended and Restated Certificate of Incorporation or the Investor Rights Agreement.
In addition, the ownership position and the governance rights of Water Street could discourage a third party from proposing a change of control or other strategic transaction with us.
Our ability to pay dividends and to make distributions may be limited or prohibited by the terms of our indebtedness or Preferred Stock.
We are, and may in the future become, party to agreements and instruments that restrict or prevent the payment of dividends on our capital stock. In June 2018, we entered into a Credit Agreement dated as of June 5, 2018 (the “2018 Credit Agreement”), among Legacy RTI, as a borrower, Pioneer, our wholly-owned subsidiary, as a borrower, the other loan parties thereto as guarantors (together, with Legacy RTI and Pioneer, the “JPM Loan Parties”), JPMorgan Chase Bank, N.A. (“JPM”), as lender (together with the various financial institutions as in the future may become parties thereto, the “JPM Lenders”) and as administrative agent for the JPM Lenders. Under the terms of the 2018 Credit Agreement, we are restricted from paying dividends on our common stock without the prior written consent of the administrative agent. We are also restricted from paying dividends or making distributions on our common stock without the prior written consent of the holders of a majority of the Preferred Stock pursuant to the terms of the Certificate of Designation, so long as any shares of the Preferred Stock remain outstanding. In addition, under the terms of the 2018 Credit Agreement, distributions to holders of our Preferred Stock are permitted only to the extent that we can satisfy certain financial covenant tests (based on the ratio of our total indebtedness to consolidated EBITDA) and meet other requirements.
The 2018 Credit Agreement and the 2019 Credit Agreement contain financial and operating restrictions that may limit our access to credit. If we fail to comply with financial or other covenants in the 2018 Credit Agreement and the 2019 Credit Agreement, we may be required to repay indebtedness to our existing lenders, which may harm our liquidity.
Provisions in the 2018 Credit Agreement and the 2019 Credit Agreement (defined below) impose restrictions on our ability to, among other things:
| • | merge or consolidate; |
22
Table of Contents
| • | make strategic acquisitions; |
| • | make dispositions of property; |
| • | create liens; |
| • | enter into transactions with affiliates; |
| • | become a guarantor; |
| • | pay dividends and make distributions; |
| • | incur more debt; and |
| • | make investments. |
The 2018 Credit Agreement and the 2019 Credit Agreement also contain financial covenants that require us to maintain compliance with specified financial ratios and maintain a specified amount of cash on hand.
We may not be able to comply with the financial covenants in the future. In the absence of a waiver from our lenders, any failure by us to comply with these covenants in the future may result in the declaration of an event of default, which could prevent us from borrowing under the 2018 Credit Agreement and the 2019 Credit Agreement. In addition to preventing additional borrowings under the 2018 Credit Agreement and the 2019 Credit Agreement, an event of default, if not cured or waived, may result in the acceleration of the maturity of indebtedness outstanding, if any, under the agreement, which would require us to pay all amounts outstanding. If an event of default occurs, we may not be able to cure it within any applicable cure period, if at all. If the maturity of our indebtedness is accelerated, we then may not have sufficient funds available for repayment or the ability to borrow or obtain sufficient funds to replace the accelerated indebtedness on terms acceptable to us, or at all.
We have incurred a significant amount of secured debt, and expect to incur a significant amount of additional debt in the future.
The 2018 Credit Agreement provides for a revolving credit facility in the aggregate principal amount of up to $100 million (the “2018 Facility”). We and Pioneer will be able to, at our option, and subject to customary conditions and JPM Lender approval, request an increase to the 2018 Facility by up to $50 million. A total of $50 million currently is outstanding on the 2018 Facility due to the Company’s pay off of its previous Third Amended and Restated Loan Agreement, dated as of August 3, 2017, with TD Bank, N.A. and First Tennessee Bank National Association.
The 2018 Facility is guaranteed by our domestic subsidiaries and is secured by: (i) substantially all of our assets and the assets of Pioneer; (ii) substantially all of the assets of each of our domestic subsidiaries; and (iii) 65% of the stock of our foreign subsidiaries. Borrowings made under the 2018 Credit Agreement will bear interest at a rate per annum equal to the monthly REVLIBOR30 Rate (“CBFR Loans”) plus an adjustable margin of up to 2.00% (the “CBFR Rate”). We may elect to convert the interest rate for the initial borrowings to a rate per annum equal to the adjusted London Interbank Offered Rate (“LIBOR”) (“Eurodollar Loans”) plus an adjustable margin of up to 2.00% (the “Eurodollar Rate”). For all subsequent borrowings, we may elect to apply either the CBFR Rate or Eurodollar Rate. The applicable margin is subject to adjustment after the end of each fiscal quarter, based upon our average quarterly availability. The maturity date of the 2018 Facility is June 5, 2023. The Company may make optional prepayments on the 2018 Facility without penalty.
Refer to Item 8, Note 18 for additional information regarding amendments to our credit agreements.
23
Table of Contents
Our level of indebtedness may limit our ability to react to changes in the economy or our industry and prevent us from meeting our obligations under the agreements relating to our indebtedness.
Any acquisitions, strategic investments, divestures, mergers or joint ventures we make may require the issuance of a significant amount of equity or debt securities and may not be scientifically or commercially successful.
As part of our business strategy, we intend to make certain acquisitions to obtain additional businesses, product and/or process technologies, capabilities and personnel. If we make one or more significant acquisitions in which the consideration includes securities, we may be required to issue a substantial amount of equity, debt, warrants, convertible instruments or other similar securities. Such an issuance could dilute your investment in our common stock or increase our interest expense and other expenses.
Our long-term strategy may include identifying and acquiring, investing in or merging with suitable candidates on acceptable terms, divesting of certain business lines or activities or entering into joint ventures. In particular, over time, we may acquire, make investments in, or merge with providers of product offerings that complement our business or may terminate such activities. Mergers, acquisitions and divestitures include a number of risks and present financial, managerial and operational challenges, including but not limited to:
Further, acquisitions involve a number of operational risks, such as:
| • | difficulty and expense of assimilating the operations, technology and personnel of the acquired business; |
| • | our inability to retain the management, key personnel and other employees of the acquired business; |
| • | our inability to maintain the acquired company’s relationship with customers and key third parties, such as alliance partners; |
| • | exposure to legal claims for activities of the acquired business prior to the acquisition; |
| • | the potential need to implement financial and other systems and add management resources; |
| • | the potential for internal control deficiencies in the internal controls of the acquired operations; |
| • | potential inexperience in a business area that is either new to us or more significant to us than prior to the acquisition; |
| • | the diversion of our management’s attention from our core business; |
| • | the potential impairment of goodwill and write-off of in-process research and development costs, adversely affecting our reported results of operations; and |
| • | increased costs to integrate or, in the case of a divestiture or joint venture, separate the technology, personnel, customer base and business practices of the acquired or divested business or assets. |
Any one of these risks could prevent an acquisition, strategic investment, divesture, merger or joint venture from being scientifically or commercially successful, which could have a material impact on our results of operations, and financial condition.
The pendency of the Contemplated Transactions may adversely affect the business, financial condition and results of operations of RTI.
Uncertainty about the effect of the Contemplated Transactions on employees, customers, suppliers, third-party distributors and other parties, may have an adverse effect on each of the business, financial condition and results of operations of RTI, regardless of whether the Contemplated Transactions are completed, and may have an adverse effect on the business, financial condition and results of operations of RTI if the Contemplated Transactions are completed. These risks include the following, all of which could be exacerbated by a delay in the completion of the Contemplated Transactions:
| • | the impairment of RTI’s ability to attract, retain and motivate current and prospective employees, including key personnel; |
| • | the diversion of significant time and resources of RTI’s management; |
24
Table of Contents
| • | difficulties maintaining relationships with RTI’s customers, suppliers, third-party distributors and other business partners; |
| • | delays or deferments of certain business decisions by RTI’s customers, suppliers, third-party distributors and other business partners; |
| • | RTI’s inability to pursue alternative business opportunities or make appropriate changes to the Business because of requirements in the OEM Purchase Agreement that it conduct the Business in all material respects in the ordinary course of business consistent with past practice and not engage in certain activities prior to the completion of the Contemplated Transactions; |
| • | any litigation concerning the Contemplated Transactions and related costs; and |
| • | the incurrence of significant costs, expenses and fees for professional services and other transaction costs in connection with the Contemplated Transactions. |
A disruption in the relationship with the OEM Business after the OEM Closing could have a material adverse impact on RTI’s business and operating results.
Following the OEM Closing, the OEM Business will manufacture certain metal and synthetic implants and associated instrumentation and process certain sterilized allograft and xenograft implants for RTI pursuant to the Distribution Agreements with one or more Group Companies. During portions of the term of the Distribution Agreements, the OEM Business will also provide certain supply chain services (including warehousing and drop-shipment services) and design and development services to RTI. The Distribution Agreements will have an initial term of five years with a possibility of renewal. Any disruption in supply or a significant change in RTI’s relationship with the OEM business after the OEM Closing could have a material adverse impact on RTI’s business and operating results. While the Company believes that there are alternate sources of supply that can satisfy its commercial requirements, it cannot be certain that identifying and establishing relationships with such sources, if necessary, would not result in significant delay or material additional costs.
Failure to consummate the Contemplated Transactions within the expected timeframe or at all could have a material adverse impact on the business, financial condition and results of operations of RTI.
There can be no assurance that the Contemplated Transactions will occur within the expected timeframe or at all. Consummation of the Contemplated Transactions are subject to specified conditions, including:
| • | the accuracy of the representations and warranties of the parties and compliance by the parties with their respective obligations under the OEM Purchase Agreement, in each case subject to certain materiality qualifiers; |
| • | the receipt of RTI stockholder approval; |
| • | the absence of any law or order in effect that prevents, makes unlawful or prohibits the consummation of the Contemplated Transactions; and |
| • | the absence of any material adverse effect on the OEM Group Companies, taken as a whole, or the OEM Business, in each case subject to certain exceptions, since December 31, 2018. |
We cannot provide any assurances that these conditions will be satisfied in a timely manner or at all or that the Contemplated Transactions will occur. In addition, the OEM Purchase Agreement contains certain termination rights.
The OEM Purchase Agreement limits our ability to pursue alternatives to the Contemplated Transactions.
The OEM Purchase Agreement contains provisions that make it more difficult for us to sell our assets or engage in another type of acquisition transaction with a party other than the buyer. These provisions include a non-solicitation provision, which generally prohibits our solicitation of third-party proposals relating to the acquisition of more than 20% of the consolidated assets of the Company or 20% of any class of the issued and outstanding equity securities of the Company (an “Acquisition Proposal”) (provided that any third-party inquiries, offers or proposals relating solely to our spine business shall not be considered an Acquisition Proposal) and restricts our ability to furnish non-public information to, or participate in any discussions or negotiations with, any third party with respect to any Acquisition Proposal, subject to certain limited exceptions. In addition, the buyer has an opportunity to modify the terms of the Contemplated Transactions in response to any competing acquisition proposals before our Board of Directors may withdraw or change its recommendation with respect to the Contemplated Transactions. Upon the termination of the OEM Purchase Agreement to pursue an alternative transaction, including in connection with a “superior proposal”, we will be required to pay $14.7 million as a termination fee. These provisions could discourage a potential third-party acquirer from considering or proposing an acquisition transaction, even if such potential third-party acquirer would be prepared to pay a higher price than what would be received in the Contemplated Transactions, or propose to acquire our entire company. These provisions might also result in a potential third-party acquirer proposing to pay a lower price than it might otherwise have proposed to pay because of the added expense of the termination fee that may become payable. If the OEM Purchase Agreement is terminated and we determine to seek another purchaser, we may not be able to negotiate a transaction with another party on terms at least comparable to the terms of the Contemplated Transactions.
25
Table of Contents
The amount of the net proceeds that RTI will receive is subject to uncertainties.
Pursuant to the OEM Purchase Agreement, the amount of net proceeds that RTI will receive from the Buyer is subject to uncertainties by virtue of the purchase price adjustments set forth in the OEM Purchase Agreement. The Buyer will pay or cause to be paid to RTI, in exchange for the issued and outstanding equity in the OEM Group Companies, an aggregate base purchase price equal to $440 million. The base purchase price will be subject to an adjustment based on the amount of cash and cash equivalents of the OEM Group Companies at the OEM Closing, certain capital expenditures made prior to the OEM Closing, outstanding indebtedness and unpaid transaction expenses of the OEM Group Companies at the OEM Closing, and RTI’s working capital for the OEM Group Companies.
Our stockholders may not receive any of the proceeds of the Contemplated Transactions.
The proceeds from the Contemplated Transactions will be paid directly to RTI and not our stockholders. Our Board of Directors will evaluate different alternatives for the use of the proceeds from the Contemplated Transactions. RTI intends to use substantially all of the proceeds to repay indebtedness and capitalize RTI for continued investment in its global spine portfolio. The Board does not currently expect to declare a special dividend of any such proceeds to our stockholders, but such a dividend may be paid in the future. If the Contemplated Transactions are consummated, the purchase price for the OEM Business will be paid directly to RTI. Our management will have discretion in the application of the net proceeds from the Contemplated Transactions. Although our Board will evaluate various alternatives regarding the use of the proceeds from the Contemplated Transactions, it has made no decision with respect to the specific use of proceeds other than as described above and has not committed to making any such decision by a particular date.
WSHP is the record owner of 50,000 shares of RTI’s preferred stock, which is 100% of the issued and outstanding preferred stock. Pursuant to the terms of the Certificate of Designation, WSHP is entitled to certain liquidation, redemption and conversion rights upon a change in control of RTI. The Sale may constitute the sale of substantially all of the assets of RTI, which would result in a change of control pursuant to the Certificate of Designation. As a result, there is a risk that the Sale will trigger such liquidation, redemption and conversion rights and WSHP may exercise these rights. WSHP has not informed RTI whether it would exercise any of these liquidation, redemption or conversion rights, if they are triggered as a result of the Contemplated Transactions. If WSHP were to opt to exercise its liquidation, redemption or conversion rights, and the Company determines that they have been triggered, then approximately $67 million of the proceeds from the Contemplated Transactions would be utilized for that purpose.
We have incurred and will continue to incur significant expenses in connection with the Contemplated Transactions, regardless of whether the Contemplated Transactions are completed.
We have incurred and will continue to incur significant expenses related to the Contemplated Transactions. These expenses include, but are not limited to, financial advisory and opinion fees and expenses, legal fees, accounting fees and expenses, certain employee expenses, consulting fees, filing fees, printing expenses and other related fees and expenses. Many of these expenses will be payable by us regardless of whether the Contemplated Transactions are completed.
Failure to complete the Contemplated Transactions could cause RTI’s stock price to decline.
The failure to complete the Contemplated Transactions may create doubt as to the value of the OEM Business and about RTI’s ability to effectively implement its current business strategies and/or a strategic transaction, which may result in a decline in RTI’s stock price.
26
Table of Contents
The Sale may trigger the liquidation, redemption and conversion rights of WSHP, an affiliate of Water Street, and WSHP may exercise those rights.
WSHP is the record owner of 50,000 shares of Preferred Stock, which is 100% of the issued and outstanding Preferred Stock. WSHP has agreed to vote “FOR” the approval of the Contemplated Transactions. Pursuant to the terms of the Certificate of Designation, WSHP is entitled to the following liquidation, redemption and conversion rights upon a change in control of RTI:
| • | Liquidation. The occurrence of a change of control of RTI is deemed a liquidation, dissolution and winding up of RTI and the holders of Preferred Stock are entitled to receive from RTI the liquidation preference with respect to the shares of Preferred Stock upon such occurrence. The “liquidation preference” is an amount in cash equal to the greater of: (i) the sum of $50 million ($1,000 for each share of Preferred Stock), plus all accrued and accumulated, but unpaid dividends on the shares of Preferred Stock (approximately $16.5 million as of December 31, 2019); and (ii) the amount WSHP would be entitled to receive upon a liquidation of RTI after a conversion of the shares of Preferred Stock issuable upon conversion (at the current ratio of approximately 228 shares of common stock). |
| • | Redemption. Beginning immediately prior to a change of control of RTI, WSHP may, at any time, request redemption of all or any portion of the shares of Preferred Stock. While the redemption price changes over time, RTI would currently be required to redeem the shares of Preferred Stock for an amount equal to the sum of $50 million ($1,000 for each share of Preferred Stock), plus all accrued and accumulated, but unpaid dividends on the shares of Preferred Stock (approximately $16.5 million as of December 31, 2019). |
| • | Conversion. Immediately prior to a change of control of RTI, the shares of Preferred Stock may be converted in full or in part, at any time, by WSHP into a number of shares of common stock of RTI equal to the quotient determined by dividing (i) $50 million, plus all accrued and accumulated, but unpaid dividends on the shares of the Preferred Stock (approximately $16.5 million as of December 31, 2019) by (ii) the conversion price then in effect. Immediately prior to the Closing, the conversion price of the Preferred Stock is expected to be $4.39 per share. |
The Sale may constitute the sale of substantially all of the assets of RTI, which would result in a change of control pursuant to the Certificate of Designation. As a result, there is a risk that the Sale will trigger such liquidation, redemption and conversion rights and WSHP may exercise these rights. The Sale may constitute the sale of substantially all of the assets of RTI, which would result in a change of control pursuant to the Certificate of Designation. As a result, there is a risk that the Sale will trigger such liquidation, redemption and conversion rights and WSHP may exercise these rights. WSHP has not informed the Company whether it would exercise any of these liquidation, redemption or conversion rights, if they are triggered as a result of the Contemplated Transactions. If WSHP were to opt to exercise its liquidation, redemption or conversion rights, then part of the proceeds from the Contemplated Transactions would be utilized for that purpose.
| Item 1B. | UNRESOLVED STAFF COMMENTS. |
None.
| Item 2. | PROPERTIES. |
United States
Our U.S. natural tissue processing facilities are located in Alachua, Florida, near metropolitan Gainesville, including four buildings on approximately 21 acres of property that we own.
Processing, Manufacturing and Laboratory Facilities
In Alachua, Florida, we own a 65,500 square foot processing facility and lease an 8,000 square foot facility for the processing of natural tissues utilizing our BioCleanse®, TUTOPLAST® and CANCELLE® SP sterilization processes. In addition, we also own a 42,000 square foot logistics and technology center. These facilities are pledged under the 2018 Credit Agreement.
In Marquette, Michigan, we own a 106,000 square foot facility for manufacturing metal and synthetic implants and instruments that also houses laboratory facilities. This facility is primarily used for our OEM business and is pledged under the 2018 Credit Agreement.
In Greenville, North Carolina, we lease a 15,500 square foot facility for manufacturing synthetic implants. This facility is primarily used for our OEM business.
Our processing and manufacturing facilities meet the cGMPs requirements and allows us to meet the requirements of an FDA-approved medical device manufacturer.
27
Table of Contents
Administrative, Distribution and Marketing Offices
The Company is headquartered in Deerfield, Illinois, in a leased space of 6,020 square feet for general and administrative functions.
In Alachua, Florida, we own two buildings totaling 71,000 square feet which house administrative, distribution, product development and marketing functions.
In Minnetonka, Minnesota, we lease 11,419 square feet for general and administrative functions. This facility is primarily used for our Spine business.
Germany
In Neunkirchen, Germany we own six buildings totaling approximately 60,000 square feet on approximately two acres of land, including 11,000 square feet of area for processing natural tissues utilizing the TUTOPLAST sterilization process. This facility is primarily used for our OEM business.
In Wurmlingen, Germany we lease 13,000 square feet for marketing, distribution, product development and general and administrative functions. This facility is primarily used for our Spine business.
The Netherlands
On January 1, 2020, the Company exited the lease of the sales and distribution office in Houten consisting of approximately 10,000 square feet.
We believe that we have sufficient space and facilities to meet our current and foreseeable future needs.
| Item 3. | LEGAL PROCEEDINGS. |
The Company is, from time to time, involved in litigation relating to claims arising out of its operations in the ordinary course of business. The Company believes that none of the claims that were outstanding as of December 31, 2019 will have a material adverse impact on its financial position or results of operations. Please see Note 23, Legal and Regulatory Actions, to the consolidated financial statements contained in Part II, Item 8 of this Form 10-K for additional information.
As described in the Explanatory Note to this Form 10-K, and as previously disclosed in RTI’s Current Report on Form 8-K filed with the SEC on March 16, 2020, the Audit Committee of the Board of RTI, with the assistance of independent legal and forensic accounting advisors, conducted an internal investigation of matters relating to the Company’s revenue recognition practices for certain contractual arrangements, primarily with OEM customers, including the accounting treatment, financial reporting and internal controls related to such arrangements (the “Investigation”). The Investigative procedures also examined transactions to understand the practices related to manual journal entries for accrual and reserve accounts. The Investigation was precipitated by an investigation by the SEC initially related to the periods 2014 through 2016. The SEC investigation is ongoing, and the Company is cooperating with the SEC in its investigation.
On April 7, 2020, the Audit Committee of the Board concluded that the Company will restate its previously issued audited financial statements for the years ended December 31, 2018, 2017 and 2016, and selected financial data for the years ended December 31, 2015 and 2014, and the unaudited financial statements for the quarterly periods within these years commencing with the first quarter of 2016.
Based on the results of the Investigation, the Company has concluded that revenue for certain invoices should have been recognized at a later date than when originally recognized. In response to binding purchase orders from certain OEM customers, goods were shipped and received by the customers before requested delivery dates and agreed-upon delivery windows. In many instances the OEM customers requested or approved the early shipments, but the Company has determined that on other occasions the goods were delivered early without obtaining the customers’ affirmative approval. Some of those unapproved shipments were shipped by employees in order to generate additional revenue and resulted in shipments being pulled from a future quarter into an earlier quarter. In addition, the Company has concluded that in July 2017 an adjustment was improperly made to a product return provision in the Direct Division. The revenue for those shipments is being restated, as well as for other orders that shipped earlier than the purchase order due date in the system for which the Company could not locate evidence that the OEM customers had requested or approved the shipments. In addition, the Company has concluded that in the periods from 2015 through the fourth quarter of 2018, certain adjustments were incorrectly or erroneously made via manual journal entries to accrual/reserve accounts, including a July 2017 adjustment to a product return provision in the Direct Division, among others. Accordingly, the Company has restated its financial statements to correct these adjustments.
28
Table of Contents
There is currently ongoing stockholder litigation related to the Company’s Investigation. A class action complaint was filed by Patricia Lowry against the Company, and certain current and former officers of the Company, in the United States District Court for the Northern District of Illinois on March 23, 2020 demanding a jury trial. A shareholder derivative lawsuit was filed by David Summers on behalf of the Company against certain current and former directors and officers of the Company in the United States District Court for the Northern District of Illinois on June 5, 2020 demanding a jury trial.
| Item 4. | MINE SAFETY DISCLOSURES. |
Not applicable.
29
Table of Contents
PART II
| Item 5. | MARKET FOR REGISTRANT’S COMMON EQUITY, RELATED STOCKHOLDER MATTERS AND ISSUER PURCHASES OF EQUITY SECURITIES |
Market Information and Holders
Our common stock is quoted on the Nasdaq Stock Market under the symbol “RTIX.”
As of May 19, 2020, we had 74,564,450 stockholders of record of our common stock. We believe that the number of beneficial owners is substantially greater than the number of record holders because a large portion of our common stock is held of record through brokerage firms in “street name.” The closing sale price of our common stock on May 19, 2020 was $2.31 per share.
The following table presents information with respect to our repurchases of our common stock during the year ended December 31, 2019.
| Period |
Total Number of Shares Purchased (1) |
Average Price Paid per Share |
Total Number of Shares Purchased as Part of Publicly Announced Plans or Programs |
Approximate Dollar Value of Shares that May Yet Be Purchased Under the Plans or Programs |
||||||||||||
| January 1, 2019 to January 31, 2019 |
9,192 | $ | 4.10 | — | — | |||||||||||
| February 1, 2019 to February 28, 2019 |
2,571 | $ | 4.98 | — | — | |||||||||||
| March 1, 2019 to March 31, 2019 |
17,258 | $ | 4.98 | — | — | |||||||||||
| April 1, 2019 to April 30, 2019 |
847 | $ | 4.98 | — | — | |||||||||||
| May 1, 2019 to May 31, 2019 |
6,901 | $ | 4.90 | — | — | |||||||||||
| June 1, 2019 to June 30, 2019 |
— | — | — | — | ||||||||||||
| July 1, 2019 to July 31, 2019 |
5,737 | $ | 4.05 | — | — | |||||||||||
| August 1, 2019 to August 31, 2019 |
2,075 | $ | 4.18 | — | — | |||||||||||
| September 1, 2019 to September 30, 2019 |
— | — | — | — | ||||||||||||
| October 1, 2019 to October 31, 2019 |
7,325 | $ | 2.78 | — | — | |||||||||||
| November 1, 2019 to November 30, 2019 |
2,215 | $ | 1.90 | — | — | |||||||||||
| December 1, 2019 to December 31, 2019 |
9,923 | $ | 4.52 | — | — | |||||||||||
|
|
|
|
|
|
|
|
|
|||||||||
| Total |
64,044 | $ | 4.31 | — | — | |||||||||||
|
|
|
|
|
|
|
|
|
|||||||||
| (1) | The purchases reflect amounts that are attributable to shares surrendered to us by employees to satisfy, in connection with the vesting of restricted stock awards, their tax withholdings obligations. |
Stock Performance Graph
The SEC requires us to present a chart comparing the cumulative total stockholder return on our common stock with the cumulative total stockholder return of: (1) a broad equity market index; and (2) a published industry or line-of-business index. We selected the Standard & Poor’s 500 Health Care Equipment Index based on our good faith determination that this index fairly represents the companies which compete in the same industry or line-of-business as we do. The chart below compares our common stock with the Nasdaq Composite Index and the Standard & Poor’s 500 Health Care Equipment Index and assumes an investment of $100.00 on December 31, 2014 in each of the common stock, the stocks comprising the Nasdaq Composite Index and the stocks comprising the Standard & Poor’s 500 Health Care Equipment Index.
30
Table of Contents
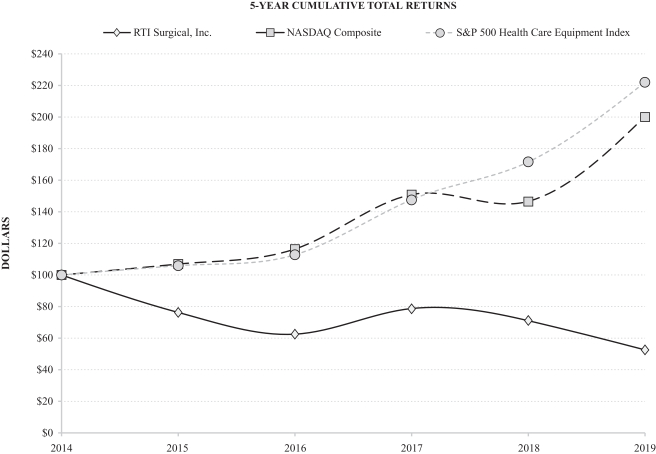
| Total Return Analysis |
2014 | 2015 | 2016 | 2017 | 2018 | 2019 | ||||||||||||||||||
| RTI Surgical, Inc. |
$ | 100.00 | $ | 76.35 | $ | 62.50 | $ | 78.85 | $ | 71.15 | $ | 52.69 | ||||||||||||
| NASDAQ Composite |
100.00 | 106.96 | 116.45 | 150.96 | 146.67 | 200.49 | ||||||||||||||||||
| S&P 500 Health Care Equipment Index |
100.00 | 105.97 | 112.85 | 147.71 | 171.70 | 222.04 | ||||||||||||||||||
| Item 6. | SELECTED FINANCIAL DATA. |
The statement of operations data set forth below for the years ended December 31, 2019, 2018 and 2017, and selected balance sheet data as of December 31, 2019 and 2018 have been derived from our audited consolidated financial statements and accompanying notes. The consolidated financial statements as of December 31, 2019 and 2018 and for the three years ended December 31, 2019, 2018 and 2017 are included elsewhere in this Form 10-K. The selected consolidated financial data set forth below should be read along with “Item 7. Management’s Discussion and Analysis of Financial Condition and Results of Operations,” which includes accounting changes and business combinations, and our consolidated financial statements and accompanying notes included elsewhere in this Form 10-K.
The statement of operations data set forth below for the year ended December 31, 2016 , and the balance sheet data set forth as of December 31, 2017 and 2016 have been derived from our audited consolidated financial statements and accompanying notes which are not included elsewhere in this Form 10-K.
The selected financial data as of and for the years ended December 31, 2019 and 2018 reflect our adoption of Financial Accounting Standards Board (“FASB”) issued Accounting Standards Update (“ASU”) 2014-09, Revenue from Contracts with Customers (Topic 606). The selected financial data as of and for the year ended December 31, 2019 also reflects our adoption of the FASB issued ASU 2016-02, Leases (Topic 842). We have not adjusted the selected financial data for any other period or as of any other date presented. See Note 4, Leases, and Note 6, Revenue from Contracts with Customers.
31
Table of Contents
| Year Ended December 31, | ||||||||||||||||||||
| 2019 | 2018 | 2017 | 2016 | 2015 | ||||||||||||||||
| (In thousands, except share and per share data) | ||||||||||||||||||||
| Statements of Operations Data: |
||||||||||||||||||||
| Revenues |
$ | 308,384 | $ | 280,362 | $ | 280,349 | $ | 275,984 | $ | 283,131 | ||||||||||
| Costs of processing and distribution |
137,259 | 140,719 | 137,277 | 142,657 | 133,460 | |||||||||||||||
|
|
|
|
|
|
|
|
|
|
|
|||||||||||
| Gross profit |
171,125 | 139,643 | 143,072 | 133,327 | 149,671 | |||||||||||||||
|
|
|
|
|
|
|
|
|
|
|
|||||||||||
| Expenses: |
||||||||||||||||||||
| Marketing, general and administrative |
157,675 | 119,724 | 115,009 | 116,666 | 107,550 | |||||||||||||||
| Research and development |
16,836 | 14,410 | 13,315 | 16,297 | 15,065 | |||||||||||||||
| Severance and restructuring costs |
— | 2,808 | 12,016 | 1,039 | 995 | |||||||||||||||
| Gain on acquisition contingency |
(76,033 | ) | — | — | — | — | ||||||||||||||
| Strategic review costs |
— | — | — | 1,150 | — | |||||||||||||||
| Executive transition costs |
— | — | 2,818 | 4,404 | — | |||||||||||||||
| Contested proxy expenses |
— | — | — | 2,680 | — | |||||||||||||||
| Asset impairment and abandonments |
97,341 | 5,070 | 4,034 | 5,241 | 814 | |||||||||||||||
| Litigation settlement and settlement charges |
— | — | — | — | 804 | |||||||||||||||
| Goodwill impairment |
140,003 | — | — | 1,107 | — | |||||||||||||||
| Acquisition and integration expenses |
17,159 | 4,943 | 630 | — | — | |||||||||||||||
| Cardiothoracic closure business divestiture contingency consideration |
— | (3,000 | ) | — | — | — | ||||||||||||||
| Gain on cardiothoracic closure business divestiture |
— | — | (34,090 | ) | — | — | ||||||||||||||
|
|
|
|
|
|
|
|
|
|
|
|||||||||||
| Total operating expenses |
352,981 | 143,955 | 113,732 | 148,584 | 125,228 | |||||||||||||||
|
|
|
|
|
|
|
|
|
|
|
|||||||||||
| Operating (loss) income |
(181,856 | ) | (4,312 | ) | 29,340 | (15,257 | ) | 24,443 | ||||||||||||
|
|
|
|
|
|
|
|
|
|
|
|||||||||||
| Other (expense) income: |
||||||||||||||||||||
| Interest expense |
(12,571 | ) | (2,771 | ) | (3,180 | ) | (1,655 | ) | (1,492 | ) | ||||||||||
| Interest income |
161 | 35 | 8 | 8 | 3 | |||||||||||||||
| Loss on extinguishment of debt |
— | (309 | ) | — | — | — | ||||||||||||||
| Foreign exchange (loss) gain |
(139 | ) | (34 | ) | 87 | (129 | ) | 78 | ||||||||||||
|
|
|
|
|
|
|
|
|
|
|
|||||||||||
| Total other expense - net |
(12,549 | ) | (3,079 | ) | (3,085 | ) | (1,776 | ) | (1,411 | ) | ||||||||||
|
|
|
|
|
|
|
|
|
|
|
|||||||||||
| (Loss) income before income tax (provision) benefit |
(194,405 | ) | (7,391 | ) | 26,255 | (17,033 | ) | 23,032 | ||||||||||||
| Income tax benefit (provision) |
(17,237 | ) | 4,268 | (19,349 | ) | 3,228 | (8,499 | ) | ||||||||||||
|
|
|
|
|
|
|
|
|
|
|
|||||||||||
| Net (loss) income |
(211,642 | ) | (3,123 | ) | 6,906 | (13,805 | ) | 14,533 | ||||||||||||
|
|
|
|
|
|
|
|
|
|
|
|||||||||||
| Convertible preferred dividend |
0 | (2,120 | ) | (3,723 | ) | (3,508 | ) | (3,305 | ) | |||||||||||
|
|
|
|
|
|
|
|
|
|
|
|||||||||||
| Net (loss) income applicable to common shares |
$ | (211,642 | ) | $ | (5,243 | ) | $ | 3,183 | $ | (17,313 | ) | $ | 11,228 | |||||||
|
|
|
|
|
|
|
|
|
|
|
|||||||||||
| Net (loss) income per common share - basic |
$ | (2.91 | ) | $ | (0.08 | ) | $ | 0.05 | $ | (0.30 | ) | $ | 0.19 | |||||||
|
|
|
|
|
|
|
|
|
|
|
|||||||||||
| Net (loss) income per common share - diluted |
$ | (2.91 | ) | $ | (0.08 | ) | $ | 0.05 | $ | (0.30 | ) | $ | 0.19 | |||||||
|
|
|
|
|
|
|
|
|
|
|
|||||||||||
| Weighted average shares outstanding - basic |
72,824,308 | 63,521,703 | 59,684,289 | 58,236,745 | 57,611,231 | |||||||||||||||
|
|
|
|
|
|
|
|
|
|
|
|||||||||||
| Weighted average shares outstanding - diluted |
72,824,308 | 63,521,703 | 60,599,952 | 58,236,745 | 58,590,494 | |||||||||||||||
|
|
|
|
|
|
|
|
|
|
|
|||||||||||
| As of December 31, | ||||||||||||||||||||
| 2019 | 2018 | 2017 | 2016 | 2015 | ||||||||||||||||
| Balance Sheet Data: |
||||||||||||||||||||
| Cash and cash equivalents |
$ | 5,608 | $ | 10,949 | $ | 22,381 | $ | 13,849 | $ | 12,614 | ||||||||||
| Working capital |
(44,574 | ) | 118,120 | 133,071 | 120,615 | 130,353 | ||||||||||||||
| Total assets |
344,509 | 360,185 | 345,764 | 367,955 | 379,844 | |||||||||||||||
| Long-term obligations - less current portion |
— | 49,073 | 42,076 | 77,267 | 73,631 | |||||||||||||||
| Redeemable preferred stock |
66,410 | 66,226 | 63,923 | 60,016 | 56,323 | |||||||||||||||
| Total stockholders’ equity |
34,564 | 181,530 | 181,516 | 164,060 | 179,908 | |||||||||||||||
32
Table of Contents
| Item 7. | MANAGEMENT’S DISCUSSION AND ANALYSIS OF FINANCIAL CONDITION AND RESULTS OF OPERATIONS. |
You should read the following discussion of our financial condition and results of operations together with those financial statements and the notes to those statements included elsewhere in this filing. This discussion contains forward looking statements based on our current expectations, assumptions, estimates and projections about us and our industry. Our actual results could differ materially from those anticipated in these forward-looking statements. We undertake no obligation to update publicly any forward-looking statements for any reason, even if new information becomes available or other events occur in the future.
Management Overview:
RTI is a global surgical implant company that designs, develops, manufactures and distributes biologic, metal and synthetic implants. Our implants are used in orthopedic, spine, sports medicine, plastic surgery, trauma and other surgical procedures to repair and promote the natural healing of human bone and other human tissues and improve surgical outcomes. We manufacture metal and synthetic implants and processes donated human musculoskeletal and other tissue and bovine and porcine animal tissue in producing allograft and xenograft implants using our proprietary BIOCLEANSE®, TUTOPLAST® and CANCELLE® SP sterilization processes. We process tissue at our facilities in Alachua, Florida and Neunkirchen, Germany and manufacture metal and synthetic implants in Marquette, Michigan and Greenville, North Carolina, respectively, and we have a distribution and research center in Wurmlingen, Germany. We are accredited in the United States by the American Association of Tissue Banks and we are a member of AdvaMed. Our implants are distributed directly to hospitals and free-standing surgery centers throughout the United States and in over 50 countries worldwide with the support of both our and third-party representatives as well as through larger purchasing companies.
Domestic distributions and services accounted for 90% of total revenues in 2019. Most of our implants are distributed directly to healthcare providers, hospitals and other healthcare facilities through a direct distribution force and through various OEM relationships.
International distributions and services accounted for 10% of total revenues in 2019. Our implants are distributed in over 50 countries through a direct distribution force in Germany and through stocking distributors in the rest of the world outside of Germany and the United States.
In 2019, we continued to implement a focused strategy to expand our spine and OEM operations and create long-term, profitable growth for the Company. The core components of our strategy were:
| • | Reduce Complexity. We worked to reduce complexity in our organization by divesting non-core assets and investing in core competencies. |
| • | Drive Operational Excellence. We worked to optimize material cost and drive operational efficiency to reduce other direct costs by pursuing world class manufacturing. |
| • | Accelerate Growth. We invested in innovative, niche high growth product categories leveraging core competency in the spine market; utilizing core technologies to expand OEM relationships and drive organic growth; and building relevant scale in our spinal portfolio to improve our importance to the consolidating healthcare market driven increasingly by integrated delivery networks and group purchasing organizations. |
In line with our strategy, on March 8, 2019, we acquired Paradigm, a leader in motion preservation and non-fusion spinal implant technology. Paradigm’s primary product is the coflex® Interlaminar Stabilization® device. Under the terms of the master transaction agreement dated March 8, 2019, we acquired Paradigm for $150.0 million in consideration paid at closing consisting of new debt financing of $100.0 million and $50.0 million of issued securities. In addition to the cash consideration amount and the stock consideration amount, we may be required to make further cash payments or issue additional shares of our common stock to Paradigm in an amount up to $50.0 million of shares of our common stock and an additional $100.0 million of cash and/or our common stock, in each case, if certain revenue targets are achieved between closing and December 31, 2022.
We believe this is a significant step toward focusing our business and advancing our efforts to generate predictable and sustainable operating results through disciplined execution and building scale to extend distribution of our products in those areas that offer the greatest opportunities to benefit our patients and stockholders.
We continue to maintain our commitment to research and development and the introduction of new strategically targeted allograft, xenograft, metal and synthetic implants as well as focused clinical efforts to support their acceptance in the marketplace. In addition, we consider strategic acquisitions from time to time for new implants and technologies intended to augment our existing implant offerings, as well as strategic dispositions from time to time in response to market trends or industry developments.
33
Table of Contents
On January 13, 2020, we entered into the OEM Purchase Agreement with Ardi Bidco, an affiliate of Montagu, in connection with the proposed sale of the OEM Business, for a purchase price of $440.0 million, subject to certain adjustments. More specifically, pursuant to the terms of the OEM Purchase Agreement, we will sell all of the issued and outstanding shares of the OEM Group Companies.
The OEM Purchase Agreement contemplates that, prior to the OEM Closing, we will undergo the Reorganization.
The Contemplated Transactions are subject to customary closing conditions, including, among other things: the approval of the Contemplated Transactions by the Company’s stockholders. The parties currently expect to close the Contemplated Transactions in the third quarter of 2020.
Following consummation of the Contemplated Transactions, RTI will focus exclusively on the design, development and distribution of spinal implants to the global market.
Restatement and Revision of Previously Issued Financials
As previously discussed in the Explanatory Note of this Form 10-K and as further discussed in Note 30 of the Consolidated Financial Statements in Part II, Item 8, “Financial Statements and Supplementary Data,” we have restated previously issued unaudited financial statements for the quarters ended March 31, 2019, June 30, 2019, and September 30, 2019, to correct certain errors.
COVID-19
As discussed in more detail throughout this Form 10-K, the coronavirus (COVID-19) pandemic, as well as the corresponding governmental response and the Company’s management of the crisis has had a significant impact on the Company’s business. The consequences of the outbreak and impact on the economy continues to evolve and the full extent of the impact is uncertain as of the date of this filing. The outbreak has already brought a significant disruption to the operations of the Company.
Critical Accounting Policies
The preparation of our financial statements in accordance with accounting principles generally accepted in the United States (“GAAP”) often requires us to make estimates and judgments that affect reported amounts. These estimates and judgments are based on historical experience and assumptions that we believe to be reasonable under the circumstances. Assumptions and judgments based on historical experience may provide reported results which differ from actual results; however, these assumptions and judgments historically have not varied significantly from actual experience and we therefore do not expect them to vary significantly in the future.
The accounting policies which we believe are “critical,” or require the most use of estimates and judgment, relate to the following items presented in our financial statements: (1) Tissue Inventory Valuation; (2) Accounts Receivable Allowances; (3) Long-Lived Assets; (4) Intangible Assets and Goodwill; (5) Revenue Recognition; (6) Stock-Based Compensation Plans; and (7) Income Taxes.
Due to the COVID-19 pandemic, there has been uncertainty and disruption in the global economy and financial markets. Our estimates or judgments as of the date of issuance of this Form 10-K may change as new events occur and additional information is obtained. Accordingly, actual results could differ materially from our estimates or judgements made under different assumptions or conditions.
Tissue Inventory Valuation. GAAP requires that inventory be stated at the lower of cost or market value. Due to various reasons, some tissue within our inventory will never become available for distribution. Therefore, we must make estimates of future distribution from existing inventory in order to write-off inventory which will not be distributed and which therefore has reduced or no market value.
Our management reviews available information regarding processing costs, inventory distribution rates, industry supply and demand, medical releases and processed tissue rejections, in order to determine write-offs of cost above market value. For a variety of reasons, we may from time to time be required to adjust our assumptions as processes change and as we gain better information. Although we continue to refine the information on which we base our estimates, we cannot be sure that our estimates are accurate indicators of future events. Accordingly, future adjustments may result from refining these estimates. Such adjustments may be significant.
Accounts Receivable Allowances. We maintain allowances for doubtful accounts based on our review and assessment of payment history and our estimate of the ability of each customer to make payments on amounts invoiced. If the financial condition of any of our customers were to deteriorate, additional allowances might be required. From time to time we must adjust our estimates. Changes in estimates of the collection risk related to accounts receivable can result in decreases and increases to current period net income.
Long-Lived Assets. We periodically evaluate the period of depreciation or amortization for long-lived assets to determine whether current circumstances warrant revised estimates of useful lives. We review our property, plant and equipment for impairment whenever events or changes in circumstances indicate the carrying value of an asset may not be recoverable. Recoverability is measured by a comparison of the carrying amount to the net undiscounted cash flows expected to be generated by the asset group. An impairment loss would be recorded for the excess of net carrying value over the fair value of the asset impaired. The fair value is estimated based on expected discounted future cash flows or other methods such as orderly liquidation value. The results of impairment tests are subject to management’s estimates and assumptions of projected cash flows and operating results. Changes in assumptions or market conditions could result in a change in estimated future cash flows and the likelihood of materially different reported results. Past estimates by management of the fair values and useful lives of long-lived assets and investments have periodically been impacted by one-time events.
During the fourth quarter of 2019, we incurred an asset impairment of $11.9 million consisting of $11.7 million related to property, plant and equipment and $0.2 million of right-of-use lease assets. The property, plant and equipment was measured utilizing an orderly liquidation value of each of the underlying assets. The right-of-use lease assets were measured utilizing a version of the income approach that considers the present value of the market-based rent payments for the applicable properties. The impairment resulted from a change made to the internal organization of the Company in the fourth quarter of 2019 as discussed in Item 8, Note 5. The organizational change resulted in the creation of a new Spine asset group. Prior to the fourth quarter of 2019, the Spine asset group did not exist as the related assets were included in another asset group as it had interdependencies among the utilization of the assets within the group, and therefore, there were no discrete cash flows. The newly formed Spine asset group could not support the carrying amount of the property, plant and equipment and the right of use asset, because the Spine asset group no longer has the benefit of shared resources and cashflows generated by the former asset group that it was previously included in.
During the second quarter of 2018, we incurred an asset impairment of $4.5 million related to the abandonment of our map3® implants as a result of us phasing out and ceasing distributions effective October 31, 2018. During the fourth quarter of 2017, we ceased certain long-term projects resulting in asset abandonments of long-term assets at our U.S. facility of $3.5 million.
34
Table of Contents
Intangible assets generally consist of finite-lived intangible assets, including patents, tradenames, procurement contracts, customer lists, distribution agreements and acquired exclusivity rights. Patents are amortized on the straight-line method over the shorter of the remaining protection period or estimated useful lives of between 8 and 16 years. Tradenames, procurement contracts, customer lists, acquired exclusivity rights and distribution agreements are amortized over estimated useful lives of between 5 to 25 years. As of December 31, 2019, the Company concluded, through the ASC 360 valuation testing, that factors existed indicating that finite-lived intangible assets in the Spine asset group were impaired. Thus, we tested the $85.1 million carrying amount of the intangible assets in the Spine asset group, for impairment on December 31, 2019. As a result, for the year ended December 31, 2019, we recorded an impairment charge for all of the finite-lived intangible assets within the Spine asset group, totaling $85.1 million. The method used to determine the fair value of the Spine asset group was based on a net asset value approach (ie a cost approach).
Intangible Assets and Goodwill. Financial Accounting Standards Board Accounting Standards Codification (“FASB ASC”) 350, Goodwill and Other Intangible Assets, requires companies to test goodwill for impairment on an annual basis at the reporting unit level (or an interim basis if an event occurs that might reduce the fair value of a reporting unit below its carrying value). The annual impairment test is performed at each year-end unless indicators of impairment are present and require more frequent testing. In December 2019, we changed our reporting structure, as we adopted new segment reporting, which we concluded resulted in two reporting units, Global Spine (“Spine”) and Global OEM (“OEM”). Refer to Item 8, Note 5 for further discussion regarding segment changes in 2019. With the change in reporting units we performed an impairment test prior to the change, on our previous one reporting unit, and then performed an impairment test immediately after the change on the two reporting units which also coincides with our annual impairment test date of December 31, 2019.
Goodwill is tested for impairment by comparing the fair value of the reporting unit to its carrying amount, including goodwill. Prior to 2019, in concluding as to fair value of the reporting unit for purposes of testing goodwill, an income approach and a market approach were utilized. The conclusion from these two approaches were weighted equally and then adjusted to incorporate a control premium or acquisition premium that reflects the additional amount a buyer is willing to pay for elements of control and for a premium that reflects the buyer’s perception of its ability to add value through synergies. In 2019, since the cash flows were negative over the forecast period for the Spine reporting unit, a cost approach was used to determine the fair value of the Spine reporting unit. For the OEM reporting unit, we weighted the income approach 75% and the market approach 25%. We have chosen the weightings because the income approach more fully captures the company specific factors that would not be directly captured in the market approach, as there are no pure publicly traded comparable companies.
The income approach employs a discounted cash flow model that considers: (1) assumptions that marketplace participants would use in their estimates of fair value, including the cash flow period, terminal values based on a terminal growth rate and the discount rate; (2) current period actual results; and (3) projected results for future periods that have been prepared and approved by our senior management.
The market approach employs market multiples from guideline public companies operating in our industry. Estimates of fair value are derived by applying multiples based on revenue and earnings before interest, taxes, depreciation and amortization (“EBITDA”) adjusted for size and performance metrics relative to peer companies. A control premium was included in determining the fair value under this approach.
The cost approach considers the replacement cost adjusted for certain factors. Certain balance sheet items were adjusted to fair value before being utilized in estimating the value of the reporting units under the cost approach, including inventory, property, plant and equipment, right of use assets, and other intangible assets.
All three approaches used in the analysis have a degree of uncertainty. Potential events or changes in circumstances which could impact the key assumptions used in our goodwill impairment evaluation are as follows:
| • | Change in peer group or performance of peer group companies; |
| • | Change in the company’s markets and estimates of future operating performance; |
| • | Change in the company’s estimated market cost of capital; and |
| • | Change in implied control premiums related to acquisitions in the medical device industry. |
The valuation of goodwill requires management to use significant judgments and estimates including, but not limited to, projected future revenue and cash flows, along with risk-adjusted weighted average cost of capital. Changes in assumptions or market conditions could result in a change in estimated future cash flows and the likelihood of materially different reported results.
35
Table of Contents
On March 8, 2019, we acquired Paradigm for a purchase price of approximately $232.9 million and recorded goodwill of approximately $135.6 million. Paradigm was initially included in the Company’s single reporting unit. With the change in reporting units, we performed a relative fair value valuation calculation to allocate the Company’s historical goodwill (existing prior to the Paradigm acquisition) between the two reporting units. The goodwill arising from the Paradigm acquisition was specifically allocated to the Spine reporting unit. The Company concluded specific allocation was most appropriate since Paradigm was recently acquired and the benefits of the acquired goodwill were never realized by the rest of the reporting unit as Paradigm was not integrated. Based on this change in reporting units, we conducted an impairment test before and after the change, and it was concluded that the fair value of our reporting unit exceeded the carrying value under the previous reporting unit structure. On the impairment test performed immediately subsequent to the change in reporting units, on the OEM reporting unit test, it was concluded the fair value of goodwill is substantially in excess of its carrying value; on the Spine reporting unit test, it was concluded the carrying value was in excess of the fair value of goodwill. Based on several factors, we weighted the income approach at 75% and the market approach at 25% in determining the fair value of our OEM reporting unit and utilized the cost approach for the Spine reporting unit for the purpose of the impairment test. The test resulted in the fair value of the OEM reporting unit exceeding the carrying value by approximately 54%, and the fair value of the Spine reporting unit could not support the allocated goodwill. As a result, for the year ended December 31, 2019, we recorded an impairment charge of all the goodwill in the Spine reporting unit totaling $140.0 million.
Revenue Recognition. We recognize revenue upon shipping, or receipt by our customers of our products and implants, depending on our distribution agreements with our customers or distributors. Our performance obligations consist mainly of transferring control of implants identified in our contracts. We typically transfer control at a point in time upon shipment or delivery of the implants for direct sales, or upon implantation for sales of consigned inventory. Our customer is able to direct the use of, and obtain substantially all of the benefits from, the implant at the time the implant is shipped, delivered, or implanted, respectively, based on the terms of the contract. For performance obligations related to our contracts with exclusively built inventory clauses, we typically satisfy our performance obligations evenly over the contract term as inventory is built. Such exclusively manufactured inventory has no alternative use and we have an enforceable right to payment for performance to date. We use the input method to measure the manufacturing activities completed to date, which depicts the progress of our performance obligation of transferring control of exclusively built inventory. For the contracts with upfront and annual exclusivity fees, revenue related to those fees is recognized over the contract term following a consistent method of measuring progress towards satisfaction of the performance obligation. We use the method and measure of progress that best depicts the transfer of control to the customer of the goods or services to date relative to the remaining goods or services promised under the contract.
We permit returns of tissue in accordance with the terms of contractual agreements with customers if the tissue is returned in a timely manner, in unopened packaging and from the normal channels of distribution. We provide allowances for returns based upon analysis of our historical patterns of returns, matched against the fees from which they originated. Historical returns have been within the amounts we reserved.
Stock-Based Compensation Plans. We account for our stock-based compensation plans in accordance with FASB ASC 718, Accounting for Stock Compensation (“FASB ASC 718”). FASB ASC 718 requires the measurement and recognition of compensation expense for all stock-based awards made to employees and directors, including employee stock options and restricted stock. Under the provisions of FASB ASC 718, stock-based compensation cost is measured at the grant date, based on the calculated fair value of the award, and is recognized as an expense on a straight-line basis over the requisite service period of the entire award (generally the vesting period of the award). We value restricted stock awards using the intrinsic value method, which is based on the fair market value price on the grant date. We use a Monte Carlo simulation model to estimate the fair value of restricted stock awards that contain a market condition.
Income Taxes. We use the asset and liability method of accounting for income taxes. Deferred income taxes are recorded to reflect the tax consequences on future years for differences between the tax basis of assets and liabilities and their financial reporting amounts at each year-end based on enacted tax laws and statutory tax rates applicable to the periods in which the differences are expected to affect taxable income. Valuation allowances are established when necessary to reduce deferred tax assets to amounts which are more likely than not to be realized.
Off Balance-Sheet Arrangements
As of December 31, 2019, we had no off-balance-sheet arrangements, as defined in Item 303(a)(4)(ii) of Regulation S-K.
Regulatory Approvals in 2019
Americas
| • | US 510(k) clearance of CervAlignTM Anterior Cervical Plate System |
| • | US 510(k) clearance of Streamline MIS Spinal Fixation System |
36
Table of Contents
| • | US 510(k) clearances of Fortilink® Interbody Fusion Device (IBF) with TETRAfuse® 3D Technology |
| • | US Puros Customized Block Allograft Market Extension |
| • | Canada Puros Customized Block Allograft Market Extension |
| • | El Salvador Puros Allograft Registration (Bone) |
| • | Peru Puros Allograft Registration (Dermis & Pericardium) |
Europe, Middle East, Africa
| • | Israel Puros Allograft Registration |
| • | Greece CopiOs Particulate and Membrane registration |
| • | Spain Puros Allograft Market Extension (Dowel & Blocks) |
| • | France Puros Allograft Registration |
| • | Europe Tutobone CE line extension |
Asia-Pacific
| • | Singapore Licenses for various allograft products |
| • | Malaysia Coflex registration |
| • | Taiwan Coflex-F+ registration |
37
Table of Contents
Results of Operations
The following tables set forth, in both dollars and as a percentage of revenues, the results of our operations for the years indicated:
| Year Ended December 31, | ||||||||||||||||||||||||
| 2019 | 2018 | 2017 | ||||||||||||||||||||||
| (Dollars in thousands) | ||||||||||||||||||||||||
| Statement of Operations Data: |
||||||||||||||||||||||||
| Revenues |
$ | 308,384 | 100.0 | % | $ | 280,362 | 100.0 | % | $ | 280,349 | 100.0 | % | ||||||||||||
| Costs of processing and distribution |
137,259 | 44.5 | 140,719 | 50.2 | 137,277 | 49.0 | ||||||||||||||||||
|
|
|
|
|
|
|
|
|
|
|
|
|
|||||||||||||
| Gross profit |
171,125 | 55.5 | 139,643 | 49.8 | 143,072 | 51.0 | ||||||||||||||||||
|
|
|
|
|
|
|
|
|
|
|
|
|
|||||||||||||
| Expenses: |
||||||||||||||||||||||||
| Marketing, general and administrative |
157,675 | 51.1 | 119,724 | 42.7 | 115,009 | 41.0 | ||||||||||||||||||
| Research and development |
16,836 | 5.5 | 14,410 | 5.1 | 13,315 | 4.7 | ||||||||||||||||||
| Severance and restructuring costs |
— | — | 2,808 | 1.0 | 12,016 | 4.3 | ||||||||||||||||||
| Gain on acquisition contingency |
(76,033 | ) | (24.7 | ) | — | — | — | — | ||||||||||||||||
| Executive transition costs |
— | — | — | — | 2,818 | 1.0 | ||||||||||||||||||
| Asset impairment and abandonments |
97,341 | 31.6 | 5,070 | 1.8 | 4,034 | 1.4 | ||||||||||||||||||
| Goodwill impairment |
140,003 | 45.4 | — | — | — | — | ||||||||||||||||||
| Acquisition and integration expenses |
17,159 | 5.6 | 4,943 | 1.8 | 630 | 0.2 | ||||||||||||||||||
| Cardiothoracic closure business divestiture contingency consideration |
— | — | (3,000 | ) | (1.1 | ) | — | — | ||||||||||||||||
| Gain on cardiothoracic closure business divestiture |
— | — | — | — | (34,090 | ) | (12.2 | ) | ||||||||||||||||
|
|
|
|
|
|
|
|
|
|
|
|
|
|||||||||||||
| Total operating expenses |
352,981 | 114.5 | 143,955 | 51.3 | 113,732 | 40.6 | ||||||||||||||||||
|
|
|
|
|
|
|
|
|
|
|
|
|
|||||||||||||
| Operating (loss) income |
(181,856 | ) | (59.0 | ) | (4,312 | ) | (1.5 | ) | 29,340 | 10.4 | ||||||||||||||
|
|
|
|
|
|
|
|
|
|
|
|
|
|||||||||||||
| Other (expense) income: |
||||||||||||||||||||||||
| Interest expense |
(12,571 | ) | (4.1 | ) | (2,771 | ) | (1.0 | ) | (3,180 | ) | (1.1 | ) | ||||||||||||
| Interest income |
161 | 0.1 | 35 | 0.0 | 8 | 0.0 | ||||||||||||||||||
| Loss on extinguishment of debt |
— | — | (309 | ) | (0.1 | ) | — | — | ||||||||||||||||
| Foreign exchange (loss) gain |
(139 | ) | (0.0 | ) | (34 | ) | (0.0 | ) | 87 | 0.0 | ||||||||||||||
|
|
|
|
|
|
|
|
|
|
|
|
|
|||||||||||||
| Total other expense - net |
(12,549 | ) | (4.0 | ) | (3,079 | ) | (1.1 | ) | (3,085 | ) | (1.1 | ) | ||||||||||||
|
|
|
|
|
|
|
|
|
|
|
|
|
|||||||||||||
| (Loss) income before income tax (provision) benefit |
(194,405 | ) | (63.0 | ) | (7,391 | ) | (2.6 | ) | 26,255 | 9.4 | ||||||||||||||
| Income tax benefit (provision) |
(17,237 | ) | (5.6 | ) | 4,268 | 1.5 | (19,349 | ) | (6.9 | ) | ||||||||||||||
|
|
|
|
|
|
|
|
|
|
|
|
|
|||||||||||||
| Net (loss) income |
(211,642 | ) | (68.6 | ) | (3,123 | ) | (1.1 | ) | 6,906 | 2.5 | ||||||||||||||
|
|
|
|
|
|
|
|
|
|
|
|
|
|||||||||||||
| Convertible preferred dividend |
— | — | (2,120 | ) | (0.8 | ) | (3,723 | ) | (1.3 | ) | ||||||||||||||
|
|
|
|
|
|
|
|
|
|
|
|
|
|||||||||||||
| Net (loss) income applicable to common shares |
$ | (211,642 | ) | (68.6 | %) | $ | (5,243 | ) | (1.9 | %) | $ | 3,183 | 1.2 | % | ||||||||||
|
|
|
|
|
|
|
|
|
|
|
|
|
|||||||||||||
| For the Year Ended December 31, | Percent Change | |||||||||||||||||||
| 2019 | 2018 | 2017 | 2019/2018 | 2018/2017 | ||||||||||||||||
| Spine |
$ | 118,987 | $ | 94,436 | $ | 92,712 | 26.0 | % | 1.9 | % | ||||||||||
| OEM |
189,397 | 185,926 | 187,637 | 1.9 | % | (0.9 | )% | |||||||||||||
|
|
|
|
|
|
|
|||||||||||||||
| Total Revenues |
$ | 308,384 | $ | 280,362 | $ | 280,349 | 10.0 | % | 0.0 | % | ||||||||||
|
|
|
|
|
|
|
|
|
|
|
|||||||||||
2019 Compared to 2018
Total Revenues. Our total revenues increased $28.0 million, or 10.0%, to $308.4 million for the year ended December 31, 2019, compared to $280.4 million for the year ended December 31, 2018 due to increased demand from certain OEM distributors, primarily in our acellular dermal matrix implants and our coflex® Interlaminar Stabilization® implants, acquired through the acquisition of Paradigm, partially offset by the abandonment of the map3® implant. Excluding our coflex® Interlaminar Stabilization® implants, totaling $30.3 million, our total revenues decreased $2.3 million, or 0.8%, to $278.1 million for the year ended December 31, 2019 compared to $280.4 million for the year ended December 31, 2018, primarily due to the abandonment of map3® implants.
38
Table of Contents
Spine Segment. Revenues from spinal implants increased $24.6 million, or 26.0%, to $119.0 million for the year ended December 31, 2019, compared to $94.4 million for the year ended December 31, 2018. Spine revenues increased primarily as a result of increased distributions of our coflex® Interlaminar Stabilization® implants, partially offset by the abandonment of the map3® implant. Excluding our coflex® Interlaminar Stabilization® implants, our spine implants decreased $5.7 million, or 6.0%, to $88.7 million for the year ended December 31, 2019 compared to $94.4 million for the year ended December 31, 2018.
OEM Segment. Revenues from OEM which includes sports allografts increased $3.5 million, or 1.9%, to $189.4 million for the year ended December 31, 2019, compared to $185.9 million for the year ended December 31, 2018. OEM revenues increased primarily due to increased demand from certain OEM distributors, primarily in our acellular dermal matrix implants and as a result of higher distributions of our Cortiva® implant.
Costs of Processing and Distribution. Costs of processing and distribution decreased $3.4 million, or 2.4%, to $137.3 million for the year ended December 31, 2019, from $140.7 million for the year ended December 31, 2018. Adjusted for the impact of purchase accounting step-up of $3.2 million and $0.6 million for the years ended December 31, 2019 and 2018, respectively, and an inventory write-off of $6.6 million related to the abandonment of our map3® implant and $1.0 million as a result of writing-off certain obsolete quantities primarily of bone graft substitute inventory due to the rationalization of our international distribution infrastructure for the year ended December 31, 2018, cost of processing and distribution increased $1.6 million, or 1.2%, to $134.1 million, or 43.5% of revenue, for the year ended December 31, 2019, compared to $132.5 million, or 47.3% of revenue, for the year ended December 30, 2018. The decrease in costs of processing and distribution was primarily due to the reduction in cost from our strategic initiative to optimize material cost and drive operational efficiency.
Marketing, General and Administrative Expenses. Marketing, general and administrative expenses increased $37.9 million, or 31.7%, to $157.7 million for the year ended December 31, 2019, compared to $119.7 million for the year ended December 31, 2018. Marketing, general and administrative expenses increased as a percentage of revenues from 42.7% for the year ended December 31, 2018 to 51.1% for the year ended December 31, 2019. The increase was primarily due to the Paradigm acquisition resulting in incremental headcount and marketing and administrative related expenses and increased legal cost related to patent litigation, all totaling $36.2 million.
Research and Development Expenses. Research and development expenses increased $2.4 million, or 16.7%, to $16.8 million for the year ended December 31, 2019, compared to $14.4 million for the year ended December 31, 2018. Research and development expenses increased as a percentage of revenues from 5.1% for the year ended December 31, 2018, to 5.5% for the year ended December 31, 2019. The increase in research and development was in support of our strategic initiative to accelerate growth resulting in increased investment in new product development and clinical studies.
Gain on Acquisition Contingency. Gain on acquisition contingency was $76.0 million for the year ended December 31, 2019. The gain on acquisition contingency was the result of an adjustment to our estimate of obligation for future milestone payments on the Paradigm and Zyga acquisitions. There was no gain on acquisition contingency for the year ended December 31, 2018.
Asset Impairment and Abandonments. Asset impairment and abandonments was $97.3 million for the year ended December 31, 2019, related to the impairment of long-lived and other intangible assets of our Spine segment compared to $5.1 million for the year ended December 31, 2018, primarily related to the abandonment of the map3® implant. During 2019, the Company concluded, through the ASC 350 valuation testing, that factors existed at year-end indicating that long-lived assets in the Spine segment were indicating impairment. As a result, for the year ended December 31, 2019, we recorded impairment charges to other intangible assets totaling $85.1 million, to property, plant and equipment, totaling $11.7 million, and to right-of-use assets totaling $0.2 million. In addition, for the year ended December 31, 2019, another $0.3 million in other intangible assets were disposed separately from the ASC 350 valuation testing.
Goodwill Impairment. Goodwill impairment was $140.0 million for the year ended December 31, 2019, which was recorded in our Spine segment as a result of the change in segment structure. There was no goodwill impairment for the year ended December 31, 2018.
Acquisition and Integration Expenses. Acquisition and integration expenses related to the purchase of Paradigm including $0.9 million of severance expense and $5.9 million in other business development costs resulted in $17.2 million of expenses for the year ended December 31, 2019, compared to $4.9 million of expenses related to the purchase of Paradigm and Zyga for the year ended December 31, 2018.
Total Net Other Expense. Total net other expense, which includes interest expense, interest income, loss on extinguishment of debt and foreign exchange loss increased $9.4 million, or 303.2%, to $12.5 million for the year ended December 31, 2019, compared to $3.1 million for the year ended December 31, 2018. The increase in total net other expense is primarily due to higher interest expense as a result of new debt financing due to the purchase of Paradigm.
Income Tax (Provision) Benefit. Income tax provision for the year ended December 31, 2019 was $17.2 million compared to an income tax benefit of $4.3 million for the year ended December 31, 2018. Our effective tax rate for the year ended December 31, 2019 and 2018 was (8.9)% and 57.7% respectively. Our effective tax rate for the year ended December 31, 2019, was primarily impacted by a non-deductible goodwill impairment and valuation allowances established offset by non-taxable gain on acquisition contingency.
39
Table of Contents
Non-GAAP Financial Measures
We utilize certain financial measures that are not calculated based on GAAP. Certain of these financial measures are considered “non-GAAP” financial measures within the meaning of Item 10 of Regulation S-K promulgated by the SEC. We believe that non-GAAP financial measures provide an additional way of viewing aspects of our operations that, when viewed with the GAAP results, provide a more complete understanding of our results of operations and the factors and trends affecting our business. These non-GAAP financial measures are also used by our management to evaluate financial results and to plan and forecast future periods. However, non-GAAP financial measures should be considered as a supplement to, and not as a substitute for, or superior to, the corresponding measures calculated in accordance with GAAP. Non-GAAP financial measures used by us may differ from the non-GAAP measures used by other companies, including our competitors.
To supplement our consolidated financial statements presented on a GAAP basis, we disclose non-GAAP net income applicable to common shares and non-GAAP gross profit adjusted for certain amounts. The calculation of the tax effect on the adjustments between GAAP net loss applicable to common shares and non-GAAP net income applicable to common shares is based upon our estimated annual GAAP tax rate, adjusted to account for items excluded from GAAP net loss applicable to common shares in calculating non-GAAP net income applicable to common shares. Reconciliations of each of these non-GAAP financial measures to the most directly comparable GAAP measures are included in the reconciliations below:
| For the Year Ended December 31, | ||||||||||||
| 2019 | 2018 | 2017 | ||||||||||
| (in thousands) | ||||||||||||
| Net (loss) income applicable to common shares, as reported |
$ | (211,642 | ) | $ | (5,243 | ) | $ | 3,183 | ||||
| Severance and restructuring costs |
— | 2,808 | 12,016 | |||||||||
| Executive transition costs |
— | — | 2,818 | |||||||||
| Gain on acquisition contingency |
(76,033 | ) | — | — | ||||||||
| Asset impairment and abandonments |
97,341 | 5,070 | 4,034 | |||||||||
| Goodwill impairment |
140,003 | — | — | |||||||||
| Inventory purchase price adjustment |
3,225 | 594 | — | |||||||||
| Loss on extinguishment of debt |
— | 309 | — | |||||||||
| Inventory write-off |
361 | 7,582 | — | |||||||||
| Acquisition and integration expenses |
17,159 | 4,943 | 630 | |||||||||
| Cardiothoracic closure business divestiture contingency consideration |
— | (3,000 | ) | — | ||||||||
| Gain on cardiothoracic closure business divestiture |
— | — | (34,090 | ) | ||||||||
| Net change in valuation allowance |
48,415 | (1,620 | ) | — | ||||||||
| Tax effect on new tax legislation |
— | (650 | ) | 2,187 | ||||||||
| Tax effect on other adjustments |
(30,204 | ) | (4,180 | ) | 13,117 | |||||||
|
|
|
|
|
|
|
|||||||
| Non-GAAP net (loss) income applicable to common shares, adjusted |
$ | (11,375 | ) | $ | 6,613 | $ | 3,895 | |||||
|
|
|
|
|
|
|
|||||||
40
Table of Contents
| For the Year Ended December 31, | ||||||||||||
| 2019 | 2018 | 2017 | ||||||||||
| Gross profit, as reported |
$ | 171,125 | $ | 139,643 | $ | 143,072 | ||||||
| Inventory write-off |
361 | 7,582 | — | |||||||||
| Inventory purchase price adjustment |
3,225 | 594 | — | |||||||||
|
|
|
|
|
|
|
|||||||
| Non-GAAP gross profit, adjusted |
$ | 174,711 | $ | 147,819 | $ | 143,072 | ||||||
|
|
|
|
|
|
|
|||||||
The following are explanations of the adjustments that management excluded as part of the non-GAAP measures for the years ended December 31, 2019, 2018 and 2017. Management removes the amount of these costs from our operating results to supplement a comparison to our past operating performance.
2018 and 2017 Severance and restructuring costs – These costs relate to the reduction of our organizational structure, primarily driven by simplification of our international operating infrastructure, specifically our distribution model.
2017 Executive transition costs – This adjustment represents charges relating to hiring a new Chief Executive Officer and Chief Financial and Administrative Officer.
2019 Gain on acquisition contingency – The gain on acquisition contingency relates to an adjustment to our estimate of obligation for future milestone payments on the Paradigm and Zyga acquisition.
2019, 2018 and 2017 Asset impairment and abandonments – These costs relate to asset impairment and abandonment of our spine segment, lower distributions and ultimate discontinuation of our map3® implant and certain long-term assets at our U.S. facilities.
2019 Goodwill impairment – These costs relate to goodwill impairment of our spine segment.
2019 and 2018 Inventory purchase price adjustment – These costs relate to the purchase price effects of acquired Paradigm and Zyga, respectively, inventory that was sold during the years ended December 31, 2019 and 2018, respectively.
2018 Loss on extinguishment of debt – These costs relate to refinancing our debt.
2018 Inventory write-off – These costs relate to an inventory write-off due to the rationalization of our international distribution infrastructure and an inventory write-off related to lower distributions and ultimate discontinuation of our map3® implant.
2019, 2018 and 2017 Acquisition and integration expenses – These costs relate to acquisition and integration expenses due to the purchase of Paradigm and Zyga.
2018 Cardiothoracic closure business divestiture contingency consideration – This adjustment represents the remaining cash contingency consideration received from the sale of substantially all of the assets of our CT Business to A&E.
2017 Gain on cardiothoracic closure business divestiture – This adjustment represents the gain relating to the sale of substantially all of the assets of our CT Business to A&E.
2019 and 2018 Net change in valuation allowance – This adjustment represents a net change in valuation allowance relating to foreign and certain state deferred tax assets.
2018 and 2017 Tax effect on new tax legislation – This adjustment represents charges relating to the Tax Legislation which was enacted on December 22, 2017.
Liquidity and Capital Resources
As of December 31, 2019, we had cash of $5.6 million, working capital deficiency of $44.6 million and an accumulated deficit of $451.2 million. We had a loss from operations of $181.9 million and a net loss of $211.6 million for the year ended December 31, 2019. We have suffered losses from operations in the previous two fiscal years and did not generate positive cash flows from operations in fiscal year 2019. As of May 29, 2020 our cash balance was approximately $2.7 million and the remaining availability on our revolving credit facility was $10.3 million. We are currently in compliance with all covenants contained in the 2018 Credit Agreement and the 2019 Credit Agreement.
41
Table of Contents
On April 27, 2020, we entered into an amendment to the 2019 Credit Agreement. The amendment amended the 2019 Credit Agreement to: (i) establish an incremental term loan commitment in an aggregate principal amount not to exceed $30 million (the “Second Amendment Incremental Loan Commitments”); and (ii) provide for a portion of the Second Amendment Incremental Loan Commitments up to $13.5 million be available on a delayed-draw basis at any time after the effective date of the amendment and on or prior to August 31, 2020, subject to certain conditions as set forth in the amendment and the 2019 Credit Agreement. The maturity of the loans advanced under Second Amendment Incremental Loan Commitments have a maturity date of April 27, 2021. These term loans must be repaid in their entirety, at which time a takeout fee ranging from $11.25 million to $25.5 million shall be due and payable.
Absent the closing of the Contemplated Transactions, which is contingent upon a number of factors and expected to close in the third quarter of 2020, the Company has limited financial resources available to support its ongoing operations and pay its obligations as they become due. These factors raise substantial doubt concerning the Company’s ability to continue as a going concern. The consolidated financial statements do not include any adjustments relating to the recoverability and classification of asset carrying amounts or the amount and classification of liabilities that might result should the Company be unable to continue as a going concern. The Company’s ability to continue as a going concern is largely dependent upon the consummation of the Pending Transaction, the ongoing support of its stockholders, creditors, and certain key customers, and/or its ability to successfully develop and market its spinal and OEM products at economically feasible levels in a highly competitive and rapidly changing healthcare environment.
Should the Pending Transaction not be consummated, the Company will continue to attempt to raise additional debt and/or equity financing to fund future operations and to provide additional working capital. However, there is no assurance that such financing will be consummated or obtained in sufficient amounts necessary to meet the Company’s liquidity needs. If cash resources are insufficient to satisfy the Company’s on-going cash requirements, the Company will be required to scale back or discontinue its operations entirely. No assurance can be given that any future financing will be available or, if available, that it will be on terms that are satisfactory to the Company. Even if the Company is able to obtain additional financing, it may contain undue restrictions on our operations, in the case of debt financing, or cause substantial dilution for our stockholders, in the case of equity financing. We note also that there is significant uncertainty of the effect that the novel coronavirus may have on the availability, cost and type of financing. If the Pending Transaction is not consummated, there will be an elevated risk that the Company will not comply with its loan covenants. Current forecasted results project violation of covenant ratios within the next year. Failure to comply with these loan covenants may result in a default on the Company’s debt obligations and a possible acceleration of these obligations.
As of December 31, 2019, the Company had two credit instruments outstanding that include various financial and administrative covenant requirements. Covenant requirements include, but are not limited to, fixed charge coverage ratios and total net leverage ratios. Some covenants are based on annual financial metric measurements whereas others are based on monthly and quarterly financial metric measurements. The Company routinely tracks and monitors its compliance with its covenant requirements. The fixed charge coverage ratio for both credit instruments remain constant throughout the term of the agreements. The total net leverage ratio covenant for the Ares Term Loan adjusts on a quarterly basis.
As of May 29, 2020, the Company was in compliance with its loan covenants; however, based on current financial trends relating to FY 2020 the Company does not expect to meet its covenant requirements as of the next measurement period, June 30, 2020. If these trends continue, the Company intends to seek a waiver with the issuers. The table below shows the covenant calculations for the Company’s credit instruments as of the balance sheet date and the most recent measurement period, March 31, 2020.
| Credit Facility |
Balance as of 12/31/2019 (000s) |
Financial Covenant |
Measurement |
Financial |
Financial Covenant Metric as of 12/31/2019 |
Financial Covenant Metric as of 3/31/2020 |
||||||||||||
| JPM Revolver |
$ | 71,000 | Fixed Charge Coverage Ratio |
Quarterly | >1.00:1.00 | 1.88:1.00 | 1.37:1.00 | |||||||||||
| Ares Term Loan |
$ | 104,406 | Fixed Charge Coverage Ratio |
Quarterly | >0.91:1.00 | 1.88:1.00 | 1.37:1.00 | |||||||||||
| Ares Term Loan |
$ | 104,406 | Total Net Leverage Ratio* |
Quarterly | <5.00:1.00 | 4.96:1.00 | 5.51:1.00 | |||||||||||
| * | As described in the Note 18 - Short and Long-Term Obligations - to the consolidated financial statements, the Ares Term Loan agreement steps down the original 9.00 : 1.00 Total Net Leverage Ratio each quarter, ending at a 3.50:1.00 ratio on September 30, 2021. The required ratio at December 31, 2019 was 5.00:1.00. At March 31, 2020 and June 30, 2020, the required ratio is 5.75:1.00 per the terms of the 2019 Credit Agreement. |
On April 9, 2020 and on May 8, 2020, the Company received waivers and consent agreements with respect to certain financial statement delivery requirements extending the due dates for delivering the required financial statements under the credit facilities. Further, Pursuant to two Consent Agreements, dated June 1, 2020, one with respect to the JPM Credit Facility and one for the Ares Credit Facility, each of JPM and Ares, respectively, agreed to extend the deadline for the delivery of the fiscal year end 2019 financial statements to June 8, 2020. Further, each of JPM and Ares also agreed to waive the requirement with respect to the going concern qualification.
42
Table of Contents
In view of the matters described above, management has concluded that substantial doubt exists with respect to the Company’s ability to continue as a going concern within one year after the date the financial statements are issued and our independent registered public accounting firm have included in their report relating to our 2019 financial statements a “going concern” explanatory paragraph as to substantial doubt of our ability to continue as a going concern.
Going Concern
In connection with the preparation of the consolidated financial statements for the year ended December 31, 2019, the Company conducted an evaluation as to whether there were conditions and events, considered in the aggregate, which raised substantial doubt as to the Company’s ability to continue as a going concern within one year after the date of the issuance, or the date of availability of the financial statements to be issued, noting that there did appear to be evidence of substantial doubt of the Company’s ability to continue as a going concern as further discussed in Note 1 to the consolidated financial statements.
2019 Compared to 2018
Our working capital at December 31, 2019 decreased $162.7 million to a deficiency of $44.6 million from $118.1 million at December 31, 2018, primarily as a result of the reclassification of debt balances to current and the purchase of Paradigm. As of December 31, 2019, we had $5.6 million of cash and cash equivalents and $9.0 million of availability under the revolving JPM facility. For the year ended December 31, 2019, the Company used approximately $9.5 million of cash in its operations, including $17.1 million used for Paradigm acquisition expenses and other business development, which contributes to the Company’s current liquidity position.
At December 31, 2019, we had 72 days of revenues outstanding in trade accounts receivable, an increase of 9 days compared to December 31, 2018. The increase is primarily driven by the longer period receivables remain outstanding for contracts with customers where inventory is exclusively built with no alternative use to us, and where revenue is recognized over time under ASC 606. While we previously recorded revenue and receivables at the time of shipment, they are now recorded over time. The customer, however, is only billed at the time of shipment.
At December 31, 2019, excluding the purchase accounting step-up of Paradigm inventory, we had 343 days of inventory on hand, an increase of 64 days compared to December 31, 2018. The increase in inventory days is primarily due to the acquisition of Paradigm. We believe that our inventory levels will be adequate to support our on-going operations for the next twelve months.
We had $5.6 million of cash and cash equivalents at December 31, 2019. At December 31, 2019, our foreign subsidiaries held $0.9 million in cash. We intend to indefinitely reinvest the earnings of our foreign subsidiaries. If we were to repatriate indefinitely reinvested foreign funds, we would not be subject to additional U.S. federal income tax, however, we would be required to accrue and pay any applicable withholding tax and U.S. state income tax liabilities. We do not believe that this policy of indefinitely reinvesting the earnings of our foreign subsidiaries will have a material adverse effect on the business as a whole.
Our short and long-term obligations at December 31, 2019, increased $125.1 million to $174.2 million from $49.1 million at December 31, 2018. The increase in short and long-term obligations was primarily due to increased borrowing to finance the Paradigm acquisition. Our debt agreements contain customary covenants, including a leverage ratio which progressively requires the Company to achieve higher earnings before interest, depreciation, taxes, and amortization to outstanding debt ratio. In addition, our recent acquisitions require additional cash payments if certain revenue targets are achieved.
On March 8, 2019, we acquired Paradigm, as discussed above under “Management Overview.”
On June 5, 2018, Legacy RTI, along with its wholly-owned subsidiary, Pioneer Surgical, entered into the 2018 Credit Agreement, as borrowers, with JPM, as lender (together with the various financial institutions as in the future may become parties thereto, the “JPM Lenders”) and as administrative agent for the JPM Lenders. The 2018 Credit Agreement provides for a revolving credit facility in the aggregate principal amount of up to $100.0 million (the “JPM Facility”) (subsequently reduced to $75.0 million, as described below). Legacy RTI and Pioneer Surgical will be able to, at their option, and subject to customary conditions and JPM Lender approval, request an increase to the JPM Facility in an amount not to exceed $50.0 million.
The JPM Facility is guaranteed by the Legacy RTI’s domestic subsidiaries and is secured by: (i) substantially all of the assets of Legacy RTI and Pioneer Surgical; (ii) substantially all of the assets of each of Legacy RTI’s domestic subsidiaries; and (iii) 65% of the stock of the Company’s foreign subsidiaries.
The CBFR Loans will bear interest at a rate per annum equal to the monthly REVLIBOR30 Rate plus the CBFR Rate. The Company may elect to convert the interest rate for the Eurodollars Loans to a rate per annum equal to the adjusted LIBOR Rate plus the JPM Eurodollar Rate. For all subsequent borrowings, Legacy RTI may elect to apply either the CBFR Rate or JPM Eurodollar Rate. The applicable margin is subject to adjustment after the end of each fiscal quarter, based upon Legacy RTI’s average quarterly availability. The maturity date of the JPM Facility is June 5, 2023. Legacy RTI may make optional prepayments on the JPM Facility without penalty. Legacy RTI paid certain customary closing costs and bank fees upon entering into the 2018 Credit Agreement.
43
Table of Contents
Legacy RTI is subject to certain affirmative and negative covenants, including (but not limited to), covenants limiting Legacy RTI’s ability to: incur certain additional indebtedness; create certain liens; enter into sale and leaseback transactions; and consolidate or merge with, or convey, transfer or lease all or substantially all of its assets to another person. Legacy RTI is required to maintain a minimum fixed charge coverage ratio of at least 1.00:1.00 (the “JPM Required Minimum Fixed Charge Coverage Ratio”) during either of the following periods (each, a “JPM Covenant Testing Period”): (i) a period beginning on a date that a default has occurred and is continuing under the loan documents entered into by the Company in conjunction with the 2018 Credit Agreement through the first date on which no default has occurred and is continuing; or (ii) a period beginning on a date that availability under the JPM Facility is less than the specified covenant testing threshold and continuing until availability under the JPM Facility is greater than or equal to the specified covenant testing threshold for thirty consecutive days. The JPM Required Minimum Fixed Charge Coverage Ratio is measured on the last day of each calendar month during the JPM Covenant Testing Period (each a “JPM Calculation Date”), and is calculated using the minimum fixed charge coverage ratio for the twelve consecutive months ending on each JPM Calculation Date. The amounts owed under the 2018 Credit Agreement may be accelerated upon the occurrence of certain events of default customary for facilities for similarly rated borrowers.
First Amendment to Credit Agreement and Joinder Agreement
On March 8, 2019, Legacy RTI entered into a First Amendment to the 2018 Credit Agreement and Joinder Agreement (the “2019 First Amendment”), which, among other things: (i) reduced the aggregate revolving commitments available to Legacy RTI and Pioneer Surgical from $100.0 million to $75.0 million; (ii) joined the Company and Paradigm, and its domestic subsidiaries as guarantors and loan parties to the 2018 Credit Agreement; (iii) permitted the Ares Term Loan (as defined below); and (iv) made certain other changes to the 2018 Credit Agreement consistent with the foregoing including pro rata reductions to certain thresholds that were based on the aggregate commitments under the 2018 Credit Agreement.
Second Amendment to Credit Agreement and Joinder Agreement
On December 9, 2019, Legacy RTI entered into a Second Amendment to Credit Agreement and Joinder Agreement (the “2019 Second Amendment”). The 2019 Second Amendment amended the 2018 Credit Agreement by increasing the aggregate revolving commitments available to Legacy RTI and Pioneer Surgical from $75.0 million to $80.0 million.
Third Amendment to Credit Agreement and Joinder Agreement
On April 9, 2020, Legacy RTI entered into a Consent and Third Amendment to Credit Agreement and Joinder Agreement (the “Third Amendment to the 2018 Credit Agreement”), by and among the JPM Loan Parties and the JPM Lenders. The Third Amendment to the 2018 Credit Agreement amended the 2018 Credit Agreement by: (i) extending the deadline for delivery of certain annual audited financial statements of the Company from March 30, 2020 to April 30, 2020; (ii) modifying certain interest rates contained therein to contain a 1.00% floor; (iii) requiring the Company and each other Loan Party to close all of its deposit accounts and securities accounts at Wells Fargo Bank, N.A. or any affiliates thereof; and (iv) making certain other changes to the 2018 Credit Agreement consistent with the foregoing.
Fourth Amendment to Credit Agreement and Joinder Agreement
On April 27, 2020, Legacy RTI entered into a Fourth Amendment to Credit Agreement (the “Fourth Amendment to the 2018 Credit Agreement”), by and among the JPM Loan Parties and the JPM Lenders. The Fourth Amendment to the 2018 Credit Agreement amends the 2018 Agreement to: (i) provide for a $8,000,000 block on availability under the 2018 Credit Agreement until the earlier of: (a) the date upon which at least $25,000,000 of the Second Amendment Incremental Term Loan Commitments (as defined below) have been funded to Legacy RTI in accordance with the 2019 Credit Agreement and evidence of such funding, in form and substance satisfactory to JPM, shall have been received by JPM; and (b) the date upon which (1) no default or event of default exists under the 2018 Credit Agreement; and (2) Ares notifies Legacy RTI that, for any reason, Second Amendment Incremental Term Loan Commitments have been terminated in accordance with the terms of the 2019 Credit Agreement and evidence of such termination, in form and substance satisfactory to JPM, shall have been delivered to JPM; (ii) amend the applicable rate with respect to any loan to 2.75% per annum; and (iii) amend the maturity date to the earlier to occur of: (a) June 5, 2023, or any earlier date on which the commitments are reduced to zero or otherwise terminated pursuant to the terms of the 2018 Credit Agreement; and (b) the date that is 30 days prior to the maturity date of the Second Amendment Incremental Term Loan Commitments, as the same may be extended from time to time pursuant to the terms of the 2019 Credit Agreement and such extension is agreed to by the JPM Lenders.
At December 31, 2019, the interest rate for the JPM Facility was 3.69%. As of December 31, 2019, there was $71.0 million outstanding on the JPM Facility and total remaining available credit on the JPM Facility was $9.0 million. The Company’s ability to access the JPM Facility is subject to and can be limited by the Company’s compliance with the Company’s financial and other covenants. The Company was in compliance with the financial covenants related to the JPM Facility as of December 31, 2019.
44
Table of Contents
Second Lien Credit Agreement and Term Loan
On March 8, 2019, Legacy RTI entered a Second Lien Credit Agreement dated as of March 8, 2019 (the “2019 Credit Agreement”), among Legacy RTI, as a borrower, the other loan parties thereto as guarantors (together with Legacy RTI, the “Ares Loan Parties”), Ares, as lender (together with the various financial institutions as in the future may become parties thereto, the “2019 Lenders”) and as administrative agent for the 2019 Lenders. The 2019 Credit Agreement provides for a term loan in the principal amount of up to $100.0 million (the “Ares Term Loan”). The Ares Term Loan was advanced in a single borrowing on March 8, 2019.
The Ares Term Loan is guaranteed by the Company and each of the Company’s domestic subsidiaries and is secured by: (i) substantially all of the assets of Legacy RTI; (ii) substantially all of the assets of the Company; (iii) substantially all of the assets of the Company’s domestic subsidiaries; and (iv) 65% of the stock of the Company’s foreign subsidiaries.
The Ares Term Loan will bear interest at a rate per annum equal to, at the option of Legacy RTI: (i) the monthly Base Rate plus an adjustable margin of up to 7.50% (the “Base Rate”); or (ii) the LIBOR plus an adjustable margin of up to 8.50% (the “Ares Eurodollar Rate”). Subject to customary notices, Legacy RTI may elect to convert the Ares Term Loan from Base Rate to Ares Eurodollar Rate or from Ares Eurodollar Rate to Base Rate. The applicable margin is subject to adjustment after the end of each fiscal quarter, based upon the Ares Loan Parties’ total net leverage ratio. At any time during the period commencing on March 8, 2019 and ending on March 8, 2021, if the Ares Loan Parties’ total net leverage ratio is greater than 5.75:1.00, Legacy RTI shall have the option (the “PIK Option”) to elect to pay 50% of the interest that will accrue in the subsequent quarterly period in kind by capitalizing it and adding such amount to the principal balance of the Ares Term Loan. If Legacy RTI exercises the PIK Option, the adjustable margin applicable to the Ares Term Loan shall be increased by 0.75%.
The maturity date of the Ares Term Loan is December 5, 2023. Legacy RTI may make optional prepayments on the Ares Term Loan, provided that any such optional prepayments made on or prior to March 8, 2022, shall be subject to a make whole premium or a prepayment price, as the case may be. Legacy RTI is required to make mandatory prepayments of the Ares Term Loan based on excess cash flow and the Ares Loan Parties’ total net leverage ratio, upon the incurrence of certain indebtedness not otherwise permitted under the 2019 Credit Agreement, upon consummation of certain dispositions, and upon the receipt of certain proceeds of casualty events. Legacy RTI was required to pay certain customary closing costs and bank fees upon entering into the 2019 Credit Agreement.
Legacy RTI is subject to certain affirmative and negative covenants, including (but not limited to), covenants limiting Legacy RTI’s ability to: incur certain additional indebtedness; create certain liens; enter into sale and leaseback transactions; and consolidate or merge with, or convey, transfer or lease all or substantially all of its assets to another person. During any period beginning on a date that either: (i) a default has occurred and is continuing under the loan documents entered into by Legacy RTI in conjunction with the Credit Agreement (the “Ares Loan Documents”); or (ii) availability under the Ares Term Loan is less than the specified covenant testing threshold, and continuing until either (a) no default has occurred and is continuing under the Ares Loan Documents or (b) availability under the Ares Term Loan is greater than or equal to the specified covenant testing threshold for thirty consecutive days, respectively, (the “Ares Covenant Testing Period”) Legacy RTI is required to maintain a minimum fixed charge coverage ratio of at least 0.91:1.00 (the “Ares Required Minimum Fixed Charge Coverage Ratio”). The Ares Required Minimum Fixed Charge Coverage Ratio is measured on the last day of each calendar month during the Ares Covenant Testing Period (each a “Ares Calculation Date”), and is calculated using the minimum fixed charge coverage ratio for the twelve consecutive months ending on each Ares Calculation Date. The Ares Loan Parties are required to maintain an initial total net leverage ratio of 9.00:1.00, which ratio steps down each fiscal quarter of Legacy RTI resulting in a requirement that the Ares Loan Parties maintain a total net leverage ratio of 3.50:1.00 for the fiscal quarter ending June 30, 2021, and each fiscal quarter ending thereafter.
The amounts owed under the 2019 Credit Agreement may be accelerated upon the occurrence of certain events of default customary for facilities for similarly rated borrowers.
First Amendment to Second Lien Credit Agreement
On March 3, 2020, the Company entered into a First Amendment to Second Lien Credit Agreement, dated March 3, 2020 (the “2020 First Amendment”), by and among the Ares Loan Parties and the Ares Lenders. The 2020 First Amendment amended the 2019 Credit Agreement: (a) amending the definition of “EBITDA” contained therein; (b) modifying the total net leverage ratio covenant contained therein; and (c) making certain other changes to the 2019 Credit Agreement consistent with the foregoing. These amendments will allow the Company to, among other things, support the investment being made to separate the OEM and Spine businesses in anticipation of the sale of the Company’s OEM business.
Second Amendment to Second Lien Credit Agreement
On April 27, 2020, the Company entered into a Second Amendment to Second Lien Credit Agreement (the “Second Amendment to the 2019 Agreement”), by and among the Ares Loan Parties and the Ares Lenders. The Second Amendment to the 2019 Agreement amended the 2019 Credit Agreement to: (i) establish an incremental term loan commitment; (ii) provide for certain incremental term loans in an aggregate principal amount not to exceed $30,000,000 (the “Second Amendment Incremental Loan Commitments”); (iii) provide for a portion of the Second Amendment Incremental Loan Commitments up to $13,500,000 be available on a delayed-draw basis at any time after the effective date of the Ares Amendment and on or prior to August 31, 2020, subject to certain conditions; (iv) increase the Base Rate applicable margin with respect to all Term Loans (other than the Second Amendment Incremental Term Loans) to 12.5% effective on September 1, 2020; and (v) make certain other changes to the 2019 Credit Agreement consistent with the foregoing. Pursuant to the terms of the Ares Amendment, Legacy RTI agreed pay to Ares, for the ratable benefit of each incremental term lender, a fee in an amount equal to 5.0% of the principal amount of the incremental term loan commitments provided by such lender on the effective date of the Ares Amendment. The maturity of the loans advanced under the Second Amendment Incremental Term Commitments (the “Second Amendment Incremental Term Loans”) have a maturity date of April 27, 2021. The Second Amendment Incremental Term Loans must be repaid in their entirety, at which time a takeout fee ranging from $11,250,000 to $25,500,000 shall be due and payable (the “Takeout Fee”). The Takeout Fee is inclusive of all interest accruing due and payable with respect to the Second Amendment Incremental Term Loans. The interest rate on the Second Amendment Incremental Term Loans is 12.50% and, commencing on September 1, 2020 and on the first day of each of the next four calendar months thereafter, the interest in respect of the Second Amendment Incremental Term Loans shall increase on each such date, on a cumulative basis, by an additional 1.00% per annum (such that, after the fifth such increase, the Base Rate with respect to the Second Amendment Incremental Term Loans shall equal 17.50% per annum).
45
Table of Contents
At December 31, 2019, the interest rate for the Ares Term Loan was 10.49%. The Company was in compliance with the financial covenants related to the Ares Term Loan as of December 31, 2019.
For the years ended December 31, 2019, 2018 and 2017, interest expense associated with the amortization of debt issuance costs was $0.5 million, $0.5 million and $0.4 million, respectively. Included in the year ended December 31, 2019, was $0.2 million of accelerated amortization of debt issuance costs associated with the modification of the 2018 Credit Agreement. For the year ended December 31, 2019, the Company incurred total debt issuance cost of $0.8 million.
As of December 31, 2019, the Company had approximately $5.6 million of cash and cash equivalents and $9.0 million of availability under its revolver agreement.
The Company’s debt agreements contain a leverage to EBITDA covenant, which as of December 31, 2019, required the Company to maintain a 5.0:1 leverage to trailing twelve-month adjusted EBITDA ratio. The debt agreement provides for an increase in the covenant ratio to 5.75:1 for each quarter end during 2020, then reduces to 5.25:1 for the quarters ending March 31, 2021 and June 30, 2021, with a final reduction to 3.50 for each quarter ending thereafter. The Company’s leverage ratio as of December 31, 2019 is approximately 5.51:1. If the Company is unable to execute on its acquisition integration plans or achieve its projected growth and cash flow targets, its available liquidity could be further limited, and its operations may lead to defaults under the borrowing agreements.
To maintain an adequate amount of available liquidity and execute on our current business plan, we intend to utilize cash flow from operations to fund business expenses. In addition, we intend to manage the timing and payment of variable expenditures and utilize available working capital. As of March 31, 2020, we believe that our working capital, together with our borrowing ability under the revolving JPM facility, will be adequate to fund ongoing operations through the OEM Closing. However, if the OEM Closing does not occur in the third quarter of 2020, the Company is likely to be in default under its borrowing arrangements unless waivers can be obtained.
Certain Commitments
On January 13, 2020, we entered into the OEM Purchase Agreement with Ardi Bidco, an affiliate of Montagu, in connection with, the proposed sale of the OEM Business. More specifically, pursuant to the terms of the OEM Purchase Agreement, RTI and its subsidiaries will sell to an affiliate of Montagu all of the issued and outstanding shares of the OEM Group Companies.
The OEM Purchase Agreement contemplates that, prior to the OEM Closing, we will undergo the Reorganization.
The Contemplated Transactions are subject to customary closing conditions, including, among other things, the approval of the Contemplated Transactions by the Company’s stockholders. The parties currently expect to close the Contemplated Transactions in the third quarter of 2020.
On March 8, 2019, pursuant to the Master Transaction Agreement, the Company acquired Paradigm in a cash and stock transaction valued at up to $300.0 million, consisting of $150.0 million on March 8, 2019, plus potential future milestone payments. Established in 2005, Paradigm’s primary product is the coflex® Interlaminar Stabilization® device, a differentiated and minimally invasive motion preserving stabilization implant that is FDA premarket approved for the treatment of moderate to severe lumbar spinal stenosis in conjunction with decompression.
Under the terms of the agreement, the Company paid $100.0 million in cash and issued 10,729,614 shares of the Company’s common stock. The shares of Company common stock issued on March 8, 2019, were valued based on the volume weighted average closing trading price for the five trading days prior to the date of execution of the definitive agreement, representing $50.0 million of value. In addition, the Company may be required to pay up to an additional $150.0 million in a combination of cash and Company common stock based on a revenue earnout consideration. Based on a probability weighted model, the Company estimates a contingent liability related to the revenue based earnout of zero.
On January 4, 2018, the Company acquired Zyga, a leading spine-focused medical device company that develops and produces innovative minimally invasive devices to treat underserved conditions of the lumbar spine. Zyga’s primary product is the SImmetry® Sacroiliac Joint Fusion System. Under the terms of the merger agreement dated January 4, 2018, the Company acquired Zyga for $21.0 million in consideration paid at closing (consisting of borrowings of $18.0 million on its revolving credit facility and $3.0 million cash on hand), $1.1 million contingent upon the successful achievement of a clinical milestone, and a revenue based earnout consideration of up to an additional $35.0 million. Based on a probability weighted model, the Company estimates a contingent liability related to the clinical and revenue milestones of $1.1 million.
46
Table of Contents
On August 3, 2017, we completed the sale of substantially all of the assets related to our CT Business to A&E pursuant to the Asset Purchase Agreement between us and A&E. The total cash consideration received by us under the Asset Purchase Agreement was composed of $54.0 million, $3.0 million of which was held in escrow (the “Escrow Amount”) to satisfy possible indemnification obligations, of which there were none. As such, we earned and received the $3.0 million cash consideration in the third quarter of 2018. An additional $5.0 million in contingent cash consideration is earned if A&E reaches certain revenue milestones (the “Contingent Consideration”). We also earned and received an additional $1.0 million in consideration for successfully obtaining certain FDA regulatory clearance. As a part of the transaction, we also entered into a multi-year Contract Manufacturing Agreement with A&E (the “Contract Manufacturing Agreement”). Under the Contract Manufacturing Agreement, we agreed to continue to support the CT Business by manufacturing existing products and engineering, developing, and manufacturing potential future products for A&E. We elected to account for the Contingent Consideration arrangement including the Escrow Amount, as a gain contingency in accordance with FASB ASC 450, Contingencies. As such, the Contingent Consideration and Escrow Amount were excluded in measuring the fair value of the consideration to be received in connection with the transaction.
On September 3, 2010, we entered into an exclusive distribution agreement with Zimmer Dental, Inc. (“Zimmer Dental”), a subsidiary of Zimmer, with an effective date of September 30, 2010, as amended from time to time. The agreement was assigned to Biomet 3i, LLC (“Biomet”), an affiliate of Zimmer Dental, on January 1, 2016. The agreement had an initial term of ten years and in 2019 was extended at the option of Biomet until 2026. Under the terms of this distribution agreement, we agreed to supply sterilized allograft and xenograft implants at an agreed upon transfer price, and Biomet has agreed to be the exclusive distributor of the implants for dental and oral applications worldwide (except Ukraine), subject to certain Company obligations under an existing distribution agreement with a third party with respect to certain implants for the dental market. In consideration for Biomet’s exclusive distribution rights, Biomet agreed to the following: (1) payment to us of $13.0 million within ten days of the effective date (the “Upfront Payment”); (2) annual exclusivity fees (“Annual Exclusivity Fees”) paid annually as long as Biomet maintains exclusivity for the term of the contract to be paid at the beginning of each calendar year; and (3) annual purchase minimums to maintain exclusivity. Upon occurrence of an event that materially and adversely affects Biomet’s ability to distribute the implants, Biomet may be entitled to certain refund rights with respect to the then current Annual Exclusivity Fee, where such refund would be in an amount limited by a formula specified in this agreement that is based substantially on the occurrence’s effect on Biomet’s revenues. The Upfront Payment, the Annual Exclusivity Fees and the fees associated with distributions of processed tissue are considered to be a single performance obligation. Accordingly, the Upfront Payment and the Annual Exclusivity Fees are deferred as received and are being recognized as other revenues over the term of this distribution agreement based on the expected contractual annual purchase minimums relative to the total contractual minimum purchase requirements in this distribution agreement. Additionally, we considered the potential impact of this distribution agreement’s contractual refund provisions and does not expect these provisions to impact future expected revenue related to this distribution agreement.
Our debt obligations and availability of credit as of December 31, 2019 are as follows:
| Outstanding Balance |
Available Credit |
|||||||
| (In thousands) | ||||||||
| Ares Term loan |
$ | 104,406 | ||||||
| JPM facility |
71,000 | $ | 9,000 | |||||
| Less unamortized debt issuance costs |
(1,229 | ) | ||||||
|
|
|
|||||||
| Total |
$ | 174,177 | ||||||
|
|
|
|||||||
The following table provides a summary of our debt obligations, operating lease obligations and other significant obligations as of December 31, 2019.
| Contractual Obligations Due by Period | ||||||||||||||||||||
| Total | Less than 1 Year |
1-3 Years | 4-5 Years | More than 5 Years |
||||||||||||||||
| (In thousands) | ||||||||||||||||||||
| Debt obligations |
$ | 174,177 | $ | 174,177 | $ | — | $ | — | $ | — | ||||||||||
| Operating lease obligations |
3,083 | 1,261 | 788 | 318 | 716 | |||||||||||||||
| Purchase obligations (1) |
13,445 | 13,445 | — | — | — | |||||||||||||||
|
|
|
|
|
|
|
|
|
|
|
|||||||||||
| Total |
$ | 190,705 | $ | 188,883 | $ | 788 | $ | 318 | $ | 716 | ||||||||||
|
|
|
|
|
|
|
|
|
|
|
|||||||||||
| (1) | These amounts consist of contractual obligations for capital expenditures and open purchase orders. |
Impact of Inflation
Inflation generally affects us by increasing our cost of labor, equipment and processing tools and supplies. We do not believe that the relatively low rates of inflation experienced in the United States since the time we began operations have had any material effect on our business.
47
Table of Contents
| Item 7A. | QUANTITATIVE AND QUALITATIVE DISCLOSURES ABOUT MARKET RISK. |
We are subject to market risk from exposure to changes in interest rates based upon our financing, investing and cash management activities.
We are subject to market risk from exposure to changes in interest rates based upon our financing, investing and cash management activities. We are exposed to interest rate risk in the United States and Germany. Changes in interest rates affect interest income earned on cash and cash equivalents and interest expense on revolving credit arrangements. We have not entered into derivative transactions related to cash and cash equivalents or debt. Our borrowings under our Ares Term Loan and JPM Facility expose us to market risk related to changes in interest rates. As of December 31, 2019, our outstanding floating rate indebtedness totaled $174.2 million. The primary base interest rate is LIBOR. Assuming the outstanding balance on our floating rate indebtedness remains constant over a year, a 100 basis point increase in the interest rate would decrease net income and cash flow by approximately $1.4 million. Other outstanding debt consists of fixed rate instruments. We do not expect changes in interest rates to have a material adverse effect on our income or our cash flows in 2020. However, we can give no assurance that interest rates will not significantly change in the future.
The value of the U.S. dollar compared to the Euro affects our financial results. Changes in exchange rates may positively or negatively affect revenues, gross margins, operating expenses and net income. Our international operations currently transact business primarily in the Euro. Assets and liabilities of foreign subsidiaries are translated at the period end exchange rate while revenues and expenses are translated at the average exchange rate for the period. Intercompany transactions are translated from the Euro to the U.S. dollar. Based on December 31, 2019 outstanding intercompany balances, a 1% change in currency rates would have had a de-minimis impact on our results of operations. We do not expect changes in exchange rates to have a material adverse effect on our income or our cash flows in 2020. However, we can give no assurance that exchange rates will not significantly change in the future.
| Item 8. | FINANCIAL STATEMENTS AND SUPPLEMENTARY DATA. |
Our consolidated financial statements and supplementary data required in this item are set forth on the pages indicated in Item 15(a)(1).
| Item 9. | CHANGES IN AND DISAGREEMENTS WITH ACCOUNTANTS ON ACCOUNTING AND FINANCIAL DISCLOSURE. |
Not applicable.
| Item 9A. | CONTROLS AND PROCEDURES. |
Background
As described in the Explanatory Note to this Form 10-K, and as previously disclosed in RTI’s Current Report on Form 8-K filed with the SEC on March 16, 2020, the Audit Committee of the Board of RTI, with the assistance of independent legal and forensic accounting advisors, conducted an internal investigation of matters relating to the Company’s revenue recognition practices for certain contractual arrangements, primarily with OEM customers, including the accounting treatment, financial reporting and internal controls related to such arrangements (the “Investigation”). The Investigative procedures also examined transactions to understand the practices related to manual journal entries for accrual and reserve accounts. The Investigation was precipitated by an investigation by the SEC initially related to the periods 2014 through 2016. The SEC investigation is ongoing, and the Company is cooperating with the SEC in its investigation.
On April 7, 2020, the Audit Committee of the Board concluded that the Company would restate its previously issued audited financial statements for the years ended December 31, 2018, 2017 and 2016, and selected financial data for the years ended December 31, 2015 and 2014, and the unaudited financial statements for the quarterly periods within these years commencing with the first quarter of 2016.
Based on the results of the Investigation, the Company has concluded that revenue for certain invoices should have been recognized at a later date than when originally recognized. In response to binding purchase orders from certain OEM customers, goods were shipped and received by the customers before requested delivery dates and agreed-upon delivery windows. In many instances the OEM customers requested or approved the early shipments, but the Company has determined that on other occasions the goods were delivered early without obtaining the customers’ affirmative approval. Some of those unapproved shipments were shipped by employees in order to generate additional revenue and resulted in revenues being pulled from a future quarter into an earlier quarter. In addition, the Company has concluded that in July 2017 an adjustment was improperly made to a product return provision in the Direct Division. The revenue for those shipments is being restated, as well as for other orders that shipped earlier than the purchase order due date in the system for which the Company could not locate evidence that the OEM customers had requested or approved the shipments. In addition, the Company has concluded that in the periods from 2015 through the fourth quarter of 2018, certain adjustments were incorrectly or erroneously made via manual journal entries to accrual and reserve accounts, including an adjustment to a product return provision in the Direct Division, among others. Accordingly, the Company has restated its financial statements to correct these errors.
Furthermore, other errors that were unrelated to the SEC investigation were identified that were corrected in the restated financial statements. Additional errors were made in connection with the recording of the acquisition of Paradigm Spine, LLC in 2019.
48
Table of Contents
The remedial measures undertaken, or to be undertaken, by our management team and their advisors, and the conclusions that our management team reached in its evaluations of the effectiveness of our disclosure controls and procedures and internal control over financial reporting as of December 31, 2019, are described below in detail.
Evaluation of Disclosure Controls and Procedures
In connection with the preparation of this Amendment, under the supervision and with the participation of, our current management, including our CEO and CFO, we evaluated the effectiveness of our disclosure controls and procedures as defined in Rules 13a-15(e) and 15d-15(e) under the Exchange Act, as amended, as of December 31, 2019. Based on this evaluation of our disclosure controls and procedures, our CEO and CFO have concluded that our disclosure controls and procedures were not effective as of December 31, 2019 because of certain material weaknesses in our internal control over financial reporting, as further described below.
Notwithstanding the conclusion by our CEO and CFO that our disclosure controls and procedures as of December 31, 2019 were not effective, and notwithstanding the material weaknesses in our internal control over financial reporting described below, management believes that the consolidated financial statements and related financial information included in this Annual Report on Form 10-K fairly present in all material respects our financial condition, results of operations and cash flows as of the dates presented, and for the periods ended on such dates, in conformity with GAAP.
Management’s Report on Internal Control over Financial Reporting
Management is responsible for establishing and maintaining adequate internal control over financial reporting as defined in Rules 13a-15(f) and 15d-15(f) under the Exchange Act and based upon the criteria established in Internal Control-Integrated Framework (2013) issued by the Committee of Sponsoring Organizations of the Treadway Commission (“the COSO framework”). Our internal control over financial reporting is a process designed to provide reasonable assurance regarding the reliability of our financial reporting and the preparation of our financial statements for external purposes in accordance with GAAP.
An effective internal control system, no matter how well designed, has inherent limitations, including the possibility of human error or overriding of controls, and therefore can provide only reasonable assurance with respect to reliable financial reporting. Because of its inherent limitations, our internal control over financial reporting may not prevent or detect all misstatements, including the possibility of human error, the circumvention or overriding of controls, or fraud. Effective internal controls can provide only reasonable assurance with respect to the preparation and fair presentation of financial statements.
Management, including our CEO and CFO, assessed the Company’s internal control over financial reporting and concluded that they were not effective as of December 31, 2019 (“Evaluation Date”). In making this assessment, management used the criteria set forth by the COSO framework. Based on evaluation under these criteria, management determined, based upon the existence of the material weaknesses described below, that we did not maintain effective internal control over financial reporting as of the Evaluation Date.
A material weakness is a deficiency, or a combination of deficiencies, in internal control over financial reporting, such that a reasonable possibility exists that a material misstatement of our annual or interim financial statements would not be prevented or detected on a timely basis.
Management has excluded Paradigm Spine, LLC from its assessment of internal control over financial reporting as of December 31, 2019 because it was acquired by the Company in a purchase business combination during 2019. Total assets and total revenues of the acquired Paradigm Spine, LLC business represent approximately 4% and 10%, respectively, of the related consolidated financial statement amounts as of and for the year ended December 31, 2019.
Control Environment
We did not maintain an effective control environment based on the criteria established in the COSO framework. We have identified deficiencies in the principles associated with the control environment of the COSO framework. Specifically, these control deficiencies constitute material weaknesses, either individually or in the aggregate, relating to: (i) appropriate organizational structure, reporting lines, and authority and responsibilities in pursuit of objectives; (ii) our commitment to attract, develop, and retain competent individuals; and (iii) holding individuals accountable for their internal control related responsibilities. As disclosed in the consolidated financial statements included in Item 8. “Financial Statements and Supplementary Data”, these material weaknesses contributed to accounting errors.
We did not maintain an effective control environment to enable the identification and mitigation of risks of accounting errors based on the contributing factors to material weaknesses in the control environment, including:
| • | The tone from executive management was insufficient to create the proper environment for effective internal control over financial reporting and to ensure that: (i) there were adequate processes for oversight; (ii) there was accountability for the performance of internal control over financial reporting responsibilities; (iii) personnel with key positions had the appropriate training to carry out their responsibilities; and (iv) corrective activities were appropriately applied, prioritized, and implemented in a timely manner. |
49
Table of Contents
| • | The Company did not maintain a sufficient complement of management, accounting, financial reporting, sales, and operations personnel who had appropriate levels of knowledge, experience, and training in accounting and internal control matters commensurate with the nature, growth and complexity of our business. The lack of sufficient appropriately skilled and trained personnel contributed to our failure to: (i) adequately identify potential risks; (ii) include in the scope of our internal controls framework certain systems relevant to financial reporting and the preparation of our consolidated financial statements; (iii) design and implement certain risk-mitigating internal controls; and (iv) consistently operate certain of our internal controls. |
| • | Our oversight processes and procedures that guide individuals in applying internal control over financial reporting were not adequate in preventing or detecting material accounting errors, or omissions due to inadequate information and, in certain instances, management override of internal controls, including recording improper accounting entries, recording accounting entries that were inconsistent with information known by management at the time, and not communicating relevant information within our organization. |
| • | The control environment material weaknesses contributed to other material weaknesses within our system of internal controls over financial reporting in the following COSO Components. |
Risk Assessment
We did not design and implement an effective risk assessment based on the criteria established in the COSO framework. We have identified deficiencies in the principles associated with the risk assessment component of the COSO framework. Specifically, these control deficiencies constitute material weaknesses, either individually or in the aggregate, relating to: (i) identifying, assessing, and communicating appropriate objectives; (ii) identifying and analyzing risks to achieve these objectives; (iii) considering the potential for fraud in assessing risks; and (iv) identifying and assessing changes in the business that could impact our system of internal controls.
The Company’s formal SOX compliance program did not have sufficient scope and focus on the key financial reporting risks, which was a contributing factor to material weaknesses in the risk assessment.
Control Activities
We did not design and implement effective control activities based on the criteria established in the COSO framework. We have identified deficiencies in the principles associated with the control activities component of the COSO framework. Specifically, these control deficiencies constitute material weaknesses, either individually or in the aggregate, relating to: (i) selecting and developing control activities and information technology that contribute to the mitigation of risks and support achievement of objectives; and (ii) deploying control activities through policies that establish what is expected and procedures that put policies into action.
The following were contributing factors to the material weaknesses in control activities:
| • | Lack of consistently established controls to segregate the function of recording and approving journal entries, as well as preparation and review of reconciliations with appropriate supporting documentation. |
| • | Inconsistent documentation and retention of support for the review and approval of manual journal entries. |
| • | Inconsistent documentation and application of accounting policies and/or practice for the sales returns reserve and certain accrual accounts. |
| • | Insufficient resources within the accounting and financial reporting department to review the accounting for non-recurring complex purchase accounting, contingent payment and segment reporting transactions. |
| • | Insufficient design and operation of certain control activities to respond to potential risk of material misstatements in the area of revenue recognition. In particular: (i) no controls requiring customer approval for early shipments outside of agreed upon shipping terms; (ii) no controls requiring centralized retention of proof of customer approval or request related to shipping outside of agreed terms; (iii) no formal process for offering or approving discounts to customers for early shipments; and (iv) no formal controls to ensure appropriate cut-off of direct revenue to customers at period ends in line with shipping terms. |
Deficiencies in control activities contributed to material accounting errors identified and corrected through 2019 and prior years. These design deficiencies in control activities contributed to the potential for there to have been material accounting errors in substantially all financial statement account balances and disclosures.
50
Table of Contents
Information and Communication
We did not consistently generate or provide adequate quality supporting information and communication based on the criteria established in the COSO framework. We have identified deficiencies in the principles associated with the information and communication component of the COSO framework. Specifically, these control deficiencies constitute material weaknesses, either individually or in the aggregate, relating to: (i) obtaining, generating, and using relevant quality information to support the function of internal control; and (ii) communicating accurate information internally and externally, including providing information pursuant to objectives, responsibilities, and functions of internal control.
The following were contributing factors to the material weaknesses in information and communication:
| • | We did not have an effective process in place to identify and maintain the information required to support the functioning of internal controls over financial reporting. |
| • | We did not obtain and retain consistent and relevant quality documentation or analysis to provide underlying support and calculations related to reserve and accrual adjustments when recorded. |
| • | We did not have a process in place to communicate required information to enable personnel to understand internal control responsibilities. |
Monitoring Activities
We did not design and implement effective monitoring activities based on the criteria established in the COSO framework. We have identified deficiencies in the principles associated with the monitoring component of the COSO framework. Specifically, these control deficiencies constitute material weaknesses, either individually or in the aggregate, relating to: (i) selecting, developing, and performing ongoing evaluation to ascertain whether the components of internal controls are present and functioning; and (ii) evaluating and communicating internal control deficiencies in a timely manner to those parties responsible for taking corrective action.
The following were contributing factors to the material weaknesses in monitoring activities:
| • | Management did not properly evaluate the function and operating effectiveness of certain internal control activities, limiting its ability to detect and communicate deficiencies. |
| • | Internal audit activities were insufficient to keep pace with the size and complexity of our business structure and organization, which limited our ability to effectively monitor internal controls. |
| • | The Company did not have sufficient talent and resources with sufficient expertise to evaluate the risks and controls. |
| • | The Company did not have sufficient oversight and supervision of the internal control evaluation process. |
Deloitte & Touche LLP, our independent registered public accounting firm, has audited the effectiveness of our internal control over financial reporting as of December 31, 2019. Deloitte & Touche LLP’s opinion appears in Item 8 of this Form 10-K.
Remediation Plan and Status
Our management is committed to remediating identified control deficiencies (including both those that rise to the level of a material weakness and those that do not), fostering continuous improvement in our internal controls and enhancing our overall internal controls environment. Our management believes that these remediation actions, along with additional actions, when fully implemented, will remediate the material weaknesses we have identified and strengthen our internal control over financial reporting. Our remediation efforts are ongoing and additional remediation initiatives may be necessary. We will continue our initiatives to implement and document the strengthening of existing, and development of new policies, procedures, and internal controls.
Remediation of the identified material weaknesses and strengthening our internal control environment will require a substantial effort throughout 2020 and beyond, as necessary. We will test the ongoing operating effectiveness of the new and existing controls in future periods. The material weaknesses cannot be considered completely remediated until the applicable controls have operated for a sufficient period of time and management has concluded, through testing, that these controls are operating effectively.
51
Table of Contents
While we believe the steps taken to date and those planned for implementation will remediate the effectiveness of our internal control over financial reporting, we have not completed all remediation efforts identified herein. Accordingly, as we continue to monitor the effectiveness of our internal control over financial reporting in the areas affected by the material weaknesses described above, we have and will continue to perform additional procedures prescribed by management, including the use of manual mitigating control procedures and employing any additional tools and resources deemed necessary, to ensure that our consolidated financial statements are fairly stated in all material respects. The following remediation activities highlight our commitment to remediating our identified material weaknesses:
Control Environment
We have undertaken steps to address material weaknesses in the control environment. The control environment, which is the responsibility of management, sets the tone of the organization, influences the control consciousness of its people, and is the foundation for all other components of internal control over financial reporting. Our Audit Committee and executive management team have emphasized and continue to emphasize the importance of internal control over financial reporting, as well as the integrity of our financial statements.
Our management has taken and will continue to take steps to ensure that previously-identified control deficiencies will be remediated through the implementation of uniform accounting and internal control policies and procedures with the proper oversight to promote compliance with GAAP and regulatory requirements. Some changes which we have already implemented include:
| • | A comprehensive disciplinary plan is in the process of being implemented for all employees found to have engaged in misconduct, including termination, removal of the individuals from certain accounting and finance functions, written warnings, and appropriate training depending on the severity of the misconduct; |
| • | The Company engaged an experienced compliance professional and increased its compliance staffing to upgrade and enhance the Company’s compliance program in accordance with the Federal Sentencing Guidelines; |
| • | The Company has enhanced its compliance policies and procedures, including training on the ability and means of anonymous reporting. It requires employees to annually certify their understanding of the Code of Conduct, which the compliance officer and legal department update and review on a periodic, as needed, basis along with the Employee Handbook; |
| • | Periodic compliance reports are made to the Nominating and Governance Committee of the Board of Directors; and |
| • | We have separated the functional leadership of the Financial Planning and Analysis (FP&A) function from the accounting function. |
To date, we have realigned financial reporting team members and removed certain members from accounting and finance functions. We are in the process of evaluating current staffing levels and the competence of our personnel given their assigned responsibilities. We are also in the process of evaluating the type of training that our personnel require, and have also approved resources to have a third-party facilitate required training. We have engaged external resources with significant experience to provide additional capacity, functional capabilities, and cross-training. Management will continue to evaluate and hire additional resources within our accounting and financial reporting and internal controls functions with the appropriate experience, certifications, education, and training for key financial reporting and accounting positions. Management believes these enhancements, when implemented, will reduce the risk of a material misstatement resulting from the material weaknesses described above. However, it will require a period of time to determine the operating effectiveness of any newly implemented internal controls over financial reporting.
Risk Assessment
We have begun implementing a process to reevaluate and revise our Sarbanes-Oxley compliance program (our “SOX Program”), and make improvements to our SOX Program governance, risk assessment processes, testing methodologies and corrective action mechanisms. We will continue to enhance our risk assessment procedures and conduct a comprehensive risk assessment, which includes the risk of fraud, to enhance overall compliance. We will also enhance our procedures to identify changes to the business that impact the risk assessment and processes to update the risk assessment timely. The results of this effort are expected to enable us to effectively identify, develop, and implement controls and procedures to address risks.
52
Table of Contents
Control Activities
We have begun the process of redesigning existing, and implementing new, internal control activities. We also plan to establish policies and procedures to enhance corporate oversight over our process-level controls and structures to ensure that there is appropriate assignment of authority, responsibility, and accountability to enable the remediation of our material weaknesses.
We are in the process of re-assessing and revising our processes to strengthen controls over the review and approval of journal entries and account reconciliations. Specifically, we are reinforcing existing policies and procedures regarding obtaining adequate supporting documentation in connection with the review and approval of journal entries and account reconciliations in order to ensure the validity, accuracy, and completeness of recorded amounts and enhancing staffing and systems controls to improve segregation of duties related to journal entry processing and completion and review of account reconciliations. Additionally, we are formalizing documentation of accounting and reporting policies and procedures and will conduct in-depth training on such policies and procedures. We will implement system-level controls to ensure an individual that has entered a journal entry cannot approve the entry for posting to the general ledger to ensure enhanced segregation of duties.
We will hire additional resources and/or augment our resources with third-party advisors within the accounting and financial reporting department with sufficient experience and knowledge to review the accounting for non-recurring complex accounting transactions.
We plan to implement new and strengthen current internal controls, over revenue recognition including: (i) controls requiring customer approval for early shipments outside of agreed upon shipping terms; (ii) retention of proof of customer approval or request related to shipping outside of agreed terms; (iii) a formal process for offering or approving discounts to customers for early shipments; and (iv) formal controls to ensure appropriate cut-off of direct revenue to customers at period ends in line with shipping terms.
We are also enhancing our review and approval process to incorporate segregation of duties to reduce risk of manual overrides.
Information and Communication
In our effort to remediate our material weaknesses, we are formalizing procedures and strengthening existing controls to ensure the appropriate review and approval of journal entries, including retention of appropriate documentation to support journal entries. Additionally, we are strengthening existing controls regarding the documentation and retention of underlying support for our adjustments relating to reserve and accrual calculations to ensure consistent application of accounting policies and procedures. The following are contributing factors to remediate the material weaknesses:
| • | Creating an effective process to identify and maintain the information required to support the functioning of internal controls over financial reporting. |
| • | Instituting policies and processes relating to the maintenance of sufficient capture, use and storage of the information used to evaluate financial reporting controls. |
| • | Establishing and reinforcing communications protocols including required information and expectations to enable personnel to perform internal control responsibilities (e.g., formal training programs and corporate communications). |
Monitoring Activities
In addition to the items noted above, as we continue to evaluate, remediate, and improve our internal control over financial reporting, executive management may elect to implement additional measures to address control deficiencies or may determine that the remediation efforts described above require modification. Executive management, in consultation with and at the direction of our Audit Committee, will continue to assess the control environment and the above-mentioned efforts to remediate the underlying causes of the identified material weaknesses, including through the following:
| • | We will increase internal audit, finance, and accounting staffing levels and expertise. In 2018 we outsourced our internal audit function. We will increase the scope of the Internal Audit engagement to assist with the ongoing evaluation of our Enterprise Risk Management process, detail testing of newly implemented controls and other activities related to monitoring our overall remediation efforts. |
| • | We have instituted cross-functional business reviews of financial results and non-routine transactions. |
| • | We are also developing effective communication plans relating to, among other things, identification of deficiencies and recommendations for corrective actions. These plans will apply to all parties responsible for remediation. |
53
Table of Contents
Changes in Internal Controls
The material weaknesses identified above were discovered after December 31, 2018, and all of these material weaknesses existed as of December 31, 2018. The remediation activities identified above and any material changes to our internal control over financial reporting also occurred after December 31, 2018. Therefore, there were no changes in our internal control over financial reporting (as defined in Rules 13a-15(f) and 15d-15(f) under the Exchange Act) during the year ended December 31, 2018 that have materially affected, or are reasonably likely to materially affect, our internal control over financial reporting.
Except for the identification of the material weaknesses described above, there were no changes during the year ended December 31, 2019 in our internal control over financial reporting that have materially affected, or are reasonably likely to materially affect, our internal control over financial reporting, other than certain material weaknesses related to Paradigm, the entity we acquired on March 8, 2019. Paradigm uses a third-party logistics (3PL) provider to manage the revenue and inventory accounting cycles. During our control assessment, we identified that the 3PL provider did not have an internal control report over the processes that we were relying upon. Upon further investigation, we identified deficiencies in all layers of general information technology controls. In addition, we identified a lack of segregation of duties. As a result, we identified material weaknesses in the design of controls over revenue and inventory at the third party logistics provider.
| Item 9B. | OTHER INFORMATION. |
Not applicable
54
Table of Contents
PART III
| Item 10. | DIRECTORS, EXECUTIVE OFFICERS AND CORPORATE GOVERNANCE. |
Composition of the Board
Our Board currently consists of nine directors. Pursuant to the terms of our Preferred Stock, two directors have been appointed by Water Street Healthcare Partners (“Water Street”), our largest stockholder. The remaining seven directors are elected by holders of our common stock and preferred stock voting together as a single class.
Director Qualifications and Biographical Information
Set forth below is a brief description of the background and business experience of each of our current directors for the past five years and the new member, who joined the Board on June 1, 2020.
| Director |
Age | Year First Became Director |
Business Experience | |||
| Camille I. Farhat
|
51 | 2017 | Mr. Farhat joined RTI as President and Chief Executive Officer in March 2017. Mr. Farhat’s experience is built from extensive work across multiple companies in ten countries and nine industries, including experience in the healthcare industry globally spanning pharmaceuticals, implantable devices, capital equipment, consumables and services. During 2016 and until he became our President and Chief Executive Officer in March 2017, Mr. Farhat provided certain consulting services and fulfilled his board obligations. Prior to that, Mr. Farhat was President and Chief Executive Officer of American Medical Systems (“AMS”) from 2012 to 2015. Prior to AMS, Mr. Farhat advanced several business segments for Baxter International, serving as Global General Manager of Baxter Pharmaceuticals & Technologies from 2008 to 2011 and Global General Manager of Global Infusion Systems from 2006 to 2008. Prior to Baxter Pharmaceuticals & Technologies, Mr. Farhat was Vice President of Business Development at Medtronic, and previously Global General Manager of Medtronic’s gastroenterology and urology divisions from 2003 to 2006. Earlier in his career, Mr. Farhat gained executive and leadership experience during his thirteen years at General Electric. Mr. Farhat earned a Master of Business Administration from Harvard University, a degree in European Union Studies from Institut National d’Etudes Politiques de Paris and graduated summa cum laude from Northeastern University with a bachelor’s degree in international finance and accounting. Mr. Farhat serves on the Board of ADVAMED (the Advanced Medical Technology Association), the Board of CMR Surgical and Northwestern University’s Cerebrovascular Neurosurgery Advisory Council. Mr. Farhat brings to the Board significant experience revitalizing and profitably growing global businesses within the health care industry. It is also customary for the Chief Executive Officer to be a member of the Board of Directors. |

55
Table of Contents
| Director |
Age | Year First Became Director |
Business Experience | |||
| Jeffrey C. Lightcap
|
61 | 2019 | Mr. Lightcap joined the Board on March 8, 2019. Since mid-2006, Mr. Lightcap has served as a Senior Managing Director at HealthCor Partners Management, LP, a growth equity investor focused on late stage venture and early commercial stage healthcare companies in the diagnostic, therapeutic and med tech, sectors. From 1997 to mid-2006, Mr. Lightcap served as a Senior Managing Director at JLL Partners, a leading middle-market private equity firm. Prior to JLL Partners, from 1993 to 1997, Mr. Lightcap served as a Managing Director at Merrill Lynch & Co., Inc. Prior to joining Merrill Lynch, Mr. Lightcap was a Senior Vice President in the mergers and acquisitions group at Kidder, Peabody & Co. and briefly at Salomon Brothers. Mr. Lightcap received a B.E. in Mechanical Engineering from the State University of New York at Stony Brook in 1981 and in 1985 received an MBA from the University of Chicago. Mr. Lightcap previously served as Chairman of the Board at Corindus Vascular Robotics, Inc. (NYSE: CVRS), a precision vascular robotics company prior to the company being acquired by Siemens Healthineers and serves as a director of the following companies: Heartflow Inc., a medical technology company redefining the way heart disease is diagnosed and treated; CareView Communications, Inc. (OTCQB: CRVW), a healthcare technology company; KellBenx, Inc., a prenatal diagnostic technology company and Paige.AI, a machine learning driven pathology diagnostic company. Mr. Lightcap’s experience navigating the reimbursement landscape and advancing access to medical devices with substantial clinical data and high-growth potential and his leadership skills exhibited throughout his career make him well-qualified to serve as one of the Company’s directors. | |||
| Thomas A. McEachin
|
67 | 2015 | Mr. McEachin joined the Board in December 2015. He has been retired since 2012. Prior to his retirement, he served in executive capacities with Covidien Surgical Solutions, a division of Covidien plc, from 2008 to 2012, first as Vice President, Finance from 2008 to 2011, and then as Vice President and Group Chief Financial Officer from 2011 to 2012. From 1997 to 2008, Mr. McEachin served United Technologies and its subsidiaries in various finance capacities. Prior to joining United Technologies, Mr. McEachin served in various executive capacities with Digital Equipment Corporation from 1986 to 1997 and Xerox Corporation from 1975 to 1986. Mr. McEachin holds a B.S. from New York University and an MBA from Stanford University. Mr. McEachin’s finance and executive management experience provides our Board with valuable financial reporting, compliance, accounting and controls, and corporate governance experience. Mr. McEachin also qualifies as an “Audit Committee Financial Expert.” | |||
| Stuart F. Simpson
|
53 | 2020 | Mr. Simpson joined our Board on June 1, 2020, filling a newly created directorship. Based on the recommendation of the Nominating and Governance Committee of the Company, Mr. Simpson is one of the Board’s nominees for election by at the 2020 annual meeting of our stockholders. Mr. Simpson most recently served as the President of the Joint Replacement Division of Stryker Corporation, a medical technology company that provides products and services in orthopedics, medical and surgical, and neurotechnology and spine (“Stryker”), from 2017 until his departure from Stryker in 2019. Mr. Simpson held various roles at Stryker from 1997 until 2019, including VP & General Manager of the Commercial Division from 2015 until 2017 and VP & General Manager of the Global Knee & Mako BUs Division from 2014 until 2015. During his tenure at Stryker, Mr. Simpson led transformative, industry-leading strategy to establish robotics as a standard of care for orthopedics industry, led efforts in new product development, provided both strategic counsel and financial discipline to the organization, and helped improve HR leadership, organizational capabilities and customer satisfaction within the organization. Mr. Simpson also helped Stryker complete three significant business development deals, including one with a publicly traded company. Prior to joining Stryker, Mr. Simpson gained diverse experience in sales and marketing in the pharmaceutical and medical technology industry, such as Howmedica International (acquired by Stryker in 1998), Knoll AG and Gold Cross Limited. Mr. Simpson received a Bachelor of Science in Technology and Business Studies from the University of Strathclyde in Glasgow, United Kingdom. He also received a CIM Diploma in Marketing from the Central College of Commerce in Glasgow, United Kingdom. Mr. Simpson is a director of Breg, Inc., a provider of orthopedic and sports medicine products and services. Our Board believes Mr. Simpson’s extensive background in the sports medicine, spine, orthopedic, and surgical device industry, particularly as a President of the Joint Replacement Division of Stryker, complements our Board with valuable industry expertise especially in digital surgery, an area that the Company believes will be important to its ongoing strategy in addition to his experience in new product development and acquisitions. | |||


56
Table of Contents
| Director |
Age | Year First Became Director |
Business Experience | |||
| Mark D. Stolper
|
48 | 2017 | Mr. Stolper joined the Board in March 2017. He has served as Executive Vice President and Chief Financial Officer of RadNet, Inc., the largest owner and operator of freestanding medical diagnostic imaging centers, since July 2004, and he previously served as a member of the Board of RadNet, Inc. from March 2004 to July 2004. He has had diverse experiences in investment banking, private equity, venture capital investing and operations as follows: from 1993 to 1995, Mr. Stolper was a member of the corporate finance group at Dillon, Read & Co., Inc.; from 1995 to 1997, Mr. Stolper was a member of Archon Capital Partners; from 1997 to 1999, Mr. Stolper worked in business development for Eastman Kodak; and in 1999, Mr. Stolper co-founded Broadstream Capital Partners. Mr. Stolper has served on the Board, Compensation Committee and Audit Committee of Rotech Healthcare since February 2016. Mr. Stolper has also served on the Board, Audit Committee, Transaction Committee and Compliance Committee of 21st Century Oncology Holdings, Inc. since January 2018. Previously, Mr. Stolper served as a member of the Board of the following companies: On Track Innovations, Ltd. from 2012 until 2016; Surgical Solutions LLC from 2015 to February 2017; Alco Stores, Inc. from 2014 to 2015; Compumed, Inc. from 2008 to 2014; and Physiotherapy Associates from 2013 to 2016. Mr. Stolper graduated with a liberal arts degree from the University of Pennsylvania and a finance degree from the Wharton School. Additionally, Mr. Stolper earned a postgraduate Award in Accounting from the University of California, Los Angeles. Mr. Stolper’s financial background in life sciences (particularly as a sitting Chief Financial Officer of a publicly-traded company), extensive experience in serving on boards of directors of both public and private companies, and broad mergers and acquisitions experience qualify him to serve on our Board. | |||
| Paul G. Thomas
|
64 |
2016 | Mr. Thomas joined the Board in June 2016. He has served as the Founder and Chief Executive Officer of Prominex, a point-of-care molecular diagnostic company focused on infectious diseases since January 2018. Prior to Prominex, he served as Founder, Chief Executive Officer and President of Roka Bioscience, a molecular diagnostics company focused on food safety applications, from September 2009 until January 2017. Mr. Thomas previously served as Chairman, Chief Executive Officer and President of LifeCell Corporation, a publicly traded regenerative medicine company, from 1998 until it was acquired by KCI in 2008 in a transaction valued at $1.8 billion. Mr. Thomas previously held various senior positions, including President of the Pharmaceutical Products Division, during his tenure of 15 years with Ohmeda, a world leader in inhalation anesthetics and acute care pharmaceuticals. Mr. Thomas currently serves on the Board of Abiomed. Mr. Thomas formerly served on the Board of Roka Bioscience and Aegerion Pharmaceuticals. Mr. Thomas received his M.B.A. degree from Columbia University Graduate School of Business and completed his postgraduate studies in Chemistry at the University of Georgia Graduate School of Arts and Science. He received his B.S. degree in Chemistry from St. Michael’s College in Vermont. Mr. Thomas’s extensive leadership experience with companies in the life science industry qualifies him to serve as a member of our Board. In addition, we regard Mr. Thomas’s experience as a Chief Executive Officer to be of great importance to the Company in providing a broad perspective of the industry, as well as management issues. | |||


57
Table of Contents
| Director |
Age | Year First Became Director |
Business Experience | |||
| Nicholas J. Valeriani
|
63 | 2016 | Mr. Valeriani joined the Board in June 2016. He retired as the Chief Executive Officer of West Health, The Gary and Mary West Health Institute, an independent nonprofit medical research organization that works to create new and more effective ways of delivering healthcare at lower costs, a position he held until 2015. Previously, Mr. Valeriani served 34 years in key positions at Johnson & Johnson, including Company Group Chairman of Johnson & Johnson Ortho-Clinical Diagnostics from 2009 to 2012; Vice President, Office of Strategy and Growth from 2007 to 2009; Worldwide Chairman, Medical Devices and Diagnostics from 2005 to 2007; and Corporate Vice President, Human Resources from 2003 to 2005. Mr. Valeriani also served on the Executive Committee of Johnston & Johnson during his tenure. Mr. Valeriani currently serves on the Board of Edwards Lifesciences Corp., SPR Therapeutics, Inc, and AgNovos Healthcare, LLC. Mr. Valeriani received a Bachelor’s Degree in Industrial Engineering and a Master of Business Administration from Rutgers University. Mr. Valeriani’s experience in the global medical device industry and his leadership in the areas of strategy, growth and human resources qualifies him to serve on our Board. | |||
| Shirley A. Weis
|
66 | 2014 | Ms. Weis joined the Board in October 2014. She is president of Weis Associates, LLC, a consulting firm focused on healthcare management, strategic planning and leadership development, and emerita Vice President and Chief Administrative Officer of Mayo Clinic. Ms. Weis worked at Mayo Clinic in many different capacities since 1995, but, most recently, she was charged with overseeing the operations of 87 corporations that make up the Mayo Clinic system, including a 57,000-member staff. Ms. Weis was a member of the Mayo Clinic Board of Trustees and served as the secretary for the Mayo Clinic Board of Governors. Ms. Weis held a position until April 2019 on the Board of Sentry Insurance Company where she was a member of the Audit, Finance and Compensation Committees. She is a member of the board of The Medical Memory, LLC (now called Obex) and serves on the Compensation Committee. Ms. Weis is Professor of Practice in the W.P. Carey School of Business and the College of Nursing and Health Innovation at Arizona State University. Ms. Weis graduated with a master’s degree in management from Aquinas College and received an honorary doctor of science degree from Michigan State University. Ms. Weis’s background at the Mayo Clinic provides our Board with valuable healthcare and business strategy from the perspective of a purchaser of medical products. In addition, she has significant consulting and management experience, which has enabled her to provide valuable insight to our Board. | |||


58
Table of Contents
| Director |
Age | Year First Became Director |
Business Experience | |||||||
| PREFERRED DIRECTORS (APPOINTED BY HOLDERS OF PREFERRED STOCK) | ||||||||||
| Curtis M. Selquist
|
75 | 2013 | Mr. Selquist joined the Board pursuant to the Investment Agreement by and between the Company and WSHP Biologics Holdings, LLC, an affiliate of Water Street Healthcare Partners, in July 2013 (the “Investment Agreement”). He has served as the Chairman of the Board since February 2016. Mr. Selquist has been an Operating Partner at Water Street, a strategic investor focused exclusively on the healthcare industry, since April 2007. Mr. Selquist has led and grown a number of global healthcare businesses during a distinguished 35-year career at Johnson & Johnson. Prior to joining Water Street, he was the Company Group Chairman of Johnson & Johnson Medical and Johnson & Johnson Healthcare Systems. Mr. Selquist also served as President of Johnson & Johnson Latin America. He was subsequently appointed Worldwide President of Johnson & Johnson, Merck Consumer Pharmaceuticals and Company Group Chairman, responsible for Johnson & Johnson Medical. Mr. Selquist was the founding Chairman of the Global Healthcare Exchange. He also served as Chairman of the National Alliance for Health Information Technology, and as a board member of the National Quality Forum. Mr. Selquist also chaired the National Quality Forum Leadership Network. Mr. Selquist serves as the Lead Director of Breg, Inc. (a manufacturer of medical braces and splints). He is also a Director of Temp Time, Inc. (a cold chain temperature monitoring business) where he serves as Chair of the Board, Chair of the Compensation Committee and a member of the Audit Committee. He was a Director of Health Fitness Corporation (a provider of health management and corporate fitness solutions) from 2007-2010, where he served on the Compensation Committee and Strategy Committee as Chair. He received a bachelor’s degree in Finance and Management from Bradley University. We believe that Mr. Selquist’s experience in the healthcare industry and numerous leadership positions qualifies him to be the Chairman of our company. | |||||||
| Christopher R. Sweeney
|
45 | 2015 | Mr. Sweeney joined the Board in October 2015 pursuant to the Investment Agreement. Mr. Sweeney has been employed by Water Street, a strategic investor focused exclusively on the healthcare industry, since 2005, serving initially as a principal and, since 2010, as a partner. Prior to joining Water Street, Mr. Sweeney was employed in various capacities with Cleary & Oxford, a middle market healthcare investment firm, from 1997-2005, ultimately serving as a principal. Mr. Sweeney holds a degree from Williams College. We believe that his investment banking experience as an investor in healthcare companies qualifies him to provide valuable insight to our Board. | |||||||


59
Table of Contents
Committees of the Board
Our Board has an Audit Committee, which assists our Board in discharging its responsibilities. The current members of Audit Committee are identified below:
| Name |
Audit |
|||||
| Camille I. Farhat |
— | |||||
| Jeffrey C. Lightcap (I) |

|
|||||
| Thomas A. McEachin (I) |

|
|||||
| Curtis M. Selquist (I) |
— | |||||
| Stuart F. Simpson (I) |
— | |||||
| Mark D. Stolper (I) |
|
|||||
| Christopher R. Sweeney (I) |
— | |||||
| Paul G. Thomas (I) |
— | |||||
| Nicholas J. Valeriani (I) |
— | |||||
| Shirley A. Weis (I) |
— |
|
|
Committee Chair | |
|
|
Member | |
Our Audit Committee is charged with, among other things, the appointment of our independent registered public accounting firm, as well as discussing and reviewing with the independent registered public accounting firm the scope and the results of the annual audit, pre-approving the engagement of the independent registered public accounting firm for all audit-related services and permissible non-audit related services, and reviewing and approving all related-party transactions. Our Audit Committee also reviews interim financial statements included in our quarterly reports and reviews financial statements and related documents filed with the SEC. The Board has determined that each member of the Audit Committee is independent within the meaning of the director independence standards of the Nasdaq Listing Rules as well as the heightened director independence standards of the SEC for Audit Committee members, including Rule 10A-3(b)(1) under the Exchange Act. The Board has also determined that each of the members of the Audit Committee is financially literate and is able to read and understand consolidated financial statements and that Mr. McEachin qualifies as an “Audit Committee Financial Expert” as defined in the Exchange Act. During 2019, our Audit Committee met eight times. The charter of the Audit Committee is available on our website at http://www.rtix.com/en_us/investors/corporate-governance.
60
Table of Contents
EXECUTIVE OFFICERS OF THE COMPANY
The Company’s current executive officers are identified below.
| Name |
Age | Title | ||
| Camille I. Farhat | 51 | President and Chief Executive Officer, Director | ||
| Jonathon M. Singer | 56 | Chief Financial and Administrative Officer | ||
| John N. Varela | 53 | Executive Vice President, Global Operations | ||
| Olivier M. Visa | 51 | President, Global OEM | ||
| Terry M. Rich | 52 | President, Global Spine | ||
| Joshua H. DeRienzis | 51 | Vice President, General Counsel & Corporate Secretary | ||
| Ryan M. Bartolucci | 38 | Vice President & Chief Accounting Officer | ||

|
Camille I. Farhat joined RTI as President and Chief Executive Officer in March 2017. Mr. Farhat’s experience is built from extensive work across multiple companies in ten countries and nine industries, including experience in the healthcare industry globally spanning pharmaceuticals, implantable devices, capital equipment, consumables and services. During 2016 and until he became our President and Chief Executive Officer in March 2017, Mr. Farhat provided certain consulting services and fulfilled his board obligations. Prior to that, Mr. Farhat was President and Chief Executive Officer of American Medical Systems (“AMS”) from 2012 to 2015. Prior to AMS, Mr. Farhat advanced several business segments for Baxter International, serving as Global General Manager of Baxter Pharmaceuticals & Technologies from 2008 to 2011 and Global General Manager of Global Infusion Systems from 2006 to 2008. Prior to Baxter Pharmaceuticals & Technologies, Mr. Farhat was Vice President of Business Development at Medtronic, and previously Global General Manager of Medtronic’s gastroenterology and urology divisions from 2003 to 2006. Earlier in his career, Mr. Farhat gained executive and leadership experience during his thirteen years at General Electric. Mr. Farhat earned a Master of Business Administration from Harvard University, a degree in European Union Studies from Institut National d’Etudes Politiques de Paris and graduated summa cum laude from Northeastern University with a bachelor’s degree in international finance and accounting. Mr. Farhat serves on the Board of ADVAMED (the Advanced Medical Technology Association), the Board of CMR Surgical and Northwestern University’s Cerebrovascular Neurosurgery Advisory Council. | |||

|
Jonathon M. Singer joined RTI in September 2017. He currently serves as Chief Financial and Administrative Officer. Contingent upon the successful completion of the Contemplated Transactions, Mr. Singer will be promoted to Chief Operating Officer of RTI. Mr. Singer previously served as Chief Financial and Administrative Officer, Corporate Secretary. Prior to becoming an executive of RTI, Mr. Singer previously served as a member of the Board from May 2016 to September 2017. Mr. Singer previously served as Chief Financial Officer of Sagent Pharmaceuticals from 2011 until 2017 and was appointed Executive Vice President and Chief Financial Officer in March 2012. Mr. Singer was Senior Vice President, Treasurer, Secretary and Chief Financial Officer of Landauer, Inc. from 2006 to 2011. From 2004 to 2006, Mr. Singer served as Vice President of Global Finance and Chief Financial Officer of the Medial Segment for Teleflex Inc. Prior to 2004, Mr. Singer worked in various capacities for R.R. Donnelley & Sons Company, Cardinal Health Inc., and KPMG LLP. Mr. Singer is a certified public accountant and received a Bachelor’s Degree in Business Administration from Miami University in Ohio and a Master’s Degree from Northwestern University’s Kellogg Graduate School of Management. | |||
61
Table of Contents

|
John N. Varela was named Executive Vice President, Global Operations in January 2017. Mr. Varela joined RTI in July 2014 as Vice President, U.S. Operations to oversee all aspects of U.S. manufacturing and distribution. In December 2014, he assumed additional responsibilities to oversee information technology, including SAP, and became an executive officer effective January 1, 2015. Prior to joining RTI, Mr. Varela was the Director of Operations for Heraeus Electro-Nite, Inc. from September 2011 to July 2014. Mr. Varela has more than fifteen years of experience in the medical device industry with such companies as Teleflex Medical from 2004 to 2008 and Accellent, Inc. from 2008 to 2011. In his role at Accellent, Mr. Varela served as Director of Operations implementing lean principles to transform manufacturing flow and improve delivery performance. Mr. Varela spent the early part of his career with General Electric and Phillips Lighting Company. He has over thirty years of experience in various leadership positions within manufacturing and supply chain industries. Mr. Varela earned a bachelor’s degree in mechanical engineering from The Pennsylvania State University and a master’s degree in environmental engineering from Drexel University. He has also earned his Six Sigma Master Black Belt and is certified in Production and Inventory Management. | |||

|
Olivier M. Visa joined RTI in September 2017. He currently serves as President, Global OEM. Mr. Visa previously served as vice president, OEM, Sports and Donor Services. Mr. Visa has 26 years of commercial leadership experience in the global healthcare industry with a focus on transforming businesses and building sustainable value. Mr. Visa’s experience in the life sciences industry includes medical devices, pharmaceuticals and biologics across multiple countries in the pharmacy and critical care markets. Prior to joining RTI in October 2017, Mr. Visa served as vice president for the Global Compounding business unit of Baxter Healthcare from July 2013 to September 2017. In this role, Mr. Visa oversaw the global profitability improvement of the outsourcing pharmacy business while focusing operations, quality and research and development efforts on patient safety and innovation. Prior to this role, Mr. Visa had multiple commercial responsibilities in the Baxter Pharmaceuticals and Technology franchise from November 2004 to June 2013. In addition, Mr. Visa previously served the Global Drug Delivery business through mergers, acquisitions, licensing and integrations in multiple geographies and led marketing for the contract manufacturing business from August 2001 to October 2004. Mr. Visa earned a doctorate degree in pharmacy from the University of Aix Marseille II and a Master of Business Administration from the Kellogg School of Management. | |||

|
Terry M. Rich joined RTI in November 2019. He currently serves as President, Global Spine. Mr. Rich has over 25 years of experience in the orthopedic and spine industry. Prior to joining RTI, he led the turnaround of Alphatec Holdings, Inc. (“Alphatec”) from December 2016 through December 2018. As a director and CEO, he strengthened the organization’s competencies, redirected the portfolio with 12 new products and laid the foundation for focused innovation and growth. Prior to Alphatec, from October 2015 to June 2016, Mr. Rich was the President, Upper Extremities, of Wright Medical Group, N.V., a global medical device company focused on extremities and biologics products. Prior to that, Mr. Rich served as Senior Vice President of U.S. Commercial Operations of Tornier, N.V., from March 2012 to October 2015, at which time Tornier and Wright Medical Group merged. Prior to joining Tornier, Mr. Rich held increasingly senior sales leadership positions at NuVasive, Inc., a San Diego-based spinal implant medical device company, from December 2005 until leaving the company in March 2012 as Senior Vice President, Sales, West. | |||
62
Table of Contents

|
Joshua H. DeRienzis joined RTI in April 2019. He currently serves as Vice President, General Counsel and Corporate Secretary. Prior to joining RTI, Mr. DeRienzis was VP and Corporate Secretary of The Williams Companies, Inc., a Fortune 500 energy company. Prior to Williams he held senior legal roles at large publicly-traded healthcare companies including Mednax, McKesson and PSS World Medical, where he was general counsel and corporate secretary. Earlier in his career Mr. DeRienzis held senior attorney positions at various other companies. He also worked as a corporate attorney at the New York offices of Skadden, Arps, Slate, Meagher & Flom LLP and White & Case LLP. Mr. DeRienzis received his J.D. from the Benjamin N. Cardozo School of Law and his B.A. from the State University of New York at Albany. | |||

|
Ryan M. Bartolucci joined RTI in September 2018 as Vice President, Finance and Corporate Controller. He currently serves as Vice President and Chief Accounting Officer. Prior to joining RTI, Mr. Bartolucci spent three years in the same role at Sagent Pharmaceuticals, where he was responsible for a wide breadth of public company accounting activities, internal controls and external audit coordination. He previously spent 11 years at PricewaterhouseCoopers LLP, where he served in various roles in the Assurance department. Mr. Bartolucci is a certified public accountant. He received a bachelor’s degree in accounting from the University of Dayton. | |||
Code of Ethics for Senior Financial Professionals
Our Board has adopted a Code of Ethics for Senior Financial Professionals, applicable to our Chief Executive Officer, Chief Financial Officer and Vice President of Finance, Controller. The Code of Ethics for Senior Financial Professionals is available on our website at http://www.rtix.com/en_us/investors/corporate-governance. Any amendments to, or waiver of, any provision of the Code of Ethics will be posted on our website.
| Item 11. | EXECUTIVE COMPENSATION. |
Compensation Discussion and Analysis
The Company’s named executive officers for 2019 (in some instances, referred to as the “NEOs”), are:
| Name |
Office | |
| Camille I. Farhat | President and Chief Executive Officer, Director | |
| Jonathon M. Singer | Chief Financial and Administrative Officer | |
| John N. Varela | Executive Vice President, Global Operations | |
| Olivier M. Visa | President, Global OEM | |
| Joshua H. DeRienzis | Vice President, General Counsel & Corporate Secretary |
63
Table of Contents
Executive Summary
The primary objective of our executive compensation program is to align executive pay with key business and strategic objectives, Company performance and long-term stockholder value creation. With respect to 2019 compensation opportunities and plan design decisions, the Compensation Committee reviewed the performance of the Company in 2018, the performance of each NEO in 2018, relevant external market benchmark data provided by the Compensation Committee’s independent consultant, and relevant internal factors such as the Company’s transformation strategy and outlook for 2019 and the strength and continuity of the executive leadership team. The Compensation Committee also took the core components of the Company’s current transformation strategy (reducing complexity, driving operational excellence, and accelerating growth) and stockholder outreach feedback into account when determining executive compensation levels for 2019 and designed executive compensation to correspond with those goals.
Based on these and other relevant considerations, the Compensation Committee approved the following decisions related to executive compensation levels and plan designs for 2019:
| • | Base salary increases for Mr. Farhat, 3%, Mr. Singer, 4%, Mr. Varela, 3% and Mr. Visa, 6% (Mr. DeRienzis, who began working for the Company in April 2019 did not receive an increase). |
| • | Target short-term incentive opportunities, expressed as percentage of base salary, remained unchanged from prior year levels at 110% of salary for Mr. Farhat, 65% of salary for Mr. Singer, and 50% of salary for Mr. Varela, and increased from 40% of salary to 50% of salary for Mr. Visa to improve pay competitiveness and align more closely with other senior executives. Upon joining the Company in April 2019, the target award opportunity for Mr. DeRienzis was set at 45% of salary. |
| • | Maintained the design of the Annual Incentive Plan to include the following metrics: 1) Total Corporate Revenues; 2) Adjusted EBITDA; 3) Adjusted Free Cash Flow; 4) Business Unit Revenue; and 5) Non-GAAP Business Unit Contribution Margin. Maximum award funding levels for superior performance results were increased from 125% of target to 150% of target. No annual incentives were earned in 2019 due to below-threshold performance results. |
| • | Annual equity grants to NEOs other than Mr. Farhat, who previously received front-loaded inducement grants in 2017, with an approximate equal value weighting between performance-based restricted stock units and time-based restricted stock. |
Financial Metrics Used in Compensation Programs
Financial metrics are commonly referenced in defining Company performance for executive officer compensation. The Compensation Committee bases its compensation decisions on the Company’s performance related to certain objectives. The Compensation Committee does not rely solely on predetermined formulas or a limited set of criteria when it evaluates the performance of the executive officers. The Compensation Committee retains discretion to take other factors into account in determining annual incentives and to award no annual incentives even if performance criteria are met. These metrics are defined here, and their use in incentive compensation programs is described below.
| (i) | Total Corporate Revenues |
Total Corporate Revenues means total consolidated revenues. The use of Total Corporate Revenues as a metric aligns with the Company’s transformation strategy in 2019 of accelerating growth through: (i) leveraging the Company’s core competency in the spine market; (ii) utilizing core technologies to expand OEM relationships and drive organic growth; and (iii) and building relevant scale in our spinal portfolio to improve our importance to the consolidating healthcare market driven increasingly by integrated delivery networks and group purchasing organizations. A portion of Mr. Visa’s annual incentive award opportunity is also tied to business unit revenues to further reinforce Mr. Visa’s performance incentives.
| (ii) | Adjusted EBITDA |
Adjusted EBITDA is a non-GAAP measure and, in management’s opinion, an indication of operational effectiveness and profitability as well as providing better alignment with valuation measures used by many stockholders. The use of Adjusted EBITDA as a metric helps to align the Company’s executive compensation metrics with its transformation strategy in 2019 of: (i) reducing complexity in the Company through the divestiture of non-core assets and investment in core competencies; and (ii) driving operational excellence through an increase in operational efficiency and reduction in costs. Adjusted EBITDA is earnings before interest, taxes, depreciation and amortization less certain reconciling items. The calculation of Adjusted EBITDA, and its reconciliation to the applicable GAAP figure, is set forth in Annex A to this Annual Report on Form 10-K.
64
Table of Contents
| (iii) | Adjusted Free Cash Flow |
Adjusted Free Cash Flow is a non-GAAP measure and an indication of liquidity. Adjusted Free Cash Flow means non-GAAP net cash provided by operating activities less purchases of property, plant and equipment and non-recurring charges, in an effort to support our ongoing strategic transformation through efforts to simplify our business. We believe that Adjusted Free Cash Flow is useful because it is intended to be a consistent measure of the underlying results of our business and efforts to improve liquidity. Furthermore, management uses it internally as a measure of liquidity and of the performance of our operations. The calculation of Adjusted Free Cash Flow, and its reconciliation to the applicable GAAP figure, is set forth in Annex A to this Annual Report on Form 10-K.
| (iv) | Non-GAAP Business Unit Contribution Margin |
Business Unit Contribution Margin is a non-GAAP measure which measures the ability of a company to cover variable costs with revenue. We use Business Unit Contribution Margin as an incentive metric because we believe that such growth is a reflection of our ability to leverage our fixed costs.
The 2019 operating goals focused on successfully growing all of our businesses with an emphasis on long-term growth. The Company’s operating goals for 2019 included:
| 2018 Actual Performance |
2019 Goal | 2019 Actual Performance | ||||
| Total Corporate Revenue |
$280.9 million | $332.6 million | $307.6 million $(25.0) million, (7.5)% | |||
| Adjusted EBITDA |
$33.7 million | $41.2 million | $26.8 million $(14.4) million, (34.9)% | |||
| Adjusted Free Cash Flow |
$11.1 million | $0.3 million | $(4.7) million $(5.0) million, (100.0)% |
Goals established for 2019 were set at levels above the 2018 actual achievement for Total Corporate Revenues and Adjusted EBITDA. Actual performance for 2019 Total Corporate Revenue, Adjusted EBITDA and Adjusted Free Cash Flow failed to meet the threshold level of achievement set by the Board and the 2019 goals. The 2019 goal for Adjusted Free Cash Flow was set lower than 2018 actual achievement to align with the 2019 operating plan and planned capital expenditures.
Actual payouts under the Annual Incentive Plan are based upon a comparison of actual performance to performance goals approved by the Compensation Committee at the beginning of the year. These performance goals contain thresholds and if performance is below such thresholds, as was the case for Fiscal 2019, no amount is earned for such goal. As such, none of the NEOs received a payout for the Annual Incentive Plan. See the discussion below under Short-Term Incentive Compensation which addresses the 2019 results.
The closing price of our common stock as of December 31, 2019 was $2.74 per share, resulting in the following:
| • | the performance-based stock options granted as inducement awards to Messrs. Farhat and Singer upon hire in 2017 remaining unvested, because the related stock price appreciation hurdles were not met; |
| • | the value of our executives’ actual stock holdings in RTI decreased commensurate with the decrease in stockholder value during the year; and |
| • | Total Shareholder Return (“TSR”) for 2019 of (25.9)%, which represents the change in the Company’s share price from the beginning of 2019 to the end of 2019. |
While financial goals were below threshold, NEOs and other employees made progress on a number of strategic objectives in 2019, leading to the previously announced agreement to sell the OEM Business to Montagu, a private equity firm, in 2020. This transaction is expected to strengthen the financial position of the stand-alone spine business and to further enhance long-term stockholder value creation, as evidenced by the significant increase in stock price, compared with the December 31, 2019 closing value, immediately following the deal announcement.
In light of the uncertainty created by the effects of the COVID-19 novel coronavirus pandemic, for an indefinite period of time, Camille I. Farhat, the Company’s President and Chief Executive Officer, agreed to forgo 50% of his base salary and each of our executive officers has agreed to forgo 30% of their respective base salaries. This reduction will be effective until such time as the Company determines in its discretion that business conditions related to, among other things, the COVID-19 novel coronavirus have improved.
The remainder of this Compensation Discussion and Analysis provides the more detailed philosophy, process, considerations, and analysis involved in the determination of executive compensation, particularly in regard to our NEOs.
65
Table of Contents
Oversight of Executive Compensation Program
General
The Compensation Committee of our Board (the “Compensation Committee”), presently chaired by Ms. Weis and consisting of Mr. Stolper, Mr. Thomas, Mr. Valeriani and Ms. Weis, is responsible for the planning, review and administration of our executive compensation programs. A copy of the Compensation Committee charter is available on our website at http://www.rtix.com/en_us/investors/corporate-governance.
One of our primary corporate objectives is to provide a superior return to stockholders. To support this objective, we believe we must attract, retain and motivate top quality executive talent. We believe that the executive compensation program we adopt is a critical tool in this process. The executive compensation program is designed to link executive compensation to our performance through at-risk compensation opportunities, providing significant reward to executives based on our success. The executive compensation program consists of base salary, annual cash incentive opportunities and long-term incentives in the form of performance shares and restricted stock in fiscal year 2019. To further encourage long-term stockholder value creation, stock options granted to Messrs. Farhat and Singer at the time of hire in 2017 include challenging stock price appreciation hurdles that must be met in order to vest. For annual equity grants to NEOs and other senior executives in fiscal year 2019, 50% of the target award opportunity is provided in the form of performance shares tied to our 3-year total stockholder return relative to industry peers.
Our compensation programs are designed specifically for: (1) our NEOs; (2) other officers of the Company; and (3) other Company employees. The Compensation Committee is charged with the review and approval of all annual compensation decisions relating to executive officers and our annual compensation guidelines for all other Company officers and employees.
Compensation Consultant
The Compensation Committee retains an independent compensation consultant to assist with the review of our executive and non-employee director compensation programs. The Compensation Committee has engaged Pearl Meyer as its independent consultant since 2011. Pearl Meyer reports to and is directed by the Compensation Committee and provides no other services to the Company. The compensation consultant assists the Compensation Committee by providing comparative market data on compensation practices and programs based on an analysis of the companies in our peer group identified below, provides guidance on incentive plan designs and industry best practices, and participates in Compensation Committee meetings as requested.
Peer Group and Compensation Targets
With the assistance of Pearl Meyer, during 2018, the Compensation Committee selected a peer group of public companies and prepared an analysis of compensation paid to our executive officers, against the executive officers at the peer companies, which we refer to as “compensation benchmarking data.” The peer group consisted of the following sixteen publicly-traded medical device related companies which we believe had executives in positions that were of similar scope to the Company’s executives:
| Alphatec Holdings, Inc. |
Cardiovascular Systems, Inc. |
Globus Medical, Inc. |
Orthofix International N.V. | |||
| AngioDynamics Inc. |
CONMED Corporation |
K2M Group Holdings, Inc |
SeaSpine Holdings Corp. | |||
| Anika Therapeutics, Inc. |
CryoLife Inc. |
Lantheus Holdings, Inc. |
Wright Medical Group Inc | |||
| Atrion Corp. |
Endologix, Inc. |
Merit Medical Systems, Inc. |
Xtant Medical Holdings, Inc. |
At the time of the market pay analysis conducted in 2018, RTI’s net sales and employee headcount were positioned between the 50th and 75th percentile levels of this peer group.
With the assistance of Pearl Meyer, the Compensation Committee also assesses pay competitiveness for certain other executive officers, based on market data for comparable positions within similarly-sized organizations as reported in published executive compensation surveys. For the most recent study completed in 2018, sources included the Radford Global Technology Survey and the Culpepper Executive Compensation Survey. Pearl Meyer did not conduct a similar study in 2019.
The compensation benchmarking data provides information to compare the compensation levels of executives against comparable organizations but is not the main determinant of compensation. In general, the Committee considers the executive’s compensation against the median (or 50th percentile) of the compensation benchmarking data, and then considers additional factors such as Company performance, individual executive performance, qualifications and responsibilities, internal pay equity among colleagues, and retention risks.
66
Table of Contents
Based on market benchmarking conducted by Pearl Meyer, target total direct compensation (sum of base salaries plus target short-term cash incentives plus target long-term incentives) was within a competitive range (defined as +/- 15%) of 50th percentile market values for each of our NEOs other than Messrs. Varela and Visa (whose target pay was below the range) and Mr. DeRienzis (who was not employed by the Company in 2018) and equal to 99% of the 50th percentile in the aggregate.
Overview of Compensation Philosophy and Program
In order to recruit and retain the most qualified and competent individuals as executive officers, we strive to maintain a compensation program that is competitive in the global labor market. Our compensation program is intended to reward exceptional organizational and individual performance.
The following compensation objectives are considered in setting the compensation programs for our executive officers:
| • | Drive and reward performance in support of the Company’s strategy, primary objectives and values; |
| • | Reflect competitive market practices and enhance our ability to attract, retain, reward and recognize top talent; |
| • | Provide a meaningful percentage of total compensation that is at-risk, or variable, based on predetermined performance criteria; and |
| • | Reward both short and long-term performance aligning executive incentives to stockholder returns and value creation. |
| What We Do |
What We Don’t Do | |
| Tie Executive pay to company performance with a significant portion of executive pay “at risk” | Do not allow for the repricing of stock options | |
| Link incentive awards to challenging performance goals that reinforce key business objectives and long-term stockholder value creation | Do not provide excessive severance payouts or “golden parachutes” to executive officers | |
| Mitigate risk using clawback provisions, stock ownership guidelines, capped incentive award opportunities, and robust Board of Directors and management processes to identify potential risk | Do not provide excise tax gross-ups | |
| Require our Compensation Committee to be comprised solely of independent board members | Do not provide excess perquisites and personal benefits | |
| Utilize an independent compensation consultant | Do not permit our directors and employees to participate in hedging or pledging activities involving Company securities | |
Compensation Elements and Rationale for Pay Mix Decisions
To reward both short and long-term performance in the compensation program and in furtherance of our compensation philosophy noted above, our executive compensation program includes the following:
| Type | Element | Description | Philosophy and Highlights | |||
| Fixed |
Base Salary |
• Fixed amount paid to the NEO in exchange for work performed
• Reviewed annually with adjustments driven primarily by individual performance, changes in responsibility or when significant deviation from competitive market data exists |
• Benchmark data targets the 50th percentile of the peer group |
67
Table of Contents
| Variable Short-Term |
Corporate Incentive Plan |
• Opportunity to earn cash incentives based on the achievement of specific Company-wide and business unit specific performance goals
• Set as a percentage of the NEO’s base salary
• Used to align NEOs with annual short-term Company performance
• Financial metrics assigned to each NEO are selected with a goal to drive annual performance and reinforce key strategic objectives and line of sight |
• A majority of targeted compensation should be in the form of variable incentives
• Target short-term incentives are based on relative contribution of the role to Company performance, internal equity among NEOs and competitive market practices
• Performance targets are set using the Company’s annual operating plan with minimum threshold level of achievement required for any payout and capped incentive award opportunities
• Incentive payouts align with performance achievement
• Performance goals are both challenging and realistic | |||
| Variable Long-Term |
Time-Based Restricted Stock, Stock
Options & |
• Provide NEOs with long-term incentive award opportunities that will align pay with stockholder value creation, encourage teamwork and collaboration in accomplishing long-term goals
• Fosters long-term commitment and connection between decisions made and long-term business outcomes
• Facilitates stock ownership among executives strengthening alignment with stockholder interests |
• A majority of targeted compensation should be in the form of variable incentives
• Target long-term incentive values are based on level of responsibility, internal equity among NEOs and competitive market practices
• The use of stock options creates a focus on share price appreciation and alignment with the interests of stockholders
• Time-based restricted stock awards are used as a meaningful retention tool
• Performance shares may be tied to multi-year total stockholder returns relative to peers and/or key financial metrics in support of strategic objectives and long-term value creation | |||
Review of Executive Officer Performance
The Compensation Committee reviews, on an annual basis, all pay components for each of our executive officers. The Compensation Committee takes into account the scope of responsibilities and experience of each incumbent and balances these against competitive compensation levels.
In addition, each year, the President and Chief Executive Officer presents to the Compensation Committee his evaluation of each executive officer, other than himself, which includes a review of contribution and performance over the past year, strengths, weaknesses, development plans and succession potential. The Chairman of the Board and the Chairman of the Compensation Committee, in consultation with the full Board, also evaluate the President and Chief Executive Officer’s performance in light of corporate goals and objectives and other factors as deemed appropriate. Following the reviews of performance and a comparison to the compensation benchmarking data, the Compensation Committee makes its own assessments and recommends to the Board compensation for the executive officers, including the President and Chief Executive Officer. The Board evaluates the contribution and performance of the executive officers, including the President and Chief Executive Officer, and approves their compensation after considering the recommendation of the Compensation Committee.
The Company’s 2018 results, management’s execution against the transformation strategy and the Compensation Committee’s deliberations were reflected in our final 2019 executive compensation decisions. We believe the performance and pay results demonstrate a strong alignment between executive compensation, Company performance, and stockholder value creation.
2019 Compensation Highlights
| NEO |
Base Salary Increase (1) |
2019 Annualized Base Salary (2) |
Short-Term Incentive Target as a % of Salary (3) |
Long-Term Incentive Target as a % of Salary (4) |
||||||||||||
| Camille I. Farhat |
3 | % | $ | 673,672 | 110 | % | (5 | ) | ||||||||
| Jonathon M. Singer |
4 | % | $ | 468,000 | 65 | % | 110 | % | ||||||||
| John N. Varela |
3 | % | $ | 354,502 | 50 | % | 50 | % | ||||||||
| Olivier M. Visa |
6 | % | $ | 318,000 | 50 | % | 75 | % | ||||||||
| Joshua H. DeRienzis |
N/A | $ | 325,000 | 45 | % | 45 | % | |||||||||
68
Table of Contents
| (1) | Increases were awarded to recognize individual performance related to the achievement of 2018 company objectives and in making significant progress toward the company’s strategic transformation. Mr. DeRienzis who began working for the Company in April 2019 did not receive any increase to base salary. |
| (2) | Represents annualized base salary for 2019 after any approved salary increases. |
| (3) | There were no changes in 2019 to the individual short-term incentive target award opportunities, expressed as percentages of base salary, for any NEO except for Mr. Visa, whose target award opportunity was increased from 40% to 50% of salary to improve pay competitiveness and to align more closely with other senior executives. |
| (4) | There were no changes in 2019 to the individual long-term incentive target award opportunities, expressed as percentages of base salary, for any NEO. Long-term incentive awards to NEOs in 2019 consisted of an equally weighted mix of performance restricted stock units and restricted stock awards. Additional information related to the award of long-term incentives to NEOs can be found in the Grants of Plan-Based Awards Table. |
| (5) | Inducement grants to Mr. Farhat in 2017, a significant portion of which are performance-based, are intended to cover long-term incentive award opportunities through 2019. As a result, he did not receive any additional grants in 2018 and 2019. Performance-based stock options granted to Mr. Farhat in 2017 vest based on three sets of stock price appreciation hurdles, ranging from 188% to 250% of the grant date price, each of which must be sustained for sixty consecutive calendar days. Mr. Farhat’s performance-based stock options expire after five years from the date of grant. |
Short-Term Incentive Compensation
The 2019 incentive criteria for Messrs. Farhat, Singer, Varela and DeRienzis were:
| Metric |
Total Corporate Revenues |
Adjusted EBITDA (1) | Adjusted Free Cash Flow (2) | |||||||||
| Weighting |
40 | % | 30 | % | 30 | % | ||||||
The 2019 incentive criteria for Mr. Visa were split between the Company-wide goals described above with a 70% weighting and business unit specific metrics with a 30% weighting:
| Business Unit Metric |
Revenue | Contribution Margin (3) | ||||||
| Weighting |
60 | % | 40 | % | ||||
| (1) | The Adjusted EBITDA performance measure was calculated using non-GAAP measures, which we believe provide meaningful supplemental information regarding our core operational performance, as more fully described in Annex A to this Annual Report on Form 10-K. |
| (2) | The Adjusted Free Cash Flow performance measure was calculated using non-GAAP measures, which we believe provide meaningful supplemental information regarding our liquidity and operational performance, as more fully described in Annex A to this Annual Report on Form 10-K. |
| (3) | The Business Unit Contribution Margin performance measure was calculated using non-GAAP measures, which we believe provide meaningful supplemental information regarding our core operational performance, as more fully described in Annex A to this Annual Report on Form 10-K. |
The specific 2019 performance goals established by the Compensation Committee and actual performance results for each metric are set forth in the following tables:
| Corporate Performance Category |
2019 Goal | 2019 Actual Performance |
Percentage Achievement |
% of Target STI Opportunity Earned |
||||||||||||
| Total Corporate Revenues |
$ | 332.6 million | $ | 307.6 million | 92.5 | % | 0.0 | % | ||||||||
| Adjusted EBITDA |
$ | 41.2 million | $ | 26.8 million | 65.1 | % | 0.0 | % | ||||||||
| Adjusted Free Cash Flow |
$ | 0.3 million | $ | (4.7) million | 0.0 | % | 0.0 | % | ||||||||
| Total Award Earned as a Percentage of Target Opportunity |
|
0.0 | % | |||||||||||||
69
Table of Contents
| Business Unit Performance Category |
Percentage Achievement | % of Target STI Opportunity Earned |
||||||
| Revenue |
102.4 | % | 75.0 | % | ||||
| Contribution Margin |
105.1 | % | 48.3 | % | ||||
| Total Award Earned as a Percentage of Target Opportunity |
|
123.3 | % | |||||
Actual payouts under the Annual Incentive Plan are based upon a comparison of actual performance to performance goals approved by the Board at the beginning of the year. In addition, these performance goals contain thresholds and if performance is below such thresholds, no amount is earned for such goals. Goals established for 2019 were set at levels above the 2018 actual achievement for Total Corporate Revenues and Adjusted EBITDA. The 2019 goal for Adjusted Free Cash Flow was set lower than 2018 actual achievement to align with the 2019 operating plan and planned capital expenditures. Goals established for the Business Unit Revenue and Contribution Margin were aligned with the 2019 operating plan. For 2019, actual payouts, relative to target awards, could range from 0% (for below threshold results) to 150% (for superior performance), with award funding for each metric separately calculated.
For 2019, the actual performance for Total Corporate Revenues, Adjusted EBITDA and Adjusted Free Cash Flow were not earned. Based on the metric weightings and performance results, calculated award funding was equal to 0.0% of the total target award opportunity for each eligible NEO. Though the Business Unit objectives were achieved above target, no payout was made to Mr. Visa as a result of the Total Corporate objectives not meeting threshold levels. Payouts under the Annual Incentive Plan are subject to the discretion of the Compensation Committee and annual incentive payouts under the plan may reflect adjustments (downward or upward) for extraordinary or unusual accounting events. The Compensation Committee did not adjust the calculated payouts of the 2019 short-term incentives for each of the eligible NEOs.
Recognition Bonuses
On November 4, 2019, the Compensation Committee approved special recognition bonuses related to the Contemplated Transactions taking into account extraordinary services performed by certain executives. These special recognition bonuses were approved for Mr. Varela, equal to 50% of his base salary as in effect when the bonus is paid and for each of Mr. Visa and Mr. DeRienzis equal to 75% of such executive’s base salary as in effect when the bonus is paid. The special recognition bonuses will be paid to the executives on the earlier of April 30, 2020 or the consummation of the Contemplated Transactions.
Additionally, on January 10, 2020, the Compensation Committee approved the award of a transaction bonus to Mr. Singer, which includes: (a) $225,000 in cash; and (b) the number of Restricted Shares, pursuant to the Plan, equal to (x) $225,000 divided by (y) Average Stock Price, one-half of which shall vest on the first anniversary of the grant date and one-half of which shall vest quarterly commencing on the fifteenth month following the grant date and ending on the second anniversary of the grant date. The transaction bonus will be issued to Mr. Singer upon the consummation of the Contemplated Transactions.
Long-Term Incentive Compensation
Long-term incentives comprise a significant portion of an executive officer’s total compensation package. The Compensation Committee’s objective is to provide executive officers with long-term incentive award opportunities that will align pay with stockholder value creation, encourage teamwork and collaboration in accomplishing long-term goals, facilitate stock ownership among executives, create retention incentives, and generally reflect competitive market practices. In recent years, we have provided executive officers with grants of stock options and restricted stock awards.
Each year the Company budgets a certain level of equity compensation expense and the Compensation Committee and Board approve awards within budget guidelines. The executive officers are granted restricted stock awards and performance shares as part of the overall allocation of equity compensation to managerial employees of the Company. The compensation benchmarking data is looked at as a point of reference as to whether executive officers are receiving stock awards commensurate with responsibilities and similar to executive officers in the peer companies.
The long-term incentive information related to the 2019 NEOs is included in the Summary Compensation Table under the columns Stock Awards and Option Awards. Additional information on long-term incentive awards is shown in the Grants of Plan-Based Awards Table and the Outstanding Equity Awards at Fiscal Year-End Table.
| Award Type |
Objective |
Key Features | ||
| Stock Options | • Opportunity to purchase our common stock over a designated time period at a price fixed on the grant date
• Strengthens relationship between long-term value of our stock price and potential financial gain for employees |
• Only has value if common stock price increases above the exercise price and the holder remains employed through vesting period
• Generally, vest over a five-year period from the date of grant and expire after ten years
• Exercise price is the closing stock price on the date of grant and shall not be less than the fair market value of the shares on the date of grant
• Awards granted at hire for both the CEO and CFO have stringent price appreciation hurdles required for vesting
• Accelerated vesting occurs in the case of death or disability of the holder and may be approved by the Compensation Committee for qualified retirement |
70
Table of Contents
| Time-Based Restricted Stock | • Shares of our common stock that are awarded with the restriction that the holder remains employed through the date of vesting
• Encourages stock ownership and aids in retaining key employees |
• Generally, vest over a three-year period from the date of grant
• Holders are allowed to vote shares as a stockholder
• Unvested awards generally are forfeited if the holder terminates employment with the Company
• In the event of death or disability, unvested awards are immediately vested | ||
| Performance Shares | • Units or shares of our common stock that are awarded with performance criteria that must be satisfied for vesting
• Motivates executives to improve the long-term market performance of our stock and focus on long-term creation of stockholder value |
• Vesting only occurs if market-based and/or financial goals are achieved and are capped at 200% of target levels
• For annual equity grants (excluding certain new hire grants) to NEOs and other senior executives in Fiscal Year 2019, 50% of the target award opportunity is provided in the form of performance shares tied to our 3-year total stockholder return relative to industry peers | ||
To further encourage long-term stockholder value creation, the Company granted stock options to Mr. Farhat at the time of hire in 2017. All of the outstanding stock options granted to Mr. Farhat are performance-based and are intended to cover long-term incentive award opportunities through 2019. As a result, Mr. Farhat did not receive any additional grants in 2018 and 2019.
Consistent with our commitment to a pay-for-performance philosophy and our use of challenging performance hurdles, 50% of the annual equity grants to NEOs in 2019 were provided in the form of performance-based restricted stock tied to 3-year relative TSR vs. industry peers in 2019. TSR is based on 30-day average closing prices leading up to start and end of cycle (i.e. January 1, 2019 to December 31, 2021) with straight-line interpolation used for results in between designated performance levels.
Stock Ownership Guidelines and Insider Trading Policy
Our Board has adopted Stock Ownership Guidelines, which require our chief executive officer to hold qualifying shares in an amount equal to six times base salary, our other NEOs to hold an amount equal to three times base salary and our non-employee directors to hold an amount equal to five times the annual cash retainer plus all shares initially granted upon election to the Board, if applicable. Our chief executive officer, other NEOs and non-employee directors are given five years from the date of first becoming subject to these Stock Ownership Guidelines, to achieve the threshold ownership. Once the threshold is reached, an executive officer or non-employee director is permitted to sell net after-tax shares received from equity grants, provided that the threshold ownership requirement is maintained. NEOs and non-employee directors may, from time to time, sell shares of the Company’s common stock to cover taxes associated with the vesting of restricted stock awards. When an executive officer or non-employee director leaves our Company or the Board, the executive officer or non-employee director may sell any vested shares he or she possesses, subject to compliance with applicable law. Each of our NEOs and non-employee directors is in compliance with the Stock Ownership Guidelines or is within the five-year accumulation period. Our Chief Executive Officer has made open market purchases of our common stock totaling 173,394 shares since the execution of his employment agreement. The Stock Ownership Guidelines are available on our website at http://www.rtix.com/en_us/investors/governance.
Our Board has also adopted an Insider Trading Policy, which includes anti-hedging provisions that restrict our employees, officers and directors from purchasing financial instruments or otherwise engaging in transactions that are designed to or have the effect of hedging or offsetting any decrease in the market value of our stock.
71
Table of Contents
Tax Implications of Executive Compensation
Compensation paid to certain executive officers in excess of $1,000,000 is generally non-deductible, whether or not it is performance-based. Although the Compensation Committee has generally attempted to structure executive compensation so as to preserve deductibility, it also believes that there are circumstances where our interests are best served by maintaining flexibility in the way compensation is provided, even if it might result in the non-deductibility of certain compensation under the Code.
Retirement, Health and Welfare Benefits
We offer a variety of health and welfare benefits, life insurance, short and long-term disability and retirement benefits to all eligible employees. The NEOs generally are eligible for these benefit programs on the same basis as other employees but also participate in perquisite programs related to these benefits as described below.
Perquisites and Perquisite Allowance Payments
Executive officers are provided with the following benefits as a supplement to their other compensation:
| • | Health and Welfare Coverage: We pay 100% of the premium for health, dental and vision insurance for executive officers. In addition, at our expense, each executive officer is allowed to have a complete and professional personal physical exam on an annual basis. Executive officers are responsible for deductibles and co-payments under the health benefit plans. |
| • | Life Insurance & Accidental Death & Dismemberment Coverage: We pay 100% of the premium for both term life insurance and accidental death and dismemberment coverage, equal to $50,000 for the executive officers of the Company. |
Severance Plan
As of December 31, 2019, we did not have in effect any general severance plan that provides for change-in-control or other payments to our executive officers, although Messrs. Farhat and Singer’s employment agreements and Mr. DeRienzis’s offer letter provides for change-in-control provisions as described below.
On January 13, 2020, RTI entered into involuntary termination agreements with Messrs. Varela and Visa. Pursuant to the terms of these agreements, if the executive’s employment is terminated without cause or he resigns for good reason (both terms as defined in the involuntary termination agreements) during the period beginning on and ending six months following the Contemplated Transactions, the executive is entitled to a severance payment equal to twelve times the executive’s monthly base salary. Each executive’s severance payment is conditioned upon execution of a general release agreement provided by RTI. All of the executive’s outstanding and unvested equity awards will be accelerated upon RTI’s successful completion of the Contemplated Transactions. After RTI’s successful completion of the Contemplated Transactions, it is currently contemplated that Messrs. Varela and Visa will transition to OEM.
RTI also entered into an involuntary termination agreement with Mr. Louw on January 13, 2020, however, as previously announced, on March 17, 2020, the Company and Mr. Louw agreed that Mr. Louw’s employment with Legacy RTI would end no later than April 8, 2020. Upon termination of his employment on April 8, 2020, the involuntary termination agreement with Mr. Louw became void. In connection with his departure, on April 24, 2020, Legacy RTI entered into a Separation Agreement and Release of Claims and a Consultant Agreement with Mr. Louw.
72
Table of Contents
Employment Agreements
Employment Agreement – Mr. Farhat
On January 26, 2017, the Company entered into an employment agreement with our Chief Executive Officer, Camille Farhat (the “Farhat Employment Agreement”). The Farhat Employment Agreement had an initial term of two years, which expired on January 26, 2019. The Farhat Employment Agreement automatically renewed, however, for an additional one-year term beginning on January 26, 2019, and will automatically renew for one-year terms on each anniversary of the expiration of the initial term until terminated. Pursuant to the Farhat Employment Agreement, the Company will pay Mr. Farhat a base salary of at least $635,000 annually (subject to annual review by the Board (or a Board committee). Mr. Farhat will be eligible to receive an annual discretionary incentive payment under the Company’s annual incentive plan based on a target of at least 110% of his base salary, based on the attainment of one or more pre-established performance goals to be determined by the Board or the Compensation Committee in its sole discretion. In addition, the Farhat Employment Agreement contains customary covenants on confidentiality, non-competition, non-solicitation, and non-interference, as well as provisions on the termination of the Farhat Employment Agreement and the consequences thereof.
As a material condition to entering into the Farhat Employment Agreement, on January 26, 2017 (the “Grant Date”), the Company and Mr. Farhat entered into: (1) a restricted stock award agreement (the “Restricted Stock Agreement #1”); (2) another restricted stock award agreement (the “Restricted Stock Agreement #2”); and (3) a stock option agreement (the “Option Agreement”).
Under the original Restricted Stock Agreement #1, as amended, the Company granted Mr. Farhat 850,000 shares of restricted common stock, all of which have fully vested. Under the Restricted Stock Agreement #2, the Company granted Mr. Farhat 150,000 shares of restricted common stock, all of which have fully vested.
Under the Option Agreement, the Company granted Mr. Farhat the option to purchase 1,950,000 shares of common stock (the “Stock Options”). The exercise price for the Stock Options is $3.20. The Stock Options will expire on January 26, 2022. The Stock Options will vest based on the Company’s attainment of three average stock price benchmarks. The first 650,000 shares will vest if the Company’s average publicly traded closing stock price is over $6.00 for a sixty-consecutive calendar day period. The next 650,000 shares will vest if the Company’s average publicly traded closing stock price is over $7.00 for a sixty-consecutive calendar day period. The final 650,000 shares will vest if the Company’s average publicly traded closing stock price is over $8.00 for a sixty-consecutive calendar day period. The vesting of the Stock Options is cumulative.
Employment Agreement – Mr. Singer
The Company entered into an Employment Agreement with Mr. Singer, dated September 18, 2017 (the “Singer Employment Agreement”), which sets forth the terms of Mr. Singer’s service as the Company’s Chief Financial and Administrative Officer. The Singer Employment Agreement has an initial term of three years, which automatically renews annually at the expiration of the initial term. Pursuant to the Singer Employment Agreement, the Company will pay Mr. Singer a base salary of at least $450,000 annually (subject to annual review by the Company’s Chief Executive Officer and the Board (or a committee thereof)). Mr. Singer will be eligible to receive an annual discretionary incentive award opportunity under the Company’s annual incentive plan based on a target of at least 65% of his base salary, based on the attainment of one or more pre-established performance goals to be determined by the Board or the Company’s compensation committee in its sole discretion. Mr. Singer will also be eligible to participate in the Company’s long-term incentive plan based upon a target long term incentive opportunity of at least 110% of his salary. The Singer Employment Agreement also provided for a one-time payment of $168,750 no later than March 15, 2018, and a one-time payment of $1,000,000 to Mr. Singer in September of 2018 as an inducement to Mr. Singer’s entry into the Singer Employment Agreement, both of which have been paid to Mr. Singer. If Mr. Singer’s employment with the Company is terminated by the Company for cause or by Mr. Singer without good reason before October 2, 2020, then Mr. Singer will have to repay the one-time payment of $168,750 and the after-tax portion of the $1,000,000 one-time payment, respectively, and forfeit any unvested shares of the Company’s common stock, granted to Mr. Singer pursuant to the Restricted Stock Agreement and the Option Agreement (as defined below). In addition, the Singer Employment Agreement contains customary covenants regarding confidentiality, non-competition, non-solicitation, and non-interference, as well as provisions regarding the termination of the Singer Employment Agreement and the consequences thereof.
As a material condition to entering into the Singer Employment Agreement, on September 18, 2017 (the “Grant Date”), the Company issued an inducement grant to Mr. Singer. This grant was in the form of: (1) a restricted stock award agreement (the “Restricted Stock Agreement”); and (2) a stock option agreement (the “Option Agreement”). This inducement grant was made under the RTI Surgical, Inc. 2015 Incentive Compensation Plan.
Under the Restricted Stock Agreement, the Company granted Mr. Singer 109,890 shares of restricted common stock, of which 73,760 shares have fully vested. On the third anniversary of the Grant Date, the final 36,630 shares will vest.
73
Table of Contents
Under the Option Agreement, the Company granted Mr. Singer the option to purchase 306,900 shares of Common Stock (the “Stock Options”), as of the Grant Date. The exercise price for the Stock Options is $4.55 per share. The Stock Options will expire on September 18, 2027. The Stock Options will vest based the Company’s attainment of three average stock price benchmarks. The first 102,300 shares will vest if the Company’s average publicly traded closing stock price is over $7.00 per share for a sixty-consecutive calendar day period. The next 102,300 shares will vest if the Company’s average publicly traded closing stock price is over $8.00 per share for a sixty-consecutive calendar day period. The final 102,300 shares will vest if the Company’s average publicly traded closing stock price is over $9.00 per share for a sixty-consecutive calendar day period. The vesting of the Stock Options is cumulative.
Offer Letter – Mr. DeRienzis
On April 4, 2019, Mr. DeRienzis accepted the terms of an offer letter (the “Offer Letter”) summarizing the terms of his employment and compensation. The Offer Letter provides for a severance payout in the event of a change in control and involuntary termination without cause or voluntary termination with good reason, which consists of: (i) 12 months’ base salary; (ii) a prorated target bonus based on the number of full months completed in the performance year of the termination event; and (iii) 12 months of premium reimbursement for medical, dental and vision coverage under COBRA. Under the terms of the Offer Letter, the Company also granted Mr. DeRienzis a one-time award of 69,188 shares of time-based restricted stock, which vests 33.3% per year over a three-year period from the date of grant.
Potential Payments upon Termination of Employment
If the Company terminates Mr. Farhat or Mr. Singer for cause or Mr. Farhat or Mr. Singer resign without good reason, such individual would be owed any unpaid base salary through the date of termination, reimbursement for any unreimbursed business expenses incurred through the date of termination, any accrued but unused vacation time in accordance with Company policy, and all other payments, benefits or fringe benefits under the Company’s applicable benefits plan or program (the “Accrued Benefits”). In 2019, our other NEOs did not have employment or Change in Control agreements providing for severance benefits upon certain qualifying termination of employment scenarios. On January 13, 2020, the Company entered into Involuntary Termination Agreements providing for certain severance benefits upon certain qualifying termination of employment scenarios. For a more detailed discussion of the Involuntary Termination Agreements, see the section of this Annual Report on Form 10-K entitled “Severance Plan”.
The following table discloses the estimated payments and benefits, in addition to the Accrued Benefits, that would have been provided to our NEOs upon a termination without cause or resignation with good reason upon a Change in Control (as that term is defined in any employment agreement or equity award agreement) or without a Change in Control, applying the assumptions that their last day of employment was December 31, 2019, and assuming continued compliance with certain non-competition, non-solicitation, confidentiality restrictions contained in their respective employment agreements.
| Potential Payouts upon Involuntary Termination by Company without Cause or by Executive for Good Reason |
Potential Payouts upon Involuntary Termination by Company without Cause or by Executive for Good Reason after a Change in Control |
|||||||||||||||||||||||||||||||||||||||||||||||
| Name | Cash Payment |
Unvested Equity Awards |
Outplacement Services |
Cash Payment |
Unvested Equity Awards |
Outplacement Services |
||||||||||||||||||||||||||||||||||||||||||
| Camille I. Farhat |
$ | 673,672 | (1 | ) | — | — | — | — | — | |||||||||||||||||||||||||||||||||||||||
| Jonathon M. Singer |
$ | 468,000 | (2 | ) | $ | 507,434 | (3 | ) | $ | 30,000 | (4 | ) | $ | 994,500 | (5 | ) | $ | 507,434 | (6 | ) | $ | 30,000 | (7 | ) | ||||||||||||||||||||||||
| John N. Varela |
— | — | — | — | $ | 161,743 | (8 | ) | — | |||||||||||||||||||||||||||||||||||||||
| Olivier M. Visa |
— | — | — | — | $ | 255,148 | (9 | ) | — | |||||||||||||||||||||||||||||||||||||||
| Joshua H. DeRienzis |
— | — | — | $ | 434,688 | $ | 227,491 | (10 | ) | — | ||||||||||||||||||||||||||||||||||||||
| (1) | Assumes a base salary of $673,672 per year. This amount would be paid in equal monthly installments over the twelve-month period following termination. |
| (2) | Assumes a base salary of $468,000 per year. This amount would be paid in equal monthly installments over the twelve-month period following termination. |
| (3) | The closing price of our common stock on December 31, 2019 was $2.74 per share, and Mr. Singer had 185,195 unvested time-based and performance-based restricted stock awards as of December 31, 2019. |
| (4) | Includes outplacement services to be paid by the Company for the year in which Mr. Singer’s employment terminates. |
| (5) | Assumes a base salary of $468,000 per year. This amount would be paid in equal monthly installments over the eighteen-month period following termination and $292,500 as the target incentive opportunity for the year in which Mr. Singer’s employment terminates. |
74
Table of Contents
| (6) | The closing price of our common stock on December 31, 2019 was $2.74 per share, and Mr. Singer had 185,195 unvested time-based and performance-based restricted stock awards as of December 31, 2019. |
| (7) | Includes outplacement services to be paid by the Company for the year in which Mr. Singer’s employment terminates. |
| (8) | The closing price of our common stock on December 31, 2019 was $2.74 per share, and Mr. Varela had 59,030 unvested time-based and performance-based restricted stock awards as of December 31, 2019. |
| (9) | The closing price of our common stock on December 31, 2019 was $2.74 per share, and Mr. Visa had 93,120 unvested time-based and performance-based restricted stock awards as of December 31, 2019. |
| (10) | Assumes a base salary of $325,000 per year and $146,250 as the target incentive opportunity for the year in which Mr. DeRienzis’s employment terminates. The closing price of our common stock on December 31, 2019 was $2.74 per share, and Mr. DeRienzis had 83,026 unvested time-based and performance-based restricted stock awards as of December 31, 2019. |
Clawbacks
Pursuant to certain of the Company’s equity incentive plans, the Board may, in appropriate circumstances, require reimbursement of any incentive payment under any award to an employee where: (1) there is an accounting restatement of Company financial statements or results; and (2) such restatement results from a noncompliance by the Company with any requirements under or related to the federal securities laws.
Risk Assessment
Public companies are required to conduct a risk assessment to determine if there are any compensation programs, policies, or practices that are “reasonably likely” to have a material adverse effect on the Company.
The Compensation Committee conducted a risk assessment of the Company’s compensation policies and practices for the fiscal year 2019. This risk assessment consisted of a review of cash and equity compensation provided to senior executives and incentive compensation plans and commission plans which provide variable compensation based upon Company and individual performance. The Compensation Committee concluded that our compensation programs are designed with the appropriate balance of risk and reward in relation to the Company’s overall business and do not create risk that is reasonably likely to have a material adverse effect on the Company. The following characteristics of our compensation programs support this finding:
| • | our use of different types of compensation vehicles that provide a balance of long- and short-term incentives with fixed and variable components; |
| • | our use of multiple performance measures and capped incentive award opportunities in the short-term incentive program; |
| • | the ability of the Compensation Committee and/or the Board to reduce incentive payouts if deemed appropriate; |
| • | stock awards have multi-year vesting ranging from three to five years; |
| • | performance shares only vest if market-based and/or financial goals are achieved and are capped at 200% of target levels; |
| • | Stock Ownership Guidelines are in place with respect to minimum levels of stock ownership; |
| • | our Insider Trading Policy contains a prohibition of hedging and using derivative securities or short selling as it relates to Company stock; and |
| • | our practice of looking beyond specific results-oriented performance and assessing the overall contributions of a particular executive. |
Compensation Committee Interlocks and Insider Participation
During 2019, Ms. Weis, Mr. Stolper, Mr. Thomas, and Mr. Valeriani served as members of our Compensation Committee. No member of our Compensation Committee was an officer or employee of ours during 2019 or had any other relationship with us requiring disclosure. None of our executive officers serves as a member of the Board or the Compensation Committee of any other entity that has one or more executive officers serving as a member of our Board or our Compensation Committee.
75
Table of Contents
SUMMARY COMPENSATION TABLE
The following table sets forth information concerning all cash and non-cash compensation awarded to, earned by or paid to our 2019 NEOs for the years indicated.
| Name and Principal Position |
Year | Salary ($) |
Bonus ($) (1) |
Stock Awards ($) (2) |
Option Awards ($) (2) |
Non-Equity Incentive Plan Compensation ($) (3) |
All Other Compensation ($) |
Total ($) |
||||||||||||||||||||||||
| Camille I. Farhat |
2019 | 664,148 | — | — | — | — | 26,036 | (4) | 690,184 | |||||||||||||||||||||||
| President and Chief Executive Officer |
2018 | 651,119 | — | — | — | 550,383 | 18,127 | (5) | 1,219,629 | |||||||||||||||||||||||
| 2017 | 483,577 | — | 3,200,000 | 2,615,600 | 530,860 | 2,862 | (6) | 6,832,898 | ||||||||||||||||||||||||
| Jonathon M. Singer |
2019 | 460,347 | — | 514,798 | — | — | 28,507 | (7) | 1,003,652 | |||||||||||||||||||||||
| Chief Financial and Administrative |
2018 | 450,000 | 1,000,000 | 247,350 | 247,487 | 223,763 | 19,711 | (8) | 2,188,311 | |||||||||||||||||||||||
| Officer |
2017 | 95,192 | 168,750 | 500,000 | 764,181 | 55,423 | — | 1,583,546 | ||||||||||||||||||||||||
| John N. Varela |
2019 | 351,739 | — | 177,249 | — | — | 26,123 | (9) | 555,111 | |||||||||||||||||||||||
| Executive Vice President Global |
2018 | 343,138 | — | 84,575 | 84,494 | 131,648 | 25,509 | (10) | 669,364 | |||||||||||||||||||||||
| Operations |
2017 | 335,009 | — | 110,000 | 110,077 | 128,223 | 23,862 | (11) | 707,171 | |||||||||||||||||||||||
| Olivier M. Visa |
2019 | 305,734 | — | 238,496 | — | — | 33,197 | (12) | 577,427 | |||||||||||||||||||||||
| President, Global OEM |
2018 | 300,000 | — | 112,150 | 111,105 | 108,648 | 23,563 | (13) | 655,466 | |||||||||||||||||||||||
| 2017 | 63,462 | — | 348,750 | — | 22,738 | — | 434,950 | |||||||||||||||||||||||||
| Joshua H. DeRienzis |
2019 | 224,492 | — | 450,000 | — | — | 146,003 | (14) | 820,495 | |||||||||||||||||||||||
| Vice President, General Counsel |
2018 | — | — | — | — | — | — | — | ||||||||||||||||||||||||
| and Corporate Secretary |
2017 | — | — | — | — | — | — | — | ||||||||||||||||||||||||
| (1) | Reflects one-time payments to Mr. Singer as an inducement to Mr. Singer’s entry into the Singer Employment Agreement. |
| (2) | Reflects the fair value of the award at date of grant. The stock option award fair values are calculated in accordance with Financial Accounting Standards Board Accounting Standards Codification Topic 718, Compensation—Stock Compensation. The assumptions underlying the valuation of restricted stock awards and stock options are set forth in footnote 10 to our consolidated financial statements for the year ended December 31, 2019. |
| (3) | Reflects incentives earned under the Annual Incentive Plan. |
| (4) | Includes matching contributions under our 401(k) Plan of $18,059, payment of $7,977 for health and dental insurance. |
| (5) | Includes matching contributions under our 401(k) Plan of $16,200, payment of $1,927 for health and dental insurance. |
| (6) | Includes matching contributions under our 401(k) Plan of $1,470, payment of $1,392 for health and dental insurance. |
| (7) | Includes matching contributions under our 401(k) Plan of $16,800, payment of $11,707 for health and dental insurance. |
| (8) | Includes matching contributions under our 401(k) Plan of $16,500 and payment of $3,211 for health and dental insurance. |
| (9) | Includes matching contributions under our 401(k) Plan of $16,800, payment of $8,503 for health and dental insurance and payment of $820 for term life insurance. |
| (10) | Includes matching contributions under our 401(k) Plan of $16,500, payment of $8,189 for health and dental insurance and payment of $820 for term life insurance. |
| (11) | Includes matching contributions under our 401(k) Plan of $16,200, payment of $6,809 for health and dental insurance and payment of $853 for term life insurance. |
| (12) | Includes matching contributions under our 401(k) Plan of $16,800, payment of $16,397 for health and dental insurance. |
| (13) | Includes matching contributions under our 401(k) Plan of $16,500, payment of $7,063 for health and dental insurance. |
| (14) | Includes matching contributions under our 401(k) Plan of $6,886, payment of $4,949 for health and dental insurance, a sign-on bonus of $75,000 and payment of $59,168 for relocation. |
76
Table of Contents
GRANTS OF PLAN-BASED AWARDS
This table discloses the actual numbers of restricted stock awards and stock options granted during 2019 and the grant date fair value of these awards. It also captures potential payouts under the Company’s non-equity incentive plans.
| All Other Stock Awards: |
Exercise or Base |
Grant Date | ||||||||||||||||||||||||||||||||||||||||
| Estimated Future Payouts Under Non- Equity Incentive Plan Awards (1) |
Estimated Future Payouts Under Equity Incentive Plan Awards (2) |
Number of Shares of |
Price of Option |
Fair Value of Stock and |
||||||||||||||||||||||||||||||||||||||
| Name |
Grant Date |
Grant Type |
Threshold ($) |
Target ($) |
Maximum ($) |
Threshold (#) |
Target (#) |
Maximum (#) |
Stock or Units (#) (2) |
Awards ($/Sh) |
Option Awards ($) |
|||||||||||||||||||||||||||||||
| Camille I. Farhat |
Non-Equity Incentive Plan |
370,520 | 741,039 | 926,299 | — | — | — | |||||||||||||||||||||||||||||||||||
| Stock Award |
— | — | — | |||||||||||||||||||||||||||||||||||||||
| Jonathon M. Singer |
Non-Equity Incentive Plan |
152,100 | 304,200 | 380,250 | — | — | — | |||||||||||||||||||||||||||||||||||
| 2/26/2019 | Restricted Stock Award |
54,883 | 4.69 | 257,401 | ||||||||||||||||||||||||||||||||||||||
| 2/26/2019 | Restricted Stock Unit |
27,441 | 54,882 | 109,764 | — | 4.69 | 257,397 | |||||||||||||||||||||||||||||||||||
| John N. Varela |
Non-Equity Incentive Plan |
88,626 | 177,251 | 221,564 | — | — | — | |||||||||||||||||||||||||||||||||||
| 2/26/2019 | Restricted Stock Award |
18,897 | 4.69 | 88,627 | ||||||||||||||||||||||||||||||||||||||
| 2/26/2019 | Restricted Stock Unit |
9,448 | 18,896 | 37,792 | — | 4.69 | 88,622 | |||||||||||||||||||||||||||||||||||
| Olivier M. Visa |
Non-Equity Incentive Plan |
79,500 | 159,000 | 198,750 | — | — | — | |||||||||||||||||||||||||||||||||||
| 2/26/2019 | Restricted Stock Award |
25,426 | 4.69 | 119,248 | ||||||||||||||||||||||||||||||||||||||
| 2/26/2019 | Restricted Stock Unit |
12,713 | 25,426 | 50,852 | — | 4.69 | 119,248 | |||||||||||||||||||||||||||||||||||
| Joshua H. DeRienzis (3) |
Non-Equity Incentive Plan |
73,125 | 146,250 | 182,813 | — | — | — | |||||||||||||||||||||||||||||||||||
| 4/8/2019 | Restricted Stock Award |
69,188 | 5.42 | 375,000 | ||||||||||||||||||||||||||||||||||||||
| 4/8/2019 | Restricted Stock Unit |
6,919 | 13,838 | 27,676 | — | 5.42 | 75,000 | |||||||||||||||||||||||||||||||||||
| (1) | These amounts represent the threshold, target, and maximum incentives payable to each executive under the Company’s 2018 Incentive Plan. |
| (2) | The time-based restricted stock awards are subject to the recipient’s continued service with us and 33.3% of these time-based restricted stock awards will become vested on each anniversary date from February 26, 2020 through February 26, 2022. The performance-based restricted stock awards were granted on February 26, 2019, pursuant to our 2018 Incentive Compensation Plan. The performance-based restricted stock awards are subject to the recipient’s continued service with us and the vesting of these performance-based restricted stock awards on February 26, 2022, subject to a three-year performance-period based on achieving certain market-based performance targets. Actual achievement determines payout between 50% and 200% of target. |
| (3) | Mr. DeRienzis began employment with the Company on April 8, 2019. The time-based restricted stock awards are subject to the recipient’s continued service with us and 33.3% of these time-based restricted stock awards will become vested on each anniversary date from April 8, 2020 through April 8, 2022. The performance-based restricted stock awards were granted on April 8, 2019, pursuant to our 2018 Incentive Compensation Plan. The performance-based restricted stock awards are subject to the recipient’s continued service with us and the vesting of these performance-based restricted stock awards on April 8, 2022, subject to a three-year performance-period based on achieving certain market-based performance targets. |
77
Table of Contents
OUTSTANDING EQUITY AWARDS AT FISCAL YEAR-END
The following table shows outstanding stock option awards classified as exercisable and unexercisable as of December 31, 2019, for NEOs.
| Option Awards | Stock Awards | |||||||||||||||||||||||||||||||||||||
| Name |
Grant Date |
Grant Type |
Number of Securities Underlying Unexercised Options (#) Exercisable |
Number of Securities Underlying Unexercised Options (#) Unexercisable |
Option Exercise Price ($) |
Option Expiration Date |
Number of Shares or Units of Stock That Have Not Vested (#) |
Market Value of Shares or Units of Stock That Have Not Vested ($) |
Equity Incentive Plan Awards: Number of Unearned Shares, Units or Other Rights That Have Not Vested (#) |
Equity Incentive Plan Awards: Market or Payout Value of Unearned Shares, Units or Other Rights That Have Not Vested ($) |
||||||||||||||||||||||||||||
| Camille I. Farhat (1) |
1/26/2017 | Stock Options | — | 1,950,000 | 3.20 | 1/26/2022 | — | — | — | — | ||||||||||||||||||||||||||||
| 1/26/2017 | RSA | — | — | — | — | |||||||||||||||||||||||||||||||||
| Jonathon M. Singer (2) |
9/18/2017 | Stock Options | — | 306,900 | 4.55 | 9/18/2022 | — | — | — | — | ||||||||||||||||||||||||||||
| 2/28/2018 | Stock Options | 25,600 | 102,400 | 4.25 | 2/28/2028 | — | — | — | — | |||||||||||||||||||||||||||||
| 9/18/2017 | RSA | 36,630 | 100,366 | — | — | |||||||||||||||||||||||||||||||||
| 2/28/2018 | RSA | 38,800 | 106,312 | — | — | |||||||||||||||||||||||||||||||||
| 2/26/2019 | RSA | 54,883 | 150,379 | — | — | |||||||||||||||||||||||||||||||||
| 2/26/2019 | RSU | 54,882 | 150,377 | — | — | |||||||||||||||||||||||||||||||||
| John N. Varela (3) |
7/14/2014 | Stock Options | 20,000 | — | 4.26 | 7/14/2024 | — | — | — | — | ||||||||||||||||||||||||||||
| 2/17/2015 | Stock Options | 24,000 | 6,000 | 5.23 | 2/17/2025 | — | — | — | — | |||||||||||||||||||||||||||||
| 2/24/2016 | Stock Options | 23,226 | 15,484 | 3.31 | 2/24/2026 | — | — | — | — | |||||||||||||||||||||||||||||
| 5/3/2017 | Stock Options | 19,384 | 29,074 | 4.60 | 5/3/2027 | — | — | — | — | |||||||||||||||||||||||||||||
| 2/28/2018 | Stock Options | 8,740 | 34,960 | 4.25 | 2/28/2028 | — | — | — | — | |||||||||||||||||||||||||||||
| 5/3/2017 | RSA | 7,971 | 21,841 | — | — | |||||||||||||||||||||||||||||||||
| 2/28/2018 | RSA | 13,266 | 36,349 | — | — | |||||||||||||||||||||||||||||||||
| 2/26/2019 | RSA | 18,897 | 51,778 | — | — | |||||||||||||||||||||||||||||||||
| 2/26/2019 | RSU | 18,896 | 51,775 | — | — | |||||||||||||||||||||||||||||||||
| Olivier M. Visa (4) |
2/28/2018 | Stock Options | 7,760 | 31,040 | 4.25 | 2/28/2028 | — | — | — | — | ||||||||||||||||||||||||||||
| 5/1/2018 | Stock Options | 3,380 | 13,520 | 4.50 | 5/1/2028 | — | — | — | — | |||||||||||||||||||||||||||||
| 10/2/2017 | RSA | 25,000 | 68,500 | — | — | |||||||||||||||||||||||||||||||||
| 2/28/2018 | RSA | 11,734 | 32,151 | — | — | |||||||||||||||||||||||||||||||||
| 5/1/2018 | RSA | 5,534 | 15,163 | — | — | |||||||||||||||||||||||||||||||||
| 2/26/2019 | RSA | 25,426 | 69,667 | — | — | |||||||||||||||||||||||||||||||||
| 2/26/2019 | RSU | 25,426 | 69,667 | — | — | |||||||||||||||||||||||||||||||||
| Joshua H. DeRienzis (5) |
4/8/2019 | RSA | 69,188 | 189,575 | — | — | ||||||||||||||||||||||||||||||||
| 4/8/2019 | RSU | 13,838 | 37,916 | — | — | |||||||||||||||||||||||||||||||||
| (1) | Mr. Farhat holds the following stock options which vest based on the Company’s attainment of three average stock price benchmarks and restricted stock awards which vest as disclosed in his employment agreement discussed above: |
- 1,950,000 stock options granted on January 26, 2017. The first 650,000 shares will vest if the Company’s average publicly traded closing stock price is over $6.00 for a sixty-consecutive calendar day period. The next 650,000 shares will vest if the Company’s average publicly traded closing stock price is over $7.00 for a sixty-consecutive calendar day period. The final 650,000 shares will vest if the Company’s average publicly traded closing stock price is over $8.00 for a sixty-consecutive calendar day period. The vesting of the Stock Options is cumulative.
- 1,000,000 restricted stock awards granted January 26, 2017. 150,000, 425,000, 170,000, 42,500, 42,500, 42,500 and 42,500 restricted stock awards vested on May 18, 2017, December 4, 2017, January 26, 2018, March 31, 2018, June 30, 2018, September 30, 2018, December 31, 2018, March 31, 2019 and June 30, 2019, respectively.
| (2) | Mr. Singer holds the following stock options which vest based on the Company’s attainment of three average stock price benchmarks and stock options which vest 20% per year over a five-year period from the date of grant and restricted stock awards which vests 33.3% per year over a three-year period from the date of grant and a performance-based restricted stock award which vests 100% at the end of a three-year period from the date of grant subject to a three-year performance-period based on achieving certain financial performance targets and restricted stock awards which vest as disclosed in his employment agreement discussed above: |
- 306,900 stock options granted on September 18, 2017. The first 102,300 shares will vest if the Company’s average publicly traded closing stock price is over $7.00 per share for a sixty-consecutive calendar day period. The next 102,300 shares will vest if the Company’s average publicly traded closing stock price is over $8.00 per share for a sixty-consecutive calendar day period. The final 102,300 shares will vest if the Company’s average publicly traded closing stock price is over $9.00 per share for a sixty-consecutive calendar day period. The vesting of the Stock Options is cumulative.
- 128,000 stock options granted on February 28, 2018. 25,600 stock options have vested, or will vest, on each of February 28, 2019, 2020, 2021, 2022 and 2023.
78
Table of Contents
- 109,890 restricted stock awards granted September 18, 2017. 36,630 restricted stock awards have vested, or will vest, on each of September 18, 2018, 2019 and 2020.
- 58,200 restricted stock awards granted February 28, 2018. 19,400 restricted stock awards have vested, or will vest, on each of February 28, 2019, 2020 and 2021.
- 54,883 restricted stock awards granted February 26, 2019. 18,294 restricted stock awards have vested, or will vest, on each of February 26, 2020, 2021 and 2022.
- 54,882 performance-based restricted stock units granted February 26, 2019. 54,882 performance-based restricted stock units may vest on February 26, 2022, subject to a three-year performance-period based on achieving certain financial performance targets.
| (3) | Mr. Varela holds the following stock options which vest 20% per year over a five-year period from the date of grant and restricted stock awards which vests 33.3% per year over a three-year period from the date of grant and a performance-based restricted stock award which vests 100% at the end of a three-year period from the date of grant subject to a three-year performance-period based on achieving certain financial performance targets: |
- 43,700 stock options granted on February 28, 2018. 8,740 stock options have vested, or will vest, on each of February 28, 2019, 2020, 2021, 2022 and 2023.
- 48,458 stock options granted on May 3, 2017. 9,691 stock options have vested, or will vest, on each of May 3, 2018 and 2019. 9,692 stock options have vested, or will vest, on each of May 3, 2020, 2021 and 2022.
- 38,710 stock options granted on February 24, 2016. 7,742 stock options have vested, or will vest, on each of February 24, 2017, 2018, 2019, 2020 and 2021.
- 30,000 stock options granted on February 17, 2015. 6,000 stock options have vested, or will vest, on each of February 17, 2016, 2017, 2018, 2019 and 2020.
- 20,000 stock options granted on July 14, 2014. 4,000 stock options have vested, or will vest, on each of July 14, 2015, 2016, 2017, 2018 and 2019.
- 19,900 restricted stock awards granted February 28, 2018. 6,633 restricted stock awards have vested, or will vest, on each of February 28, 2019 and 2020. 6,634 restricted stock awards will vest on February 28, 2021.
- 23,913 restricted stock awards granted May 3, 2017. 7,971 restricted stock awards have vested, or will vest, on each of May 3, 2018, 2019 and 2020.
- 18,897 restricted stock awards granted February 26, 2019. 6,299 restricted stock awards have vested, or will vest, on each of February 26, 2020, 2021 and 2022.
- 18,896 performance-based restricted stock units granted February 26, 2019. 18,896 performance-based restricted stock units may vest on February 26, 2022, subject to a three-year performance-period based on achieving certain financial performance targets.
| (4) | Mr. Visa holds the following stock options which vest 20% per year over a five-year period from the date of grant and restricted stock awards which vests 33.3% per year over a three-year period from the date of grant and a performance-based restricted stock award which vests 100% at the end of a three-year period from the date of grant subject to a three-year performance-period based on achieving certain financial performance targets: |
- 16,900 stock options granted on May 1, 2018. 3,380 stock options will vest on each of May 1, 2019, 2020, 2021, 2022 and 2023.
- 38,800 stock options granted on February 28, 2018. 7,760 stock options have vested, or will vest, on each of February 28, 2019, 2020, 2021, 2022 and 2023.
- 8,300 restricted stock awards granted May 1, 2018. 2,766 restricted stock awards vested on February 28, 2019. 2,767 restricted stock awards will vest on each of May 1, 2020 and 2021.
- 17,600 restricted stock awards granted February 28, 2018. 5,866 restricted stock awards vested on February 28, 2019. 5,867 restricted stock awards will vest on each of February 28, 2020 and 2021.
- 75,000 restricted stock awards granted October 2, 2017. 25,000 restricted stock awards have vested, or will vest, on each of October 2, 2018, 2019 and 2020.
- 25,426 restricted stock awards granted February 26, 2019. 8,475 restricted stock awards have vested, or will vest, on each of February 26, 2020, 2021 and 2022.
- 25,426 performance-based restricted stock units granted February 26, 2019. 25,426 performance-based restricted stock units may vest on February 26, 2022, subject to a three-year performance-period based on achieving certain financial performance targets.
79
Table of Contents
| (5) | Mr. DeRienzis holds the following restricted stock awards which vests 33.3% per year over a three-year period from the date of grant and a performance-based restricted stock award which vests 100% at the end of a three-year period from the date of grant subject to a three-year performance-period based on achieving certain financial performance targets: |
- 69,188 restricted stock awards granted April 8, 2019. 23,063 restricted stock awards have vested, or will vest, on each of April 8, 2020, 2021 and 2022.
- 13,838 performance-based restricted stock units granted April 8, 2019. 13,838 performance-based restricted stock units may vest on April 8, 2022, subject to a three-year performance-period based on achieving certain financial performance targets.
80
Table of Contents
OPTION EXERCISES AND STOCK VESTED
The following table sets forth information with respect to restricted stock awards held by the persons named in the Summary Compensation Table that vested in 2019.
| Option Awards | Stock Awards | |||||||||||||||
| Name |
Number of Shares Acquired on Exercise (#) |
Value Realized on Exercise ($) |
Number of Shares Acquired on Vesting (#) |
Value Realized on Vesting ($) |
||||||||||||
| Camille I. Farhat |
— | — | 85,000 | $ | 439,450 | |||||||||||
| Jonathon M. Singer |
— | — | 56,030 | 212,363 | ||||||||||||
| John N. Varela |
— | — | 18,633 | 96,371 | ||||||||||||
| Olivier M. Visa |
— | — | 33,634 | 113,521 | ||||||||||||
| Joshua H. DeRienzis |
— | — | — | — | ||||||||||||
81
Table of Contents
NONQUALIFIED DEFERRED COMPENSATION
The Company has an Executive Nonqualified Excess Plan (“Excess Plan”) that permits eligible U.S. employees to defer base pay in excess of the amount taken into account under the Company’s qualified 401(k) Plan. As of December 31, 2019, there were no contributions, earnings, withdrawals, distributions and balances for any of the named executive officers under the Excess Plan.
At the time participation is elected and on an annual basis thereafter, employees must specify the amount of base pay and/or the percentage of incentives to be deferred, as well as the time and form of payment. If termination of employment occurs before retirement (defined as at least age 55 with 10 years of service), distribution is made in the form of a lump sum payment, annual installments or a combination of both at the time of termination, subject to any delay required under Section 409A of the Code. At retirement, benefits are paid according to the distribution election made by the participant at the time of the deferral election and are subject to any delay required under Section 409A of the Code. No withdrawals are permitted during employment or prior to the previously elected distribution date, other than “hardship” withdrawals as permitted by applicable law.
Amounts deferred or credited under the Excess Plan are credited with an investment return determined as if the account were invested in one or more investment funds made available by the Company. Accounts maintained for participants under the Excess Plan are not held in trust, and all such accounts are subject to the claims of general creditors of nonqualified deferred compensation plans. No accounts are credited with above-market earnings.
82
Table of Contents
DIRECTOR COMPENSATION
Board compensation is reviewed annually, and changes are recommended by the Compensation Committee and approved by the Board.
Our directors who are also our employees or officers did not receive any compensation specifically related to their activities as directors, other than reimbursement for expenses incurred relating to their attendance at meetings. In 2019, our non-employee directors received an annual Board cash retainer of $40,000, paid in quarterly installments. Also, in 2019, the Chairman of the Board received an additional annual cash retainer of $50,000. Non-employee directors received annual chair and member retainers based on committee service as follows:
| Description |
Amount | |
| Chair Meeting Fee |
Audit Committee – $20,000 Compensation Committee – $15,000 Nominating and Governance Committees – $10,000 | |
| Member Meeting Fee |
Audit Committee – $10,000 Compensation Committee – $7,500 Nominating and Governance Committees – $5,000 | |
In light of the uncertainty created by the effects of the COVID-19 novel coronavirus pandemic, on April 21, 2020, at a Board meeting, each of our directors elected to defer, for an indefinite period of time, 100% of their director fees for 2020. This deferral will be effective until at least the date of the Annual Meeting.
At the discretion of our Board or Compensation Committee, our directors are also eligible to receive stock awards under our 2018 Incentive Compensation Plan, with a target grant date value in 2019 of $100,000. On February 26, 2019, each of our independent directors, except for Mr. Lightcap, received a grant of 21,322 restricted stock awards at a stock price of $4.69 per share. On March 8, 2019, Mr. Lightcap, received a grant of 17,668 restricted stock awards at a stock price of $5.66 per share. These restricted stock awards were subject to a restricted stock award agreement with one-year vesting. Non-employee directors are subject to stock ownership guidelines equal to five times the value of the annual Board cash retainer. Non-employee directors have up to five years from the time they join the Board to achieve stock ownership requirements.
The following table discloses the cash fees and stock awards and total compensation earned, paid or awarded, to each of the Company’s directors during 2019. Columns disclosing compensation under the headings “Option Awards,” “Non-Equity Incentive Plan Compensation,” “Change in Pension Value and Nonqualified Deferred Compensation Earnings,” and “All Other Compensation” are not included because no compensation in these categories was awarded to, earned by or paid to our directors in 2019.
Director Compensation
| Name (1) |
Fees Earned or Paid in Cash ($) (2) |
Stock Awards ($) (3) |
Total ($) |
|||||||||
| Peter F. Gearen (6) |
35,179 | — | 35,179 | |||||||||
| Jeffrey C. Lightcap (7) |
33,333 | 100,000 | (4) | 133,333 | ||||||||
| Thomas A. McEachin |
67,500 | 100,000 | (5) | 167,500 | ||||||||
| Curt M. Selquist |
107,500 | 100,000 | (5) | 207,500 | ||||||||
| Mark D. Stolper |
65,000 | 100,000 | (5) | 165,000 | ||||||||
| Christopher R. Sweeney |
47,500 | 100,000 | (5) | 147,500 | ||||||||
| Paul G. Thomas |
62,898 | 100,000 | (5) | 162,898 | ||||||||
| Nicholas J. Valeriani |
60,000 | 100,000 | (5) | 160,000 | ||||||||
| Shirley A. Weis |
68,297 | 100,000 | (5) | 168,297 | ||||||||
| (1) | As of December 31, 2019, the following non-employee directors had outstanding unvested shares of restricted stock: Mr. Lightcap had 17,668 shares of unvested restricted stock, Mr. McEachin, Mr. Selquist, Mr. Stolper, Mr. Sweeney, Mr. Thomas, Mr. Valeriani, and Ms. Weis each had 21,322 shares of unvested restricted stock. |
| (2) | Includes 2019 annual cash retainer fees for serving on our Board and committees of our Board. |
83
Table of Contents
| (3) | Reflects the restricted stock award value at date of grant. The value is calculated in accordance with Financial Accounting Standards Board Accounting Standards Codification Topic 718, Compensation—Stock Compensation. The assumptions underlying the valuation of restricted stock awards are included in footnote 6 to our consolidated financial statements for the year ended December 31, 2019. |
| (4) | Reflects 17,668 restricted stock awards granted in 2019 at a stock value of $5.66. |
| (5) | Reflects 21,322 restricted stock awards granted in 2019 at a stock value of $4.69. |
| (6) | Dr. Gearen retired from the Board on April 29, 2019. |
| (7) | Mr. Lightcap joined the Board on March 8, 2019. |
84
Table of Contents
COMPENSATION COMMITTEE REPORT
The Compensation Committee has reviewed and discussed the Compensation Discussion and Analysis with management. Based upon such review, the related discussions and such other matters deemed relevant and appropriate by the Compensation Committee, the Compensation Committee recommended to the Board that the Compensation Discussion and Analysis be included in this Annual Report on Form 10-K.
Shirley A. Weis (Committee Chair)
Mark D. Stolper
Paul G. Thomas
Nicholas J. Valeriani
85
Table of Contents
President and Chief Executive Officer Pay Ratio
Mr. Farhat’s total reported compensation in 2019 was $690,184 as reflected in the Summary Compensation Table included in this Annual Report on Form 10-K. Mr. Farhat’s 2019 total annual compensation was approximately 11.8 times the median employee’s annual total compensation of $58,452. There was a material change in our employee population during 2019 resulting in the calculation of a new median employee. The median employee pay value represents compensation received from January 1, 2019 through December 31, 2019. The methodology used to identify the median employee uses the same pay components, as well as the same calculation methods and assumptions, disclosed in the Summary Compensation Table (including salary, bonus, stock awards, option awards, non-equity incentive plan compensation, deferred compensation earnings and other compensation). Compensation levels for permanent employees only working a partial year were annualized. All active employees were used in determining the median employee. Given the different methodologies that various public companies will use to determine an estimate of their pay ratio, the estimated ratio reported above should not be used as a basis for comparison between companies.
| Item 12. | SECURITY OWNERSHIP OF CERTAIN BENEFICIAL OWNERS AND MANAGEMENT AND RELATED STOCKHOLDER MATTERS. |
Equity Compensation Plan Information
The following table sets forth, as of the end of the last fiscal year, the number of equity securities authorized for issuance under the Company’s equity compensation plans.
| Plan Category |
Number of Securities to be issued upon exercise of outstanding options, warrants and rights |
Weighted-average exercise price of outstanding options, warrants, and rights |
Number of securities remaining available for future issuance under equity compensation plans |
|||||||||
| Equity compensation plans approved by security holders |
4,295,744 | $ | 3.76 | 3,872,655 | ||||||||
|
|
|
|
|
|
|
|||||||
| Equity compensation plans not approved by security holders |
2,950,000 | $ | 3.20 | — | ||||||||
|
|
|
|
|
|
|
|||||||
| Equity compensation plans not approved by security holders |
313,995 | $ | 1.99 | — | ||||||||
|
|
|
|
|
|
|
|||||||
| Total |
7,559,739 | $ | 3.47 | 3,872,655 | ||||||||
|
|
|
|
|
|
|
|||||||
Please see the above summary on page 73 under “Employment Agreement – Mr. Farhat” of the equity grants awarded to Mr. Farhat. Such equity grants were made as inducement grants and were not made under an equity compensation plan approved by RTI’s stockholders.
86
Table of Contents
BENEFICIAL OWNERSHIP OF PRINCIPAL STOCKHOLDERS AND MANAGEMENT
The following table sets forth information as of May 19, 2020 regarding the beneficial ownership of RTI’s common stock by: (1) each person known by RTI to own beneficially more than 5% of RTI’s outstanding common stock; (2) each of RTI’s directors; (3) each of RTI’s named executive officers; and (4) all of RTI’s directors and executive officers as a group. Except as otherwise specified, the named beneficial owner has the sole voting and investment power over the shares listed. Unless otherwise indicated, the address of the beneficial owner is: c/o RTI Surgical Holdings, Inc., 520 Lake Cook Road, Suite 315, Deerfield, Illinois 60015.
| Amount and Nature of Beneficial Ownership (1) |
||||||||
| Name and Address of Beneficial Owner |
Number | Percent | ||||||
| Camille I. Farhat |
1,110,619 | 1.5 | ||||||
| Jonathon M. Singer (2) |
620,827 | * | ||||||
| John N. Varela (3) |
204,959 | * | ||||||
| Olivier M. Visa (4) |
157,361 | * | ||||||
| Joshua H. DeRienzis (5) |
64,350 | * | ||||||
| Jeffrey C. Lightcap (6) |
42,360 | * | ||||||
| Thomas A. McEachin |
110,438 | * | ||||||
| Stuart F. Simpson |
0 | * | ||||||
| Curt M. Selquist |
140,064 | * | ||||||
| Mark D. Stolper |
91,476 | * | ||||||
| Christopher R. Sweeney |
100,415 | * | ||||||
| Paul G. Thomas |
100,415 | * | ||||||
| Nicholas J. Valeriani |
111,415 | * | ||||||
| Shirley A. Weis |
121,531 | * | ||||||
| WSHP Biologics Holdings, LLC (7) 444 West Lake Street, Suite 1800 Chicago, Illinois 60606 |
15,152,761 | 16.9 | ||||||
| Hayfin Capital Holdings Limited (8) c/o Hayfin Capital Management LLP One Eagle Place London, SW1Y 6AF, United Kingdom |
5,631,026 | 7.6 | ||||||
| Kopp Family Office, LLC (9) Building One, 6300 Bee Cave Road Austin, TX 78746 |
3,709,829 | 5.0 | ||||||
| Paradigm Capital Management Inc. (10) Nine Elk Street Albany, New York 12207 |
6,024,070 | 8.1 | ||||||
| BlackRock Inc. (11) 55 East 52nd Street New York, New York 10022 |
5,416,349 | 7.3 | ||||||
| Glen Capital Partners LLC (12) 800 South Street, Suite 160 Waltham, Massachusetts 02453 |
5,117,616 | 6.9 | ||||||
| Dimensional Fund Advisors, LP (13) Building One, 6300 Bee Cave Road Austin, Texas 78746 |
4,756,346 | 6.5 | ||||||
| Krensavage Asset Management, LLC (14) 130 E. 59th Street, 11th Floor New York, New York 10022 |
3,852,567 | 5.2 | ||||||
87
Table of Contents
| Wellington Trust Company, National Association Multiple Common Trust Funds Trust, Micro Cap Equity Portfolio (15) c/o Wellington Trust Company 280 Congress Street Boston, Massachusetts 02210 |
3,714,924 | 5.0 | ||||||
| All current executive officers and directors (16 persons) (16) |
3,243,043 | 4.4 | ||||||
| * | Represents beneficial ownership of less than 1%. |
| (1) | Beneficial ownership is determined in accordance with the rules of the SEC, which generally attribute beneficial ownership of securities to persons who possess sole or shared voting power and/or investment power with respect to those securities. Shares of common stock issuable pursuant to restricted stock awards and options, to the extent such options are exercisable or convertible within 60 days after May 19, 2020 (the latest practicable date prior to this Annual Report on Form 10-K) are treated as outstanding for purposes of computing the percentage of the person holding such securities but are not treated as outstanding for purposes of computing the percentage of any other person. This table does not include performance-based restricted stock grants under the Company’s 2019 Annual Incentive Plan (performance vesting at end of three years, date of grant February 2019), as the number of restricted shares to be awarded is not determinable at the time of grant and the recipients do not have the right to vote or other elements of beneficial ownership until vesting. The unvested shares of restricted stock included in the footnotes are time-based restricted stock grants deemed beneficially owned because the respective holders thereof have the right to vote such shares. |
| (2) | Includes currently-exercisable options to purchase 51,200 shares of our common stock, 92,618 shares of unvested restricted stock which will vest as to one third of the underlying shares each year over a three-year period commencing on the first anniversary of the date of grant, and 267,447 shares of unrestricted stock which will vest as to one-half of the underlying shares on the first anniversary of the date of grant and the remainder of the underlying shares quarterly commencing on the fifteenth month following the date of grant and ending on the second anniversary of the date of grant. |
| (3) | Includes currently-exercisable options to purchase 127,524 shares of our common stock and 19,232 shares of unvested restricted stock which will vest as to one third of the underlying shares each year over a three-year period commencing on the first anniversary of the date of grant. |
| (4) | Includes currently-exercisable options to purchase 22,280 shares of our common stock and 50,584 shares of unvested restricted stock which will vest as to one third of the underlying shares each year over a three-year period commencing on the first anniversary of the date of grant. |
| (5) | Includes 46,125 shares of unvested restricted stock which will vest as to one third of the underlying shares each year over a three-year period commencing on the first anniversary of the date of grant. |
| (6) | Mr. Lightcap joined the Board on March 8, 2019. |
| (7) | Information confirmed in Amendment No. 1 to Schedule 13D, filed with the SEC on January 17, 2020 by WSHP Biologics Holdings, LLC, who is the record owner of 50,000 shares of Series A Preferred, which is convertible at the current conversion price of $4.39 per share into approximately 15,152,761 shares of Common Stock of which 11,990,407 shares of common stock are entitled to be voted. |
| (8) | Information is derived from Schedule 13G, filed with the SEC on March 18, 2019 by Hayfin Capital Holdings Limited. |
| (9) | Information is derived from to Schedule 13G, filed with the SEC on January 7, 2020 by Kopp Family Office, LLC. |
| (10) | Information is derived from Amendment No. 6 to Schedule 13G, filed with the SEC on February 3, 2020 by Paradigm Capital Management Inc. |
| (11) | Information is derived from Amendment No. 11 to Schedule 13G, filed with the SEC on April 14, 2020 by BlackRock, Inc. |
| (12) | Information is derived from Schedule 13G, filed with the SEC on January 14, 2020 by Glen Capital Partners Focus Fund, LP. |
| (13) | Information is derived from Amendment No. 6 to Schedule 13G, filed with the SEC on February 12, 2020 by Dimensional Fund Advisors, LP. |
| (14) | Information is derived from Schedule 13G, filed with the SEC on February 14, 2019 by Krensavage Asset Management, LLC. |
| (15) | Information is derived from Schedule 13G, filed with the SEC on April 13, 2020 by Wellington Trust Company, National Association Multiple Common Trust Funds Trust, Micro Cap Equity Portfolio. |
| (16) | Includes options to purchase 204,444 shares of our common stock and 932,197 shares of unvested restricted stock. |
| Item 13. | CERTAIN RELATIONSHIPS AND RELATED TRANSACTIONS, AND DIRECTOR INDEPENDENCE. |
The Board of the Company has adopted a related party transaction policy. The policy requires that all “interested transactions” (as defined below) between the Company and any “related party” (as defined below) are subject to approval or ratification by the Audit Committee. In determining whether to approve or ratify such transactions, the Audit Committee will take into account, among other factors it deems appropriate, whether the interested transaction is on terms no less favorable than terms generally available to an unaffiliated third-party under the same or similar circumstances and the extent of the related person’s interest in the transaction. Also, the Board has delegated to the Chair of the Audit Committee the authority to pre-approve or ratify any interested transaction in which the aggregate amount is expected to be less than $1 million. Finally, the policy provides that no director shall participate in any discussion or approval of an interested transaction for which he or she is a related party, except that the director shall provide all material information concerning the interested transaction to the Audit Committee.
88
Table of Contents
Under the policy, an “interested transaction” is defined as any transaction, arrangement or relationship or series of similar transactions, arrangements or relationships (including any indebtedness or any guarantee of indebtedness) in which:
| • | the aggregate amount involved will or may be expected to exceed $100,000 in any fiscal year; |
| • | the Company is a participant; and |
| • | any related party has or will have a direct or indirect interest (other than solely as a result of being a director or a less than ten percent beneficial owner of another entity). |
A “related party” is defined as any:
| • | person who is or was (since the beginning of the last fiscal year for which the Company has filed a Form 10-K and proxy statement, even if he or she does not presently serve in that role) an executive officer, director or nominee for election as a director; |
| • | greater than five percent beneficial owner of the Company’s common stock; or |
| • | immediate family member of any of the foregoing. |
There were no related party transactions in 2019.
Our current Board of Directors currently consists of nine members: Camille I. Farhat, Jeffrey C. Lightcap, Thomas A. McEachin, Curtis M. Selquist, Mark D. Stolper, Christopher R. Sweeney, Paul G. Thomas, Nicholas J. Valeriani and Shirley A. Weis. Our Board has determined that each of our current directors and each of our nominees, except for Mr. Farhat, is an “independent director” as that term is defined in Rule 5605(a)(2) of the Nasdaq Listing Rules.
| Item 14. | PRINCIPAL ACCOUNTING FEES AND SERVICES. |
Fees Paid to Independent Registered Public Accounting Firm
The following table sets forth fees billed for professional audit services and other services rendered to the Company by Deloitte & Touche LLP and its affiliates for the fiscal years ended December 31, 2019 and 2018.
| Fiscal 2019 | Fiscal 2018 | |||||||
| Audit Fees |
$ | 11,450,000 | $ | 1,270,000 | ||||
| Audit-Related Fees |
— | — | ||||||
| Tax Fees |
— | — | ||||||
| All Other Fees |
— | — | ||||||
| Total |
$ | 11,450,000 | $ | 1,270,000 | ||||
Audit Fees
The aggregate fees billed by Deloitte & Touche LLP and their respective affiliates for professional services rendered for the audit of our annual financial statements for the years ended December 31, 2019 and 2018, for the Sarbanes-Oxley Section 404 audit of our internal control structure, and for the reviews of the financial statements included in our Quarterly Reports on Form 10-Q for those years were $1,290,000 and $1,270,000, respectively. The fiscal 2019 fees include time and expenses related to the 2018 10-K/A restatements.
Audit-Related Fees
Deloitte & Touche LLP rendered no professional services for audit-related services for the years ended December 31, 2019 or 2018.
Tax Fees
Deloitte & Touche LLP rendered no professional services for tax fees for the years ended December 31, 2019 or 2018.
89
Table of Contents
All Other Fees
Deloitte & Touche LLP rendered no professional services for all other fees for the years ended December 31, 2019 and 2018.
Policy on Audit Committee Pre-Approval of Audit and Permissible Non-Audit Services of Independent Auditors
The Audit Committee pre-approves all audit and non-audit services provided by our independent registered public accounting firm prior to the engagement of the independent registered public accounting firm with respect to such services. All “Audit Fees,” “Audit-Related Fees,” “Tax Fees” and “All Other Fees” set forth above were pre-approved by the Audit Committee in accordance with its pre-approval policy.
90
Table of Contents
PART IV
| Item 15. | EXHIBITS AND FINANCIAL STATEMENT SCHEDULES. |
| (a) | (1) Financial Statements: |
See “Index to Consolidated Financial Statements and Financial Statement Schedule” on page 95, the Independent Registered Public Accounting Firm’s Report on page 96 and the Consolidated Financial Statements on pages 98 to 101, all of which are incorporated herein by reference.
(2) Financial Statement Schedule:
The following Financial Statement Schedule is filed as part of this Report:
Schedule II, Valuation and Qualifying Accounts for the years ended December 31, 2019, 2018 and 2017 is included in the Consolidated Financial Statements of RTI Surgical Holdings, Inc. on page 154. All other financial statement schedules are omitted because they are inapplicable, not required or the information is indicated elsewhere in the consolidated financial statements or the notes thereto.
(3) Exhibits:
91
Table of Contents
92
Table of Contents
| † | Certain information in this exhibit identified by brackets has been omitted pursuant to Item 601(b)(10) of Regulation S-K because it (i) is not material and (ii) would cause competitive harm to RTI Surgical Holdings, Inc. if publicly disclosed. RTI Surgical Holdings, Inc. hereby undertakes to furnish, supplementally, copies of any omitted information upon request by the Securities and Exchange Commission. |
93
Table of Contents
Table of Contents
INDEX TO CONSOLIDATED FINANCIAL STATEMENTS
AND FINANCIAL STATEMENT SCHEDULE
| Page | ||||
| Consolidated Financial Statements of RTI Surgical Holdings, Inc. and Subsidiaries | ||||
| 96 | ||||
| 98 | ||||
| Consolidated Statements of Comprehensive (Loss) Income —Years Ended December 31, 2019, 2018 and 2017 |
99 | |||
| Consolidated Statements of Stockholders’ Equity—Years Ended December 31, 2019, 2018 and 2017 |
100 | |||
| Consolidated Statements of Cash Flows—Years Ended December 31, 2019, 2018 and 2017 |
101 | |||
| Notes to Consolidated Financial Statements—Years Ended December 31, 2019, 2018 and 2017 |
102 | |||
| 154 | ||||
95
Table of Contents
REPORT OF INDEPENDENT REGISTERED PUBLIC ACCOUNTING FIRM
To the Board of Directors and Stockholders of
RTI Surgical Holdings, Inc.
Deerfield, Illinois
Opinion on the Financial Statements
We have audited the accompanying condensed consolidated balance sheets of RTI Surgical Holdings, Inc. and subsidiaries (the “Company”) as of December 31, 2019 and 2018, the related condensed consolidated statements of comprehensive (loss) gain, stockholders’ equity, and cash flows, for each of the three years in the period ended December 31, 2019, and the related notes and the schedule listed in the Index at Item 15 (collectively referred to as the “financial statements”). In our opinion, the financial statements present fairly, in all material respects, the financial position of the Company as of December 31, 2019 and 2018, and the results of operations and its cash flows for each of the three years in the period ended December 31, 2019, in conformity with accounting principles generally accepted in the United States of America.
We have also audited, in accordance with the standards of Public Company Accounting Oversight Board (“PCAOB”), the Company’s internal control over financial reporting as of December 31, 2019, based on criteria established in Internal Control — Integrated Framework (2013) issued by the Committee of Sponsoring Organizations of the Treadway Commission and our report dated June 8, 2020, expressed an adverse opinion on the Company’s internal control over financial reporting because of material weaknesses.
Changes in Accounting Principles
As discussed in Note 3 to the financial statements, effective January 1, 2018, the Company adopted Financial Accounting Standards Board Accounting Standards Codification (“ASC”) 606, Revenues from Contracts with Customers, using the modified retrospective method and effective January 1, 2019, the Company adopted ASC 842, Leases, using the optional transition method.
Going Concern
The accompanying consolidated financial statements have been prepared assuming that the Company will continue as a going concern. As discussed in Note 1 to the consolidated financial statements, the Company has suffered recurring losses from operations, recurring negative operating cash flows, and is projecting it will not be able to maintain compliance with its financial covenants. These conditions raise substantial doubt about its ability to continue as a going concern. Management’s plans in regard to these matters are also described in Note 1. The financial statements do not include any adjustments that might result from the outcome of this uncertainty.
Basis for Opinion
These financial statements are the responsibility of the Company’s management. Our responsibility is to express an opinion on the Company’s financial statements based on our audits. We are a public accounting firm registered with the PCAOB and are required to be independent with respect to the Company in accordance with the U.S. federal securities laws and the applicable rules and regulations of the Securities and Exchange Commission and the PCAOB.
We conducted our audits in accordance with the standards of the PCAOB. Those standards require that we plan and perform the audit to obtain reasonable assurance about whether the financial statements are free of material misstatement, whether due to error or fraud. Our audits included performing procedures to assess the risks of material misstatement of the financial statements, whether due to error or fraud, and performing procedures that respond to those risks. Such procedures included examining, on a test basis, evidence regarding the amounts and disclosures in the financial statements. Our audits also included evaluating the accounting principles used and significant estimates made by management, as well as evaluating the overall presentation of the financial statements. We believe that our audits provide a reasonable basis for our opinion.
/s/ DELOITTE & TOUCHE LLP
Tampa, Florida
June 8, 2020
We have served as the Company’s auditor since 1998.
96
Table of Contents
REPORT OF INDEPENDENT REGISTERED PUBLIC ACCOUNTING FIRM
To the Board of Directors and Stockholders of
RTI Surgical Holdings, Inc.
Deerfield, Illinois
Opinion on Internal Control over Financial Reporting
We have audited the internal control over financial reporting of RTI Surgical Holdings, Inc. and subsidiaries (the “Company”) as of December 31, 2019, based on criteria established in Internal Control — Integrated Framework (2013) issued by the Committee of Sponsoring Organizations of the Treadway Commission (COSO). In our opinion, because of the effect of the material weaknesses identified below on the achievement of the objectives of the control criteria, the Company has not maintained effective internal control over financial reporting as of December 31, 2019, based on criteria established in Internal Control — Integrated Framework (2013) issued by COSO.
We have also audited, in accordance with the standards of the Public Company Accounting Oversight Board (“PCAOB”), the consolidated financial statements as of and for the year ended December 31, 2019, of the Company and our report dated June 8, 2020, expressed an unqualified opinion on those financial statements and included explanatory paragraphs regarding the adoption of Financial Accounting Standards Board Accounting Standards Codification (“ASC”) 606, Revenues from Contracts with Customers, utilizing the modified retrospective method, ASC 842, Leases, using the optional transition method, and substantial doubt about the Company’s ability to continue as a going concern.
As described in Management’s Report on Internal Control over Financial Reporting, management excluded from its assessment the internal control over financial reporting at Paradigm Spine, LLC, which was acquired on March 8, 2019, and whose financial statements constitute 4% and 10% of total assets and revenues, respectively. of the consolidated financial statement amounts as of and for the year ended December 31, 2019. Accordingly, our audit did not include the internal control over financial reporting at Paradigm Spine, LLC.
Basis for Opinion
The Company’s management is responsible for maintaining effective internal control over financial reporting and for its assessment of the effectiveness of internal control over financial reporting, included in the accompanying Management’s Report on Effectiveness of Internal Controls. Our responsibility is to express an opinion on the Company’s internal control over financial reporting based on our audit. We are a public accounting firm registered with the PCAOB and are required to be independent with respect to the Company in accordance with the U.S. federal securities laws and the applicable rules and regulations of the Securities and Exchange Commission and the PCAOB.
We conducted our audit in accordance with the standards of the PCAOB. Those standards require that we plan and perform the audit to obtain reasonable assurance about whether effective internal control over financial reporting was maintained in all material respects. Our audit included obtaining an understanding of internal control over financial reporting, assessing the risk that a material weakness exists, testing and evaluating the design and operating effectiveness of internal control based on the assessed risk, and performing such other procedures as we considered necessary in the circumstances. We believe that our audit provides a reasonable basis for our opinion.
Definition and Limitations of Internal Control over Financial Reporting
A company’s internal control over financial reporting is a process designed to provide reasonable assurance regarding the reliability of financial reporting and the preparation of financial statements for external purposes in accordance with generally accepted accounting principles. A company’s internal control over financial reporting includes those policies and procedures that (1) pertain to the maintenance of records that, in reasonable detail, accurately and fairly reflect the transactions and dispositions of the assets of the company; (2) provide reasonable assurance that transactions are recorded as necessary to permit preparation of financial statements in accordance with generally accepted accounting principles, and that receipts and expenditures of the company are being made only in accordance with authorizations of management and directors of the company; and (3) provide reasonable assurance regarding prevention or timely detection of unauthorized acquisition, use, or disposition of the company’s assets that could have a material effect on the financial statements.
Because of its inherent limitations, internal control over financial reporting may not prevent or detect misstatements. Also, projections of any evaluation of effectiveness to future periods are subject to the risk that controls may become inadequate because of changes in conditions, or that the degree of compliance with the policies or procedures may deteriorate.
Material Weaknesses
A material weakness is a deficiency, or a combination of deficiencies, in internal control over financial reporting, such that there is a reasonable possibility that a material misstatement of the company’s annual or interim financial statements will not be prevented or detected on a timely basis. The following material weaknesses have been identified and included in management’s assessment:
| • | The Company did not maintain an effective control environment based on the criteria established in the COSO framework and identified deficiencies in the principles associated with the control environment of the COSO framework. Specifically, control deficiencies constituted material weaknesses, either individually or in the aggregate, relating to: (i) appropriate organizational structure, reporting lines, and authority and responsibilities in pursuit of objectives, (ii) the Company’s commitment to attract, develop, and retain competent individuals, and (iii) holding individuals accountable for their internal control related responsibilities. |
| • | The Company did not design and implement an effective risk assessment based on the criteria established in the COSO framework, and identified deficiencies in the principles associated with the risk assessment component of the COSO framework. Specifically, control deficiencies constituted material weaknesses, either individually or in the aggregate, relating to: (i) identifying, assessing, and communicating appropriate objectives, (ii) identifying and analyzing risks to achieve these objectives, (iii) considering the potential for fraud in assessing risks, and (iv) identifying and assessing changes in the business that could impact the Company’s system of internal controls. |
| • | The Company did not design and implement effective control activities based on the criteria established in the COSO framework, and identified deficiencies in the principles associated with the control activities component of the COSO framework. Specifically, control deficiencies constituted material weaknesses, either individually or in the aggregate, relating to: (i) selecting and developing control activities and information technology that contribute to the mitigation of risks and support achievement of objectives and (ii) deploying control activities through policies that establish what is expected and procedures that put policies into action. |
| • | The Company did not consistently generate or provide adequate quality supporting information and communication based on the criteria established in the COSO framework, and identified deficiencies in the principles associated with the information and communication component of the COSO framework. Specifically, control deficiencies constituted material weaknesses, either individually or in the aggregate, relating to: (i) obtaining, generating, and using relevant quality information to support the function of internal control, and (ii) communicating accurate information internally and externally, including providing information pursuant to objectives, responsibilities, and functions of internal control. |
| • | The Company did not design and implement effective monitoring activities based on the criteria established in the COSO framework, and identified deficiencies in the principles associated with the monitoring component of the COSO framework. Specifically, control deficiencies constituted material weaknesses, either individually or in the aggregate, relating to: (i) selecting, developing, and performing ongoing evaluation to ascertain whether the components of internal controls are present and functioning, and (ii) evaluating and communicating internal control deficiencies in a timely manner to those parties responsible for taking corrective action. |
These material weaknesses were considered in determining the nature, timing, and extent of audit tests applied in our audit of the financial statements of the Company, and this report does not affect our report on such financial statements.
/s/ DELOITTE & TOUCHE LLP
Tampa, Florida
June 8, 2020
97
Table of Contents
RTI SURGICAL HOLDINGS, INC. AND SUBSIDIARIES
(In thousands, except share data)
| December 31, | ||||||||
| 2019 | 2018 | |||||||
| Assets | ||||||||
| Current Assets: |
||||||||
| Cash and cash equivalents |
$ | 5,608 | $ | 10,949 | ||||
| Accounts receivable - less allowances of $5,098 at December 31, 2019 and $2,660 at December 31, 2018 |
59,288 | 48,096 | ||||||
| Inventories - net |
124,149 | 107,655 | ||||||
| Prepaid and other current assets |
6,769 | 8,413 | ||||||
|
|
|
|
|
|||||
| Total current assets |
195,814 | 175,113 | ||||||
| Non-current inventories - net |
6,637 | — | ||||||
| Property, plant and equipment - net |
69,890 | 77,954 | ||||||
| Deferred tax assets - net |
— | 17,760 | ||||||
| Goodwill |
55,384 | 59,798 | ||||||
| Other intangible assets - net |
10,492 | 25,557 | ||||||
| Other assets - net |
6,292 | 4,003 | ||||||
|
|
|
|
|
|||||
| Total assets |
$ | 344,509 | $ | 360,185 | ||||
|
|
|
|
|
|||||
| Liabilities and Stockholders’ Equity | ||||||||
| Current Liabilities: |
||||||||
| Accounts payable |
$ | 30,126 | $ | 26,219 | ||||
| Accrued expenses |
33,337 | 25,865 | ||||||
| Current portion of deferred revenue |
2,748 | 4,908 | ||||||
| Current portion of short and long-term obligations |
174,177 | — | ||||||
|
|
|
|
|
|||||
| Total current liabilities |
240,388 | 56,992 | ||||||
| Long-term obligations - less current portion |
— | 49,073 | ||||||
| Acquisition contingencies |
1,130 | 4,986 | ||||||
| Other long-term liabilities |
2,017 | 633 | ||||||
| Deferred revenue |
— | 744 | ||||||
|
|
|
|
|
|||||
| Total liabilities |
243,535 | 112,428 | ||||||
| Commitments and contingencies (Note 22) |
||||||||
| Preferred stock Series A, $.001 par value: 5,000,000 shares authorized; 50,000 shares issued and outstanding |
66,410 | 66,226 | ||||||
| Stockholders’ equity: |
||||||||
| Common stock, $.001 par value: 150,000,000 shares authorized; 75,213,515 and 63,469,185 shares issued and outstanding, respectively |
75 | 64 | ||||||
| Additional paid-in capital |
498,438 | 433,143 | ||||||
| Accumulated other comprehensive loss |
(7,629 | ) | (7,270 | ) | ||||
| Accumulated deficit |
(451,179 | ) | (239,537 | ) | ||||
| Less treasury stock, 1,285,224 and 1,221,180 shares, respectively, at cost |
(5,141 | ) | (4,869 | ) | ||||
|
|
|
|
|
|||||
| Total stockholders’ equity |
34,564 | 181,531 | ||||||
|
|
|
|
|
|||||
| Total liabilities and stockholders’ equity |
$ | 344,509 | $ | 360,185 | ||||
|
|
|
|
|
|||||
See notes to consolidated financial statements.
98
Table of Contents
RTI SURGICAL HOLDINGS, INC. AND SUBSIDIARIES
Consolidated Statements of Comprehensive (Loss) Income
(In thousands, except share and per share data)
| Year Ended December 31, | ||||||||||||
| 2019 | 2018 | 2017 | ||||||||||
| Revenues |
$ | 308,384 | $ | 280,362 | $ | 280,349 | ||||||
| Costs of processing and distribution |
137,259 | 140,719 | 137,277 | |||||||||
|
|
|
|
|
|
|
|||||||
| Gross profit |
171,125 | 139,643 | 143,072 | |||||||||
|
|
|
|
|
|
|
|||||||
| Expenses: |
||||||||||||
| Marketing, general and administrative |
157,675 | 119,724 | 115,009 | |||||||||
| Research and development |
16,836 | 14,410 | 13,315 | |||||||||
| Severance and restructuring costs |
— | 2,808 | 12,016 | |||||||||
| Gain on acquisition contingency |
(76,033 | ) | — | — | ||||||||
| Executive transition costs |
— | — | 2,818 | |||||||||
| Asset impairment and abandonments |
97,341 | 5,070 | 4,034 | |||||||||
| Goodwill impairment |
140,003 | — | — | |||||||||
| Acquisition and integration expenses |
17,159 | 4,943 | 630 | |||||||||
| Cardiothoracic closure business divestiture contingency consideration |
— | (3,000 | ) | — | ||||||||
| Gain on cardiothoracic closure business divestiture |
(34,090 | ) | ||||||||||
|
|
|
|
|
|
|
|||||||
| Total operating expenses |
352,981 | 143,955 | 113,732 | |||||||||
|
|
|
|
|
|
|
|||||||
| Operating (loss) income |
(181,856 | ) | (4,312 | ) | 29,340 | |||||||
|
|
|
|
|
|
|
|||||||
| Other (expense) income: |
||||||||||||
| Interest expense |
(12,571 | ) | (2,771 | ) | (3,180 | ) | ||||||
| Interest income |
161 | 35 | 8 | |||||||||
| Loss on extinguishment of debt |
— | (309 | ) | — | ||||||||
| Foreign exchange (loss) gain |
(139 | ) | (34 | ) | 87 | |||||||
|
|
|
|
|
|
|
|||||||
| Total other expense - net |
(12,549 | ) | (3,079 | ) | (3,085 | ) | ||||||
|
|
|
|
|
|
|
|||||||
| (Loss) income before income tax (provision) benefit |
(194,405 | ) | (7,391 | ) | 26,255 | |||||||
|
|
|
|
|
|
|
|||||||
| Income tax (provision) benefit |
(17,237 | ) | 4,268 | (19,349 | ) | |||||||
|
|
|
|
|
|
|
|||||||
| Net (loss) income |
(211,642 | ) | (3,123 | ) | 6,906 | |||||||
|
|
|
|
|
|
|
|||||||
| Convertible preferred dividend |
— | (2,120 | ) | (3,723 | ) | |||||||
|
|
|
|
|
|
|
|||||||
| Net (loss) income applicable to common shares |
$ | (211,642 | ) | $ | (5,243 | ) | $ | 3,183 | ||||
|
|
|
|
|
|
|
|||||||
| Other comprehensive (loss) income: |
||||||||||||
| Unrealized foreign currency translation loss |
(351 | ) | (941 | ) | 1,987 | |||||||
|
|
|
|
|
|
|
|||||||
| Comprehensive (loss) income |
$ | (211,993 | ) | $ | (6,184 | ) | $ | 5,170 | ||||
|
|
|
|
|
|
|
|||||||
| Net (loss) income per common share - basic |
$ | (2.91 | ) | $ | (0.08 | ) | $ | 0.05 | ||||
|
|
|
|
|
|
|
|||||||
| Net (loss) income per common share - diluted |
$ | (2.91 | ) | $ | (0.08 | ) | $ | 0.05 | ||||
|
|
|
|
|
|
|
|||||||
| Weighted average shares outstanding - basic |
72,824,308 | 63,521,703 | 59,684,289 | |||||||||
|
|
|
|
|
|
|
|||||||
| Weighted average shares outstanding - diluted |
72,824,308 | 63,521,703 | 60,599,952 | |||||||||
|
|
|
|
|
|
|
|||||||
See notes to consolidated financial statements.
99
Table of Contents
RTI SURGICAL HOLDINGS, INC. AND SUBSIDIARIES
Consolidated Statements of Stockholders’ Equity
(In thousands)
| Common Stock | Additional Paid- In Capital |
Accumulated Other Comprehensive Loss |
Accumulated Deficit |
Treasury Stock | Total | |||||||||||||||||||
| Balance, January 1, 2017 |
$ | 58 | $ | 417,428 | $ | (8,316 | ) | $ | (244,192 | ) | $ | (916 | ) | $ | 164,062 | |||||||||
| Net income |
— | — | — | 6,906 | — | 6,906 | ||||||||||||||||||
| Foreign currency translation adjustment |
— | — | 1,987 | — | — | 1,987 | ||||||||||||||||||
| Exercise of common stock options |
5 | 9,176 | — | — | — | 9,181 | ||||||||||||||||||
| Stock-based compensation |
— | 6,762 | — | — | — | 6,762 | ||||||||||||||||||
| Purchase of treasury stock |
— | — | — | — | (3,474 | ) | (3,474 | ) | ||||||||||||||||
| Amortization of preferred stock |
||||||||||||||||||||||||
| Series A issuance costs |
— | (184 | ) | — | — | — | (184 | ) | ||||||||||||||||
| Preferred stock Series A dividend |
— | (3,723 | ) | — | — | — | (3,723 | ) | ||||||||||||||||
|
|
|
|
|
|
|
|
|
|
|
|
|
|||||||||||||
| Balance, December 31, 2017 |
$ | 63 | $ | 429,459 | $ | (6,329 | ) | $ | (237,286 | ) | $ | (4,390 | ) | $ | 181,517 | |||||||||
| Accumulated effect of adoption of the revenue recognition standard |
— | — | — | 872 | — | 872 | ||||||||||||||||||
| Net (loss) |
— | — | — | (3,123 | ) | — | (3,123 | ) | ||||||||||||||||
| Foreign currency translation adjustment |
— | — | (941 | ) | — | — | (941 | ) | ||||||||||||||||
| Exercise of common stock options |
1 | 1,242 | — | — | — | 1,243 | ||||||||||||||||||
| Stock-based compensation |
— | 4,745 | — | — | — | 4,745 | ||||||||||||||||||
| Purchase of treasury stock |
— | — | — | — | (479 | ) | (479 | ) | ||||||||||||||||
| Amortization of preferred stock |
||||||||||||||||||||||||
| Series A issuance costs |
— | (183 | ) | — | — | — | (183 | ) | ||||||||||||||||
| Preferred stock Series A dividend |
— | (2,120 | ) | — | — | — | (2,120 | ) | ||||||||||||||||
|
|
|
|
|
|
|
|
|
|
|
|
|
|||||||||||||
| Balance, December 31, 2018 |
$ | 64 | $ | 433,143 | $ | (7,270 | ) | $ | (239,537 | ) | $ | (4,869 | ) | $ | 181,531 | |||||||||
| Net (loss) |
— | — | — | (211,642 | ) | — | (211,642 | ) | ||||||||||||||||
| Foreign currency translation adjustment |
— | — | (359 | ) | — | — | (359 | ) | ||||||||||||||||
| Exercise of common stock options |
— | 395 | — | — | — | 395 | ||||||||||||||||||
| Equity instruments issued in connection with Paradigm Spine acquisition - net of fees |
11 | 60,719 | — | — | — | 60,730 | ||||||||||||||||||
| Stock-based compensation |
— | 4,367 | — | — | — | 4,367 | ||||||||||||||||||
| Purchase of treasury stock |
— | — | — | — | (272 | ) | (272 | ) | ||||||||||||||||
| Amortization of preferred stock |
||||||||||||||||||||||||
| Series A issuance costs |
— | (186 | ) | — | — | — | (186 | ) | ||||||||||||||||
| Preferred stock Series A dividend |
— | — | — | — | — | — | ||||||||||||||||||
|
|
|
|
|
|
|
|
|
|
|
|
|
|||||||||||||
| Balance, December 31, 2019 |
$ | 75 | $ | 498,438 | $ | (7,629 | ) | $ | (451,179 | ) | $ | (5,141 | ) | $ | 34,564 | |||||||||
|
|
|
|
|
|
|
|
|
|
|
|
|
|||||||||||||
See notes to consolidated financial statements.
100
Table of Contents
RTI SURGICAL HOLDINGS, INC. AND SUBSIDIARIES
Consolidated Statements of Cash Flows
(In thousands)
| Year Ended December 31, | ||||||||||||
| 2019 | 2018 | 2017 | ||||||||||
| Cash flows from operating activities: |
||||||||||||
| Net income (loss) |
$ | (211,642 | ) | $ | (3,123 | ) | $ | 6,906 | ||||
| Adjustments to reconcile net income (loss) to net cash provided by operating activities: |
||||||||||||
| Depreciation and amortization expense |
22,675 | 14,579 | 14,233 | |||||||||
| Provision for bad debts and product returns |
2,937 | 1,721 | 946 | |||||||||
| Provision for inventory write-downs |
8,493 | 15,122 | 5,066 | |||||||||
| Amortization of deferred revenue |
(4,906 | ) | (4,958 | ) | (4,744 | ) | ||||||
| Deferred income tax provision |
17,066 | (4,692 | ) | 13,573 | ||||||||
| Stock-based compensation |
4,367 | 4,745 | 6,660 | |||||||||
| Asset impairment and abandonments |
97,341 | 5,070 | 4,034 | |||||||||
| Cardiothoracic closure business divestiture contingency consideration |
— | (3,000 | ) | (34,090 | ) | |||||||
| Goodwill impairment |
140,003 | — | — | |||||||||
| Gain on acquisition contingency |
(76,033 | ) | — | — | ||||||||
| Paid in kind interest expense |
4,408 | — | — | |||||||||
| Other |
1,673 | 1,330 | 2,392 | |||||||||
| Change in assets and liabilities: |
||||||||||||
| Accounts receivable |
(9,013 | ) | (10,829 | ) | 5,116 | |||||||
| Inventories |
(14,219 | ) | (11,957 | ) | 1,610 | |||||||
| Accounts payable |
(974 | ) | 8,035 | (12,936 | ) | |||||||
| Accrued expenses |
4,489 | (827 | ) | 5,667 | ||||||||
| Deferred revenue |
2,000 | 2,000 | 2,000 | |||||||||
| Other operating assets and liabilities |
1,879 | 4,036 | (10,645 | ) | ||||||||
|
|
|
|
|
|
|
|||||||
| Net cash provided by operating activities |
(9,456 | ) | 17,252 | 5,788 | ||||||||
|
|
|
|
|
|
|
|||||||
| Cash flows from investing activities: |
||||||||||||
| Purchases of property, plant and equipment |
(14,426 | ) | (11,042 | ) | (12,301 | ) | ||||||
| Patent and acquired intangible asset costs |
(2,007 | ) | (3,695 | ) | (2,266 | ) | ||||||
| Proceeds from sale of building |
— | — | 1,818 | |||||||||
| Acquisition of Zyga Technology |
— | (21,000 | ) | — | ||||||||
| Acquisition of Paradigm Spine |
(99,692 | ) | — | — | ||||||||
| Cardiothoracic closure business divestiture |
— | 3,000 | 51,000 | |||||||||
|
|
|
|
|
|
|
|||||||
| Net cash (used in) provided by investing activities |
(116,125 | ) | (32,737 | ) | 38,251 | |||||||
|
|
|
|
|
|
|
|||||||
| Cash flows from financing activities: |
||||||||||||
| Proceeds from exercise of common stock options |
395 | 2,356 | 5,060 | |||||||||
| Proceeds from long-term obligations |
121,500 | 74,425 | 6,000 | |||||||||
| Payments of debt issuance costs |
(826 | ) | — | — | ||||||||
| Payments on long-term obligations |
(500 | ) | (71,171 | ) | (43,000 | ) | ||||||
| Payments for treasury stock |
(273 | ) | (478 | ) | (3,474 | ) | ||||||
| Other financing activities |
— | (1,039 | ) | (317 | ) | |||||||
|
|
|
|
|
|
|
|||||||
| Net cash provided by (used in) financing activities |
120,296 | 4,093 | (35,731 | ) | ||||||||
|
|
|
|
|
|
|
|||||||
| Effect of exchange rate changes on cash and cash equivalents |
(56 | ) | (40 | ) | 224 | |||||||
|
|
|
|
|
|
|
|||||||
| Net increase (decrease) in cash and cash equivalents |
(5,341 | ) | (11,432 | ) | 8,532 | |||||||
| Cash and cash equivalents, beginning of period |
10,949 | 22,381 | 13,849 | |||||||||
|
|
|
|
|
|
|
|||||||
| Cash and cash equivalents, end of period |
$ | 5,608 | $ | 10,949 | $ | 22,381 | ||||||
|
|
|
|
|
|
|
|||||||
| Supplemental cash flow disclosure: |
||||||||||||
| Cash paid for interest |
$ | 7,121 | $ | 3,047 | $ | 3,023 | ||||||
| Cash paid for income taxes, net of refunds |
(1,994 | ) | (6,403 | ) | 12,142 | |||||||
| Non-cash acquisition of property, plant and equipment |
1,468 | 1,217 | 593 | |||||||||
| Receivable for executive stock option exercise |
— | — | 1,234 | |||||||||
| Stock-based compensation related to sale of CT business |
— | — | 102 | |||||||||
| Increase in accrual for dividend payable |
— | 2,120 | 3,723 | |||||||||
See notes to consolidated financial statements.
101
Table of Contents
RTI SURGICAL HOLDINGS, INC. AND SUBSIDIARIES
Notes to Consolidated Financial Statements
Years Ended December 31, 2019, 2018 and 2017
(In thousands, except share and per share data)
1. Business
RTI Surgical Holdings, Inc. (the “Company”), and its subsidiaries recover and process human and animal tissue and manufacture metal and synthetic implants and instruments. The processing transforms the tissue into either conventional or precision machined allograft implants (human) or xenograft implants (animal), while our manufacturing facilities produce metal and synthetic implants. The implants are used for orthopedic and other surgical applications to promote the natural healing of human bone and other human tissue. These implants are distributed domestically and internationally, for use in reconstruction and fracture repair.
Going Concern
The accompanying consolidated financial statements of the Company have been prepared assuming the Company will continue as a going concern and in accordance with generally accepted accounting principles in the United States of America. The going concern basis of presentation assumes that we will continue in operation one year after the date these financial statements are issued, and we will be able to realize our assets and discharge our liabilities and commitments in the normal course of business. As of December 31, 2019, we had cash of $5,608, a working capital deficiency of $44,574 and an accumulated deficit of $451,179. We had a loss from operations of $181,856 and a net loss of $211,642 for the year ended December 31, 2019. We have suffered losses from operations in the previous two fiscal years and did not generate positive cash flows from operations in fiscal year 2019.
The Company is currently projecting that it will not be able to maintain compliance with its financial covenants (fixed charge coverage ratio and leverage ratio) for the quarter ended June 30, 2020, as well as in future periods, in relation to both the JPM Facility and Ares Term Loan agreements. This would constitute an event of default for which the Company’s lenders could demand repayment of these obligations at any time.
Should the sale of the OEM Business, as discussed in Note 29, Subsequent Events, not be consummated, the Company will continue to attempt to raise additional debt and/or equity financing to fund future operations and to provide additional working capital. However, there is no assurance that such financing will be consummated or obtained in sufficient amounts necessary to meet the Company’s needs. The Company’s ability to raise additional capital may be adversely impacted by potential worsening global economic conditions and the recent disruptions to, and volatility in, financial markets in the United States and worldwide resulting from the ongoing COVID-19 pandemic. If cash resources are insufficient to satisfy the Company’s on-going cash requirements, the Company will be required to scale back or discontinue its operations entirely. No assurance can be given that any future financing will be available or, if available, that it will be on terms that are satisfactory to the Company. Even if the Company is able to obtain additional financing, it may contain undue restrictions on our operations, in the case of debt financing, or cause substantial dilution for our stockholders, in the case of equity financing.
In view of the matters described above, management has concluded that substantial doubt exists with respect to the Company’s ability to continue as a going concern within one year after the date the financial statements are issued. The recoverability of a major portion of the recorded asset amounts shown in the Company’s accompanying consolidated balance sheets is dependent upon continued operations of the Company, which in turn is dependent upon the Company’s ability to meet its funding requirements on a continuous basis, to maintain existing financing and to succeed in its future operations. The Company’s financial statements do not include any adjustment relating to the recoverability and classification of recorded asset amounts and classification of liabilities that might be necessary should the Company be unable to continue in existence.
2. Summary of Significant Accounting Policies
Principles of Consolidation—The consolidated financial statements include the accounts of the Company and its wholly owned subsidiaries, RTI Surgical, Inc. (referred to as “Legacy RTI” for matters occurring after March 8, 2019, and as the “Company” for matters occurring before March 8, 2019), Paradigm Spine, LLC (“Paradigm”), Pioneer Surgical Technology, Inc. (“Pioneer Surgical”), Tutogen Medical, Inc. (“TMI”), and Zyga Technology, Inc. (“Zyga”). The consolidated financial statements also include the accounts of RTI Donor Services, Inc. (“RTIDS”), which is a controlled entity. Prior to the completion of the acquisition of Paradigm, the financial statements were that of RTI Surgical, Inc. and subsidiaries. Subsequently, RTI Surgical Holdings, Inc. and Subsidiaries is the successor reporting company. The consolidated financial statements have been prepared in accordance with accounting principles generally accepted in the United States of America (“U.S. GAAP”). All intercompany balances and transactions have been eliminated in consolidation.
RTIDS is a taxable not-for-profit entity organized and controlled by the Company. RTIDS is the corporate entity that is responsible for procuring tissue for the Company. Expenses incurred by RTIDS to procure tissue are passed on through to the Company. RTIDS has no significant assets or liabilities except for its intercompany accounts receivable and accounts payable to tissue recovery agencies. The Company pays all expenses of RTIDS.
102
Table of Contents
Use of Estimates—The preparation of consolidated financial statements in conformity with U.S. GAAP requires management to make estimates and assumptions that affect the reported amounts of assets and liabilities and disclosures of contingent assets and liabilities at the date of the financial statements and the reported amounts of revenues and expenses during the reporting period. Estimates and assumptions relating to inventories, receivables, long-lived assets and litigation are made at the end of each financial reporting period by management. Actual results could differ from those estimates.
Foreign Currency Translation—The functional currency of the Company’s foreign subsidiaries is the Euro. Assets and liabilities of the foreign subsidiaries are translated at the period end exchange rate while revenues and expenses are translated at the average exchange rate for the period. The resulting translation adjustments, representing unrealized, noncash gains and losses are recorded and presented as a component of comprehensive (loss) income. Gains and losses resulting from transactions of the Company and its subsidiaries, which are made in currencies different from their own, are included in income or loss as they occur and are included in other expense in the consolidated statements of comprehensive (loss) income.
Fair Value of Financial Instruments—The estimated fair value of financial instruments disclosed in the consolidated financial statements has been determined by using available market information and appropriate valuation methodologies. The carrying value of all current assets and current liabilities approximates fair value because of their short-term nature. The carrying value of the long-term debt obligations approximates fair value.
Cash and Cash Equivalents— The Company considers all funds in banks and short-term highly liquid investments with an original maturity of three months or less to be cash and cash equivalents. Cash equivalents comprise overnight repurchase agreements. Cash balances are held at a few financial institutions and usually exceed insurable amounts. The Company mitigates this risk by depositing its uninsured cash in major well capitalized financial institutions. At December 31, 2019 and 2018, the Company had no cash equivalents.
Accounts Receivable Allowances— The Company maintains allowances for doubtful accounts based on the Company’s review and assessment of payment history and its estimate of the ability of each customer to make payments on amounts invoiced. If the financial condition of any of its customers were to deteriorate, additional allowances might be required. From time to time the Company must adjust its estimates. Changes in estimates of the collection risk related to accounts receivable can result in decreases and increases to current period net income.
Inventories—Inventories are stated at the lower of cost or market, with cost determined using the first-in, first-out method. Inventory write-downs for unprocessed donor tissue are recorded based on the estimated amount of inventory that will not pass the quality control process based on historical data, and the amount of inventory that is not readily distributable or is unusable. In addition, provisions for inventory write-downs are estimated for tissue in process inventory that is not readily distributable or is unusable. Any implantable donor tissue deemed to be obsolete is included in the write-down at the time the determination is made. Non-tissue inventory is evaluated for obsolescence and excess quantities by analyzing inventory levels, historical loss trends, expected product lives, product at risk of expiration, sales levels by product and projections of future sales demand.
Property, Plant and Equipment—Property, plant and equipment are stated at cost less accumulated depreciation. The cost of leasehold improvements is amortized on the straight-line method over the shorter of the lease term or the estimated useful life of the asset. Software costs are also included and relate to purchased software that are capitalized. Surgical instruments which are included in property, plant and equipment are handheld devices used by surgeons during implant procedures. The Company retains title to the surgical instruments. Depreciation for surgical instruments is included in selling and marketing expenses in the accompanying Consolidated Statements of Comprehensive (loss) income.
Depreciation is computed on the straight-line method over the following estimated useful lives of the assets:
| Buildings |
25 to 40 years | |||
| Building improvements and leasehold improvements |
8 to 40 years | |||
| Processing equipment |
7 to 10 years | |||
| Office equipment, furniture and fixtures |
5 to 7 years | |||
| Computer hardware and software |
3 to 7 years | |||
| Surgical instruments |
3 to 5 years |
Debt Issuance Costs—Debt issuance costs include costs incurred to obtain financing and are amortized using the straight-line method, which approximates the effective interest method, over the life of the related debt. Debt issuance costs related to a recognized debt liability are presented in the balance sheet as a direct deduction from the carrying amount of that debt liability.
103
Table of Contents
Long-Lived Assets—The Company reviews its property, plant and equipment for impairment whenever events or changes in circumstances indicate the carrying value of an asset may not be recoverable. Recoverability is measured by a comparison of the carrying amount to the net undiscounted cash flows expected to be generated by the asset. An impairment loss would be recorded for the excess of net carrying value over the fair value of the asset impaired. The fair value is estimated based on expected discounted future cash flows. The results of impairment tests are subject to management’s estimates and assumptions of projected cash flows and operating results. Changes in assumptions or market conditions could result in a change in estimated future cash flows and the likelihood of materially different reported results.
Goodwill—Financial Accounting Standards Board (“FASB”) Accounting Standards Codification (“ASC”) 350, Goodwill and Other Intangible Assets (“FASB ASC 350”) requires companies to test goodwill for impairment on an annual basis at the reporting unit level (or an interim basis if an event occurs that might reduce the fair value of a reporting unit below its carrying value). The annual impairment test is performed at each year-end unless indicators of impairment are present and require more frequent testing. In December 2019, we changed our reporting structure, as we adopted new segment reporting, which we concluded resulted in two reporting units, Global Spine (“Spine”) and Global OEM (“OEM”). Refer to Note 5 for further discussion regarding segment changes in 2019. With the change in reporting units we performed the annual impairment test prior to the change, on our previous one reporting unit, and then performed the annual impairment test after the change on the two reporting units.
Goodwill is tested for impairment by comparing the fair value of the reporting unit to its carrying amount, including goodwill. Prior to 2019, in concluding as to fair value of the reporting unit for purposes of testing goodwill, an income approach and a market approach were utilized. The conclusion from these two approaches were weighted equally and then adjusted to incorporate a control premium or acquisition premium that reflects the additional amount a buyer is willing to pay for elements of control and for a premium that reflects the buyer’s perception of its ability to add value through synergies. In 2019, since the cash flows were negative over the forecast period for the Spine reporting unit, a cost approach was used to determine the fair value of the Spine reporting unit. For the OEM reporting unit, we weighted the income approach 75% and the market approach 25%. We have chosen the weightings because the income approach more fully captures the company specific factors that would not be directly captured in the market approach, as there are no pure publicly traded comparable companies.
The income approach employs a discounted cash flow model that considers: 1) assumptions that marketplace participants would use in their estimates of fair value, including the cash flow period, terminal values based on a terminal growth rate and the discount rate; 2) current period actual results; and 3) projected results for future periods that have been prepared and approved by senior management of the Company.
The market approach employs market multiples from guideline public companies operating in our industry. Estimates of fair value are derived by applying multiples based on revenue and earnings before interest, taxes, depreciation and amortization (“EBITDA”) adjusted for size and performance metrics relative to peer companies.
The cost approach considers the replacement cost adjusted for certain factors. Certain balance sheet items were adjusted to fair value before being utilized in estimating the value of the reporting unit under the cost approach, including inventory, property, plant and equipment, right of use assets, and other intangible assets.
All three approaches used in the analysis have a degree of uncertainty. Potential events or changes in circumstances which could impact the key assumptions used in our goodwill impairment evaluation are as follows:
| • | Change in peer group or performance of peer group companies |
| • | Change in the Company’s markets and estimates of future operating performance |
| • | Change in the Company’s estimated market cost of capital |
| • | Change in implied control premiums related to acquisitions in the medical device industry |
104
Table of Contents
Other Intangible Assets — Intangible assets generally consist of finite-lived intangible assets, including patents, tradenames, procurement contracts, customer lists, distribution agreements and acquired exclusivity rights. Patents are amortized on the straight-line method over the shorter of the remaining protection period or estimated useful lives of between 8 and 16 years. Tradenames, procurement contracts, customer lists, acquired exclusivity rights and distribution agreements are amortized over estimated useful lives of between 5 to 25 years.
As of December 31, 2019, the Company concluded, through the ASC 360 valuation testing, that factors existed indicating that finite-lived intangible assets in the Spine asset group were impaired. The factors included a change made to the internal organization of the Company in the fourth quarter of 2019. The organizational change resulted in the creation of a new Spine asset group. Prior to the fourth quarter of 2019, the Spine asset group did not exist as the related assets were included in another asset group as it had interdependencies among the utilization of the assets within the group, and therefore, there were no discrete cash flows. The asset group representing the Spine asset group could not support the carrying amount of the finite-lived intangible assets, because the Spine asset group no longer has the benefit of shared resources and cashflows generated by the former asset group that it was previously included in. Thus, we tested the $85,096 carrying amount of intangible assets in the Spine asset group for impairment on December 31, 2019. As a result, for the year ended December 31, 2019, we recorded an impairment charge for all of the finite-lived intangible assets within Spine asset group, totaling $85,096.
Revenue Recognition—The Company recognizes revenue upon shipment, or receipt by the Company’s customers of its products and implants, depending on the Company’s distribution agreements with its customers. The Company’s performance obligations consist mainly of transferring control of products and implants identified in the contracts. The Company typically transfers control at a point in time upon shipment or delivery of the implants for direct sales, or upon implantation for sales of consigned inventory. The customer is able to direct the use of, and obtain substantially all of the benefits from, the implant at the time the implant is shipped, delivered, or implanted, respectively based on the terms of the contract. For performance obligations related to the Company’s contracts with exclusively built inventory clauses, the Company typically satisfies its performance obligations evenly over the contract term as inventory is built. Such exclusively built inventory has no alternative use and the Company has an enforceable right to payment for performance to date. The Company uses the input method to measure the manufacturing activities completed to date, which depicts the progress of the Company’s performance obligation of transferring control of exclusively built inventory. For the contracts with upfront and annual exclusivity fees, revenue related to those fees is recognized over the contract term following a consistent method of measuring progress towards satisfaction of the performance obligation. The Company uses the method and measure of progress that best depicts the transfer of control to the customer of the goods or services to date relative to the remaining goods or services promised under the contract.
The Company permits returns of implants in accordance with the terms of contractual agreements with customers if the implant is returned in a timely manner, in unopened packaging, and from the normal channels of distribution. Allowances for returns are provided based upon analysis of the Company’s historical patterns of returns matched against the revenues from which they originated.
The Company records estimated implant returns, discounts, rebates and other distribution incentives as a reduction of revenue in the same period revenue is recognized. Estimates of implant returns are recorded for anticipated implant returns based on historical distributions and returns information. Estimates of discounts, rebates and other distribution incentives are recorded based on contractual terms, historical experience and trend analysis.
Other revenues consist of service processing, tissue recovery fees, biomedical laboratory fees, recognition of previously deferred revenues, shipping fees, distribution of reproductions of our allografts to distributors for demonstration purposes and restocking fees which is included in revenues.
Stock-Based Compensation Plans—The Company accounts for its stock-based compensation plans in accordance with FASB ASC 718, Accounting for Stock Compensation (“FASB ASC 718”). FASB ASC 718 requires the measurement and recognition of compensation expense for all stock-based awards made to employees and directors, including employee stock options and restricted stock. Under the provisions of FASB ASC 718, stock-based compensation cost is measured at the grant date, based on the calculated fair value of the award, and is recognized as an expense on a straight-line basis over the requisite service period of the entire award (generally the vesting period of the award). The Company uses the Black-Scholes model to value its stock option grants under FASB ASC 718 and expenses the related compensation cost using the straight-line method over the vesting period. The fair value of stock options is determined on the grant date using assumptions for the expected term, expected volatility, dividend yield, and the risk free interest rate. The term assumption is primarily based on the contractual vesting term of the option and historic data related to exercise and post-vesting cancellation history experienced by the Company. The Company uses the simplified method for estimating the expected term used to determine the fair value of options under FASB ASC 718. The expected term is determined separately for options issued to the Company’s directors and to employees. The Company’s anticipated volatility level is primarily based on the historic volatility of the Company’s common stock. The Company’s model includes a zero dividend yield assumption, as the Company has not historically paid nor does it anticipate paying dividends on its common stock. The risk free interest rate approximates recent U.S. Treasury note auction results with a similar life to that of the option. The Company’s model does not include a discount for post-vesting restrictions, as the Company has not issued awards with such restrictions. The period expense is then determined based on the valuation of the options, and at that time an estimated forfeiture rate is used to reduce the expense recorded. The Company’s estimate of pre-vesting forfeitures is primarily based on the recent historical experience of the Company, and is adjusted to reflect actual forfeitures as the options vest. The Company uses a Monte Carlo simulation model to estimate the fair value of restricted stock awards that contain a market condition.
105
Table of Contents
Research and Development Costs—Research and development costs, including the cost of research and development conducted for others and the cost of contracted research and development, are expensed as incurred.
Income Taxes—The Company uses the asset and liability method of accounting for income taxes. Deferred income taxes are recorded to reflect the tax consequences on future years for differences between the tax basis of assets and liabilities and their financial reporting amounts at each year-end based on enacted tax laws and statutory tax rates applicable to the periods in which the differences are expected to affect taxable income. Valuation allowances are established when necessary to reduce deferred tax assets to amounts which are more likely than not to be realized.
Treasury Stock — The Company may periodically repurchase shares of its common stock from employees for the satisfaction of their individual payroll tax withholding upon vesting of restricted stock awards in connection with the Company’s incentive plans. The Company’s repurchases of common stock are recorded at the stock price on the vesting date of the common stock. The Company repurchased 64,044, 107,109, and 745,122 shares of its common stock for $272, $479, and $3,474 for the years ended December 31, 2019, 2018, and 2017, respectively.
Earnings Per Share—Basic earnings per share (“EPS”) is computed by dividing earnings attributable to common stockholders by the weighted-average number of common shares outstanding for the periods. Diluted EPS reflects the potential dilution of securities that could share in the earnings. A reconciliation of the number of common shares used in the calculation of basic and diluted EPS is presented below:
| For the Year Ended December 31, | ||||||||||||
| 2019 | 2018 | 2017 | ||||||||||
| Weighted average basic shares |
72,824,308 | 63,521,703 | 59,684,289 | |||||||||
| Effect of dilutive securities: |
||||||||||||
| Stock options |
— | — | 915,663 | |||||||||
|
|
|
|
|
|
|
|||||||
| Weighted average diluted shares |
72,824,308 | 63,521,703 | 60,599,952 | |||||||||
|
|
|
|
|
|
|
|||||||
Options to purchase 4,536,461 shares of common stock at prices ranging from $2.09 to $5.23 per share which were outstanding as of December 31, 2019, were not included in the computation of diluted EPS because dilutive shares are not factored into the calculation of EPS when a loss applicable to common shares is reported as they would be anti-dilutive.
Options to purchase 4,275,744 shares of common stock at prices ranging from $2.69 to $5.23 per share which were outstanding as of December 31, 2018, were not included in the computation of diluted EPS because dilutive shares are not factored into the calculation of EPS when a loss applicable to common shares is reported as they would be anti-dilutive.
Options to purchase 4,662,037 shares of common stock at prices ranging from $2.69 to $8.20 per share which were outstanding as of December 31, 2017, were included in the computation of diluted EPS because dilutive shares are factored into the calculation of EPS when income applicable to common shares is reported.
For the years ended December 31, 2019, and 2018, 50,000 shares of convertible preferred stock or 15,152,761 of converted common stock and accrued but unpaid dividends were anti-dilutive on an as if-converted basis and were not included in the computation of diluted net (loss) income per common share.
3. Recently Issued and Adopted Accounting Standards.
Financial Instruments — In May 2019, the FASB issued Accounting Standards Codification (“ASU”) No. 2019-05 Financial Instruments — Credit Losses (Topic 326) which provides relief to certain entities adopting ASU 2016-13 (discussed below). The amendments accomplish those objectives by providing entities with an option to irrevocably elect the fair value option in Subtopic 825-10, applied on an instrument-by-instrument basis for eligible instruments, that are within the scope of Subtopic 326-20, upon adoption of Topic 326. The fair value option election does not apply to held-to-maturity debt securities. ASU 2019-05 has the same transition as ASU 2016-13 and is effective for periods beginning after December 15, 2019, with adoption permitted after this update. The Company does not expect the impact of adoption to have an impact on the consolidated financial statements.
106
Table of Contents
In April 2019, the FASB issued ASU No. 2019-04 Codification Improvements to Topic 326, Financial Instruments — Credit Losses, Topic 815, Derivatives and Hedging, and Topic 825, Financial Instruments, which provides updates and clarifications to three previously-issued ASUs: 2016-01 Financial Instruments — Overall (Subtopic 825-10): Recognition and Measurement of Financial Assets and Financial Liabilities; 2016-13 Financial Instruments — Credit Losses (Topic 326): Measurement of Credit Losses on Financial Instruments, described further above and which the Company has not yet adopted; and 2017-12 Derivatives and Hedging (Topic 815): Targeted Improvements to Accounting for Hedging Activities, which the Company early adopted effective January 1, 2018. The updates related to ASU 2016-13 have the same transition as ASU 2016-13 and are effective for periods beginning after December 15, 2019, with adoption permitted after the issuance of ASU 2019-04. The updates related to ASU 2017-12 are effective for the Company on January 1, 2020. The updates related to ASU 2016-01 are effective for fiscal years beginning after December 15, 2019. The Company does not expect the impact of adoption to have an impact on the consolidated financial statements.
In June 2016, the FASB issued ASU No. 2016-13, Financial Instruments — Credit Losses. ASU 2016-13 introduces a new model for estimating credit losses for certain types of financial instruments, including loans receivable, held-to-maturity debt securities, and net investments in direct financing leases, amongst other financial instruments. ASU 2016-13 also modifies the impairment model for available-for-sale debt securities and expands the disclosure requirements regarding an entity’s assumptions, models, and methods for estimating the allowance for losses. ASU 2016-13 is effective for periods beginning after December 15, 2019. Retrospective adjustments shall be applied through a cumulative-effect adjustment to retained earnings. The Company does not expect the adoption to have a material impact on the consolidated financial statements.
Fair Value Measurement — In August 2018, the FASB issued ASU 2018-13, “Fair Value Measurement (Topic 820): Disclosure Framework — Changes to the Disclosure Requirements for Fair Value Measurement.” This ASU modifies the disclosure requirements on fair value measurements by removing, modifying, or adding certain disclosures. ASU 2018-13 is effective for the Company beginning after December 31, 2019. Certain disclosures in ASU 2018-13 are required to be applied on a retrospective basis and others on a prospective basis. The Company does not expect the impact of adoption to have an impact on the consolidated financial statements.
107
Table of Contents
Leases — In February 2016, the FASB issued ASU 2016-02, Leases (Topic 842), which supersedes existing guidance on accounting for leases in “Leases (Topic 840).” ASU 2016-02 establishes a right-of-use (“ROU”) model that requires operating leases be recorded on the balance sheet through recognition of a liability for the discounted present value of future lease payments and a corresponding ROU asset. The ROU asset recorded at commencement of the lease represents the right to use the underlying asset over the lease term in exchange for the lease payments. The Company has adopted a policy for which leases with an initial term of 12 months or less and do not have an option to purchase the underlying asset that is deemed reasonably certain to exercise are not recorded on the balance sheet; rather, rent expense for these leases is recognized on a straight-line basis over the lease term. Leases are classified as finance or operating, with classification affecting the pattern and classification of expense recognition in the income statement.
Effective January 1, 2019, the Company adopted Topic 842 using the optional transition method which allowed us to continue to apply Topic 840 in the comparative periods presented. In addition, the Company elected the package of practical expedients, which allowed us to not reassess whether any existing contracts contain a lease, to not reassess historical lease classification as operating or finance leases, and to not reassess initial direct costs. The Company has not elected the practical expedient to use hindsight to determine the lease term for its leases at transition. The Company has also elected the practical expedient allowing us to not separate the lease and non-lease components for all classes of underlying assets. Adoption of Topic 842 resulted in the recording of operating lease ROU assets and corresponding operating lease liabilities of $3,164 and $3,155, respectively, as of January 1, 2019 with no impact on accumulated deficit. Financial position for reporting periods beginning on or after January 1, 2019, are presented under Topic 842, while prior period amounts are not adjusted and continue to be reported in accordance with Topic 840.
108
Table of Contents
Revenue from Contracts with Customers — On January 1, 2018, the Company adopted a new accounting standard issued by the FASB on revenue recognition using the modified retrospective method. This new accounting standard outlines a single comprehensive model to use in accounting for revenue arising from contracts with customers. This standard supersedes existing revenue recognition requirements and eliminates most industry-specific guidance from GAAP. The core principle of the new accounting standard is to recognize revenue to depict the transfer of promised goods or services to customers in an amount that reflects the consideration to which the entity expects to be entitled in exchange for those goods or services. In addition, the adoption of this new accounting standard resulted in increased disclosure, including qualitative and quantitative disclosures about the nature, amount, timing and uncertainty of revenue and cash flows arising from contracts with customers. The new accounting standard was applied to all contracts, apart from contracts for which all or substantially all revenue was recognized before January 1, 2018. Additionally, the Company elected to account for shipping and handling activities as a fulfillment cost rather than a separate performance obligation.
4. Leases
The Company’s leases are classified as operating leases and includes office space, automobiles, and copiers. The Company does not have any finance leases, and the Company’s operating leases do not have any residual value guarantees, restrictions or covenants. The Company does not have any leases that have not yet commenced as of December 31, 2019. The majority of our leases have remaining lease terms of 1 to 14 years, some of which include options to extend or terminate the leases. The option to extend or terminate is only included in the lease term if the Company is reasonably certain of exercising that option. Operating lease ROU assets are presented within other assets-net on the consolidated balance sheet. The current portion of operating lease liabilities are presented within accrued expenses, and the non-current portion of operating lease liabilities are presented within other long-term liabilities on the consolidated balance sheet.
A subset of the Company’s automobile and copier leases contain variable payments. The variable lease payments for such automobile leases are based on actual mileage incurred at the standard contractual rate. The variable lease payments for such copier leases are based on actual copies incurred at the standard contractual rate. The variable lease costs for all leases are immaterial.
The components of operating lease expense were as follows:
| For the Year Ended |
||||
| December 31, 2019 |
||||
| Operating lease cost |
$ | 1,659 | ||
| Short-term operating lease cost |
36 | |||
|
|
|
|||
| Total operating lease cost |
$ | 1,695 | ||
|
|
|
|||
Supplemental cash flow information related to operating leases was as follows:
| For the Year Ended |
||||
| December 31, 2019 |
||||
| Cash paid for amounts included in the measurement of lease liabilities |
$ | 1,558 | ||
| ROU assets obtained in exchange for lease obligations |
103 | |||
109
Table of Contents
Supplemental balance sheet information related to operating leases was as follows:
| Balance Sheet Classification | Balance at December 31, 2019 |
|||||||
| Assets: |
||||||||
| Right-of-use assets |
Other assets - net | $ | 2,155 | |||||
|
|
|
|||||||
| Liabilities: |
||||||||
| Current |
Accrued expenses | $ | 1,159 | |||||
| Noncurrent |
Other long-term liabilities | 1,547 | ||||||
|
|
|
|||||||
| Total operating lease liabilities |
$ | 2,706 | ||||||
|
|
|
|||||||
As of December 31, 2019, the weighted-average remaining lease term was 5.0 years. The rate implicit on the Company’s leases are not readily determinable nor is it available to the Company from its lessors. Thus, the Company estimates its incremental borrowing rate based on information available at lease commencement in order to discount lease payments to present value. The weighted-average discount rate of the Company’s operating leases was 4.7%, as of December 31, 2019. Based on the income approach, including consideration of present value of market-based rent payments for the applicable properties of the Spine segment leases, the Company recorded a write down of $201 related to a right of use assets.
Maturities of operating lease liabilities were as follows:
| Maturity of Operating Lease Liabilities |
Balance at December 31, 2019 |
|||
| 2020 |
$ | 1,261 | ||
| 2021 |
562 | |||
| 2022 |
226 | |||
| 2023 |
159 | |||
| 2024 |
159 | |||
| 2025 and beyond |
716 | |||
|
|
|
|||
| Total future minimum lease payments |
3,083 | |||
|
|
|
|||
| Less imputed interest |
(377 | ) | ||
|
|
|
|||
| Total operating lease liabilities |
$ | 2,706 | ||
|
|
|
|||
As previously disclosed in our 2018 Annual Report on Form 10-K/A, which followed the lease accounting under Topic 840, future commitments relating to operating leases for the five years and period thereafter as of December 31, 2018 were as follows:
| Maturity of Operating Lease Liabilities |
Balance at December 31, 2018 |
|||
| 2019 |
$ | 1,374 | ||
| 2020 |
806 | |||
| 2021 |
276 | |||
| 2022 |
162 | |||
| 2023 |
166 | |||
| 2024 and beyond |
882 | |||
|
|
|
|||
| Total future minimum lease payments |
$ | 3,666 | ||
|
|
|
|||
5. Segment Reporting
The Company has determined its operating segments in accordance with ASC 280 - Segment Reporting. Prior to the fourth quarter of 2019, the Company operated in one operating and reportable segment composed of four franchises: spine; sports; original equipment manufacturer (“OEM”) and international.
110
Table of Contents
During the fourth quarter of 2019, changes were made to the internal organization of the Company which resulted in a change in the Company’s operating segments. The overall strategy of the Company is to manage our business in two operating segments, Global Spine (“Spine”) and Global OEM (“OEM”). The Spine segment focuses on sales, distribution and conducting research and development activities focused on the global spine market and the OEM segment focuses on the design, development and manufacturing of biologics and hardware medical technology. Changes were made to align our internal reporting and management structure to focus on the value drivers of each segment. The value drivers of the Spine segment include growth through innovation and acquisition while the value drivers of the OEM segment focus on predetermined and relatively predictable execution. Due to the reassessment of the business lines and our internal reorganization, the Company is now organized into two distinct groupings, Spine and OEM, which are also our operating and reportable segments. Additionally, the 2018 and 2017 revenue franchise data has been recast below to reflect the presentation of the new segment structure.
The Spine and OEM reportable segments reflect the way the Company is managed, and for which separate financial information is available and evaluated regularly by the Company’s chief operating decision maker (“CODM”) in deciding how to allocate resources and assess performance. The Company’s Chief Executive Officer is the CODM.
The segment revenues and segment net income (loss) for the years ended December 31, 2019, 2018, and 2017 are included in the table below. All revenues are earned from external customers. The Company does not disclose total assets by Spine and OEM as the CODM does not receive or review with regularity assets on a Spine or OEM basis. Additionally, the Company does not disclose long-lived assets by geographic location as no country outside of the United States holds 10% or more of our consolidated Property, Plant and Equipment.
111
Table of Contents
The Company’s segment data is as follows:
| For the Year Ended December 31, | ||||||||||||
| 2019 | 2018 | 2017 | ||||||||||
| Revenues: |
||||||||||||
| Spine |
$ | 118,987 | $ | 94,436 | $ | 92,712 | ||||||
| OEM |
189,397 | 185,926 | 187,637 | |||||||||
|
|
|
|
|
|
|
|||||||
| Total |
$ | 308,384 | $ | 280,362 | $ | 280,349 | ||||||
|
|
|
|
|
|
|
|||||||
| Depreciation and amortization: |
||||||||||||
| Spine |
$ | 12,779 | $ | 4,692 | $ | 3,469 | ||||||
| OEM |
9,896 | 9,887 | 10,764 | |||||||||
|
|
|
|
|
|
|
|||||||
| Total |
$ | 22,675 | $ | 14,579 | $ | 14,233 | ||||||
|
|
|
|
|
|
|
|||||||
| Operating income (loss): |
||||||||||||
| Spine |
$ | (30,538 | ) | $ | (20,603 | ) | $ | (9,497 | ) | |||
| OEM |
27,152 | 26,112 | 24,245 | |||||||||
| One-time charges |
||||||||||||
| Severance and restructuring costs |
— | 2,808 | 12,016 | |||||||||
| Executive transition costs |
— | — | 2,818 | |||||||||
| Gain on acquisition contingency |
(76,033 | ) | — | — | ||||||||
| Asset impairment and abandonments |
97,341 | 5,070 | 4,034 | |||||||||
| Goodwill impairment |
140,003 | — | — | |||||||||
| Acquisition and integration expenses |
17,159 | 4,943 | 630 | |||||||||
| Gain on cardiothoracic closure business divestiture |
— | (3,000 | ) | (34,090 | ) | |||||||
|
|
|
|
|
|
|
|||||||
| Total one-time charges |
178,470 | 9,821 | (14,592 | ) | ||||||||
|
|
|
|
|
|
|
|||||||
| Operating income (loss) |
$ | (181,856 | ) | $ | (4,312 | ) | $ | 29,340 | ||||
| Interest expense |
(12,571 | ) | (2,771 | ) | (3,180 | ) | ||||||
| Interest income |
161 | 35 | 8 | |||||||||
| Loss on extinguishment of debt |
— | (309 | ) | — | ||||||||
| Foreign exchange (loss) gain |
(139 | ) | (34 | ) | 87 | |||||||
|
|
|
|
|
|
|
|||||||
| Income (loss) before income tax benefit (provision) |
$ | (194,405 | ) | $ | (7,391 | ) | $ | 26,255 | ||||
|
|
|
|
|
|
|
|||||||
Revenues are attributed to countries based on the location of customer. The following table presents revenues by geographic location:
| For the Year Ended December 31, | ||||||||||||
| 2019 | 2018 | 2017 | ||||||||||
| Revenues: |
||||||||||||
| North America |
$ | 277,152 | $ | 254,409 | $ | 254,385 | ||||||
| EMEA |
24,252 | 21,258 | 19,303 | |||||||||
| Asia Pacific |
4,027 | 2,996 | 5,488 | |||||||||
| Latin America |
2,953 | 1,699 | 1,173 | |||||||||
|
|
|
|
|
|
|
|||||||
| Total |
$ | 308,384 | $ | 280,362 | $ | 280,349 | ||||||
|
|
|
|
|
|
|
|||||||
112
Table of Contents
Certain corporate costs have been allocated solely to the Spine reportable segment, including certain executive compensation costs and certain corporate costs including board of directors’ fees and board of directors’ stock-based compensation, public company expenses, legal fees, corporate compliance and communications costs, and business development expenses. The costs that were allocated solely to the Spine reportable segment total $7,855, $11,212, and $9,148 in 2019, 2018, and 2017, respectively. These costs were not allocated to the OEM reportable segment because the basis for the changes to the internal organization of the Company was in contemplation of the pending sale of the OEM business, and these costs are expected to remain with the Spine reportable segment. Such presentation appropriately reflects that manner in which the CODM evaluates the ongoing performance and allocates resources of the Company.
6. Revenue from Contracts with Customers
The Company is organized into two business lines, which are also our operating and reportable segments: Spine and OEM. The following table presents revenues from these two segments:
| Year Ended | ||||||||
| December 31, 2019 | December 31, 2018 | |||||||
| Revenues: |
||||||||
| Spine Segment |
||||||||
| Domestic |
$ | 97,629 | $ | 79,812 | ||||
| International |
21,358 | 14,625 | ||||||
| OEM Segment |
||||||||
| OEM |
124,184 | 120,037 | ||||||
| Sports |
55,339 | 54,560 | ||||||
| International |
9,874 | 11,328 | ||||||
|
|
|
|
|
|||||
| Total revenues from contracts with customers |
$ | 308,384 | $ | 280,362 | ||||
|
|
|
|
|
|||||
The following table presents revenues recognized at a point in time and over time for the years ended December 31, 2019 and 2018:
| Year Ended | ||||||||
| December 31, 2019 | December 31, 2018 | |||||||
| Revenue recognized at a point in time |
$ | 240,469 | $ | 239,619 | ||||
| Revenue recognized over time |
67,915 | 40,743 | ||||||
|
|
|
|
|
|||||
| Total revenues from contracts with customers |
$ | 308,384 | $ | 280,362 | ||||
|
|
|
|
|
|||||
The Company’s performance obligations consist mainly of transferring control of implants identified in the contracts. Some of the Company’s contracts offer assurance-type warranties in connection with the sale of a product to a customer. Assurance-type warranties provide a customer with assurance that the related product will function as the parties intended because it complies with agreed-upon specifications. Such warranties do not represent a separate performance obligation and are not material to the consolidated financial statements.
The opening and closing balances of the Company’s accounts receivable and current and long-term contract liability for the years ended December 31, 2019 and 2018 are as follows:
| Accounts Receivable |
Contract Liability (Current) |
Contract Liability (Long- Term) |
||||||||||
| Opening - January 1, 2019 |
$ | 48,096 | $ | 5,425 | $ | 744 | ||||||
| Closing - December 31, 2019 |
59,288 | 3,378 | — | |||||||||
|
|
|
|
|
|
|
|||||||
| Increase/(decrease) |
11,192 | (2,047 | ) | (744 | ) | |||||||
|
|
|
|
|
|
|
|||||||
113
Table of Contents
| Accounts Receivable |
Contract Liability (Current) |
Contract Liability (Long- Term) |
||||||||||
| Opening - January 1, 2018 |
$ | 38,441 | $ | 5,978 | $ | 3,741 | ||||||
| Closing - December 31, 2018 |
48,096 | 5,425 | 744 | |||||||||
|
|
|
|
|
|
|
|||||||
| Increase/(decrease) |
9,655 | (553 | ) | (2,997 | ) | |||||||
|
|
|
|
|
|
|
|||||||
As of December 31, 2019, December 31, 2018 and January 1, 2018, $10,633, $6,577 and $2,133, respectively, of unbilled receivables in connection with our exclusively built inventory contracts are included in accounts receivable.
7. Acquisition of Paradigm Spine, LLC
On March 8, 2019, pursuant to the Master Transaction Agreement (the “Master Transaction Agreement”), dated as of November 1, 2018, by and among Legacy RTI, PS Spine Holdco, LLC, a Delaware limited liability company (“PS Spine”), the Company, and Bears Merger Sub, Inc., a Delaware corporation and direct wholly owned subsidiary of the Company (“Merger Sub”), the Company acquired all of the outstanding equity interests of Paradigm, through a transaction in which: (i) PS Spine contributed all of the issued and outstanding equity interests in Paradigm to the Company (the “Contribution”); (ii) Merger Sub merged with and into Legacy RTI (the “Merger”), with Legacy RTI surviving as a wholly owned direct subsidiary of the Company; and (iii) the Company was renamed “RTI Surgical Holdings, Inc.” (collectively, the “Transaction”). Legacy RTI retained its existing name “RTI Surgical, Inc.”
Pursuant to the Master Transaction Agreement: (i) each share of common stock, par value $0.001 per share, of Legacy RTI issued and outstanding immediately prior to the Transaction (other than shares held by Legacy RTI as treasury shares or by the Company or Merger Sub immediately prior to the Transaction, which were automatically cancelled and ceased to exist) was converted automatically into one fully paid and non-assessable share of Company common stock , par value $0.001 per share; (ii) each share of Series A convertible preferred stock, par value $0.001 per share, of Legacy RTI issued and outstanding immediately prior to the Transaction (other than shares held by Legacy RTI as treasury shares or by the Company or Merger Sub immediately prior to the Transaction, which were automatically cancelled and ceased to exist) was converted automatically into one fully paid and non-assessable share of Series A convertible preferred stock, par value $0.001 per share, of the Company; and (iii) each stock option and restricted stock award granted by Legacy RTI was converted into a stock option or restricted stock award, as applicable, of the Company with respect to an equivalent number of shares of the Company common stock on the same terms and conditions as were applicable prior to the closing.
The consideration for the Contribution was $100,000 (the “Cash Consideration Amount”) in cash and 10,729,614 shares of Company common stock (the “Stock Consideration Amount”). The Cash Consideration Amount was adjusted lower by Paradigm’s working capital of $7,000.
In addition to the Cash Consideration Amount and the Stock Consideration Amount, the Company may be required to make further cash payments or issue additional shares of Company common stock to PS Spine in an amount up to $50,000 of shares of Company common stock to be valued based upon the Legacy RTI Price and an additional $100,000 of cash and/or Company common stock to be valued at the time of issuance, in each case, if certain revenue targets are achieved between closing, March 8, 2019, and December 31, 2022. The Company estimates the fair value of the contingent liability at acquisition date related to the revenue based earnout to be $72,177 utilizing a Monte-Carlo simulation model. A Monte-Carlo simulation is an analytical method used to estimate fair value by performing a large number of simulations or trial runs and thereby determining a value based on the possible outcomes. Accounted for as a liability to be revalued at each reporting period, the fair value of the contingent liability was measured using Level 3 inputs, which includes weighted average cost of capital and projected revenues and costs. Acquisition and integration related costs, specific to Paradigm, were approximately $15,537, of which approximately $4,143 was incurred during 2018, $11,394 (which includes integration costs of business development expenses of $462 and severance expense of $896) was incurred for the year ended December 31, 2019 and is reflected separately in the accompanying consolidated statements of comprehensive gain (loss).
The Company has accounted for the acquisition of Paradigm under ASC 805, Business Combinations. Paradigm’s results of operations are included in the consolidated financial statements beginning after March 8, 2019, the acquisition date.
The purchase price was comprised as follows:
| Cash proceeds from second lien credit agreement |
$ | 100,000 | ||
| Fair market value of securities issued |
60,730 | |||
| Fair market value of contingent earnout |
72,177 | |||
|
|
|
|||
| Total purchase price |
$ | 232,907 | ||
|
|
|
114
Table of Contents
In the first quarter of 2019, the Company completed its valuations and purchase price allocations. The table below represents the final allocation of the total purchase price to Paradigm’s tangible and intangible assets and liabilities fair values as of March 8, 2019.
| Balance at | ||||
| March 8, 2019 | ||||
| Cash |
$ | 307 | ||
| Accounts receivable |
5,220 | |||
| Inventories |
17,647 | |||
| Other current assets |
934 | |||
| Property, plant and equipment |
379 | |||
| Other non-current assets |
1,079 | |||
| Current liabilities |
(6,169 | ) | ||
| Lease liabilities |
(1,079 | ) | ||
|
|
|
|||
| Net tangible assets acquired |
18,318 | |||
| Other intangible assets |
79,000 | |||
| Goodwill |
135,589 | |||
|
|
|
|||
| Total net assets acquired |
$ | 232,907 | ||
|
|
|
|||
As of March 8, 2019, the inventory fair value was composed of current inventory of $7,122 and non-current inventory of $10,525.
Total net assets acquired as of March 8, 2019, were included in the Company’s only operating segment at that time. Subsequent to the segment change discussed in Note 5, the net assets acquired are included in the Spine segment. Fair values are based on management’s estimates and assumptions including variations of the income approach, the cost approach and the market approach.
The Company believes that the acquisition of Paradigm, a spine focused business, offers the potential for substantial strategic and financial benefits. The transaction further advances the Company’s strategic transformation focused on reducing complexity, driving operational excellence and accelerating growth. The Company believes the acquisition will enhance stockholder value through, among other things, enabling the Company to capitalize on the following strategic advantages and opportunities:
| • | Paradigm will strengthen the Company’s spine portfolio with the addition of the coflex® Interlaminar Stabilization® device. Coflex® is a differentiated and minimally invasive motion preserving stabilization implant that is FDA PMA-approved for the treatment of moderate to severe lumbar spinal stenosis (“LSS”) in conjunction with decompression. |
| • | Coflex® allows the Company to provide surgeons who treat patients with moderate to severe LSS with a PMA-approved device supported by more than 12 years of clinical data. |
These potential benefits resulted in the Company paying a premium for Paradigm resulting in the recognition of $135,589 of goodwill.
The following unaudited pro forma information shows the results of the Paradigm’s operations as though the acquisition had occurred as of the beginning of the prior comparable period, January 1, 2018:
| For the Year Ended December 31, |
||||||||
| 2019 | 2018 | |||||||
| Revenues |
$ | 37,374 | $ | 40,810 | ||||
| Net loss |
(16,547 | ) | (42,550 | ) | ||||
115
Table of Contents
The pro forma results have been prepared for comparative purposes only and are not necessarily indicative of the actual results of operations had the acquisition taken place as of the beginning of the periods presented, or the results that may occur in the future.
8. Acquisition of Zyga Technology, Inc.
On January 4, 2018, the Company acquired Zyga Technology, Inc. (“Zyga”), a spine-focused medical device company that develops and produces innovative minimally invasive devices to treat underserved conditions of the lumbar spine. Zyga’s primary product is the SImmetry® Sacroiliac Joint Fusion System. Under the terms of the merger agreement dated January 4, 2018, the Company acquired Zyga for $21,000 in consideration paid at closing (consisting of borrowings of $18,000 on the Company’s revolving credit facility and $3,000 cash on hand), $1,100 contingent upon the successful achievement of a clinical milestone, and a revenue based earnout consideration of up to $35,000. Based on a probability weighted model, the Company estimates a contingent liability related to the clinical milestone and revenue based earnout of $4,986. Acquisition related costs were approximately $1,430, of which approximately $630 was incurred in 2017 and $800 was incurred for the three months ended March 31, 2018 and is reflected separately in the accompanying Consolidated Statements of Comprehensive (Loss) Gain. As of December 31, 2019, there was a $3,856 reduction in the contingent liability estimate of the Zyga acquisition revenue earnout, as the probability weighted model has been updated based on the current updated forecast for the performance of the Zyga product portfolio.
The Company has accounted for the acquisition of Zyga under ASC 805, Business Combinations. Zyga’s results of operations are included in the consolidated financial statements beginning after January 4, 2018, the acquisition date.
The purchase price was financed as follows:
| Cash proceeds from revolving credit facility |
$ | 18,000 | ||
| Cash from RTI Surgical |
3,000 | |||
|
|
|
|||
| Total purchase price |
$ | 21,000 | ||
|
|
|
In the fourth quarter of 2018, the Company completed its valuation of the purchase price allocation. The table below represents the final allocation of the total consideration to Zyga’s tangible and intangible assets and liabilities fair values as of January 4, 2018. Including acquisition contingencies, the total consideration for the Zyga acquisition was $25,986.
| Inventories |
$ | 1,099 | ||
| Accounts receivable |
573 | |||
| Other current assets |
53 | |||
| Property, plant and equipment |
151 | |||
| Other assets |
26 | |||
| Deferred tax assets |
4,715 | |||
| Current liabilities |
(947 | ) | ||
| Acquisition contingencies |
(4,986 | ) | ||
|
|
|
|||
| Net tangible assets acquired |
684 | |||
| Other intangible assets |
6,760 | |||
| Goodwill |
13,556 | |||
|
|
|
|||
| Total net assets acquired |
$ | 21,000 | ||
|
|
|
Total net assets acquired as of January 4, 2018, are all part of the Company’s only operating segment and reporting unit. Fair values are based on management’s estimates and assumptions including variations of the income approach, the cost approach and the market approach. Other intangible assets include patents of $6,500 with a useful life of 13 years, trademarks of $80 with a useful life of 1 year and selling and marketing relationships of $180 with a useful life of 7 years.
The Company believes that the acquisition of Zyga has offered and continues to offer the potential for substantial strategic and financial benefits. The transaction further advances our strategic transformation focused on reducing complexity, driving operational excellence and accelerating growth. The Company believes the acquisition will enhance stockholder value through, among other things, enabling the Company to capitalize on the following strategic advantages and opportunities:
| • | Zyga’s innovative minimally invasive treatment should accentuate our spine portfolio and opens significant opportunities to accelerate our Spine-focused expansion strategy. |
116
Table of Contents
| • | Zyga should leverage the core competencies of our Spine franchise by pursuing niche differentiated products, to gain scale and customer retention and support portfolio pull-through. |
These potential benefits resulted in the Company paying a premium for Zyga resulting in the recognition of $13,556 of goodwill assigned to the Company’s only operating segment and reporting unit. For tax purposes, none of the goodwill is deductible.
The following unaudited pro forma information shows the results of the Zyga’s operations as though the acquisition had occurred as of the beginning of the prior comparable period, January 1, 2018.
| For the Year Ended December 31, |
||||
| 2018 | ||||
| Revenues |
$ | 4,809 | ||
| Net loss |
(2,640 | ) | ||
The pro forma results have been prepared for comparative purposes only and are not necessarily indicative of the actual results of operations had the acquisition taken place as of the beginning of the periods presented, or the results that may occur in the future.
9. Cardiothoracic Closure Business Divestiture
The Company completed the sale of substantially all of the assets related to its Cardiothoracic closure business (the “CT Business”) to A&E Advanced Closure Systems, LLC (a subsidiary of A&E Medical Corporation) (“A&E”) pursuant to an Asset Purchase Agreement between the Company and A&E, dated August 3, 2017 (the “Asset Purchase Agreement”). The total cash consideration received by the Company under the Asset Purchase Agreement was composed of $54,000, $3,000 of which was held in escrow (the “Escrow Amount”) to satisfy possible indemnification obligations, of which there were none. As such, the Company earned and received the $3,000 cash consideration in the third quarter of 2018. An additional $5,000 in contingent cash consideration is earned if A&E reaches certain revenue milestones (the “Contingent Consideration”). The Company also earned and received an additional $1,000 in consideration for successfully obtaining certain U.S. Food and Drug Administration (“FDA”) regulatory clearance. As a part of the transaction, the Company also entered into a multi-year Contract Manufacturing Agreement with A&E (the “Contract Manufacturing Agreement”). Under the Contract Manufacturing Agreement, the Company agreed to continue to support the CT Business by manufacturing existing products and engineering, developing, and manufacturing potential future products for A&E. The Company elected to account for the Contingent Consideration arrangement including the Escrow Amount, as a gain contingency in accordance with ASC 450 Contingencies. As such, the Contingent Consideration and Escrow Amount were excluded in measuring the fair value of the consideration to be received in connection with the transaction.
The calculation of the gain on the CT Business divestiture is as follows:
| Proceeds from cardiothoracic closure business divestiture |
$ | 51,000 | ||
| Inventories - net |
(2,893 | ) | ||
| Property, plant and equipment - net |
(1,299 | ) | ||
| Goodwill |
(8,645 | ) | ||
| Other intangible assets - net |
(280 | ) | ||
| Cardiothoracic closure business divestiture expenses |
(3,793 | ) | ||
|
|
|
|||
| Gain on cardiothoracic closure business divestiture |
$ | 34,090 | ||
|
|
|
10. Stock-Based Compensation
The Company’s policy is to grant stock options at an exercise price equal to 100% of the market value of a share of common stock at closing on the date of the grant. The Company’s stock options generally have five to ten-year contractual terms and vest over a one to five-year period from the date of grant. The Company’s policy is to grant restricted stock awards at a fair value equal to 100% of the market value of a share of common stock at closing on the date of the grant. The Company’s restricted stock awards generally vest over one to three-year periods.
2018 Incentive Compensation Plan – On April 30, 2018, the Company’s stockholders approved and adopted the 2018 Incentive Compensation Plan (the “2018 Plan”). The 2018 Plan provides for the grant of incentive and nonqualified stock options, restricted stock, and restricted stock units to key employees, including officers and directors of the Company. The 2018 Plan allows for up to 5,726,035 shares of common stock to be issued with respect to awards granted.
117
Table of Contents
Stock Options
As of December 31, 2019, there was $1,627 of total unrecognized stock-based compensation expense related to nonvested stock options. That expense is expected to be recognized over a weighted-average period of 3.00 years.
Stock options outstanding, exercisable and available for grant at December 31, 2019, are summarized as follows:
| Weighted | ||||||||||||||||
| Weighted | Average | |||||||||||||||
| Average | Remaining | Aggregate | ||||||||||||||
| Number of | Exercise | Contractual | Intrinsic | |||||||||||||
| Options | Price | Life (Years) | Value | |||||||||||||
| Outstanding at January 1, 2019 |
4,275,744 | $ | 3.76 | |||||||||||||
| Granted |
584,297 | 3.85 | ||||||||||||||
| Exercised |
(118,500 | ) | 3.34 | |||||||||||||
| Forfeited or expired |
(205,080 | ) | 4.46 | |||||||||||||
|
|
|
|
|
|||||||||||||
| Outstanding at December 31, 2019 |
4,536,461 | $ | 3.75 | 4.01 | $ | 124 | ||||||||||
|
|
|
|
|
|
|
|
|
|||||||||
| Vested or expected to vest at |
||||||||||||||||
| December 31, 2019 |
4,301,432 | $ | 3.73 | 3.81 | $ | 97 | ||||||||||
|
|
|
|
|
|
|
|
|
|||||||||
| Exercisable at December 31, 2019 |
1,085,814 | $ | 4.10 | 2.68 | $ | 3 | ||||||||||
|
|
|
|
|
|
|
|
|
|||||||||
| Available for grant at December 31, 2019 |
4,186,650 | |||||||||||||||
|
|
|
|||||||||||||||
The aggregate intrinsic value in the table above represents the total pre-tax intrinsic value of stock options for which the fair market value of the underlying common stock exceeded the respective stock option exercise price. Estimated forfeitures are based on the Company’s historical forfeiture activity. Stock-based compensation expense recognized for all stock option grants is net of estimated forfeitures and is recognized over the awards’ respective requisite service periods.
Other information concerning stock options are as follows:
| For the Year Ended December 31, | ||||||||||||
| 2019 | 2018 | 2017 | ||||||||||
| Weighted average fair value of stock options granted |
$ | 1.56 | $ | 2.05 | $ | 1.66 | ||||||
| Aggregate intrinsic value of stock options exercised |
161 | 349 | 2,786 | |||||||||
The aggregate intrinsic value of stock options exercised in a period represents the pre-tax cumulative difference, for the stock options exercised during the period, between the fair market value of the underlying common stock and the stock option exercise prices.
The following weighted-average assumptions were used to determine the fair value of stock options under FASB ASC 718:
| Year Ended December 31, | ||||||||||||
| 2019 | 2018 | 2017 | ||||||||||
| Expected term (years) |
6.50 | 6.50 | 6.50 | |||||||||
| Risk free interest rate |
2.54 | % | 2.75 | % | 2.26 | % | ||||||
| Volatility factor |
37.73 | % | 43.74 | % | 47.39 | % | ||||||
| Dividend yield |
— | — | — | |||||||||
118
Table of Contents
Restricted Stock Awards
The value of restricted stock awards is determined by the market value of the Company’s common stock at the date of grant. In 2019, restricted stock awards in the amount of 625,881 shares and 166,922 shares of restricted stock were granted to employees and non-employee directors, respectively. As of December 31, 2019, there was $2,676 of total unrecognized stock-based compensation expense related to unvested restricted stock awards. That expense is expected to be recognized on a straight-line basis over a weighted-average period of 1.59 years. The following table summarizes information about unvested restricted stock awards as of December 31, 2019:
| Weighted | ||||||||
| Average | ||||||||
| Number of | Grant Date | |||||||
| Shares | Fair Value | |||||||
| Unvested at January 1, 2019 |
1,032,715 | $ | 4.32 | |||||
| Granted |
792,803 | 4.38 | ||||||
| Vested |
(516,491 | ) | 4.27 | |||||
| Forfeited |
(81,169 | ) | 4.86 | |||||
|
|
|
|
|
|||||
| Unvested at December 31, 2019 |
1,227,858 | $ | 4.34 | |||||
|
|
|
|
|
|||||
Restricted Stock Units
The value of restricted stock units is determined by the market value of the Company’s common stock at the date of grant. In 2019, restricted stock units in the amount of 226,352 units were granted to employees. As of December 31, 2019, there was $815 of total unrecognized stock-based compensation expense related to unvested restricted stock units. That expense is expected to be recognized on a straight-line basis over a weighted-average period of 2.00 years. The following table summarizes information about unvested restricted stock units as of December 31, 2019:
| Weighted | ||||||||
| Average | ||||||||
| Number of | Grant Date | |||||||
| Shares | Fair Value | |||||||
| Unvested at January 1, 2019 |
— | $ | — | |||||
| Granted |
226,352 | 7.41 | ||||||
| Vested |
— | — | ||||||
| Forfeited |
(41,770 | ) | 7.41 | |||||
|
|
|
|
|
|||||
| Unvested at December 31, 2019 |
184,582 | $ | 7.41 | |||||
|
|
|
|
|
|||||
For the years ended December 31, 2019, 2018 and 2017, the Company recognized stock-based compensation as follows:
| For the Year Ended December 31, | ||||||||||||
| 2019 | 2018 | 2017 | ||||||||||
| Stock-based compensation: |
||||||||||||
| Costs of processing and distribution |
$ | 144 | $ | 132 | $ | 132 | ||||||
| Marketing, general and administrative |
4,163 | 4,553 | 6,586 | |||||||||
| Research and development |
60 | 60 | 44 | |||||||||
|
|
|
|
|
|
|
|||||||
| Total |
$ | 4,367 | $ | 4,745 | $ | 6,762 | ||||||
|
|
|
|
|
|
|
|||||||
Inducement Grant
President and Chief Executive Officer
On January 26, 2017, the Company issued an inducement grant to its President and Chief Executive Officer, Mr. Camille Farhat. This grant was in the form of: (1) a restricted stock award agreement (the “Restricted Stock Agreement #1”); (2) another restricted stock award agreement (the “Restricted Stock Agreement #2”); and (3) a stock option agreement. Under the Restricted Stock Agreement #1, the Company granted Mr. Farhat 850,000 shares of restricted common stock. On December 4, 2017, the Company and Mr. Farhat entered into the First Amendment to the Restricted Stock Agreement #1 (the “Amendment”). The Amendment revised the vesting conditions for the Company’s common stock (the “Common Stock”), granted under the Restricted Stock Agreement #1. Under the Restricted Stock Agreement #2, the Company granted Mr. Farhat 150,000 shares of restricted common stock. All of the shares granted to Mr. Farhat under the Restricted Stock Agreement #1, as amended, and the Restricted Stock Agreement #2 have fully vested.
Under the Option Agreement, the Company granted Mr. Farhat the option to purchase 1,950,000 shares of common stock. The exercise price for the stock options is $3.20. The stock options will expire on January 26, 2022. The stock options will vest based on the Company’s attainment of three average stock price benchmarks. The first 650,000 shares will vest if the Company’s average publicly traded stock price is over $6.00 for a sixty-consecutive calendar day period. The next 650,000 shares will vest if the Company’s average publicly traded stock price is over $7.00 for a sixty-consecutive calendar day period. The final 650,000 shares will vest if the Company’s average publicly traded stock price is over $8.00 for a sixty-consecutive calendar day period. The vesting of the stock options is cumulative.
119
Table of Contents
Chief Financial and Administrative Officer
On September 18, 2017, the Company issued an inducement grant to its Chief Financial and Administrative Officer, Mr. Jonathon Singer. This grant was in the form of: (1) a restricted stock award agreement (the “Restricted Stock Agreement”); and (2) a stock option agreement. This inducement grant was made under the RTI Surgical, Inc. 2015 Incentive Compensation Plan, which was filed with the SEC on May 5, 2015.
Under the Restricted Stock Agreement, the Company granted Mr. Singer 109,890 shares of restricted stock. All of the shares granted to Mr. Singer under the Restricted Stock Agreement have fully vested.
Under the Option Agreement, the Company granted Mr. Singer the option to purchase 306,900 shares of common stock, as of the grant date. The exercise price for the stock options is $4.55 per share. The stock options will expire on September 18, 2027. The stock options will vest based the Company’s attainment of three average stock price benchmarks. The first 102,300 shares will vest if the Company’s average publicly traded stock price is over $7.00 per share for a sixty-consecutive calendar day period. The next 102,300 shares will vest if the Company’s average publicly traded stock price is over $8.00 per share for a sixty-consecutive calendar day period. The final 102,300 shares will vest if the Company’s average publicly traded stock price is over $9.00 per share for a sixty-consecutive calendar day period. The vesting of the stock options is cumulative.
President, Global Spine
On November 29, 2019, the Company issued an inducement grant to its President of Global Spine, Mr. Terry Rich. This grant was in the form of: (1) a restricted stock award agreement (the “Restricted Stock Agreement”); and (2) a stock option agreement. This inducement grant was made under the RTI Surgical Holdings, Inc., Terry Rich Reserve Compensation Plan.
Under the Restricted Stock Agreement, the Company granted Mr. Rich 125,598 shares of restricted stock. On the first anniversary of the grant date, 41,866 shares will vest. The remaining shares will vest on the last day of each calendar quarter at a rate of 10,467 shares per calendar quarter commencing on the fifteenth month following the grant date and continuing for two years year after. Vesting of these shares may accelerate upon the occurrence of certain conditions.
Under the Option Agreement, the Company granted Mr. Rich the option to purchase 188,397 shares of common stock (the “Stock Options”), as of the grant date. The exercise price for the Stock Options is $2.09. On the first anniversary of the grant date, 62,799 will vest. The remaining shares will vest on the last day of each calendar quarter at a rate of 15,700 shares per calendar quarter commencing on the fifteenth month following the grant date and continuing for two years after. The vesting of the Stock Options is cumulative.
11. Inventories
Inventories by stage of completion are as follows:
| December 31, | ||||||||
| 2019 | 2018 | |||||||
| Unprocessed tissue, raw materials and supplies |
$ | 29,552 | $ | 24,211 | ||||
| Tissue and work in process |
35,740 | 31,796 | ||||||
| Implantable tissue and finished goods |
65,494 | 51,648 | ||||||
|
|
|
|
|
|||||
| Total |
130,786 | 107,655 | ||||||
| Less current portion |
124,149 | 107,655 | ||||||
|
|
|
|
|
|||||
| Long-term portion |
$ | 6,637 | $ | — | ||||
|
|
|
|
|
|||||
For the years ended December 31, 2019, 2018, and 2017, the Company had inventory write-downs of $9,006, $15,122 and $5,066, respectively, relating primarily to excess quantities and obsolescence of inventories. Included in the amount above, for the year ended December 31, 2019, the Company had inventory write-downs of $513 related to the valuation of the Paradigm acquisition-related inventory. Included in the year ended December 31, 2018, are $1,023 of product obsolescence related to the rationalization of our international distribution infrastructure and $6,559 of inventory write-off related to the abandonment of the Company’s map3® implant. The write downs are included in Costs of processing and distribution in the Consolidated Statements of Comprehensive (Loss) Income.
120
Table of Contents
12. Prepaid and Other Current Assets
Prepaid and Other Current Assets are as follows:
| December 31, | ||||||||
| 2019 | 2018 | |||||||
| Income tax receivable |
$ | 2,803 | $ | 3,920 | ||||
| Prepaid expenses |
1,865 | 2,013 | ||||||
| Other |
2,101 | 2,480 | ||||||
|
|
|
|
|
|||||
| $ | 6,769 | $ | 8,413 | |||||
|
|
|
|
|
|||||
13. Property, Plant and Equipment
Property, plant and equipment are as follows:
| December 31, | ||||||||
| 2019 | 2018 | |||||||
| Land |
$ | 2,005 | $ | 2,020 | ||||
| Buildings and improvements |
58,208 | 58,093 | ||||||
| Processing equipment |
45,762 | 42,599 | ||||||
| Surgical instruments |
541 | 24,070 | ||||||
| Office equipment, furniture and fixtures |
1,730 | 1,877 | ||||||
| Computer equipment and software |
20,521 | 18,873 | ||||||
| Construction in process |
11,717 | 8,934 | ||||||
|
|
|
|
|
|||||
| 140,484 | 156,466 | |||||||
| Less accumulated depreciation |
(70,594 | ) | (78,512 | ) | ||||
|
|
|
|
|
|||||
| $ | 69,890 | $ | 77,954 | |||||
|
|
|
|
|
|||||
For the years ended December 31, 2019, 2018, and 2017, the Company had depreciation expense in connection with property, plant and equipment of $11,681, $10,619, and $10,513, respectively. For the year ended December 31, 2019, the Company recorded asset impairment and abandonment charges of $11,655, based on impairment indicators within the Spine asset group. For the year ended December 31, 2018, the Company recorded asset impairment and abandonment charges of $1,797, relating to the abandonment of our map3® implant. During the year ended December 31, 2017, the Company ceased certain long-term projects resulting in asset abandonments of long-term assets at its U.S. facility of $3,539.
For the year ended December 31, 2019, the Company recorded asset impairment and abandonment charges of $11,856 consisting of $11,655 related to property, plant and equipment and $201 of right-of-use lease assets in the Spine segment. The organizational change in 2019 resulted in the creation of a new Spine asset group. Prior to the fourth quarter of 2019, the Spine asset group did not exist as the related assets were included in another asset group as it had interdependencies among the utilization of the assets within the group, and therefore, there were no discrete cash flows. The newly formed Spine asset group could not support the carrying amount of the property, plant and equipment and the right of use asset, because the Spine asset group no longer has the benefit of shared resources and cashflows generated by the former asset group that it was previously included in. The fair value of property and equipment was measured utilizing an orderly liquidation value of each of the underlying assets. The right-of-use lease assets were measured utilizing a version of the income approach that considers the present value of the market based rent payments for the applicable properties.
121
Table of Contents
14. Goodwill
The change in the carrying amount of goodwill for the year ended December 31, 2019, is as follows:
| December 31, | ||||||||
| 2019 | 2018 | |||||||
| Balance at January 1 |
$ | 59,798 | $ | 46,242 | ||||
| Goodwill acquired related to Zyga acquisition |
— | 13,556 | ||||||
| Goodwill acquired related to Paradigm acquisition |
135,589 | — | ||||||
| Goodwill impairment |
(140,003 | ) | — | |||||
|
|
|
|
|
|||||
| Balance at December 31 |
$ | 55,384 | $ | 59,798 | ||||
|
|
|
|
|
|||||
Goodwill acquired during the year ended December 31, 2019 and 2018, includes the excess of the Paradigm and Zyga, respectively, purchase price over the sum of the amounts assigned to assets acquired less liabilities assumed.
The Company considered the abandonment of our map3® implant to be a triggering event for long-lived asset impairment testing. As a result, the Company performed a goodwill impairment analysis on its sole reporting unit during the quarter ended June 30, 2018, and based on the analysis, the Company concluded its goodwill was not impaired.
The valuation of goodwill requires management to use significant judgments and estimates including, but not limited to, projected future revenue and cash flows, along with risk-adjusted weighted average cost of capital. Changes in assumptions or market conditions could result in a change in estimated future cash flows and the likelihood of materially different reported results.
On March 8, 2019, we acquired Paradigm for a purchase price of approximately $232,907 and recorded goodwill of approximately $135,589. Paradigm was initially included in the Company’s single reporting unit. As noted above in Note 5, the Company reorganized its segments in the fourth quarter of 2019, which resulted in the Company dividing its single reporting unit into a Spine and OEM reporting unit. With the change in reporting units, we performed a relative fair value valuation calculation to allocate the Company’s historical goodwill (existing prior to the Paradigm acquisition) between the two reporting units. The goodwill arising from the Paradigm acquisition was specifically allocated to the Spine reporting unit. The Company concluded specific allocation of the Paradigm goodwill to the Spine reporting unit was most appropriate since Paradigm was recently acquired and the benefits of the acquired goodwill were never realized by the single reporting unit as Paradigm was not integrated. Based on this change in reporting units, we conducted an impairment test before and after the change, and it was concluded that the fair value of our single reporting unit exceeded the carrying value under the previous reporting unit structure. For the impairment test performed immediately subsequent to the change in reporting units on the OEM reporting unit, it was concluded the fair value of goodwill is substantially in excess of its carrying value. For the Spine reporting unit test, it was concluded the carrying value was in excess of the fair value of goodwill. Based on several factors, we weighted the income approach at 75% and the market approach at 25% in determining the fair value of our OEM reporting unit and utilized the cost approach for the Spine reporting unit for the purpose of the impairment test. The test resulted in the fair value of the OEM reporting unit exceeding the carrying value by approximately 54%, and the fair value of the Spine reporting unit could not support the allocated goodwill. As a result, for the year ended December 31, 2019, we recorded an impairment charge of all the goodwill in the Spine reporting unit totaling $140,003.
15. Other Intangible Assets
Other intangible assets are as follows:
| December 31, 2019 | December 31, 2018 | |||||||||||||||||||||||
| Gross Carrying Amount |
Accumulated Amortization |
Net Carrying Amount |
Gross Carrying Amount |
Accumulated Amortization |
Net Carrying Amount |
|||||||||||||||||||
| Patents |
$ | 5,095 | $ | 2,768 | $ | 2,327 | $ | 15,469 | $ | 4,191 | $ | 11,278 | ||||||||||||
| Acquired licensing rights |
1,413 | 64 | 1,349 | 11,671 | 6,468 | 5,203 | ||||||||||||||||||
| Marketing and procurement and other intangible assets |
16,488 | 9,672 | 6,816 | 20,355 | 11,279 | 9,076 | ||||||||||||||||||
|
|
|
|
|
|
|
|
|
|
|
|
|
|||||||||||||
| Total |
$ | 22,996 | $ | 12,504 | $ | 10,492 | $ | 47,495 | $ | 21,938 | $ | 25,557 | ||||||||||||
|
|
|
|
|
|
|
|
|
|
|
|
|
|||||||||||||
For the years ended December 31, 2019, 2018, and 2017, the Company had amortization expense of other intangible assets of $11,126, $3,960, and $3,720, respectively.
As of December 31, 2019, the Company concluded, through the ASC 360 valuation testing, that factors existed indicating that long-lived assets in the Spine segment were impaired. Thus, we tested the carrying amount in the Spine intangibles for impairment on December 31, 2019. The method used to determine the fair value of the Spine asset group was based on a net asset value approach (i.e. a cost approach). As a result, for the year ended December 31, 2019, we recorded an impairment charge for all of the other intangible assets within the Spine segment, totaling $85,096. Included within these impairment charges are $71,958 of other intangible assets, net of amortization, acquired as part of Paradigm. For the year ended December 31, 2018, the Company recorded asset impairment and abandonment charges of $2,718 relating to the abandonment of our map3® implant.
122
Table of Contents
At December 31, 2019, management’s estimates of future amortization expense for the next five years are as follows:
| Amortization Expense |
||||
| 2020 |
$ | 2,300 | ||
| 2021 |
2,300 | |||
| 2022 |
2,300 | |||
| 2023 |
700 | |||
| 2024 |
700 | |||
16. Fair Value Information
Fair value is defined as the price that would be received upon the sale of an asset or paid to transfer a liability in an orderly transaction between market participants on the measurement date. Valuation techniques used to measure fair value maximize the use of observable inputs and minimize the use of unobservable inputs. The fair value hierarchy defines a three-level valuation hierarchy for classification and disclosure of fair value measurements as follows:
Level 1 – Quoted prices in active markets for identical assets or liabilities.
Level 2 – Inputs other than Level 1 that are observable, either directly or indirectly, such as quoted prices for similar assets or liabilities; quoted prices in markets that are not active; or other inputs that are observable or can be corroborated by observable market data for substantially the full term of the assets or liabilities.
Level 3 – Unobservable inputs that are supported by little or no market activity and that are significant to the fair value of the assets or liabilities.
On March 8, 2019, the Company acquired Paradigm as further explained in Note 7 above. The Company estimated a contingent liability related to the revenue-based earnout of $72,177. The fair value of the contingent liability was measured using Level 3 inputs. Unobservable inputs for the probability weighted model included weighted average cost of capital (unobservable) and company specific projected revenue and costs (unobservable). As of December 31, 2019, Management determined revenue earnout would be $0, as the probability weighted model has been updated based on the current updated forecast for the performance of the Paradigm product portfolio. Beginning in Q4 2019, in conjunction with Spine Leadership change, management reassessed the Paradigm strategy relating to roll-out of the commercial operating model, impact of physician reimbursement and progression of third-party insurance reimbursement and its related impact on the long-term outlook for the business. These items resulted in revisions of our projections and a reduction of the fair value of the earnout liability. As a result, a gain of $72,177 was recognized and is included in gain on acquisition contingency in the consolidated statement of comprehensive (loss) income.
On January 4, 2018, the Company acquired Zyga as further explained in Note 8 above. The Company estimates a contingent liability related to the clinical milestone and revenue-based earnout of $4,986. The fair value of the contingent liability was measured using Level 3 inputs. As of December 31, 2019, there was a $3,856 reduction in the contingent liability estimate of the Zyga acquisition revenue-based earnout, as the probability weighted model has been updated based on the current updated forecast for the performance of the Zyga product portfolio.
Long-lived assets, including property and equipment and intangible assets subject to amortization were impaired and written down to their estimated fair values during the fourth quarter of 2019 and the second quarter of 2018. Fair value is measured as of the impairment date using Level 3 inputs. For the 2019 impairments, the long-lived asset level 3 fair value was measured base on orderly liquidation value for the Property, plant and equipment and Other assets. The Other intangible assets fair value was measured based on the income approach. Unobservable inputs for the orderly liquidation value included replacement costs (unobservable), physical deterioration estimates (unobservable) and market sales data for comparable assets and unobservable inputs for the income approach included forecasted cash flows generated from use of the intangible assets (unobservable). For the 2018 impairments, the long-lived asset level 3 fair value was determined using a market approach, which used inputs that included replacement costs (unobservable), physical deterioration estimates (unobservable), economic obsolescence (unobservable), and market sales data for comparable assets.
The following table summarizes impairments of long-lived assets and the related post impairment fair values of the corresponding assets for the years ended December 31, 2019 and 2018:
| For the Year Ended December 31, 2019 | ||||||||
| Impairment | Fair Value | |||||||
| Property, plant and equipment - net |
$ | 11,655 | $ | — | ||||
| Other intangible assets - net |
85,096 | — | ||||||
| Other assets - net |
201 | |||||||
|
|
|
|
|
|||||
| $ | 96,952 | $ | — | |||||
|
|
|
|
|
|||||
123
Table of Contents
| For the Year Ended December 31, 2018 |
||||||||
| Impairment | Fair Value | |||||||
| Property, plant and equipment - net |
$ | 1,797 | $ | — | ||||
| Other intangible assets - net |
2,718 | — | ||||||
|
|
|
|
|
|||||
| $ | 4,515 | $ | — | |||||
|
|
|
|
|
|||||
No impairments on long-lived assets were recorded for the years ended December 31, 2017.
17. Accrued Expenses
Accrued expenses are as follows:
| December 31, | ||||||||
| 2019 | 2018 | |||||||
| Accrued compensation |
$ | 5,435 | $ | 8,308 | ||||
| Accrued severance and restructuring costs |
136 | 1,302 | ||||||
| Accrued distributor commissions |
4,569 | 3,907 | ||||||
| Accrued donor recovery fees |
8,921 | 3,018 | ||||||
| Accrued leases |
1,159 | — | ||||||
| Accrued acquisition and integration expenses |
2,555 | — | ||||||
| Other |
10,562 | 9,330 | ||||||
|
|
|
|
|
|||||
| $ | 33,337 | $ | 25,865 | |||||
|
|
|
|
|
|||||
18. Short and Long-Term Obligations
Short and long-term obligations are as follows:
| December 31, | ||||||||
| 2019 | 2018 | |||||||
| Ares Term loan |
$ | 104,406 | $ | — | ||||
| JPM facility |
71,000 | 50,000 | ||||||
| Less unamortized debt issuance costs |
(1,229 | ) | (927 | ) | ||||
|
|
|
|
|
|||||
| Total |
174,177 | 49,073 | ||||||
| Less current portion |
174,177 | — | ||||||
|
|
|
|
|
|||||
| Long-term portion |
$ | — | $ | 49,073 | ||||
|
|
|
|
|
|||||
On June 5, 2018, the Company terminated its 2017 loan agreement with TD Bank, N.A. and First Tennessee Bank National Association. The 2017 loan agreement provided for a revolving credit facility in the aggregate principal amount of $42,500. Borrowings under the 2017 loan agreement had an interest rate per annum equal to monthly LIBOR plus a margin of up to 3.50%. The maturity date of the revolving credit facility was September 15, 2019.
On June 5, 2018, the Company, along with its wholly-owned subsidiary, Pioneer Surgical, entered into the 2018 Credit Agreement, as borrowers, with JP Morgan Chase Bank, N.A., as lender (together with the various financial institutions as in the future may become parties thereto, the “JPM Lenders”) and as administrative agent for the JPM Lenders. The 2018 Credit Agreement provides for a revolving credit facility in the aggregate principal amount of up to $100,000 (the “JPM Facility”) (subsequently reduced to $75,000, as described below). The Company and Pioneer Surgical will be able to, at their option, and subject to customary conditions and JPM Lender approval, request an increase to the JPM Facility in an amount not to exceed $50,000.
124
Table of Contents
The JPM Facility is guaranteed by the Company’s domestic subsidiaries and is secured by: (i) substantially all of the assets of the Company and Pioneer Surgical; (ii) substantially all of the assets of each of the Company’s domestic subsidiaries; and (iii) 65% of the stock of the Company’s foreign subsidiaries.
The CBFR Loans will bear interest at a rate per annum equal to the monthly REVLIBOR30 Rate plus the CBFR Rate. The Company may elect to convert the interest rate for the Eurodollars Loans to a rate per annum equal to the adjusted LIBOR Rate plus the JPM Eurodollar Rate. For all subsequent borrowings, the Company may elect to apply either the CBFR Rate or JPM Eurodollar Rate. The applicable margin is subject to adjustment after the end of each fiscal quarter, based upon the Company’s average quarterly availability. The maturity date of the JPM Facility is June 5, 2023. The Company may make optional prepayments on the JPM Facility without penalty. The Company paid certain customary closing costs and bank fees upon entering into the 2018 Credit Agreement.
The Company is subject to certain affirmative and negative covenants, including (but not limited to), covenants limiting the Company’s ability to: incur certain additional indebtedness; create certain liens; enter into sale and leaseback transactions; and consolidate or merge with, or convey, transfer or lease all or substantially all of its assets to another person. The Company is required to maintain a minimum fixed charge coverage ratio of at least 1.00:1.00 (the “JPM Required Minimum Fixed Charge Coverage Ratio”) during either of the following periods (each, a “JPM Covenant Testing Period”): (i) a period beginning on a date that a default has occurred and is continuing under the loan documents entered into by the Company in conjunction with the 2018 Credit Agreement through the first date on which no default has occurred and is continuing; or (ii) a period beginning on a date that availability under the JPM Facility is less than the specified covenant testing threshold and continuing until availability under the JPM Facility is greater than or equal to the specified covenant testing threshold for thirty (30) consecutive days. The JPM Required Minimum Fixed Charge Coverage Ratio is measured on the last day of each calendar month during the JPM Covenant Testing Period (each a “JPM Calculation Date”), and is calculated using the minimum fixed charge coverage ratio for the twelve (12) consecutive months ending on each JPM Calculation Date. The amounts owed under the 2018 Credit Agreement may be accelerated upon the occurrence of certain events of default customary for facilities for similarly rated borrowers.
First Amendment to Credit Agreement and Joinder Agreement
On March 8, 2019, the Company entered into a First Amendment to Credit Agreement and Joinder Agreement dated as of March 8, 2019 (the “2019 First Amendment”), among the Company, Legacy RTI, as a borrower, Pioneer Surgical, as a borrower, the other loan parties thereto as guarantors, JP Morgan Chase Bank, N.A., as lender (together with the various financial institutions as in the future may become parties thereto) and as administrative agent for the JPM Lenders. The 2019 First Amendment amended the 2018 Credit Agreement by: (i) reducing the aggregate revolving commitments available to Legacy RTI and Pioneer Surgical from $100,000 to $75,000; (ii) joining the Company and Paradigm, and its domestic subsidiaries as guarantors and loan parties to the 2018 Credit Agreement; (iii) permitting the Ares Term Loan (as defined below); and (iv) making certain other changes to the 2018 Credit Agreement consistent with the foregoing including pro rata reductions to certain thresholds that were based on the aggregate commitments under the 2018 Credit Agreement.
Second Amendment to Credit Agreement and Joinder Agreement
The Company entered into a Second Amendment to Credit Agreement and Joinder Agreement dated as of December 9, 2019 (the “2019 Second Amendment”). The 2019 Second Amendment amended the 2018 Credit Agreement by increasing the aggregate revolving commitments available to Legacy RTI and Pioneer Surgical from $75,000 to $80,000.
At December 31, 2019, the interest rate for the JPM Facility was 3.69%. As of December 31, 2019, there was $71,000 outstanding on the JPM Facility and total remaining available credit on the JPM Facility was $9,000. The Company’s ability to access the JPM Facility is subject to and can be limited by the Company’s compliance with the Company’s financial and other covenants. The Company was in compliance with the financial covenants related to the JPM Facility as of December 31, 2019.
Second Lien Credit Agreement and Term Loan
On March 8, 2019, Legacy RTI entered into a Second Lien Credit Agreement dated as of March 8, 2019 (the “2019 Credit Agreement”), among Legacy RTI, as a borrower, the other loan parties thereto as guarantors (together with Legacy RTI, the “Ares Loan Parties”), Ares, as lender (together with the various financial institutions as in the future may become parties thereto, the “Ares Lenders”) and as administrative agent for the Ares Lenders. The 2019 Credit Agreement provides for a term loan in the principal amount of up to $100,000 (the “Ares Term Loan”). The Ares Term Loan was advanced in a single borrowing on March 8, 2019.
125
Table of Contents
The Ares Term Loan is guaranteed by the Company and each of the Company’s domestic subsidiaries and is secured by: (i) substantially all of the assets of Legacy RTI; (ii) substantially all of the assets of the Company; (iii) substantially all of the assets of the Company’s domestic subsidiaries; and (iv) 65% of the stock of the Company’s foreign subsidiaries.
The Ares Term Loan will bear interest at a rate per annum equal to, at the option of Legacy RTI: (i) the monthly Base Rate plus an adjustable margin of up to 7.50% (the “Base Rate”); or (ii) the LIBOR plus an adjustable margin of up to 8.50% (the “Ares Eurodollar Rate”). Subject to customary notices, Legacy RTI may elect to convert the Ares Term Loan from Base Rate to Ares Eurodollar Rate or from Ares Eurodollar Rate to Base Rate. The applicable margin is subject to adjustment after the end of each fiscal quarter, based upon the Ares Loan Parties’ total net leverage ratio. At any time during the period commencing on March 8, 2019 and ending on March 8, 2021, if the Ares Loan Parties’ total net leverage ratio is greater than 5.75:1.00, Legacy RTI shall have the option (the “PIK Option”) to elect to pay 50% of the interest that will accrue in the subsequent quarterly period in kind by capitalizing it and adding such amount to the principal balance of the Ares Term Loan. If Legacy RTI exercises the PIK Option, the adjustable margin applicable to the Ares Term Loan shall be increased by 0.75%.
The maturity date of the Ares Term Loan is December 5, 2023. Legacy RTI may make optional prepayments on the Ares Term Loan, provided that any such optional prepayments made on or prior to March 8, 2022, shall be subject to a make whole premium or a prepayment price, as the case may be. Legacy RTI is required to make mandatory prepayments of the Ares Term Loan based on excess cash flow and the Ares Loan Parties’ total net leverage ratio, upon the incurrence of certain indebtedness not otherwise permitted under the 2019 Credit Agreement, upon consummation of certain dispositions, and upon the receipt of certain proceeds of casualty events. Legacy RTI was required to pay certain customary closing costs and bank fees upon entering into the 2019 Credit Agreement.
Legacy RTI is subject to certain affirmative and negative covenants, including (but not limited to), covenants limiting Legacy RTI’s ability to: incur certain additional indebtedness; create certain liens; enter into sale and leaseback transactions; and consolidate or merge with, or convey, transfer or lease all or substantially all of its assets to another person. During any period beginning on a date that either: (i) a default has occurred and is continuing under the loan documents entered into by Legacy RTI in conjunction with the Credit Agreement (the “Ares Loan Documents”); or (ii) availability under the Ares Term Loan is less than the specified covenant testing threshold, and continuing until either (a) no default has occurred and is continuing under the Ares Loan Documents or (b) availability under the Ares Term Loan is greater than or equal to the specified covenant testing threshold for thirty (30) consecutive days, respectively, (the “Ares Covenant Testing Period”) Legacy RTI is required to maintain a minimum fixed charge coverage ratio of at least 0.91:1.00 (the “Ares Required Minimum Fixed Charge Coverage Ratio”). The Ares Required Minimum Fixed Charge Coverage Ratio is measured on the last day of each calendar month during the Ares Covenant Testing Period (each a “Ares Calculation Date”), and is calculated using the minimum fixed charge coverage ratio for the twelve (12) consecutive months ending on each Ares Calculation Date. The Ares Loan Parties are required to maintain an initial total net leverage ratio of 9.00:1.00, which ratio steps down each fiscal quarter of Legacy RTI resulting in a requirement that the Ares Loan Parties maintain a total net leverage ratio of 3.50:1.00 for the fiscal quarter ending June 30, 2021, and each fiscal quarter ending thereafter.
The amounts owed under the 2019 Credit Agreement may be accelerated upon the occurrence of certain events of default customary for facilities for similarly rated borrowers.
At December 31, 2019, the interest rate for the Ares Term Loan was 10.49%. The Company was in compliance with the financial covenants related to the Ares Term Loan as of December 31, 2019.
For the years ended December 31, 2019, 2018 and 2017, interest expense associated with the amortization of debt issuance costs was $524, $528 and $409, respectively. Included in the year ended December 31, 2019, was $219 of accelerated amortization of debt issuance costs associated with the modification of the 2018 Credit Agreement. For the year ended December 31, 2019, the Company incurred total debt issuance cost of $826.
As of December 31, 2019, the Company had approximately $5,608 of cash and cash equivalents and $9,000 of availability under its revolver agreement.
The Company’s Ares Term Loan and JPM Facility agreements both contain a leverage to EBITDA covenant, which as of December 31, 2019, required the Company to maintain a 5.0:1 leverage to trailing twelve-month adjusted EBITDA ratio. The debt agreement provides for an increase in the covenant ratio to 5.75:1 for each quarter end during 2020, then reduces to 5.25:1 for the quarters ending March 31, 2021 and June 30, 2021, with a final reduction to 3.50 for each quarter ending thereafter. The Company’s leverage ratio as of December 31, 2019 is approximately 4.96:1. If the Company is unable to execute on its acquisition integration plans or achieve its projected growth and cash flow targets, its available liquidity could be further limited, and its operations may lead to defaults under the borrowing agreements. See Note 1.
On April 9, 2020 and on May 8, 2020, the Company received waivers and consent agreements with respect to certain financial statement delivery requirements extending the due dates for delivering the required financial statements under the credit facilities. Further, Pursuant to two Consent Agreements, dated June 1, 2020, one with respect to the JPM Credit Facility and one for the Ares Credit Facility, each of JPM and Ares, respectively, agreed to extend the deadline for the delivery of the fiscal year end 2019 financial statements to June 8, 2020. Further, each of JPM and Ares also agreed to waive the requirement with respect to the going concern qualification.
126
Table of Contents
19. Income Taxes
The Company’s pre-tax income consists of the following components:
| For the Year Ended December 31, | ||||||||||||
| 2019 | 2018 | 2017 | ||||||||||
| Pre-tax income: |
||||||||||||
| Domestic (U.S., state and local) |
$ | (196,426 | ) | $ | (9,052 | ) | $ | 30,121 | ||||
| Foreign |
2,021 | 1,661 | (3,866 | ) | ||||||||
|
|
|
|
|
|
|
|||||||
| Total pre-tax income |
(194,405 | ) | (7,391 | ) | 26,255 | |||||||
|
|
|
|
|
|
|
|||||||
The Company’s income tax benefit (provision) consists of the following components:
| For the Year Ended December 31, | ||||||||||||
| 2019 | 2018 | 2017 | ||||||||||
| Current: |
||||||||||||
| Federal |
$ | 503 | $ | 967 | $ | (2,910 | ) | |||||
| State |
(147 | ) | (205 | ) | (833 | ) | ||||||
| International |
79 | (376 | ) | — | ||||||||
|
|
|
|
|
|
|
|||||||
| Total current |
435 | 386 | (3,743 | ) | ||||||||
|
|
|
|
|
|
|
|||||||
| Deferred: |
||||||||||||
| Federal |
(12,680 | ) | 2,356 | (14,554 | ) | |||||||
| State |
(1,091 | ) | (2,446 | ) | (1,052 | ) | ||||||
| International |
(3,901 | ) | 3,972 | — | ||||||||
|
|
|
|
|
|
|
|||||||
| Total deferred |
(17,672 | ) | 3,882 | (15,606 | ) | |||||||
|
|
|
|
|
|
|
|||||||
| Total income tax (provision) benefit |
$ | (17,237 | ) | $ | 4,268 | $ | (19,349 | ) | ||||
|
|
|
|
|
|
|
|||||||
The Company’s deferred tax assets and liabilities consists of the following components:
| December 31, 2019 | December 31, 2018 | |||||||||||||||
| Deferred Income Tax | Deferred Income Tax | |||||||||||||||
| Assets | Liabilities | Assets | Liabilities | |||||||||||||
| Accounts receivable |
$ | 1,184 | $ | — | $ | 513 | $ | — | ||||||||
| Accrued liabilities |
3,481 | — | 2,358 | — | ||||||||||||
| Deferred compensation |
1,526 | — | 1,372 | — | ||||||||||||
| Fixed assets and intangibles |
15,898 | — | — | (5,862 | ) | |||||||||||
| Inventory |
9,817 | — | 7,631 | — | ||||||||||||
| Net operating losses |
13,242 | — | 8,198 | — | ||||||||||||
| Revenue |
— | (59 | ) | 650 | — | |||||||||||
| Tax credits |
6,372 | — | 5,993 | — | ||||||||||||
| Lease Liability |
708 | — | ||||||||||||||
| Right of Use Asset (Leases) |
— | (558 | ) | |||||||||||||
| Other |
— | (103 | ) | — | — | |||||||||||
| Valuation allowance |
(51,508 | ) | — | (3,093 | ) | — | ||||||||||
|
|
|
|
|
|
|
|
|
|||||||||
| Total |
$ | 720 | $ | (720 | ) | $ | 23,622 | $ | (5,862 | ) | ||||||
|
|
|
|
|
|
|
|
|
|||||||||
On December 22, 2017, the US government enacted the Tax Cuts and Jobs Act of 2017 (the “Tax Legislation”). The Tax Legislation makes broad and complex changes to the U.S. tax code including, but not limited to the following:
| • | Reduction of the U.S. federal corporate tax rate from 35% to 21% |
| • | Requiring a transition tax on certain unrepatriated earnings of foreign subsidiaries |
| • | Bonus depreciation that will allow for full expensing of qualified property |
| • | Elimination of the corporate alternative minimum tax |
| • | The repeal of the domestic production activity deduction |
| • | Limitations on the deductibility of certain executive compensation |
| • | Limitations on net operating losses generated after December 31, 2017 |
127
Table of Contents
In addition, beginning in 2018, the Tax Legislation includes a global intangible low-taxed income (“GILTI”) provision, which requires a tax on foreign earnings in excess of a deemed return on tangible assets of foreign subsidiaries. The Company has elected an accounting policy to account for GILTI as a period cost if incurred, rather than recognizing deferred taxes for temporary basis differences expected to reverse as a result of GILTI.
On December 22, 2017, the SEC staff issued SAB 118, which provides guidance on accounting for the tax effects of the Tax Legislation. SAB 118 provides a measurement period that should not extend beyond one year from the Tax Legislation enactment date for companies to complete the accounting under ASC 740.
In 2018, the Company completed its accounting for the tax effects of the Tax Legislation. As a result, in 2018 the Company recorded a tax benefit of $650, and in 2017, the Company recorded a tax provision of $2,187, relating to the revaluation of deferred tax assets and transition tax.
Valuation allowances are established when necessary to reduce deferred tax assets to amounts which are more likely than not to be realized. As such, valuation allowances of $51,508 and $3,093 have been established at December 31, 2019 and December 31, 2018, respectively, against a portion of the deferred tax assets.
As of December 31, 2019, the Company has U.S. federal net operating loss carryforwards of $9,911 that will expire in years 2026 through 2037. In addition, the Company has U.S. federal net operating loss carryforwards of $21,950 that will carryforward indefinitely. As of December 31, 2019, the Company has U.S. state net operating loss carryforwards of $51,626, of which, $48,143 will expire in the years 2022 through 2039, and $3,443 will carryforward indefinitely. As of December 31, 2019, the Company has foreign net operating loss carryforwards of $13,496 that will carryforward indefinitely.
As of December 31, 2019, the Company has research tax credit carryforwards of $7,111 that will expire in years 2029 through 2038.
U.S. income taxes have not been provided on the undistributed earnings of the Company’s foreign subsidiaries. It is not practicable to estimate the amount of tax that might be payable. The Company’s intention is to indefinitely reinvest earnings of its foreign subsidiaries outside of the U.S.
The Company evaluates the need for deferred tax asset valuation allowances based on a more likely than not standard. The ability to realize deferred tax assets depends on the ability to generate sufficient taxable income within the carryback or carryforward periods provided for in the tax law for each applicable tax jurisdiction.
The Company has evaluated all evidence, both positive and negative, and determined that its deferred tax assets are not more likely than not to be realized as of December 31, 2019. Accordingly, the Company has recorded a valuation allowance in the amount of $51,508 as of December 31, 2019. In making this determination, numerous factors were considered including the going-concern evaluation.
As of December 31, 2019, the Company has $1,088 of unrecognized tax benefits, which was recorded net against deferred tax assets in the accompanying consolidated balance sheet.
128
Table of Contents
The Company’s unrecognized tax benefits are summarized as follows:
| For the Year Ended December 31, | ||||||||||||
| 2019 | 2018 | 2017 | ||||||||||
| Opening balance |
$ | 1,088 | $ | 1,591 | $ | 1,591 | ||||||
| Reductions based on tax positions related to the current year |
— | — | — | |||||||||
| Additions for tax positions of prior years |
— | — | — | |||||||||
| Reductions for tax positions of prior years |
— | (415 | ) | — | ||||||||
| Reductions for expiration of statute of limitations |
— | (88 | ) | — | ||||||||
|
|
|
|
|
|
|
|||||||
| $ | 1,088 | $ | 1,088 | $ | 1,591 | |||||||
|
|
|
|
|
|
|
|||||||
The unrecognized tax benefits if recognized, would favorably impact the Company’s effective tax rate.
The Company’s policy is to recognize interest accrued related to unrecognized tax benefits in interest expense and penalties in the provision for income taxes. Interest and penalties recorded in 2019, 2018 and 2017 and interest and penalties accrued at December 31, 2019 and 2018 were inconsequential.
During the year ended December 31, 2018, the Internal Revenue Service (the “IRS”) completed its examination of the Company’s 2015 U.S. federal income tax return. No material adjustments were recorded to the Company’s consolidated financial statements as a result of the examination.
The effective tax rate differs from the statutory federal income tax rate for the following reasons:
| For the Year Ended December 31, |
||||||||||||
| 2019 | 2018 | 2017 | ||||||||||
| Statutory federal rate |
21.00 | % | 21.00 | % | 35.00 | % | ||||||
| State income taxes—net of federal tax benefit |
(1.31 | %) | (4.58 | %) | 2.37 | % | ||||||
| Foreign rate differential |
— | 14.36 | % | 2.54 | % | |||||||
| Acquisition expenses |
— | (7.26 | %) | — | ||||||||
| Gain on acquisition contingency |
8.23 | % | — | — | ||||||||
| Goodwill impairment and disposal |
(14.86 | %) | — | 11.52 | % | |||||||
| Life insurance |
— | (0.98 | %) | (1.38 | %) | |||||||
| Officer compensation |
— | (7.88 | %) | 4.18 | % | |||||||
| Stock-based compensation |
— | (3.90 | %) | 6.06 | % | |||||||
| Tax credits |
0.07 | % | 8.65 | % | (4.53 | %) | ||||||
| Tax legislation |
— | 9.23 | % | 8.33 | % | |||||||
| Valuation allowances |
(21.25 | %) | 21.93 | % | 6.08 | % | ||||||
| Uncertain tax positions |
— | 6.86 | % | — | ||||||||
| Other reconciling items, net |
(0.75 | %) | 0.32 | % | 3.52 | % | ||||||
|
|
|
|
|
|
|
|||||||
| Effective tax rate |
(8.87 | %) | 57.75 | % | 73.69 | % | ||||||
|
|
|
|
|
|
|
|||||||
129
Table of Contents
20. Preferred Stock
Preferred stock is as follows:
| Preferred Stock Liquidation Value |
Preferred Stock Issuance Costs |
Net Total |
||||||||||
| Balance at January 1, 2017 |
$ | 60,676 | $ | (660 | ) | $ | 60,016 | |||||
| Accrued dividend |
3,723 | — | 3,723 | |||||||||
| Amortization of preferred stock issuance costs |
— | 184 | 184 | |||||||||
|
|
|
|
|
|
|
|||||||
| Balance at December 31, 2017 |
64,399 | (476 | ) | 63,923 | ||||||||
| Accrued dividend |
2,120 | — | 2,120 | |||||||||
| Amortization of preferred stock issuance costs |
— | 183 | 183 | |||||||||
|
|
|
|
|
|
|
|||||||
| Balance at December 31, 2018 |
66,519 | (293 | ) | 66,226 | ||||||||
| Accrued dividend |
— | — | — | |||||||||
| Amortization of preferred stock issuance costs |
— | 184 | 184 | |||||||||
|
|
|
|
|
|
|
|||||||
| Balance at December 31, 2019 |
$ | 66,519 | $ | (109 | ) | $ | 66,410 | |||||
|
|
|
|
|
|
|
|||||||
On June 12, 2013, the Company and WSHP Biologics Holdings, LLC, an affiliate of Water Street Healthcare Partners, a leading healthcare-focused private equity firm (“Water Street”), entered into an investment agreement. Pursuant to the terms of the investment agreement, the Company issued $50,000 of convertible preferred equity to Water Street in a private placement which closed on July 16, 2013, with preferred stock issuance costs of $1,290. The preferred stock accrues dividends at a rate of 6% per annum. To the extent dividends are not paid in cash in any quarter, the dividends which have accrued on each outstanding share of preferred stock during such three-month period will accumulate until paid in cash or converted to common stock.
The preferred stock will be convertible at the election of the holders into shares of the Company’s common stock at an initial conversion price of $4.39 per share which would result in a conversion ratio of approximately 228 shares of common stock for each share of preferred stock. The preferred stock is convertible at the election of the Company five years after its issuance or at any time if the Company’s common stock closes at or above $7.98 per share for at least 20 consecutive trading days.
The Company may, upon 30 days’ notice, redeem the preferred stock, in whole or in part, five years after its issuance at the initial liquidation preference of $1,000 per share of the preferred stock plus an amount per share equal to accrued but unpaid dividends (collectively, the “Liquidation Value”). The holders of the preferred stock may require the Company to redeem their preferred stock, in whole or in part, at the Liquidation Value seven years after its issuance or upon the occurrence of a change of control.
On August 1, 2018, the Company and WSHP Biologics Holdings, LLC, a related party, entered into an Amended and Restated Certificate of Designation of Series A Convertible Preferred Stock of RTI Surgical, Inc. (the “Amended and Restated Certificate of Designation”). Pursuant to the Amended and Restated Certificate of Designation: (1) dividends on the Series A Preferred Stock will not accrue after July 16, 2018 (in the event of a default by the Company, dividends will begin accruing and will continue to accrue until the default is cured); (2) the Company may not force a redemption of the Series A Preferred Stock prior to July 16, 2020; and (3) the holders of the Series A Preferred Stock may not convert the Series A Preferred Stock into common stock prior to July 16, 2021 (with certain exceptions). The Company evaluated and concluded on a qualitative basis that the amendment qualifies as modification accounting to the preferred shares, which did not result in a change in the valuation of the shares.
21. Stockholders’ Equity
Preferred Stock—The Company has 5,000,000 shares of preferred stock authorized under its Certificate of Incorporation of which 50,000 are currently issued and outstanding. These shares may be issued in one or more series having such terms as may be determined by the Company’s Board of Directors.
Common Stock—The Company has 150,000,000 shares of common stock authorized. The common stock’s voting, dividend, and liquidation rights presently are subject to or qualified by the rights of the holders of any outstanding shares of preferred stock. Holders of common stock are entitled to one vote for each share held at all stockholder meetings. Shares of common stock do not have redemption rights. The Company is, and may in the future become, party to agreements and instruments that restrict or prevent the payment of dividends on our capital stock.
130
Table of Contents
22. Executive Transition Costs
The Company recorded Chief Executive Officer retirement and transition costs related to the retirement of our former Chief Executive Officer pursuant to the Executive Transition Agreement dated August 29, 2012 (as amended and extended to date), which resulted in $4,404 of expenses for the year ended December 31, 2016. The total Chief Executive Officer retirement and transition costs were paid in full in 2019. In addition, the Company recorded executive transition costs of $2,818 as a result of hiring a new Chief Executive Officer and Chief Financial and Administrative Officer for the year ended December 31, 2017, separately disclosed on the Consolidated Statements of Comprehensive (Loss) Income. The total executive transition costs of $1,169 which is cash basis was paid in full in 2018. The following table includes a rollforward of executive transition costs included in accrued expenses, see Note 16.
| Accrued executive transition costs at January 1, 2017 |
$ | 2,406 | ||
| Executive transition costs accrued in 2017 |
2,818 | |||
| Stock-based compensation |
(1,612 | ) | ||
| Cash payments |
(1,275 | ) | ||
|
|
|
|||
| Accrued executive transition costs at December 31, 2017 |
2,337 | |||
|
|
|
|||
| Executive transition costs accrued in 2018 |
— | |||
| Cash payments |
(2,294 | ) | ||
|
|
|
|||
| Accrued executive transition costs at December 31, 2018 |
43 | |||
|
|
|
|||
| Executive transition costs accrued in 2019 |
— | |||
| Cash payments |
(43 | ) | ||
|
|
|
|||
| Accrued executive transition costs at December 31, 2019 |
$ | — | ||
|
|
|
23. Severance and Restructuring Costs
The Company recorded severance and restructuring costs related to the reduction of our organizational structure which resulted in $12,016 of expenses for the year ended December 31, 2017. The total severance and restructuring costs were paid in full in 2018. Severance and restructuring payments were made over periods ranging from one month to twelve months and did not have a material impact on cash flows of the Company in any quarterly period.
The Company recorded severance and restructuring costs related to the reduction of our organizational structure which resulted in $2,808 of expenses for the year ended December 31, 2018. The total severance and restructuring costs were paid in full in 2019. Severance and restructuring payments were made over periods ranging from one month to twelve months and did not have a material impact on cash flows of the Company in any quarterly period.
As part of the acquisition of Paradigm, management implemented a plan which resulted in $896 of severance expenses for the year ended December 31, 2019. Paradigm severance expenses were offset by previous severance accrual activity and are included in the acquisition and integration expenses within the Consolidated Statements of Comprehensive (Loss) Gain, totaling $626 for the year ended December 31, 2019. The total severance and restructuring costs were paid in full in of 2019. Severance and restructuring payments were made over periods ranging from one month to twelve months and did not have a material impact on cash flows of the Company in any quarterly period.
131
Table of Contents
The following table includes a rollforward of severance and restructuring costs included in accrued expenses, see Note 16.
| Accrued severance and restructuring charges at January 1, 2017 |
$ | 505 | ||
| Severance and restructuring expenses accrued in 2017 |
12,016 | |||
| Severance and restructuring cash payments |
(8,246 | ) | ||
| Stock based compensation |
(1,153 | ) | ||
|
|
|
|||
| Accrued severance and restructuring charges at December 31, 2017 |
3,122 | |||
|
|
|
|||
| Severance and restructuring expenses accrued in 2018 |
2,808 | |||
| Severance and restructuring cash payments |
(4,628 | ) | ||
|
|
|
|||
| Accrued severance and restructuring charges at December 31, 2018 |
1,302 | |||
|
|
|
|||
| Severance and restructuring expenses accrued in 2019 |
626 | |||
| Severance and restructuring cash payments |
(1,792 | ) | ||
|
|
|
|||
| Accrued severance and restructuring charges at December 31, 2019 |
$ | 136 | ||
|
|
|
24. Retirement Benefits
The Company has a qualified 401(k) plan available to all U.S. employees who meet certain eligibility requirements. The 401(k) plan allows each employee to contribute up to the annual maximum allowed under the Internal Revenue Code. The Company has the discretion to make matching contributions up to 6% of the employee’s earnings. For the years ended December 31, 2019, 2018 and 2017, the amounts expensed under the plan were $3,007, $2,757 and $3,036, respectively.
25. Concentrations of Risk
Distribution—The Company’s principal concentration of risk is related to its limited distribution channels. The Company’s revenues include the distribution efforts of fourteen independent companies with significant revenues coming from three of the distribution companies, Zimmer Biomet Holdings Inc. (“Zimmer”), Medtronic, PLC (“Medtronic”) and DePuy Synthes (“Synthes”), a Johnson & Johnson Inc. subsidiary. The following table presents percentage of total revenues derived from the Company’s largest distributors:
| For the Year Ended December 31, | ||||||||||||
| 2019 | 2018 | 2017 | ||||||||||
| Percent of revenues derived from: |
||||||||||||
| Distributor |
||||||||||||
| Zimmer |
18 | % | 21 | % | 17 | % | ||||||
| Medtronic |
7 | % | 8 | % | 9 | % | ||||||
| Synthes |
4 | % | 5 | % | 4 | % | ||||||
The Company’s distribution agreements are subject to termination by either party for a variety of causes. No assurance can be given that such distribution agreements will be renewed beyond their expiration dates, continue in their current form or at similar rate structures. Any termination or interruption in the distribution of the Company’s implants through one of its major distributors could have a material adverse effect on the Company’s operations.
Tissue Supply—The Company’s operations are dependent on the availability of tissue from human donors. For all of the tissue recoveries, the Company relies on the efforts of independent procurement agencies to educate the public and increase the willingness to donate bone tissue. These procurement agencies may not be able to obtain sufficient tissue to meet present or future demands. Any interruption in the supply of tissue from these procurement agencies could have a material adverse effect on the Company’s operations.
26. Commitments and Contingencies
Agreement to Acquire Paradigm – On March 8, 2019, pursuant to the Master Transaction Agreement, the Company acquired Paradigm in a cash and stock transaction valued at up to $300,000, consisting of $150,000 on March 8, 2019, plus potential future milestone payments. Established in 2005, Paradigm’s primary product is the coflex® Interlaminar Stabilization® device, a differentiated and minimally invasive motion preserving stabilization implant that is FDA premarket approved for the treatment of moderate to severe lumbar spinal stenosis in conjunction with decompression.
132
Table of Contents
Under the terms of the agreement, the Company paid $100,000 in cash and issued 10,729,614 shares of the Company’s common stock. The shares of Company common stock issued on March 8, 2019, were valued based on the volume weighted average closing trading price for the five trading days prior to the date of execution of the definitive agreement, representing $50,000 of value. In addition, the Company may be required to pay up to an additional $150,000 in a combination of cash and Company common stock based on a revenue earnout consideration. Based on a probability weighted model, the Company estimates a contingent liability related to the revenue based earnout of zero.
Acquisition of Zyga – On January 4, 2018, the Company acquired Zyga, a leading spine-focused medical device company that develops and produces innovative minimally invasive devices to treat underserved conditions of the lumbar spine. Zyga’s primary product is the SImmetry® Sacroiliac Joint Fusion System. Under the terms of the merger agreement dated January 4, 2018, the Company acquired Zyga for $21,000 in consideration paid at closing (consisting of borrowings of $18,000 on its revolving credit facility and $3,000 cash on hand), $1,000 contingent upon the successful achievement of a clinical milestone, and a revenue based earnout consideration of up to an additional $35,000. Based on a probability weighted model, the Company estimates a contingent liability related to the clinical and revenue milestones of $1,130.
Distribution Agreement with A&E – On August 3, 2017, the Company completed the sale of substantially all of the assets related to its CT Business to A&E pursuant to an Asset Purchase Agreement between the Company and A&E (the “Asset Purchase Agreement”). The total cash consideration received by the Company under the Asset Purchase Agreement was composed of $54,000. $3,000 of which was held in escrow (the “Escrow Amount”) to satisfy possible indemnification obligations, of which there were none. As such, the Company earned and received the $3,000 cash consideration in the third quarter of 2018. An additional $5,000 in contingent cash consideration is earned if A&E reaches certain revenue milestones (the “Contingent Consideration”). The Company also earned and received an additional $1,000 in consideration for successfully obtaining certain FDA regulatory clearance. As a part of the transaction, the Company also entered into a multi-year Contract Manufacturing Agreement with A&E (the “Contract Manufacturing Agreement”). Under the Contract Manufacturing Agreement, the Company agreed to continue to support the CT Business by manufacturing existing products and engineering, developing, and manufacturing potential future products for A&E. The Company elected to account for the Contingent Consideration arrangement including the Escrow Amount, as a gain contingency in accordance with ASC 450 Contingencies. As such, the Contingent Consideration and Escrow Amount were excluded in measuring the fair value of the consideration to be received in connection with the transaction.
Distribution Agreement with Medtronic – On October 12, 2013, the Company entered into a replacement distribution agreement with Medtronic, plc. (“Medtronic”), pursuant to which Medtronic will distribute certain allograft implants for use in spinal, general orthopedic and trauma surgery. Under the terms of this distribution agreement, Medtronic will be a non-exclusive distributor except for certain specified implants for which Medtronic will be the exclusive distributor. Medtronic will maintain its exclusivity with respect to these specified implants unless the cumulative fees received by us from Medtronic for these specified implants decline by a certain amount during any trailing 12-month period. The initial term of this distribution agreement was to have been through December 31, 2017. The term automatically renews for successive five-year periods, unless either party provides written notice of its intent not to renew at least one year prior to the expiration of the initial term or the applicable renewal period. Neither party provided notice of non-renewal on or before December 31, 2016, thereby triggering the five-year automatic renewal period upon the expiration of the initial term. The distribution agreement will therefore continue at least through December 31, 2022.
Distribution Agreement with Zimmer Dental Inc.—On September 3, 2010, the Company entered into an exclusive distribution agreement with Zimmer Dental, Inc. (“Zimmer Dental”), a subsidiary of Zimmer, with an effective date of September 30, 2010, as amended from time to time. The Agreement was assigned to Biomet 3i, LLC (“Biomet”), an affiliate of Zimmer Dental, on January 1, 2016. The Agreement has an initial term of ten years. Under the terms of this distribution agreement, the Company agreed to supply sterilized allograft and xenograft implants at an agreed upon transfer price, and Biomet agreed to be the exclusive distributor of the implants for dental and oral applications worldwide (except Ukraine), subject to certain Company obligations under an existing distribution agreement with a third party with respect to certain implants for the dental market. In consideration for Biomet’s exclusive distribution rights, Biomet agreed to the following: 1) payment to the Company of $13,000 within ten days of the effective date (the “Upfront Payment”); 2) annual exclusivity fees (“Annual Exclusivity Fees”) paid annually as long as Biomet maintains exclusivity for the term of the contract to be paid at the beginning of each calendar year; and 3) annual purchase minimums to maintain exclusivity. Upon occurrence of an event that materially and adversely affects Biomet’s ability to distribute the implants, Biomet may be entitled to certain refund rights with respect to the then current Annual Exclusivity Fee, where such refund would be in an amount limited by a formula specified in this agreement that is based substantially on the occurrence’s effect on Biomet’s revenues. The Upfront Payment, the Annual Exclusivity Fees and the fees associated with distributions of processed tissue are considered to be a single performance obligation. Accordingly, the Upfront Payment and the Annual Exclusivity Fees are deferred as received and are being recognized as other revenues over the term of this distribution agreement based on the expected contractual annual purchase minimums relative to the total contractual minimum purchase requirements in this distribution agreement. Additionally, the Company considered the potential impact of this distribution agreement’s contractual refund provisions and does not expect these provisions to impact future expected revenue related to this distribution agreement.
The Company’s aforementioned revenue recognition methods related to the Zimmer distribution agreements do not result in the deferral of revenue less than amounts that would be refundable in the event the agreements were to be terminated in future periods. Additionally, the Company evaluates the appropriateness of the aforementioned revenue recognition methods on an ongoing basis.
133
Table of Contents
27. Legal and Regulatory Actions
The Company is, from time to time, involved in litigation relating to claims arising out of its operations in the ordinary course of business. Based on the information currently available to the Company, the Company does not believe that any of these claims that were outstanding as of December 31, 2019 will have a material adverse impact on its financial position or results of operations. The Company’s accounting policy is to accrue for legal costs as they are incurred.
Coloplast — The Company is presently named as co-defendant along with other companies in a small percentage of the transvaginal surgical mesh (“TSM”) mass tort claims being brought in various state and federal courts. The TSM litigation has as its catalyst various Public Health Notifications issued by the FDA with respect to the placement of certain TSM implants that were the subject of 510k regulatory clearance prior to their distribution. The Company does not process or otherwise manufacture for distribution in the U.S. any implants that were the subject of these FDA Public Health Notifications. The Company denies any allegations against it and intends to continue to vigorously defend itself.
In addition to claims made directly against the Company, Coloplast, a distributor of TSM’s and certain allografts processed and private labeled for them under a contract with the Company, has also been named as a defendant in individual TSM cases in various federal and state courts. Coloplast requested that the Company indemnify or defend Coloplast in those claims which allege injuries caused by the Company’s allograft implants, and on April 24, 2014, Coloplast sued RTI Surgical, Inc. in the Fourth Judicial District of Minnesota for declaratory relief and breach of contract. On December 11, 2014, Coloplast entered into a settlement agreement with RTI Surgical, Inc. and Tutogen Medical, Inc. (the “Company Parties”) resulting in dismissal of the case. Under the terms of the settlement agreement, the Company Parties are responsible for the defense and indemnification of two categories of present and future claims: (1) tissue only (where Coloplast is solely the distributor of Company processed allograft tissue and no Coloplast-manufactured or distributed synthetic mesh is identified) (“Tissue Only Claims”), and (2) tissue plus non-Coloplast synthetic mesh (“Tissue-Non-Coloplast Claims”) (the Tissue Only Claims and the Tissue-Non-Coloplast Claims being collectively referred to as “Indemnified Claims”). As of December 31, 2019, there are a cumulative total of 1,139 Indemnified Claims for which the Company Parties are providing defense and indemnification. The defense and indemnification of these cases are covered under the Company’s insurance policy subject to a reservation of rights by the insurer.
Based on the current information available to the Company, the impact that current or any future TSM litigation may have on the Company cannot be reasonably estimated.
LifeNet — On June 27, 2018, LifeNet Health, Inc. (“LifeNet”) filed a patent infringement lawsuit in the United States District Court for the Middle District of Florida (since moved to the Northern District of Florida) claiming infringement of five of its patents by the Company. The suit requests damages, enhanced damages, reimbursement of costs and expenses, reasonable attorney fees, and an injunction. The asserted patents are now expired. On April 7, 2019, the Court granted the Company’s request to stay the lawsuit pending the U.S. Patent Trial and Appeal Board’s (PTAB) decision whether to institute review of the patentability of LifeNet’s patents. On August 12, 2019 the PTAB instituted review of three LifeNet patents, and on September 3 the PTAB instituted review of the remaining two. Final decisions with respect to the patentability of LifeNet’s patents (which may be appealed by either party) is expected to take place in the second half of 2020. The Company continues to believe the suit is without merit and will vigorously defend its position.
SEC Investigation — As previously disclosed in the RTI’s Current Report on Form 8-K filed with the SEC on March 16, 2020, the Audit Committee of the Board of Directors of RTI, with the assistance of independent legal and forensic accounting advisors, conducted an internal investigation of matters relating to the Company’s revenue recognition practices for certain contractual arrangements, primarily with OEM customers, including the accounting treatment, financial reporting and internal controls related to such arrangements (the “Investigation”). The Investigation was precipitated by an investigation by the SEC initially related to the periods 2014 through 2016. The SEC investigation is ongoing, and the Company is cooperating with the SEC in its investigation. Based on the current information available to the Company the financial or other impact of the Investigation cannot be reasonably determined.
28. Quarterly Results of Operations (Unaudited)
The following tables sets forth the results of operations for the periods indicated (The quarterly results of operations for the years ended December 31, 2019 and 2018 reflects our adoption of FASB ASU 2014-09, Revenue from Contracts with Customers (Topic 606). We have not adjusted the quarterly results of operations for any other period or as of any other date presented. See Note 6, Revenue from Contracts with Customers.
134
Table of Contents
| Year Ended December 31, 2019 | ||||||||||||||||
| First Quarter |
Second Quarter |
Third Quarter |
Fourth Quarter |
|||||||||||||
| (as restated) | (as restated) | (as restated) | ||||||||||||||
| Revenues |
$ | 70,021 | $ | 81,554 | $ | 76,741 | $ | 80,068 | ||||||||
| Gross profit |
37,886 | 46,124 | 43,223 | 43,891 | ||||||||||||
|
|
|
|
|
|
|
|
|
|||||||||
| Net (loss) income |
(9,352 | ) | 188 | (5,138 | ) | (197,340 | ) | |||||||||
|
|
|
|
|
|
|
|
|
|||||||||
| Net (loss) income per common share - basic |
$ | (0.14 | ) | $ | 0.00 | $ | (0.07 | ) | $ | (2.63 | ) | |||||
|
|
|
|
|
|
|
|
|
|||||||||
| Net (loss) income per common share - diluted |
$ | (0.14 | ) | $ | 0.00 | $ | (0.07 | ) | $ | (2.63 | ) | |||||
|
|
|
|
|
|
|
|
|
|||||||||
| Year Ended December 31, 2018 | ||||||||||||||||
| First Quarter |
Second Quarter |
Third Quarter |
Fourth Quarter |
|||||||||||||
| Revenues |
$ | 69,141 | $ | 70,385 | $ | 70,450 | $ | 70,386 | ||||||||
| Gross profit |
33,503 | 29,899 | 38,228 | 38,013 | ||||||||||||
|
|
|
|
|
|
|
|
|
|||||||||
| Net (loss) income |
(1,117 | ) | (5,802 | ) | 2,997 | 799 | ||||||||||
|
|
|
|
|
|
|
|
|
|||||||||
| Net (loss) income per common share - basic |
$ | (0.03 | ) | $ | (0.11 | ) | $ | 0.04 | $ | 0.01 | ||||||
|
|
|
|
|
|
|
|
|
|||||||||
| Net (loss) income per common share - diluted |
$ | (0.03 | ) | $ | (0.11 | ) | $ | 0.04 | $ | 0.01 | ||||||
|
|
|
|
|
|
|
|
|
|||||||||
29. Subsequent Events
The Company evaluated subsequent events as of the issuance date of the consolidated financial statements as defined by FASB ASC 855, Subsequent Events.
Sale of OEM Business
On January 13, 2020, we entered into an Equity Purchase Agreement, as amended by that certain First Amendment to Equity Purchase Agreement dated as of March 6, 2020, and that certain Second Amendment to Equity Purchase Agreement dated as of April 27, 2020 (as amended, the “OEM Purchase Agreement”), with Ardi Bidco Ltd., a Delaware corporation and an entity affiliated with Montagu Private Equity LLP (“Montagu”), for the sale (the “Sale”) of the RTI’s business of: (a) providing original equipment manufacturing (“OEM”), including the design, development and manufacture, of private label and custom biological-, metal- and polymer-based implants and instruments that are used in spine, sport medicine, plastic and reconstructive, urology, gynecology and trauma surgical procedures, and (b)processing donated human musculoskeletal and other tissue and bovine and porcine animal tissue in producing allograft and xenograft implants using BIOCLEANSE®, TUTOPLAST® and CANCELLE® SP sterilization processes (i) as represented by RTI’s “Sports” line of business and (ii) as otherwise described in RTI Surgical, Inc.’s Annual Report on Form 10-K for the year ended December 31, 2018, filed with the SEC on March 5, 2019, in each case for clauses (a) and (b), as currently produced at RTI’s facilities in Alachua, Florida; Marquette, Michigan; Greenville, North Carolina; and Tutogen Medical GmbH’s facility in Neunkirchen, Germany (together, the “OEM Business”; provided that the “OEM Business” shall not be deemed to include the marketing, sale or direct distribution of surgical implants, instruments, or biologics used in the treatment of conditions affecting the spine (x) as represented by RTI’s “Spine” or “International” lines of business and (y) as otherwise described in RTI Surgical, Inc.’s Annual Report on Form 10-K for the year ended December 31, 2018, filed with the SEC on March 5, 2019), for a purchase price of $440,000, subject to certain adjustments. More specifically, pursuant to the terms of the OEM Purchase Agreement, the Company will sell all of the issued and outstanding shares of RTI OEM, LLC (which, prior to the Sale, is required to convert to a corporation and change its name to “RTI Surgical, Inc.”), Tutogen Medical (United States), Inc. and Tutogen Medical GmbH (the “OEM Companies” and, together with a wholly-owned subsidiary, RTI Donor Services, Inc., the “OEM Group Companies”).
135
Table of Contents
The OEM Purchase Agreement contemplates that, prior to the closing (the “OEM Closing”) of the Sale and each of the agreements ancillary to the OEM Purchase Agreement, (the “Contemplated Transactions”), we will undergo an internal reorganization, pursuant to which, in addition to certain inter-company transfers and mergers, the Company and its subsidiaries will transfer to the OEM Group Companies the assets primarily used in the operation of the OEM Business and the OEM Group Companies will assume certain liabilities that are related to the OEM Business (collectively, the “Reorganization”). In addition to the Reorganization, RTI is required to use reasonable best efforts to separate the assets and liabilities of the U.S. “metals” business and the U.S. “biologics” business into two separate companies prior to the OEM Closing. As part of such separation, another subsidiary of RTI, established to hold the assets and liabilities of the U.S. “metals” business, will constitute an OEM Company and be sold as part of the Contemplated Transactions to an affiliate of the Buyer. The affiliate of the Buyer established for this purpose would be an additional “Buyer” under the OEM Purchase Agreement.
The Contemplated Transactions are subject to customary closing conditions, including, among other things, the approval of the Contemplated Transactions by the Company’s stockholders. The parties currently expect to close the Contemplated Transactions in the third quarter of 2020. Following the OEM Closing, the Company will focus exclusively on the design, development and distribution of spinal implants to the global market.
Financing
Third Amendment to Credit Agreement and Joinder Agreement
On April 9, 2020, Legacy RTI entered into a Consent and Third Amendment to Credit Agreement and Joinder Agreement (the “Third Amendment to the 2018 Credit Agreement”), by and among the JPM Loan Parties and the JPM Lenders. The Third Amendment to the 2018 Credit Agreement amended the 2018 Credit Agreement by: (i) extending the deadline for delivery of certain annual audited financial statements of the Company from March 30, 2020 to April 30, 2020, (ii) modifying certain interest rates contained therein to contain a 1.00% floor, (iii) requiring the Company and each other Loan Party to close all of its deposit accounts and securities accounts at Wells Fargo Bank, N.A. or any affiliates thereof, and (iv) making certain other changes to the 2018 Credit Agreement consistent with the foregoing.
Fourth Amendment to Credit Agreement and Joinder Agreement
On April 27, 2020, Legacy RTI entered into a Fourth Amendment to Credit Agreement (the “Fourth Amendment to the 2018 Credit Agreement”), by and among the JPM Loan Parties and the JPM Lenders. The Fourth Amendment to the 2018 Credit Agreement amends the 2018 Agreement to: (i) provide for a $8,000 block on availability under the 2018 Credit Agreement until the earlier of: (a) the date upon which at least $25,000 of the Second Amendment Incremental Term Loan Commitments (as defined below) have been funded to Legacy RTI in accordance with the 2019 Credit Agreement and evidence of such funding, in form and substance satisfactory to JPM, shall have been received by JPM.; and (b) the date upon which (1) no default or event of default exists under the 2018 Credit Agreement; and (2) Ares notifies Legacy RTI that, for any reason, Second Amendment Incremental Term Loan Commitments have been terminated in accordance with the terms of the 2019 Credit Agreement and evidence of such termination, in form and substance satisfactory to JPMorgan Chase Bank, N.A., shall have been delivered to JPM; (ii) amend the applicable rate with respect to any loan to 2.75% per annum; and (iii) amend the maturity date to the earlier to occur of: (a) June 5, 2023, or any earlier date on which the commitments are reduced to zero or otherwise terminated pursuant to the terms of the 2018 Credit Agreement; and (b) the date that is 30 days prior to the maturity date of the Second Amendment Incremental Term Loan Commitments, as the same may be extended from time to time pursuant to the terms of the 2019 Credit Agreement and such extension is agreed to by the JPM Lenders.
First Amendment to Second Lien Credit Agreement
On March 3, 2020, the Company entered into a First Amendment to Second Lien Credit Agreement, dated March 3, 2020 (the “2020 First Amendment”), by and among the Ares Loan Parties and the Ares Lenders. The 2020 First Amendment amended the 2019 Credit Agreement: (a) amending the definition of “EBITDA” contained therein; (b) modifying the total net leverage ratio covenant contained therein; and (c) making certain other changes to the 2019 Credit Agreement consistent with the foregoing. These amendments will allow the Company to, among other things, support the investment being made to separate the OEM and Spine businesses in anticipation of the sale of the Company’s OEM business.
136
Table of Contents
Second Amendment to Second Lien Credit Agreement
On April 27, 2020, the Company entered into a Second Amendment to Second Lien Credit Agreement (the “Second Amendment to the 2019 Agreement”), by and among the Ares Loan Parties and the Ares Lenders. The Second Amendment to the 2019 Agreement amended the 2019 Credit Agreement to: (i) establish an incremental term loan commitment; (ii) provide for certain incremental term loans in an aggregate principal amount not to exceed $30,000 (the “Second Amendment Incremental Loan Commitments”); (iii) provide for a portion of the Second Amendment Incremental Loan Commitments up to $13,500 be available on a delayed-draw basis at any time after the effective date of the Ares Amendment and on or prior to August 31, 2020, subject to certain conditions; iv) increase the Base Rate applicable margin with respect to all Term Loans (other than the Second Amendment Incremental Term Loans) to 12.5% effective on September 1, 2020; and (v) make certain other changes to the 2019 Credit Agreement consistent with the foregoing. Pursuant to the terms of the Ares Amendment, Legacy RTI agreed pay to Ares, for the ratable benefit of each incremental term lender, a fee in an amount equal to 5.0% of the principal amount of the incremental term loan commitments provided by such lender on the effective date of the Ares Amendment. The maturity of the loans advanced under the Second Amendment Incremental Term Commitments (the “Second Amendment Incremental Term Loans”) have a maturity date of April 27, 2021. The Second Amendment Incremental Term Loans must be repaid in their entirety, at which time a takeout fee ranging from $11,250 to $25,500 shall be due and payable (the “Takeout Fee”). The Takeout Fee is inclusive of all interest accruing due and payable with respect to the Second Amendment Incremental Term Loans. The interest rate on the Second Amendment Incremental Term Loans is 12.50% and, commencing on September 1, 2020 and on the first day of each of the next four calendar months thereafter, the interest in respect of the Second Amendment Incremental Term Loans shall increase on each such date, on a cumulative basis, by an additional 1.00% per annum (such that, after the fifth such increase, the Base Rate with respect to the Second Amendment Incremental Term Loans shall equal 17.50% per annum).
COVID-19
The COVID-19 pandemic has directly and indirectly adversely impacted the Company’s business, financial condition and operating results. The extent to which these adverse impacts will continue will depend on numerous evolving factors that are highly uncertain, rapidly changing and cannot be predicted with precision or certainty at this time. The spread of COVID-19 has caused many hospitals and other healthcare providers to refocus their care on the surge of the COVID-19 cases and to postpone elective and non-emergent procedures, restrict access to these facilities, and in some cases re-allocate scarce resources to their critically ill patients.
These efforts have impacted and could continue to impact our business activities, including our product sales, as many of our products are used in connection with elective surgeries. Many of our employees have been furloughed and although our operations are beginning to increase towards normal levels, we continue to have many employees working remotely. Additionally, these measures are hindering our ability to recruit, vet and hire personnel for key positions. It is unknown how long these disruptions could continue. Due to the challenges created by the furloughs and remote working conditions, on May 11, 2020, we filed a Current Report on Form 8-K to avail ourselves to an extension to file our Quarterly Report on Form 10-Q for the quarterly period ended March 31, 2020, originally due on May 11, 2020, relying on an order issued by the Securities and Exchange Commission on March 25, 2020 pursuant to Section 36 of the Securities Exchange Act of 1934, as amended (Release No. 34-88465), regarding exemptions granted to certain public companies.
As noted above, our product sales have been materially reduced as a result of COVID-19. While we are continuing to monitor and evaluate the impact on our business of COVID-19, we have not at this point identified any material impairments, increases in allowances for credit losses, restructuring charges, other expenses, or changes in accounting judgments that have had or are reasonably likely to have a material impact on our financial statements specifically due to the COVID-19 pandemic. However, as the global outbreak of COVID-19 continues to rapidly evolve, it could continue to materially and adversely affect our revenues, financial condition, profitability, and cash flows for an indeterminate period of time.
Stockholder Litigation
There is currently ongoing stockholder litigation related to the Investigation. A class action complaint was filed by Patricia Lowry against the Company, and certain current and former officers of the Company, in the United States District Court for the Northern District of Illinois on March 23, 2020 demanding a jury trial. A shareholder derivative lawsuit was filed by David Summers on behalf of the Company against certain current and former directors and officers of the Company in the United States District Court for the Northern District of Illinois on June 5, 2020 demanding a jury trial. In the future, we may become subject to additional litigation or governmental proceedings or investigations that could result in additional unanticipated legal costs regardless of the outcome of the litigation. If we are not successful in any such litigation, we may be required to pay substantial damages or settlement costs. Based on the current information available to the Company, the impact that current or any future stockholder litigation may have on the Company cannot be reasonably estimated.
30. Restatement of Prior Period Quarterly Financial Statements (Unaudited)
As previously disclosed in RTI’s Current Report on Form 8-K filed with the SEC on March 16, 2020, the Audit Committee of the Board of Directors of RTI, with the assistance of independent legal and forensic accounting advisors, conducted an internal investigation of matters relating to the Company’s revenue recognition practices for certain contractual arrangements, primarily with OEM customers, including the accounting treatment, financial reporting and internal controls related to such arrangements (the “Investigation”). Based on the results of the Investigation, the Company has concluded that revenue for certain invoices should have been recognized at a later date than when originally recognized. In response to binding purchase orders from certain OEM customers, goods were shipped and received by the customers before requested delivery dates and agreed-upon delivery windows. In many instances the OEM customers requested or approved the early shipments, but the Company has determined that on other occasions the goods were delivered early without obtaining the customers’ affirmative approval. Some of those unapproved shipments were shipped by employees in order to generate additional revenue and resulted in shipments being pulled from a future quarter into an earlier quarter. In addition, the Company has concluded that in July 2017 an adjustment was improperly made to a product return provision in the Direct Division. The revenue for those shipments is being restated, as well as for other orders that shipped earlier than the purchase order due date in the system for which the Company could not locate evidence that the OEM customers had requested or approved the shipments. In addition, the Company has concluded that in the periods from 2015 through the fourth quarter of 2018, certain adjustments were incorrectly or erroneously made via manual journal entries to accrual/reserve accounts, including a July 2017 adjustment to a product return provision in the Direct Division, among others.
Furthermore, certain errors were identified, separately from the Investigation, primarily related to accounting for our 2019 Acquisition of Paradigm Spine, LLC for the first three quarters of 2019.
The Company determined to restate its previously issued unaudited condensed consolidated financial statements for the quarters ended March 31, 2019, June 30, 2019, and September 30, 2019. The following tables summarize the impacts of the results on our previously reported unaudited condensed consolidated statements of operations and balances sheets included in our Quarterly Reports on Form 10-Q for each respective period. Certain line items in the quarterly financial data below were excluded because they were not impacted by the Restatement.
The following errors in the Company’s quarterly financial statements were identified and corrected as a result of the Investigation:
| a. | Revenue – As noted above, the Company has concluded that in some instances revenue for certain invoices should have been recognized at a later date than when originally recognized. The Company identified revenue from certain customer orders that were shipped early to customers without obtaining authorized approval, and thus was recognized in an incorrect period. There were also instances in which the Company could not locate evidence that the OEM customers had requested or approved the shipments and therefore concluded revenue related to these shipments were an error. Correction of these errors, when including the rollover effect from the immediately preceding periods, increased revenue by $0.3 million in the quarter ended March 31, 2019, decreased by $0.8 million in the quarter ended June 30, 2019 and increased by $0.6 million in the quarter ended September 30, 2019. |
| b. | Costs of processing and distribution – Based on the corrections to the above revenue errors, when including the rollover effect from the immediately preceding periods, costs of processing and distribution increased by $0.1 million in the quarter ended March 31, 2019, decreased by $0.2 million in the quarter ended June 30, 2019 and increased by $0.1 million in the quarter ended September 30, 2019. |
137
Table of Contents
| c. | Accounts receivable – As a result of the errors corrections above, accounts receivable increased by $0.4 million in the quarter ended March 31, 2019, decreased by $0.3 million in the quarter ended June 30, 2019 and increased $0.3 million in the quarter ended September 30, 2019. |
| d. | Inventories, net – As a result of the errors corrections above, net inventories decreased by $0.1 million in the quarter ended March 31, 2019, increased by $0.1 million in the quarter ended June 30, 2019 and increased by less than $0.1 million in the quarter ended September 30, 2019. |
| e. | Deferred tax assets – As a result of the income tax impact of the errors corrections above, deferred tax assets decreased by $0.6 million in the quarter ended March 31, 2019, decreased by $0.5 million in the quarter ended June 30, 2019, and decreased by $0.6 million in the quarter ended September 30, 2019. |
The following errors in the Company’s quarterly financial statements were identified and corrected apart from the Investigation and related to accounting for our 2019 acquisition of Paradigm Spine, LLC for the first three quarters of 2019. ASC 805 Business Combinations states that if the initial accounting for a business combination is incomplete by the end of the reporting period in which the combination occurs, the acquirer shall report in its financial statements the provisional amounts for the items for which the accounting is incomplete. The acquisition occurred on March 8, 2019, before the end of the first quarter of 2019. Accordingly, based on the information known or knowable in the first quarter of 2019, the Company should have performed a preliminary allocation of the purchase price to assets acquired and liabilities assumed. The Company did not appropriately prepare a preliminary estimates of the purchase price allocation resulting in errors impacting intangible assets, acquisition contingencies, inventory, and goodwill. The correction of the errors related to accounting for the acquisition of Paradigm Spine, LLC are as follows:
| a. | Costs of processing and distribution – Based on the corrections to the inventory valuation and Paradigm purchase accounting, costs of processing and distribution increased by $0.3 million in the quarter ended March 31, 2019, decreased by $1.9 million in the quarter ended June 30, 2019, and by $1.2 million in the quarter ended September 30, 2019. |
| b. | Marketing, general and administrative – Based on the corrections to the amortization related to the other intangible assets’ valuation and Paradigm purchase accounting, marketing, general and administrative expenses increased by $0.7 million in the quarter ended March 31, 2019 and increased $2.1 million in each of the quarters ended June 30, and September 30, 2019. |
| c. | Current inventories, net – Based on the corrections to the inventory valuation and Paradigm purchase accounting, net current inventories increased by $1.2 million in quarter ended March 31, 2019, and decreased by $12.6 million in the quarters ended June 30, and September 30, 2019. |
| d. | Non-current inventories, net – Based on the corrections to the inventory valuation and Paradigm purchase accounting, net non-current inventories increased by $10.3 million in quarter ended March 31, 2019, decreased $11.2 million in the quarter ended June 30, 2019, and decreased by $10.0 million in the quarter ended September 30, 2019. |
| e. | Deferred tax assets – Based on the corrections to the Paradigm purchase accounting deferred tax assets increased by $0.2 million in quarter ended March 31, 2019, increased by $0.3 million in the quarter ended June 30, 2019, and increased by $0.5 million in the quarter ended September 30, 2019. |
| f. | Goodwill – Based on the corrections to the Paradigm purchase accounting, goodwill decreased by $113.5 million in quarter ended March 31, 2019, decreased $76.4 million in the quarter ended June 30, 2019, and decreased by $41.7 million in the quarter ended September 30, 2019. |
| g. | Other intangible assets - net – Based on the corrections to the Paradigm purchase accounting, net other intangible assets increased by $78.3 million in the quarter ended March 31, 2019, increased $76.2 million in the quarter ended June 30, 2019, and increased $74.1 million in the quarter ended September 30, 2019. |
| h. | Acquisition contingencies – Based on the corrections to the contingent liability valuation and Paradigm purchase accounting, acquisition contingencies decreased by $22.8 million in each of the quarters ended March 31, and June 30, 2019 and increased $11.9 million in the quarter ended September 30, 2019. |
In addition to the correction of the errors discussed above, the Company has voluntarily made other immaterial corrections in all periods presented.
| a. | Marketing, general and administrative – The Company corrected certain errors which decreased marketing, general and administrative expenses by $0.5 million in the quarter ended March 31, 2019 and less than $0.1 million in each of the quarters ended June 30, and September 30, 2019. |
| b. | Accounts receivable – The Company corrected certain errors which decreased accounts receivable by $0.4 million for the quarter ended March 31, 2019, and by $0.3 million for the quarters ended June 30, and September 30, 2019. |
138
Table of Contents
| c. | Prepaid and other current assets – The Company corrected certain errors which decreased prepaid and other current assets by $0.5 million for each of the quarters ended March 31, and June 30, 2019, and September 30, 2019. |
| d. | Deferred tax assets - net – The Company corrected certain errors which increased net deferred tax assets by $0.7 million for the quarters ended March 31, June 30, and September 30, 2019. |
| e. | Property, plant & equipment – The Company corrected certain errors which increased property, plant & equipment by $0.3 million for the quarters ended March 31, June 30, and September 30, 2019. |
| f. | Other intangible assets - net – The Company corrected certain errors which decreased net other intangible assets by $0.8 million for each of the quarters ended March 31, June 30, and September 30, 2019. |
| g. | Other assets - net – The Company corrected certain errors which decreased net other assets by $0.3 million for the quarters ended March 31, June 30, and September 30, 2019. |
| h. | Accounts payable – The Company corrected certain errors which decreased accounts payable by $0.2 million for the quarters ended March 31, June 30, and September 30, 2019. |
| i. | Accrued expenses – The Company corrected certain errors which increased accrued expenses by $0.6 million for the quarters ended March 31, June 30, and September 30, 2019. |
| j. | Payments for treasury stock – The Company corrected certain errors which reclassified operating cash flows to financing cash flows for purchases of treasury stock by $0.1 million, $0.2 million, and $0.2 million for the quarters ended March 31, June 30, and September 30, 2019, respectively. |
139
Table of Contents
30. Restatement of Prior Period Quarterly Financial Statements (Unaudited) (Continued)
Restated Condensed Consolidated Balance Sheets (Unaudited)
| March 31, 2019 |
June 30, 2019 |
September 30, 2019 |
||||||||||
| (as restated) | (as restated) | (as restated) | ||||||||||
| Assets |
||||||||||||
| Current Assets: |
||||||||||||
| Cash and cash equivalents |
$ | 6,043 | $ | 4,518 | $ | 2,950 | ||||||
| Accounts receivable |
55,709 | 55,540 | 56,545 | |||||||||
| Inventories - net |
115,486 | 115,454 | 118,336 | |||||||||
| Prepaid and other current assets |
9,399 | 8,258 | 8,156 | |||||||||
|
|
|
|
|
|
|
|||||||
| Total current assets |
186,637 | 183,770 | 185,987 | |||||||||
| Non-current inventories - net |
10,261 | 9,225 | 8,374 | |||||||||
| Property, plant and equipment - net |
79,500 | 79,956 | 81,471 | |||||||||
| Deferred tax assets - net |
17,114 | 20,230 | 21,576 | |||||||||
| Goodwill |
194,797 | 195,067 | 194,838 | |||||||||
| Other intangible assets - net |
103,006 | 100,651 | 97,614 | |||||||||
| Other assets - net |
7,653 | 7,277 | 7,006 | |||||||||
|
|
|
|
|
|
|
|||||||
| Total assets |
$ | 598,968 | $ | 596,176 | $ | 596,866 | ||||||
|
|
|
|
|
|
|
|||||||
| Liabilities and Stockholders’ Equity |
||||||||||||
| Current Liabilities: |
||||||||||||
| Accounts payable |
$ | 23,149 | $ | 20,600 | $ | 17,634 | ||||||
| Accrued expenses |
25,557 | 25,312 | 31,714 | |||||||||
| Current portion of deferred revenue |
4,825 | 4,744 | 2,748 | |||||||||
|
|
|
|
|
|
|
|||||||
| Total current liabilities |
53,531 | 50,656 | 52,096 | |||||||||
| Long-term obligations - less current portion |
163,615 | 165,081 | 169,137 | |||||||||
| Acquisition contingencies |
77,163 | 75,573 | 75,573 | |||||||||
| Other long-term liabilities |
3,065 | 2,562 | 2,271 | |||||||||
| Deferred revenue |
1,535 | 325 | 1,134 | |||||||||
|
|
|
|
|
|
|
|||||||
| Total liabilities |
298,909 | 294,197 | 300,211 | |||||||||
| Preferred stock Series A, $.001 par value: 5,000,000 shares authorized; 50,000 shares issued and outstanding |
66,272 | 66,318 | 66,364 | |||||||||
| Stockholders’ equity: |
||||||||||||
| Common stock, $.001 par value: 150,000,000 shares authorized; 75,055,225, 75,159,262, and 75,087,917 shares issued and outstanding, respectively |
75 | 75 | 75 | |||||||||
| Additional paid-in capital |
495,263 | 496,596 | 497,518 | |||||||||
| Accumulated other comprehensive loss |
(7,663 | ) | (7,268 | ) | (8,390 | ) | ||||||
| Accumulated deficit |
(248,889 | ) | (248,701 | ) | (253,839 | ) | ||||||
| Less treasury stock, 1,250,201, 1,257,949 and 1,265,761 shares, respectively, at cost |
(4,999 | ) | (5,041 | ) | (5,073 | ) | ||||||
|
|
|
|
|
|
|
|||||||
| Total stockholders’ equity |
233,787 | 235,661 | 230,291 | |||||||||
|
|
|
|
|
|
|
|||||||
| Total liabilities and stockholders’ equity |
$ | 598,968 | $ | 596,176 | $ | 596,866 | ||||||
|
|
|
|
|
|
|
|||||||
140
Table of Contents
30. Restatement of Prior Period Quarterly Financial Statements (Unaudited) (Continued)
Restated Condensed Consolidated Statements of Income (Unaudited)
| Three Months Ended March 31, 2019 |
||||
| (as restated) | ||||
| Revenues |
$ | 70,021 | ||
| Costs of processing and distribution |
32,134 | |||
|
|
|
|||
| Gross profit |
37,887 | |||
|
|
|
|||
| Expenses: |
||||
| Marketing, general and administrative |
32,116 | |||
| Research and development |
4,336 | |||
| Asset impairment and abandonments |
15 | |||
| Acquisition and integration expenses |
8,957 | |||
|
|
|
|||
| Total operating expenses |
45,424 | |||
|
|
|
|||
| Operating (loss) |
(7,537 | ) | ||
|
|
|
|||
| Other (expense) income: |
||||
| Interest expense |
(1,604 | ) | ||
| Interest income |
131 | |||
| Foreign exchange (loss) |
(31 | ) | ||
|
|
|
|||
| Total other expense - net |
(1,504 | ) | ||
|
|
|
|||
| (Loss) before income tax (provision) |
(9,041 | ) | ||
| Income tax (provision) |
(310 | ) | ||
|
|
|
|||
| Net (loss) |
(9,351 | ) | ||
|
|
|
|||
| Convertible preferred dividend |
||||
|
|
|
|||
| Net (loss) applicable to common shares |
$ | (9,351 | ) | |
|
|
|
|||
| Other comprehensive (loss): |
||||
| Unrealized foreign currency translation loss |
(393 | ) | ||
|
|
|
|||
| Comprehensive (loss) |
$ | (9,744 | ) | |
|
|
|
|||
| Net (loss) per common share - basic |
$ | (0.14 | ) | |
|
|
|
|||
| Net (loss) per common share - diluted |
$ | (0.14 | ) | |
|
|
|
|||
141
Table of Contents
30. Restatement of Prior Period Quarterly Financial Statements (Unaudited) (Continued)
Restated Condensed Consolidated Statements of Income (Unaudited)
| Six Months Ended June 30, 2019 |
||||
| (as restated) | ||||
| Revenues |
$ | 151,575 | ||
| Costs of processing and distribution |
67,564 | |||
|
|
|
|||
| Gross profit |
84,011 | |||
|
|
|
|||
| Expenses: |
||||
| Marketing, general and administrative |
73,224 | |||
| Research and development |
8,204 | |||
| Gain on acquisition contingency |
(1,590 | ) | ||
| Asset impairment and abandonments |
15 | |||
| Acquisition and integration expenses |
10,910 | |||
|
|
|
|||
| Total operating expenses |
90,763 | |||
|
|
|
|||
| Operating (loss) |
(6,752 | ) | ||
|
|
|
|||
| Other (expense) income: |
||||
| Interest expense |
(5,239 | ) | ||
| Interest income |
157 | |||
| Foreign exchange (loss) |
(50 | ) | ||
| Total other expense - net |
(5,132 | ) | ||
|
|
|
|||
| (Loss) before income tax benefit |
(11,884 | ) | ||
| Income tax benefit |
2,721 | |||
|
|
|
|||
| Net (loss) applicable to common shares |
(9,163 | ) | ||
|
|
|
|||
| Convertible preferred dividend |
— | |||
|
|
|
|||
| Net (loss) applicable to common shares |
$ | (9,163 | ) | |
|
|
|
|||
| Other comprehensive (loss): |
||||
| Unrealized foreign currency translation loss |
2 | |||
|
|
|
|||
| Comprehensive (loss) |
$ | (9,161 | ) | |
|
|
|
|||
| Net (loss) per common share - basic |
$ | (0.13 | ) | |
|
|
|
|||
| Net (loss) per common share - diluted |
$ | (0.13 | ) | |
|
|
|
|||
142
Table of Contents
30. Restatement of Prior Period Quarterly Financial Statements (Unaudited) (Continued)
Restated Condensed Consolidated Statements of Income (Unaudited)
| Nine Months Ended September 30, 2019 |
||||
| (as restated) | ||||
| Revenues |
$ | 228,316 | ||
| Costs of processing and distribution |
101,081 | |||
|
|
|
|||
| Gross profit |
127,235 | |||
|
|
|
|||
| Expenses: |
||||
| Marketing, general and administrative |
112,447 | |||
| Research and development |
12,475 | |||
| Gain on acquisition contingency |
(1,590 | ) | ||
| Asset impairment and abandonments |
15 | |||
| Acquisition and integration expenses |
14,119 | |||
|
|
|
|||
| Total operating expenses |
137,466 | |||
|
|
|
|||
| Operating (loss) |
(10,231 | ) | ||
|
|
|
|||
| Other (expense) income: |
||||
| Interest expense |
(8,957 | ) | ||
| Interest income |
161 | |||
| Foreign exchange (loss) |
(128 | ) | ||
|
|
|
|||
| Total other expense - net |
(8,924 | ) | ||
|
|
|
|||
| (Loss) before income tax benefit |
(19,155 | ) | ||
| Income tax benefit |
4,854 | |||
|
|
|
|||
| Net (loss) |
(14,301 | ) | ||
|
|
|
|||
| Convertible preferred dividend |
— | |||
|
|
|
|||
| Net (loss) applicable to common shares |
$ | (14,301 | ) | |
|
|
|
|||
| Other comprehensive (loss): |
||||
| Unrealized foreign currency translation loss |
(1,120 | ) | ||
|
|
|
|||
| Comprehensive (loss) |
$ | (15,421 | ) | |
|
|
|
|||
| Net (loss) per common share - basic |
$ | (0.20 | ) | |
|
|
|
|||
| Net (loss) per common share - diluted |
$ | (0.20 | ) | |
|
|
|
|||
143
Table of Contents
30. Restatement of Prior Period Quarterly Financial Statements (Unaudited) (Continued)
Restated Condensed Consolidated Statements of Income (Unaudited)
| Three Months Ended June 30, 2019 |
||||
| (as restated) | ||||
| Revenues |
$ | 81,554 | ||
| Costs of processing and distribution |
35,430 | |||
|
|
|
|||
| Gross profit |
46,124 | |||
|
|
|
|||
| Expenses: |
||||
| Marketing, general and administrative |
41,108 | |||
| Research and development |
3,868 | |||
| Gain on acquisition contingency |
(1,590 | ) | ||
| Acquisition and integration expenses |
1,953 | |||
|
|
|
|||
| Total operating expenses |
45,339 | |||
|
|
|
|||
| Operating income |
785 | |||
|
|
|
|||
| Other (expense) income: |
||||
| Interest expense |
(3,635 | ) | ||
| Interest income |
26 | |||
| Foreign exchange (loss) |
(19 | ) | ||
|
|
|
|||
| Total other expense - net |
(3,628 | ) | ||
|
|
|
|||
| (Loss) before income tax benefit |
(2,843 | ) | ||
| Income tax benefit |
3,031 | |||
|
|
|
|||
| Net income |
188 | |||
|
|
|
|||
| Convertible preferred dividend |
— | |||
|
|
|
|||
| Net income applicable to common shares |
$ | 188 | ||
|
|
|
|||
| Other comprehensive income: |
||||
| Unrealized foreign currency translation loss |
395 | |||
|
|
|
|||
| Comprehensive income |
$ | 583 | ||
|
|
|
|||
| Net income per common share - basic |
$ | 0.00 | ||
|
|
|
|||
| Net income per common share - diluted |
$ | 0.00 | ||
|
|
|
|||
144
Table of Contents
30. Restatement of Prior Period Quarterly Financial Statements (Unaudited) (Continued)
Restated Condensed Consolidated Statements of Income (Unaudited)
| Three Months Ended September 30, 2019 |
||||
| (as restated) | ||||
| Revenues |
$ | 76,741 | ||
| Costs of processing and distribution |
33,517 | |||
|
|
|
|||
| Gross profit |
43,224 | |||
|
|
|
|||
| Expenses: |
||||
| Marketing, general and administrative |
39,223 | |||
| Research and development |
4,271 | |||
| Acquisition and integration expenses |
3,209 | |||
|
|
|
|||
| Total operating expenses |
46,703 | |||
|
|
|
|||
| Operating (loss) |
(3,479 | ) | ||
|
|
|
|||
| Other (expense) income: |
||||
| Interest expense |
(3,718 | ) | ||
| Interest income |
4 | |||
| Foreign exchange (loss) |
(78 | ) | ||
|
|
|
|||
| Total other expense - net |
(3,792 | ) | ||
|
|
|
|||
| (Loss) before income tax benefit |
(7,271 | ) | ||
| Income tax benefit |
2,133 | |||
|
|
|
|||
| Net (loss) applicable to common shares |
(5,138 | ) | ||
|
|
|
|||
| Convertible preferred dividend |
— | |||
|
|
|
|||
| Net (loss) applicable to common shares |
$ | (5,138 | ) | |
|
|
|
|||
| Other comprehensive (loss): |
||||
| Unrealized foreign currency translation loss |
(1,122 | ) | ||
|
|
|
|||
| Comprehensive (loss) |
$ | (6,260 | ) | |
|
|
|
|||
| Net (loss) per common share - basic |
$ | (0.07 | ) | |
|
|
|
|||
| Net (loss) per common share - diluted |
$ | (0.07 | ) | |
|
|
|
|||
145
Table of Contents
30. Restatement of Prior Period Quarterly Financial Statements (Unaudited) (Continued)
Restated Condensed Consolidated Statement of Cash Flows (Unaudited)
| For the Three Months Ended March 31, |
||||
| 2019 | ||||
| (as restated) | ||||
| Cash flows from operating activities: |
||||
| Net (loss) |
$ | (9,351 | ) | |
| Adjustments to reconcile net loss to net cash (used in) operating activities: |
||||
| Depreciation and amortization expense |
4,400 | |||
| Provision for bad debts and product returns |
233 | |||
| Provision for inventory write-downs |
1,530 | |||
| Amortization of deferred revenue |
(1,292 | ) | ||
| Deferred income tax provision |
384 | |||
| Stock-based compensation |
1,163 | |||
| Other |
197 | |||
| Change in assets and liabilities: |
||||
| Accounts receivable |
(2,717 | ) | ||
| Inventories |
(2,190 | ) | ||
| Accounts payable |
(7,329 | ) | ||
| Accrued expenses |
(2,074 | ) | ||
| Deferred revenue |
2,000 | |||
| Other operating assets and liabilities |
(511 | ) | ||
|
|
|
|||
| Net cash (used in) operating activities |
(15,557 | ) | ||
|
|
|
|||
| Cash flows from investing activities: |
||||
| Purchases of property, plant and equipment |
(3,477 | ) | ||
| Patent and acquired intangible asset costs |
(328 | ) | ||
| Cardiothoracic closure business divestiture |
(99,921 | ) | ||
|
|
|
|||
| Net cash (used in) investing activities |
(103,726 | ) | ||
|
|
|
|||
| Cash flows from financing activities: |
||||
| Proceeds from exercise of common stock options |
284 | |||
| Proceeds from long-term obligations |
115,000 | |||
| Net (payments) on short-term obligations |
(729 | ) | ||
| Payments for treasury stock |
(128 | ) | ||
| Net cash provided by financing activities |
114,427 | |||
|
|
|
|||
| Effect of exchange rate changes on cash and cash equivalents |
(50 | ) | ||
|
|
|
|||
| Net decrease in cash and cash equivalents |
(4,906 | ) | ||
| Cash and cash equivalents, beginning of period |
10,949 | |||
|
|
|
|||
| Cash and cash equivalents, end of period |
$ | 6,043 | ||
|
|
|
|||
| Supplemental cash flow disclosure: |
||||
| Cash paid for interest |
$ | 557 | ||
| Cash paid for income taxes, net of refunds |
(635 | ) | ||
| Non-cash acquisition of property, plant and equipment |
502 | |||
| Non-cash acquisition of Paradigm |
60,730 | |||
| Non-cash common stock issuance |
60,730 | |||
146
Table of Contents
30. Restatement of Prior Period Quarterly Financial Statements (Unaudited) (Continued)
Restated Condensed Consolidated Statement of Cash Flows (Unaudited)
| For the Six Months Ended June 30, |
||||
| 2019 | ||||
| (as restated) | ||||
| Cash flows from operating activities: |
||||
| Net (loss) |
$ | (9,163 | ) | |
| Adjustments to reconcile net loss to net cash (used in) operating activities: |
||||
| Depreciation and amortization expense |
10,308 | |||
| Provision for bad debts and product returns |
899 | |||
| Provision for inventory write-downs |
3,274 | |||
| Amortization of deferred revenue |
(2,585 | ) | ||
| Deferred income tax benefit |
(2,969 | ) | ||
| Stock-based compensation |
2,430 | |||
| Gain on acquisition contingency |
(1,590 | ) | ||
| Paid in kind interest expense |
1,473 | |||
| Other |
877 | |||
| Change in assets and liabilities: |
— | |||
| Accounts receivable |
(3,141 | ) | ||
| Inventories |
(2,658 | ) | ||
| Accounts payable |
(9,751 | ) | ||
| Accrued expenses |
(2,583 | ) | ||
| Deferred revenue |
2,000 | |||
| Other operating assets and liabilities |
240 | |||
|
|
|
|||
| Net cash (used in) operating activities |
(12,939 | ) | ||
|
|
|
|||
| Cash flows from investing activities: |
||||
| Purchases of property, plant and equipment |
(6,912 | ) | ||
| Patent and acquired intangible asset costs |
(1,126 | ) | ||
| Acquisition of Zyga Technology |
— | |||
| Cardiothoracic closure business divestiture |
(99,921 | ) | ||
|
|
|
|||
| Net cash (used in) investing activities |
(107,959 | ) | ||
|
|
|
|||
| Cash flows from financing activities: |
||||
| Proceeds from exercise of common stock options |
395 | |||
| Proceeds from long-term obligations |
115,000 | |||
| Net (payments) on short-term obligations |
(729 | ) | ||
| Payments for treasury stock |
(172 | ) | ||
| Net cash provided by financing activities |
114,494 | |||
|
|
|
|||
| Effect of exchange rate changes on cash and cash equivalents |
(27 | ) | ||
|
|
|
|||
| Net decrease in cash and cash equivalents |
(6,431 | ) | ||
| Cash and cash equivalents, beginning of period |
10,949 | |||
|
|
|
|||
| Cash and cash equivalents, end of period |
$ | 4,518 | ||
|
|
|
|||
| Supplemental cash flow disclosure: |
||||
| Cash paid for interest |
$ | 2,732 | ||
| Cash paid for income taxes, net of refunds |
1,982 | |||
| Non-cash acquisition of property, plant and equipment |
456 | |||
| Non-cash acquisition of Paradigm |
60,730 | |||
| Non-cash common stock issuance |
60,730 | |||
147
Table of Contents
30. Restatement of Prior Period Quarterly Financial Statements (Unaudited) (Continued)
Restated Condensed Consolidated Statement of Cash Flows (Unaudited)
| For the Nine Months Ended September 30, |
||||
| 2019 | ||||
| (as restated) | ||||
| Cash flows from operating activities: |
||||
| Net (loss) |
$ | (14,301 | ) | |
| Adjustments to reconcile net loss to net cash (used in) operating activities: |
||||
| Depreciation and amortization expense |
16,342 | |||
| Provision for bad debts and product returns |
1,050 | |||
| Provision for inventory write-downs |
5,482 | |||
| Amortization of deferred revenue |
(3,772 | ) | ||
| Deferred income tax benefit |
(4,588 | ) | ||
| Stock-based compensation |
3,399 | |||
| Gain on acquisition contingency |
(1,590 | ) | ||
| Paid in kind interest expense |
2,948 | |||
| Other |
1,069 | |||
| Change in assets and liabilities: |
— | |||
| Accounts receivable |
(4,522 | ) | ||
| Inventories |
(7,609 | ) | ||
| Accounts payable |
(12,684 | ) | ||
| Accrued expenses |
3,998 | |||
| Deferred revenue |
2,000 | |||
| Other operating assets and liabilities |
273 | |||
|
|
|
|||
| Net cash (used in) operating activities |
(12,505 | ) | ||
|
|
|
|||
| Cash flows from investing activities: |
||||
| Purchases of property, plant and equipment |
(10,882 | ) | ||
| Patent and acquired intangible asset costs |
(1,786 | ) | ||
| Cardiothoracic closure business divestiture |
(99,692 | ) | ||
|
|
|
|||
| Net cash (used in) investing activities |
(112,360 | ) | ||
|
|
|
|||
| Cash flows from financing activities: |
||||
| Proceeds from exercise of common stock options |
395 | |||
| Proceeds from long-term obligations |
118,000 | |||
| Net (payments) on short-term obligations |
(729 | ) | ||
| Payments on long-term obligations |
(500 | ) | ||
| Payments for treasury stock |
(204 | ) | ||
| Net cash provided by financing activities |
116,962 | |||
|
|
|
|||
| Effect of exchange rate changes on cash and cash equivalents |
(96 | ) | ||
|
|
|
|||
| Net decrease in cash and cash equivalents |
(7,999 | ) | ||
| Cash and cash equivalents, beginning of period |
10,949 | |||
|
|
|
|||
| Cash and cash equivalents, end of period |
$ | 2,950 | ||
|
|
|
|||
| Supplemental cash flow disclosure: |
||||
| Cash paid for interest |
$ | 4,941 | ||
| Cash paid for income taxes, net of refunds |
1,982 | |||
| Non-cash acquisition of property, plant and equipment |
817 | |||
| Non-cash acquisition of Paradigm |
60,730 | |||
| Non-cash common stock issuance |
60,730 | |||
148
Table of Contents
30. Restatement of Prior Period Quarterly Financial Statements (Unaudited) (Continued)
Restated Condensed Consolidated Balance Sheet Amounts (Unaudited)
| As of March 31, 2019 | ||||||||||||
| As Previously | ||||||||||||
| Reported | Adjustments | As Restated | ||||||||||
| Accounts receivable |
$ | 55,670 | $ | 39 | $ | 55,709 | ||||||
| Inventories - net |
114,365 | 1,121 | 115,486 | |||||||||
| Prepaid and other current assets |
9,860 | (461 | ) | 9,399 | ||||||||
|
|
|
|
|
|
|
|||||||
| Total current assets |
185,938 | 699 | 186,637 | |||||||||
| Non-current inventories - net |
— | 10,261 | 10,261 | |||||||||
| Property, plant and equipment - net |
79,235 | 265 | 79,500 | |||||||||
| Deferred tax assets - net |
16,778 | 336 | 17,114 | |||||||||
| Goodwill |
308,345 | (113,548 | ) | 194,797 | ||||||||
| Other intangible assets - net |
25,512 | 77,494 | 103,006 | |||||||||
| Other assets - net |
7,918 | (265 | ) | 7,653 | ||||||||
|
|
|
|
|
|
|
|||||||
| Total assets |
$ | 623,726 | $ | (24,758 | ) | $ | 598,968 | |||||
|
|
|
|
|
|
|
|||||||
| Accounts payable |
$ | 23,315 | $ | (166 | ) | $ | 23,149 | |||||
| Accrued expenses |
24,992 | 565 | 25,557 | |||||||||
|
|
|
|
|
|
|
|||||||
| Total current liabilities |
53,132 | 399 | 53,531 | |||||||||
| Acquisition contingencies |
99,962 | (22,799 | ) | 77,163 | ||||||||
|
|
|
|
|
|
|
|||||||
| Total liabilities |
321,309 | (22,400 | ) | 298,909 | ||||||||
| Accumulated deficit |
(246,531 | ) | (2,358 | ) | (248,889 | ) | ||||||
|
|
|
|
|
|
|
|||||||
| Total stockholders’ equity |
236,145 | (2,358 | ) | 233,787 | ||||||||
|
|
|
|
|
|
|
|||||||
| Total liabilities and stockholders’ equity |
$ | 623,726 | $ | (24,758 | ) | $ | 598,968 | |||||
|
|
|
|
|
|
|
|||||||
| As of June 30, 2019 | ||||||||||||
| As Previously Reported |
Adjustments | As Restated | ||||||||||
| Accounts receivable |
56,163 | (623 | ) | 55,540 | ||||||||
| Inventories - net |
127,906 | (12,452 | ) | 115,454 | ||||||||
| Prepaid and other current assets |
8,733 | (475 | ) | 8,258 | ||||||||
|
|
|
|
|
|
|
|||||||
| Total current assets |
197,320 | (13,550 | ) | 183,770 | ||||||||
| Non-current inventories - net |
20,445 | (11,220 | ) | 9,225 | ||||||||
| Property, plant and equipment - net |
79,691 | 265 | 79,956 | |||||||||
| Deferred tax assets - net |
19,715 | 515 | 20,230 | |||||||||
| Goodwill |
271,429 | (76,362 | ) | 195,067 | ||||||||
| Other intangible assets - net |
25,269 | 75,382 | 100,651 | |||||||||
| Other assets - net |
7,542 | (265 | ) | 7,277 | ||||||||
|
|
|
|
|
|
|
|||||||
| Total assets |
$ | 621,411 | $ | (25,235 | ) | $ | 596,176 | |||||
|
|
|
|
|
|
|
|||||||
| Accounts payable |
$ | 20,766 | $ | (166 | ) | $ | 20,600 | |||||
| Accrued expenses |
24,668 | 644 | 25,312 | |||||||||
|
|
|
|
|
|
|
|||||||
| Total current liabilities |
50,178 | 478 | 50,656 | |||||||||
| Acquisition contingencies |
98,372 | (22,799 | ) | 75,573 | ||||||||
|
|
|
|
|
|
|
|||||||
| Total liabilities |
316,518 | (22,321 | ) | 294,197 | ||||||||
| Accumulated deficit |
(245,787 | ) | (2,914 | ) | (248,701 | ) | ||||||
|
|
|
|
|
|
|
|||||||
| Total stockholders’ equity |
238,575 | (2,914 | ) | 235,661 | ||||||||
|
|
|
|
|
|
|
|||||||
| Total liabilities and stockholders’ equity |
$ | 621,411 | $ | (25,235 | ) | $ | 596,176 | |||||
|
|
|
|
|
|
|
|||||||
149
Table of Contents
30. Restatement of Prior Period Quarterly Financial Statements (Unaudited) (Continued)
Restated Condensed Consolidated Balance Sheet Amounts (Unaudited)
| As of September 30, 2019 | ||||||||||||
| As Previously Reported |
Adjustments | As Restated | ||||||||||
| Accounts receivable |
$ | 56,556 | $ | (11 | ) | $ | 56,545 | |||||
| Inventories - net |
130,913 | (12,577 | ) | 118,336 | ||||||||
| Prepaid and other current assets |
8,631 | (475 | ) | 8,156 | ||||||||
|
|
|
|
|
|
|
|||||||
| Total current assets |
199,050 | (13,063 | ) | 185,987 | ||||||||
| Non-current inventories - net |
18,345 | (9,971 | ) | 8,374 | ||||||||
| Property, plant and equipment - net |
81,206 | 265 | 81,471 | |||||||||
| Deferred tax assets - net |
20,967 | 609 | 21,576 | |||||||||
| Goodwill |
236,547 | (41,709 | ) | 194,838 | ||||||||
| Other intangible assets - net |
24,345 | 73,269 | 97,614 | |||||||||
| Other assets - net |
7,271 | (265 | ) | 7,006 | ||||||||
|
|
|
|
|
|
|
|||||||
| Total assets |
$ | 587,731 | $ | 9,135 | $ | 596,866 | ||||||
|
|
|
|
|
|
|
|||||||
| Accounts payable |
$ | 17,800 | $ | (166 | ) | $ | 17,634 | |||||
| Accrued expenses |
31,067 | 647 | 31,714 | |||||||||
|
|
|
|
|
|
|
|||||||
| Total current liabilities |
51,615 | 481 | 52,096 | |||||||||
| Acquisition contingencies |
63,719 | 11,854 | 75,573 | |||||||||
|
|
|
|
|
|
|
|||||||
| Total liabilities |
287,876 | 12,335 | 300,211 | |||||||||
| Accumulated deficit |
(250,639 | ) | (3,200 | ) | (253,839 | ) | ||||||
|
|
|
|
|
|
|
|||||||
| Total stockholders’ equity |
233,491 | (3,200 | ) | 230,291 | ||||||||
|
|
|
|
|
|
|
|||||||
| Total liabilities and stockholders’ equity |
$ | 587,731 | $ | 9,135 | $ | 596,866 | ||||||
|
|
|
|
|
|
|
|||||||
Restated Condensed Consolidated Statements of Income Amounts (Unaudited)
| Three Months Ended March 31, 2019 | ||||||||||||
| (as reported) | (adjustments) | (as restated) | ||||||||||
| Revenues |
$ | 69,741 | $ | 280 | $ | 70,021 | ||||||
| Costs of processing and distribution |
31,737 | 397 | 32,134 | |||||||||
|
|
|
|
|
|
|
|||||||
| Gross profit |
38,004 | (117 | ) | 37,887 | ||||||||
|
|
|
|
|
|
|
|||||||
| Marketing, general and administrative |
31,883 | 233 | 32,116 | |||||||||
|
|
|
|
|
|
|
|||||||
| Total operating expenses |
45,191 | 233 | 45,424 | |||||||||
|
|
|
|
|
|
|
|||||||
| Operating (loss) |
(7,187 | ) | (350 | ) | (7,537 | ) | ||||||
|
|
|
|
|
|
|
|||||||
| (Loss) before income tax (provision) |
(8,691 | ) | (350 | ) | (9,041 | ) | ||||||
| Income tax (provision) |
(396 | ) | 86 | (310 | ) | |||||||
|
|
|
|
|
|
|
|||||||
| Net (loss) |
(9,087 | ) | (264 | ) | (9,351 | ) | ||||||
|
|
|
|
|
|
|
|||||||
| Comprehensive (loss) |
$ | (9,480 | ) | $ | (264 | ) | $ | (9,744 | ) | |||
|
|
|
|
|
|
|
|||||||
| Net (loss) per common share - basic |
$ | (0.14 | ) | $ | (0.00 | ) | $ | (0.14 | ) | |||
|
|
|
|
|
|
|
|||||||
| Net (loss) per common share - diluted |
$ | (0.14 | ) | $ | (0.00 | ) | $ | (0.14 | ) | |||
|
|
|
|
|
|
|
|||||||
150
Table of Contents
30. Restatement of Prior Period Quarterly Financial Statements (Unaudited) (Continued)
Restated Condensed Consolidated Statements of Income Amounts (Unaudited)
| Six Months Ended June 30, 2019 | ||||||||||||
| (as reported) | (adjustments) | (as restated) | ||||||||||
| Revenues |
$ | 152,048 | $ | (473 | ) | $ | 151,575 | |||||
| Costs of processing and distribution |
69,299 | (1,735 | ) | 67,564 | ||||||||
|
|
|
|
|
|
|
|||||||
| Gross profit |
82,749 | 1,262 | 84,011 | |||||||||
|
|
|
|
|
|
|
|||||||
| Marketing, general and administrative |
70,876 | 2,348 | 73,224 | |||||||||
|
|
|
|
|
|
|
|||||||
| Total operating expenses |
88,415 | 2,348 | 90,763 | |||||||||
|
|
|
|
|
|
|
|||||||
| Operating (loss) |
(5,666 | ) | (1,086 | ) | (6,752 | ) | ||||||
|
|
|
|
|
|
|
|||||||
| (Loss) before income tax (provision) |
(10,798 | ) | (1,086 | ) | (11,884 | ) | ||||||
| Income tax benefit |
2,455 | 266 | 2,721 | |||||||||
|
|
|
|
|
|
|
|||||||
| Net (loss) |
(8,343 | ) | (820 | ) | (9,163 | ) | ||||||
|
|
|
|
|
|
|
|||||||
| Comprehensive (loss) |
$ | (8,341 | ) | $ | (820 | ) | $ | (9,161 | ) | |||
|
|
|
|
|
|
|
|||||||
| Net (loss) per common share - basic |
$ | (0.12 | ) | $ | (0.01 | ) | $ | (0.13 | ) | |||
|
|
|
|
|
|
|
|||||||
| Net (loss) per common share - diluted |
$ | (0.12 | ) | $ | (0.01 | ) | $ | (0.13 | ) | |||
|
|
|
|
|
|
|
|||||||
| Nine Months Ended September 30, 2019 | ||||||||||||
| (as reported) |
(adjustments) | (as restated) |
||||||||||
| Revenues |
$ | 228,177 | $ | 139 | $ | 228,316 | ||||||
| Costs of processing and distribution |
103,941 | (2,860 | ) | 101,081 | ||||||||
|
|
|
|
|
|
|
|||||||
| Gross profit |
124,236 | 2,999 | 127,235 | |||||||||
|
|
|
|
|
|
|
|||||||
| Marketing, general and administrative |
107,983 | 4,464 | 112,447 | |||||||||
|
|
|
|
|
|
|
|||||||
| Total operating expenses |
133,002 | 4,464 | 137,466 | |||||||||
|
|
|
|
|
|
|
|||||||
| Operating (loss) |
(8,766 | ) | (1,465 | ) | (10,231 | ) | ||||||
|
|
|
|
|
|
|
|||||||
| (Loss) before income tax benefit |
(17,690 | ) | (1,465 | ) | (19,155 | ) | ||||||
| Income tax benefit |
4,495 | 359 | 4,854 | |||||||||
|
|
|
|
|
|
|
|||||||
| Net (loss) |
(13,195 | ) | (1,106 | ) | (14,301 | ) | ||||||
|
|
|
|
|
|
|
|||||||
| Comprehensive (loss) |
$ | (14,315 | ) | $ | (1,106 | ) | $ | (15,421 | ) | |||
|
|
|
|
|
|
|
|||||||
| Net (loss) per common share - basic |
$ | (0.18 | ) | $ | (0.02 | ) | $ | (0.20 | ) | |||
|
|
|
|
|
|
|
|||||||
| Net (loss) per common share - diluted |
$ | (0.18 | ) | $ | (0.02 | ) | $ | (0.20 | ) | |||
|
|
|
|
|
|
|
|||||||
151
Table of Contents
30. Restatement of Prior Period Quarterly Financial Statements (Unaudited) (Continued)
Restated Condensed Consolidated Statements of Income Amounts (Unaudited)
| Three Months Ended June 30, 2019 | ||||||||||||
| (as reported) | (adjustments) | (as restated) | ||||||||||
| Revenues |
$ | 82,307 | $ | (753 | ) | $ | 81,554 | |||||
| Costs of processing and distribution |
37,562 | (2,132 | ) | 35,430 | ||||||||
|
|
|
|
|
|
|
|||||||
| Gross profit |
44,745 | 1,379 | 46,124 | |||||||||
|
|
|
|
|
|
|
|||||||
| Marketing, general and administrative |
38,993 | 2,115 | 41,108 | |||||||||
|
|
|
|
|
|
|
|||||||
| Total operating expenses |
43,224 | 2,115 | 45,339 | |||||||||
|
|
|
|
|
|
|
|||||||
| Operating income |
1,521 | (736 | ) | 785 | ||||||||
|
|
|
|
|
|
|
|||||||
| (Loss) before income tax benefit |
(2,107 | ) | (736 | ) | (2,843 | ) | ||||||
| Income tax benefit |
2,851 | 180 | 3,031 | |||||||||
|
|
|
|
|
|
|
|||||||
| Net income |
744 | (556 | ) | 188 | ||||||||
|
|
|
|
|
|
|
|||||||
| Comprehensive income |
$ | 1,139 | $ | (556 | ) | $ | 583 | |||||
|
|
|
|
|
|
|
|||||||
| Net income per common share - basic |
$ | 0.01 | $ | (0.01 | ) | $ | 0.00 | |||||
|
|
|
|
|
|
|
|||||||
| Net income per common share - diluted |
$ | 0.01 | $ | (0.01 | ) | $ | 0.00 | |||||
|
|
|
|
|
|
|
|||||||
| Three Months Ended September 30, 2019 | ||||||||||||
| (as reported) | (adjustments) | (as restated) | ||||||||||
| Revenues |
$ | 76,129 | $ | 612 | $ | 76,741 | ||||||
| Costs of processing and distribution |
34,642 | (1,125 | ) | 33,517 | ||||||||
|
|
|
|
|
|
|
|||||||
| Gross profit |
41,487 | 1,737 | 43,224 | |||||||||
|
|
|
|
|
|
|
|||||||
| Marketing, general and administrative |
37,107 | 2,116 | 39,223 | |||||||||
|
|
|
|
|
|
|
|||||||
| Total operating expenses |
44,587 | 2,116 | 46,703 | |||||||||
|
|
|
|
|
|
|
|||||||
| Operating (loss) |
(3,100 | ) | (379 | ) | (3,479 | ) | ||||||
|
|
|
|
|
|
|
|||||||
| (Loss) before income tax benefit |
(6,892 | ) | (379 | ) | (7,271 | ) | ||||||
| Income tax benefit |
2,040 | 93 | 2,133 | |||||||||
|
|
|
|
|
|
|
|||||||
| Net (loss) |
(4,852 | ) | (286 | ) | (5,138 | ) | ||||||
|
|
|
|
|
|
|
|||||||
| Comprehensive (loss) |
$ | (5,974 | ) | $ | (286 | ) | $ | (6,260 | ) | |||
|
|
|
|
|
|
|
|||||||
| Net (loss) per common share - basic |
$ | (0.06 | ) | $ | (0.01 | ) | $ | (0.07 | ) | |||
|
|
|
|
|
|
|
|||||||
| Net (loss) per common share - diluted |
$ | (0.06 | ) | $ | (0.01 | ) | $ | (0.07 | ) | |||
|
|
|
|
|
|
|
|||||||
152
Table of Contents
30. Restatement of Prior Period Quarterly Financial Statements (Unaudited) (Continued)
Restated Condensed Consolidated Statement of Cash Flows Amounts (Unaudited)
| For the Three Months Ended March 31, 2019 |
||||||||||||
| As Previously Reported |
Adjustments | As Restated | ||||||||||
| Cash flows from operating activities: |
||||||||||||
| Net (loss) |
$ | (9,087 | ) | $ | (264 | ) | $ | (9,351 | ) | |||
| Depreciation and amortization expense |
3,696 | 704 | 4,400 | |||||||||
| Deferred income tax provision |
470 | (86 | ) | 384 | ||||||||
| Accounts receivable |
(2,422 | ) | (295 | ) | (2,717 | ) | ||||||
| Inventories |
(2,742 | ) | 552 | (2,190 | ) | |||||||
| Accounts payable |
(7,253 | ) | (76 | ) | (7,329 | ) | ||||||
| Accrued expenses |
(1,585 | ) | (489 | ) | (2,074 | ) | ||||||
| Other operating assets and liabilities |
(593 | ) | 82 | (511 | ) | |||||||
|
|
|
|
|
|
|
|||||||
| Net cash (used in) operating activities |
(15,685 | ) | 128 | (15,557 | ) | |||||||
|
|
|
|
|
|
|
|||||||
| Cash flows from financing activities |
||||||||||||
| Payments for treasury stock |
— | (128 | ) | (128 | ) | |||||||
|
|
|
|
|
|
|
|||||||
| Net cash used by financing activities |
114,555 | (128 | ) | 114,427 | ||||||||
| For the Six Months Ended June 30, 2019 | ||||||||||||
| As Previously Reported |
Adjustments | As Restated | ||||||||||
| Cash flows from operating activities: |
||||||||||||
| Net (loss) |
$ | (8,343 | ) | $ | (820 | ) | $ | (9,163 | ) | |||
| Depreciation and amortization expense |
7,491 | 2,817 | 10,308 | |||||||||
| Deferred income tax (benefit) |
(2,703 | ) | (266 | ) | (2,969 | ) | ||||||
| Accounts receivable |
(3,509 | ) | 368 | (3,141 | ) | |||||||
| Inventories |
(1,078 | ) | (1,580 | ) | (2,658 | ) | ||||||
| Accounts payable |
(9,675 | ) | (76 | ) | (9,751 | ) | ||||||
| Accrued expenses |
(2,217 | ) | (366 | ) | (2,583 | ) | ||||||
| Other operating assets and liabilities |
145 | 95 | 240 | |||||||||
|
|
|
|
|
|
|
|||||||
| Net cash (used in) operating activities |
(13,111 | ) | 172 | (12,939 | ) | |||||||
|
|
|
|
|
|
|
|||||||
| Cash flows from financing activities |
||||||||||||
| Payments for treasury stock |
— | (172 | ) | (172 | ) | |||||||
|
|
|
|
|
|
|
|||||||
| Net cash used by financing activities |
114,666 | (172 | ) | 114,494 | ||||||||
| For the Nine Months Ended September 30, 2019 |
||||||||||||
| As Previously Reported |
Adjustments | As Restated | ||||||||||
| Cash flows from operating activities: |
||||||||||||
| Net (loss) |
$ | (13,195 | ) | $ | (1,106 | ) | $ | (14,301 | ) | |||
| Depreciation and amortization expense |
11,413 | 4,929 | 16,342 | |||||||||
| Deferred income tax (benefit) |
(4,229 | ) | (359 | ) | (4,588 | ) | ||||||
| Accounts receivable |
(4,278 | ) | (244 | ) | (4,522 | ) | ||||||
| Inventories |
(4,904 | ) | (2,705 | ) | (7,609 | ) | ||||||
| Accounts payable |
(12,608 | ) | (76 | ) | (12,684 | ) | ||||||
| Accrued expenses |
4,329 | (331 | ) | 3,998 | ||||||||
| Other operating assets and liabilities |
177 | 96 | 273 | |||||||||
|
|
|
|
|
|
|
|||||||
| Net cash (used in) operating activities |
(12,709 | ) | 204 | (12,505 | ) | |||||||
|
|
|
|
|
|
|
|||||||
| Cash flows from financing activities |
||||||||||||
| Payments for treasury stock |
— | (204 | ) | (204 | ) | |||||||
|
|
|
|
|
|
|
|||||||
| Net cash used by financing activities |
117,166 | (204 | ) | 116,962 | ||||||||
153
Table of Contents
RTI SURGICAL HOLDINGS, INC. AND SUBSIDIARIES
Valuation and Qualifying Accounts
Years Ended December 31, 2019, 2018 and 2017
(Dollars in thousands)
| Description |
Balance at Beginning of Period |
Charged to Costs and Expenses |
Deductions- Write-offs, Payments |
Balance at End of Period |
||||||||||||
| For the year ended December 31, 2019: |
||||||||||||||||
| Allowance for doubtful accounts |
$ | 2,660 | $ | 2,582 | $ | 144 | $ | 5,098 | ||||||||
| Allowance for product returns |
708 | 60 | 138 | 630 | ||||||||||||
| Allowance for excess and obsolescence |
15,353 | 8,558 | 8,601 | 15,310 | ||||||||||||
| Deferred tax asset valuation allowance |
3,093 | 48,415 | 0 | 51,508 | ||||||||||||
| For the year ended December 31, 2018: |
||||||||||||||||
| Allowance for doubtful accounts |
1,731 | 1,105 | 176 | 2,660 | ||||||||||||
| Allowance for product returns |
795 | 616 | 703 | 708 | ||||||||||||
| Allowance for excess and obsolescence |
8,102 | 15,122 | 7,871 | 15,353 | ||||||||||||
| Deferred tax asset valuation allowance |
7,258 | 2,368 | 6,533 | 3,093 | ||||||||||||
| For the year ended December 31, 2017: |
||||||||||||||||
| Allowance for doubtful accounts |
1,870 | 536 | 675 | 1,731 | ||||||||||||
| Allowance for product returns |
582 | 410 | 197 | 795 | ||||||||||||
| Allowance for excess and obsolescence |
14,798 | 5,066 | 11,762 | 8,102 | ||||||||||||
| Deferred tax asset valuation allowance |
4,916 | 1,668 | (674 | ) | 7,258 | |||||||||||
154
Table of Contents
SIGNATURES
Pursuant to the requirements of Section 13 or 15(d) of the Securities Exchange Act of 1934, the registrant has duly caused this report to be signed on its behalf by the undersigned, thereunto duly authorized.
| June 8, 2020 | RTI SURGICAL HOLDINGS, INC. | |||||
| By: | /s/ Camille I. Farhat | |||||
| Camille I. Farhat | ||||||
| President and Chief Executive Officer | ||||||
Pursuant to the requirements of the Securities Exchange Act of 1934, this report has been signed below by the following persons on behalf of the registrant and in the capacities and on the dates indicated.
| Signature |
Title |
Date | ||
| /s/ Camille I. Farhat Camille I. Farhat |
President and Chief Executive Officer (Principal Executive Officer) and Director |
June 8, 2020 | ||
| /s/ Jonathon M. Singer Jonathon M. Singer |
Chief Financial and Administrative Officer, (Principal Financial Officer) | June 8, 2020 | ||
| /s/ Ryan M. Bartolucci Ryan M. Bartolucci |
Vice President and Chief Accounting Officer (Principal Accounting Officer) | June 8, 2020 | ||
| /s/ Curt M. Selquist Curt M. Selquist |
Chairman | June 8, 2020 | ||
| /s/ Jeffrey C. Lightcap Jeffrey C. Lightcap |
Director | June 8, 2020 | ||
| /s/ Thomas A. McEachin Thomas A. McEachin |
Director | June 8, 2020 | ||
|
Stuart F. Simpson |
Director | |||
| /s/ Mark D. Stolper Mark D. Stolper |
Director | June 8, 2020 | ||
| /s/ Christopher R. Sweeney Christopher R. Sweeney |
Director | June 8, 2020 | ||
| /s/ Paul G. Thomas Paul G. Thomas |
Director | June 8, 2020 | ||
| /s/ Nicholas J. Valeriani Nicholas J. Valeriani |
Director | June 8, 2020 | ||
| /s/ Shirley A. Weis Shirley A. Weis |
Director | June 8, 2020 | ||