Attached files
| file | filename |
|---|---|
| 8-K - 8-K - HERITAGE FINANCIAL CORP /WA/ | form8-kinvestorpresent.htm |
Investor Presentation Q1 2020 Jeff Deuel, Chief Executive Officer Bryan McDonald, Chief Operating Officer Don Hinson, Chief Financial Officer 1
R: 20 Forward – Looking Statement G: 80 This presentation contains forward-looking statements that are subject to risks and uncertainties, including, but not limited to: B: 155 • The effect of the COVID-19 pandemic, including on Heritage’s credit quality and business operations, as well as its impact on general economic and financial market conditions and other uncertainties resulting from the COVID-19 pandemic, such as the extent and duration of the impact on public health, the U.S. and global economies, and consumer and corporate customers, including economic activity, employment levels and market liquidity; • The expected revenues, cost savings, synergies and other benefits from our other merger and acquisition activities might not be realized within the anticipated time frames or at all, and costs or difficulties relating to integration matters, including but not limited to, customer and employee retention, R: 105 might be greater than expected; G: 149 • The credit and concentration risks of lending activities; B: 253 • Changes in general economic conditions, either nationally or in our market areas; • Competitive market pricing factors and interest rate risks; • Market interest rate volatility; • Balance sheet (for example, loan) concentrations; • Fluctuations in demand for loans and other financial services in our market areas; • Changes in legislative or regulatory requirements or the results of regulatory examinations; • The ability to recruit and retain key management and staff; • Risks associated with our ability to implement our expansion strategy and merger integration; • Stability of funding sources and continued availability of borrowings; • Adverse changes in the securities markets; • The inability of key third-party providers to perform their obligations to us; • Changes in accounting policies and practices, including changes in accounting principles relating to loan loss recognition (CECL), and the use of estimates in determining fair value of certain of our assets, which estimates may prove to be incorrect and result in significant declines in valuation; and • These and other risks as may be detailed from time to time in our filings with the Securities and Exchange Commission. Heritage cautions readers not to place undue reliance on any forward-looking statements. Moreover, you should treat these statements as speaking only as of the date they are made and based only on information then actually known to Heritage. Heritage does not undertake and specifically disclaims any obligation to revise any forward-looking statements to reflect the occurrence of anticipated or unanticipated events or circumstances after the date of such statements. These risks could cause our actual results for the second quarter of 2020 and beyond to differ materially from those expressed in any forward-looking statements by, or on behalf of, us, and could negatively affect Heritage’s operating and stock price performance. 2
R: 20 G: 80 B: 155 R: 105 G: 149 B: 253 Company Overview 3
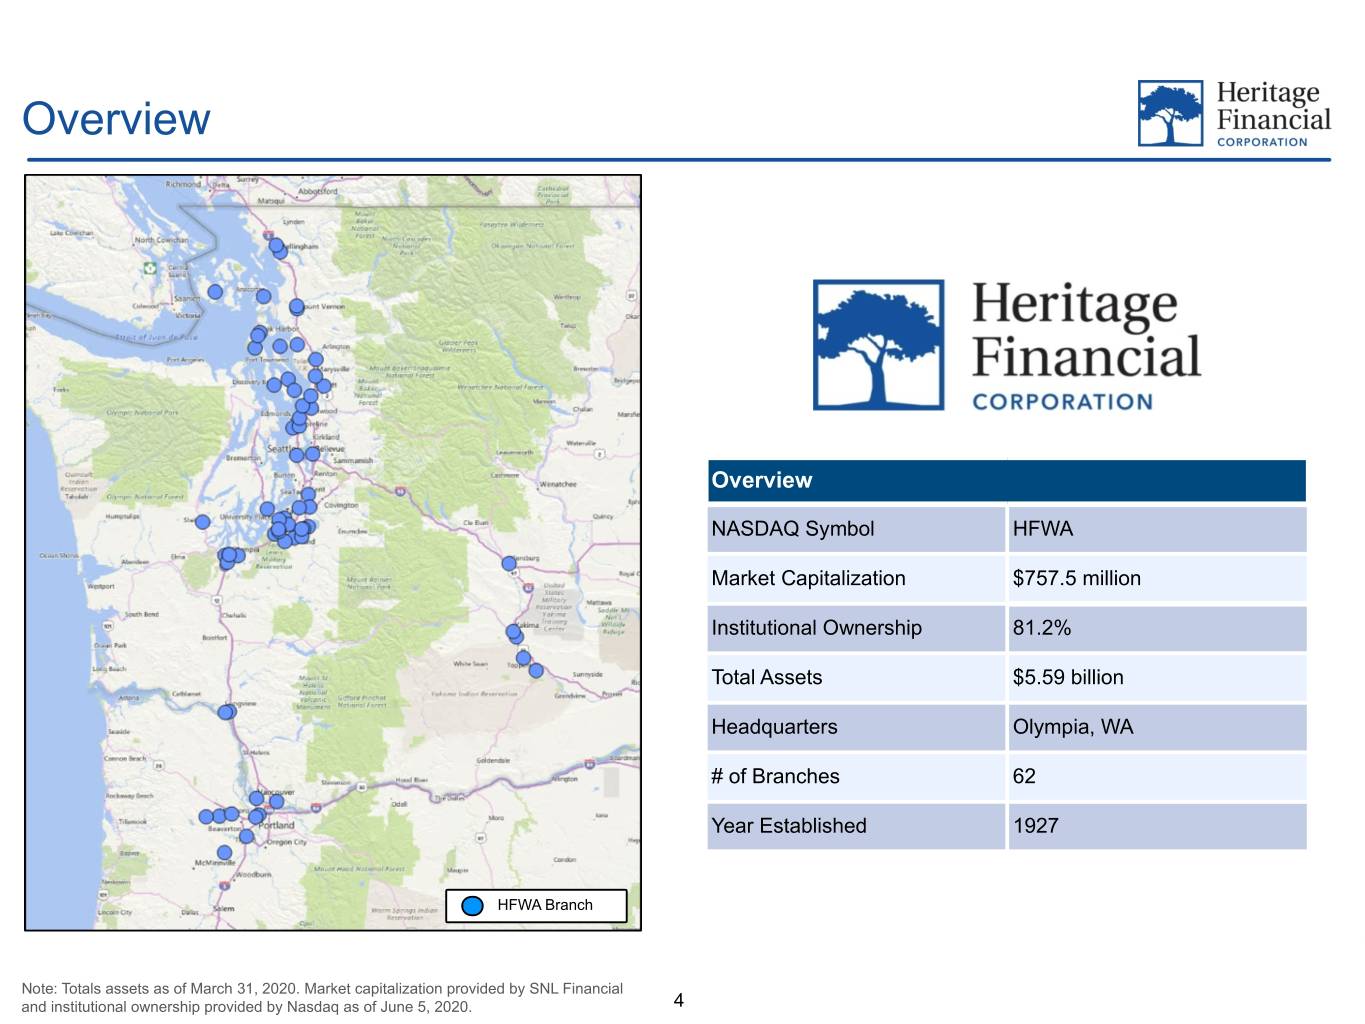
R: 20 Overview G: 80 B: 155 R: 105 G: 149 B: 253 Overview NASDAQ Symbol HFWA Market Capitalization $757.5 million Institutional Ownership 81.2% Total Assets $5.59 billion Headquarters Olympia, WA # of Branches 62 Year Established 1927 HFWA Branch Note: Totals assets as of March 31, 2020. Market capitalization provided by SNL Financial and institutional ownership provided by Nasdaq as of June 5, 2020. 4
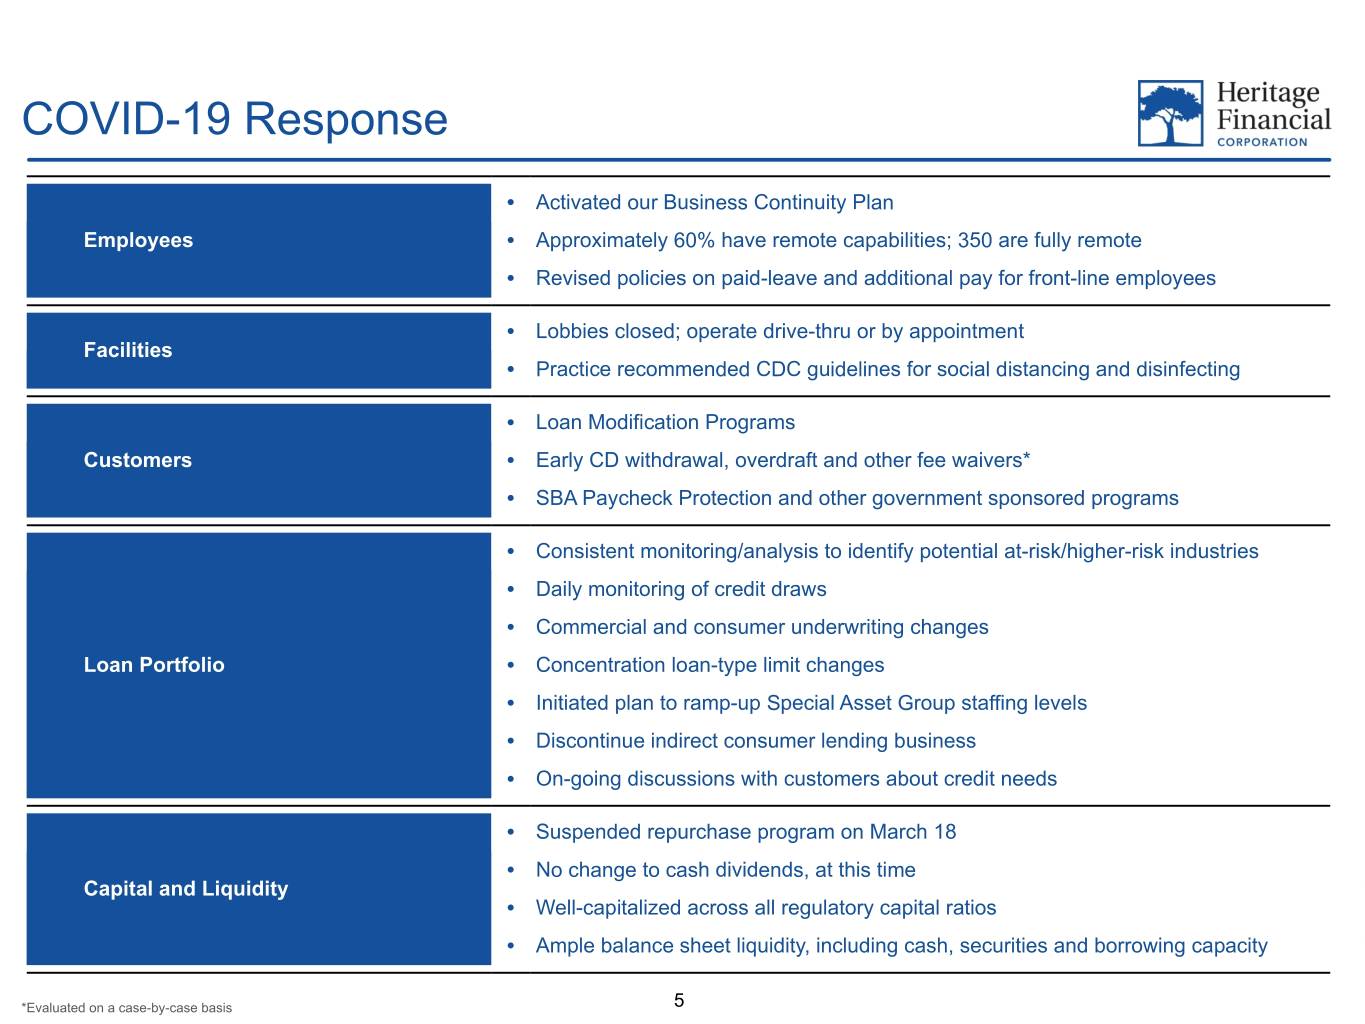
R: 20 COVID-19 Response G: 80 Ÿ Activated our Business Continuity Plan B: 155 Employees Ÿ Approximately 60% have remote capabilities; 350 are fully remote Ÿ Revised policies on paid-leave and additional pay for front-line employees R: 105 Ÿ Lobbies closed; operate drive-thru or by appointment Facilities G: 149 Ÿ Practice recommended CDC guidelines for social distancing and disinfecting B: 253 Ÿ Loan Modification Programs Customers Ÿ Early CD withdrawal, overdraft and other fee waivers* Ÿ SBA Paycheck Protection and other government sponsored programs Ÿ Consistent monitoring/analysis to identify potential at-risk/higher-risk industries Ÿ Daily monitoring of credit draws Ÿ Commercial and consumer underwriting changes Loan Portfolio Ÿ Concentration loan-type limit changes Ÿ Initiated plan to ramp-up Special Asset Group staffing levels Ÿ Discontinue indirect consumer lending business Ÿ On-going discussions with customers about credit needs Ÿ Suspended repurchase program on March 18 Ÿ No change to cash dividends, at this time Capital and Liquidity Ÿ Well-capitalized across all regulatory capital ratios Ÿ Ample balance sheet liquidity, including cash, securities and borrowing capacity *Evaluated on a case-by-case basis 5
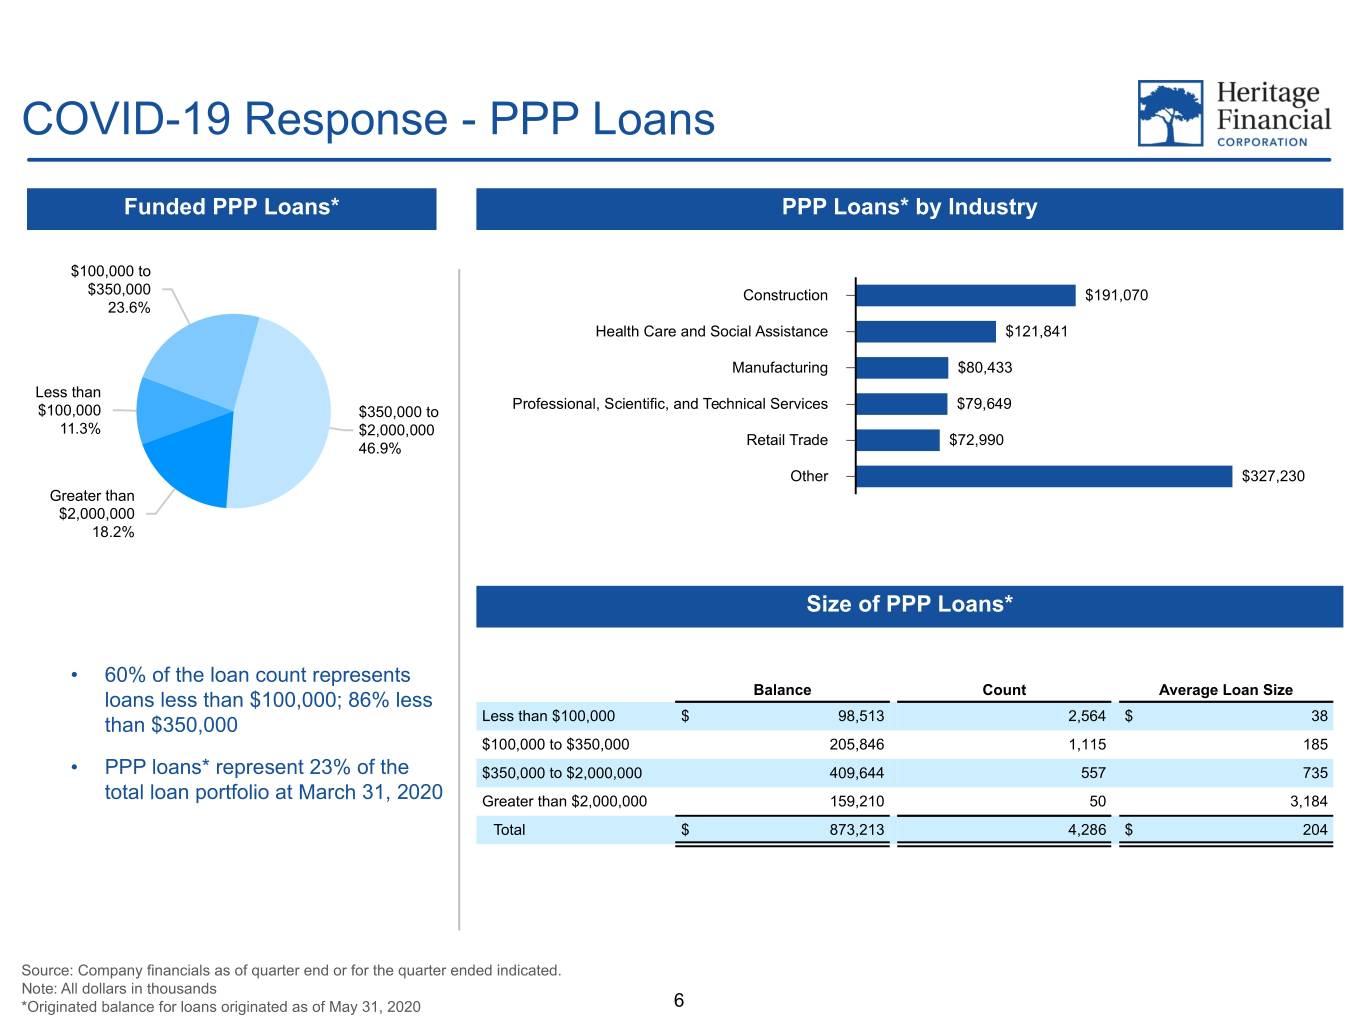
R: 20 COVID-19 Response - PPP Loans G: 80 B: 155 Funded PPP Loans* PPP Loans* by Industry $100,000 to $350,000 Construction $191,070 23.6% R: 105 Health Care and Social Assistance $121,841 G: 149 Manufacturing $80,433 Less than Professional, Scientific, and Technical Services $79,649 B: 253 $100,000 $350,000 to 11.3% $2,000,000 Retail Trade $72,990 46.9% Other $327,230 Greater than $2,000,000 18.2% Size of PPP Loans* • 60% of the loan count represents loans less than $100,000; 86% less Balance Count Average Loan Size than $350,000 Less than $100,000 $ 98,513 2,564 $ 38 $100,000 to $350,000 205,846 1,115 185 • PPP loans* represent 23% of the $350,000 to $2,000,000 409,644 557 735 total loan portfolio at March 31, 2020 Greater than $2,000,000 159,210 50 3,184 Total $ 873,213 4,286 $ 204 Source: Company financials as of quarter end or for the quarter ended indicated. Note: All dollars in thousands *Originated balance for loans originated as of May 31, 2020 6
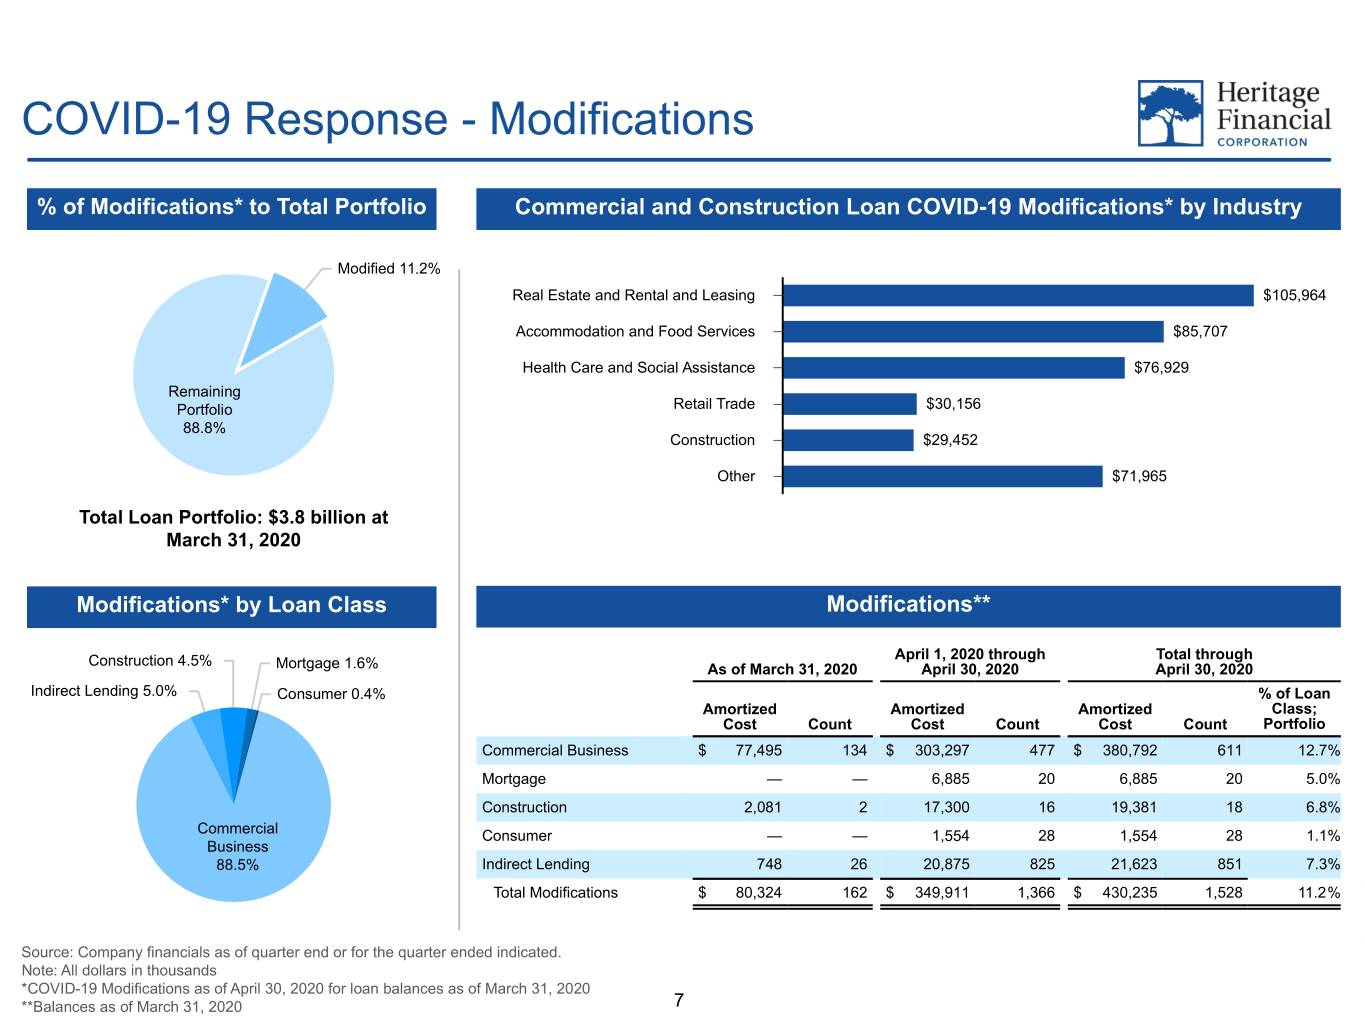
R: 20 COVID-19 Response - Modifications G: 80 B: 155 % of Modifications* to Total Portfolio Commercial and Construction Loan COVID-19 Modifications* by Industry Modified 11.2% Real Estate and Rental and Leasing $105,964 R: 105 Accommodation and Food Services $85,707 G: 149 Health Care and Social Assistance $76,929 Remaining B: 253 Portfolio Retail Trade $30,156 88.8% Construction $29,452 Other $71,965 Total Loan Portfolio: $3.8 billion at March 31, 2020 Modifications* by Loan Class Modifications** Construction 4.5% April 1, 2020 through Total through Mortgage 1.6% As of March 31, 2020 April 30, 2020 April 30, 2020 Indirect Lending 5.0% Consumer 0.4% % of Loan Amortized Amortized Amortized Class; Cost Count Cost Count Cost Count Portfolio Commercial Business $ 77,495 134 $ 303,297 477 $ 380,792 611 12.7% Mortgage — — 6,885 20 6,885 20 5.0% Construction 2,081 2 17,300 16 19,381 18 6.8% Commercial Consumer — — 1,554 28 1,554 28 1.1% Business 88.5% Indirect Lending 748 26 20,875 825 21,623 851 7.3% Total Modifications $ 80,324 162 $ 349,911 1,366 $ 430,235 1,528 11.2% Source: Company financials as of quarter end or for the quarter ended indicated. Note: All dollars in thousands *COVID-19 Modifications as of April 30, 2020 for loan balances as of March 31, 2020 **Balances as of March 31, 2020 7
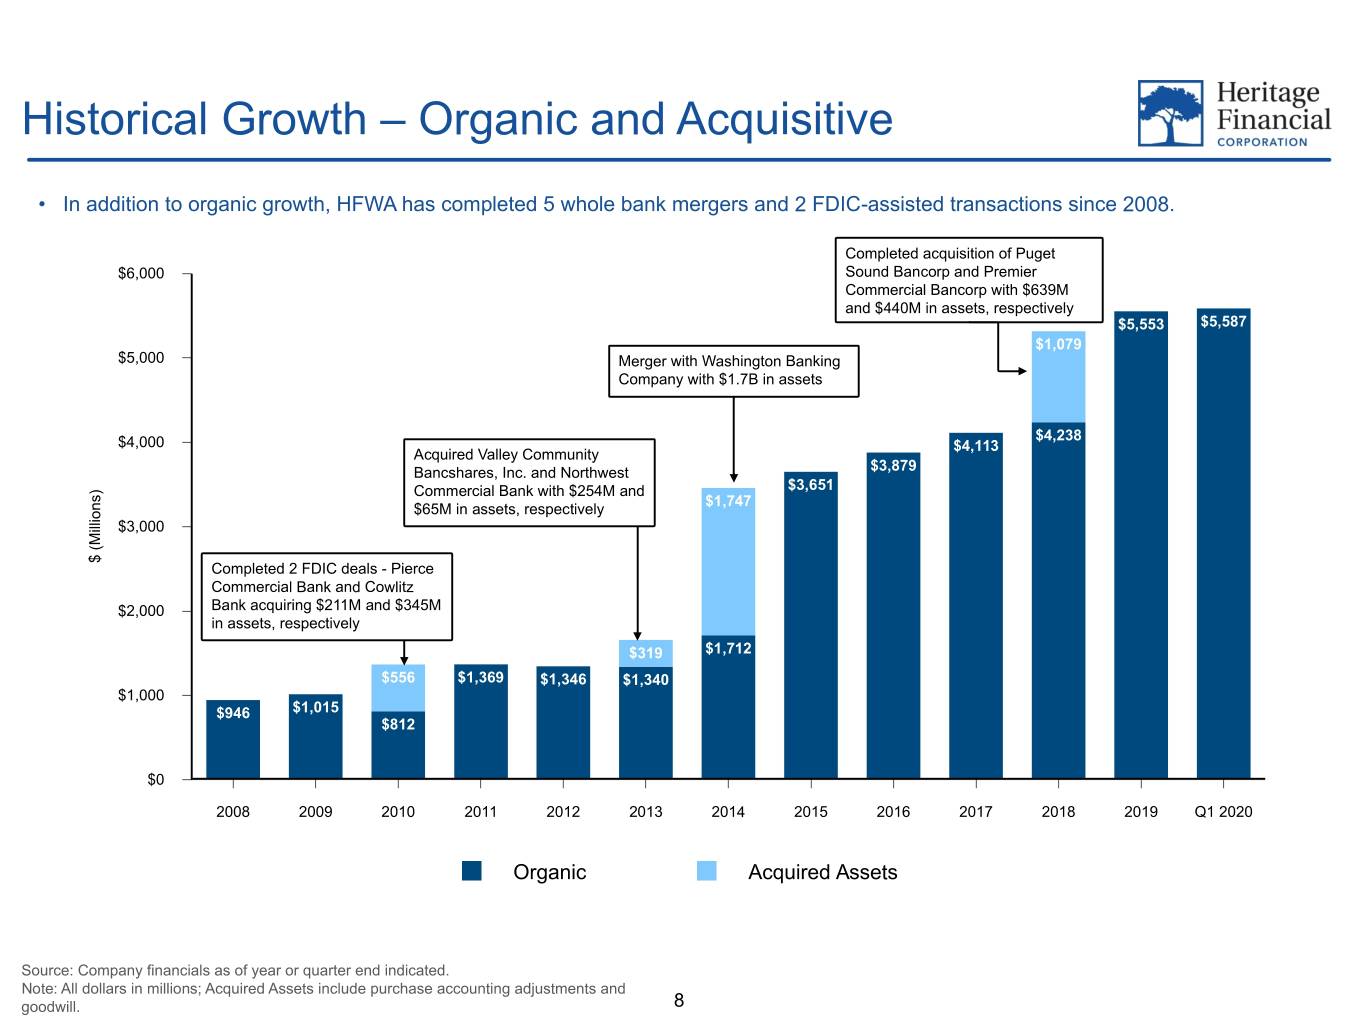
R: 20 Historical Growth – Organic and Acquisitive G: 80 B: 155 • In addition to organic growth, HFWA has completed 5 whole bank mergers and 2 FDIC-assisted transactions since 2008. Completed acquisition of Puget $6,000 Sound Bancorp and Premier Commercial Bancorp with $639M and $440M in assets, respectively R: 105 $5,553 $5,587 $1,079 G: 149 $5,000 Merger with Washington Banking Company with $1.7B in assets B: 253 $4,238 $4,000 $4,113 Acquired Valley Community Bancshares, Inc. and Northwest $3,879 $3,651 ) Commercial Bank with $254M and s $1,747 n $65M in assets, respectively o i l l i $3,000 M ( $ Completed 2 FDIC deals - Pierce Commercial Bank and Cowlitz $2,000 Bank acquiring $211M and $345M in assets, respectively $319 $1,712 $556 $1,369 $1,346 $1,340 $1,000 $946 $1,015 $812 $0 2008 2009 2010 2011 2012 2013 2014 2015 2016 2017 2018 2019 Q1 2020 Organic Acquired Assets Source: Company financials as of year or quarter end indicated. Note: All dollars in millions; Acquired Assets include purchase accounting adjustments and goodwill. 8
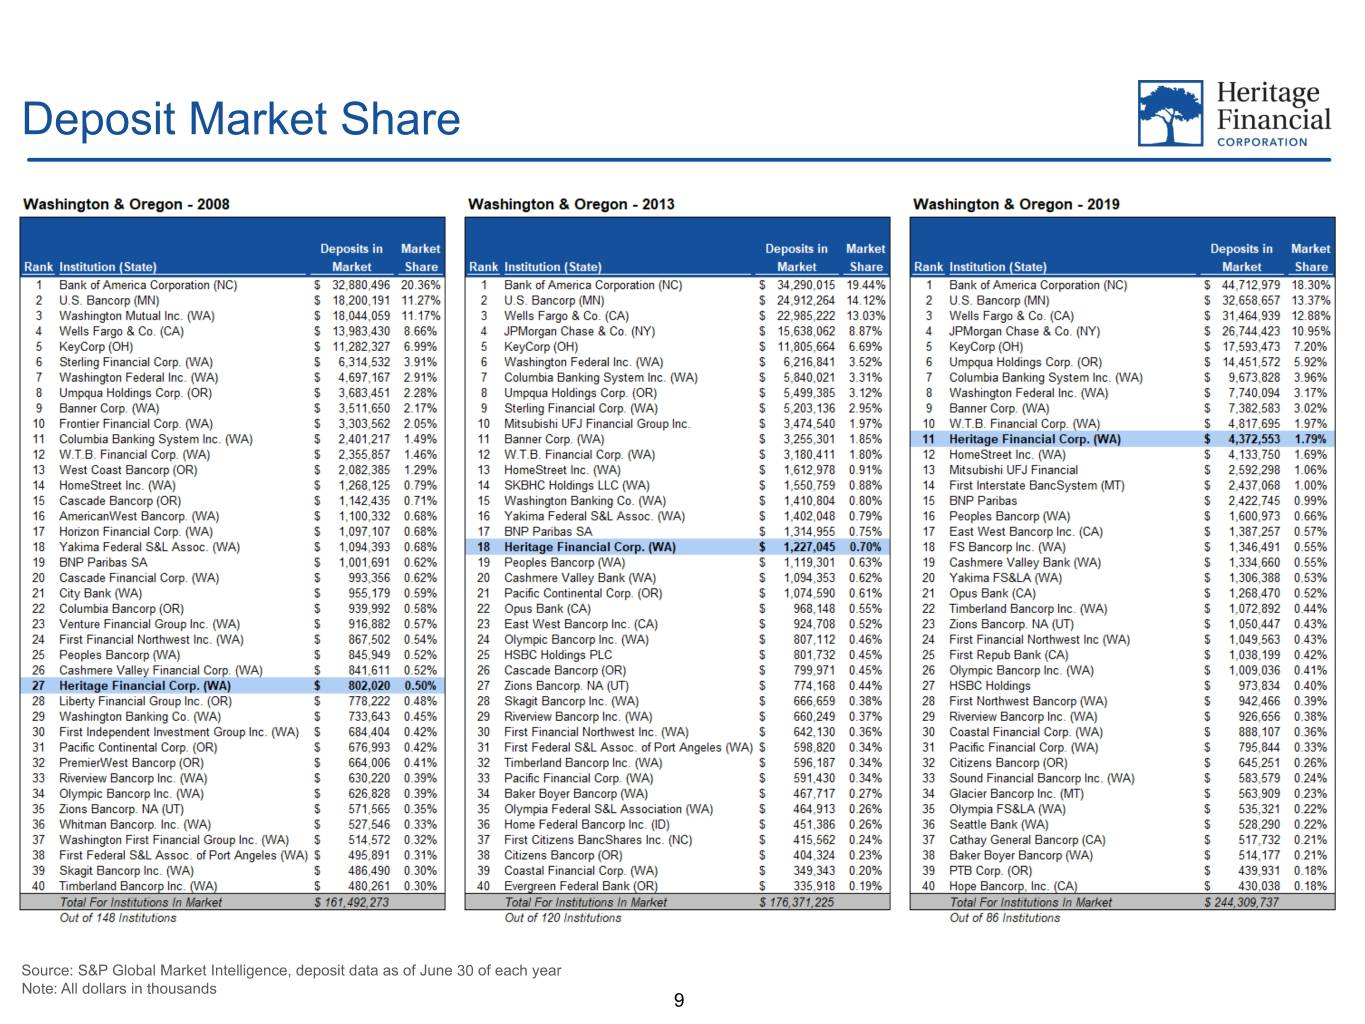
R: 20 Deposit Market Share G: 80 B: 155 R: 105 G: 149 B: 253 Source: S&P Global Market Intelligence, deposit data as of June 30 of each year Note: All dollars in thousands 9
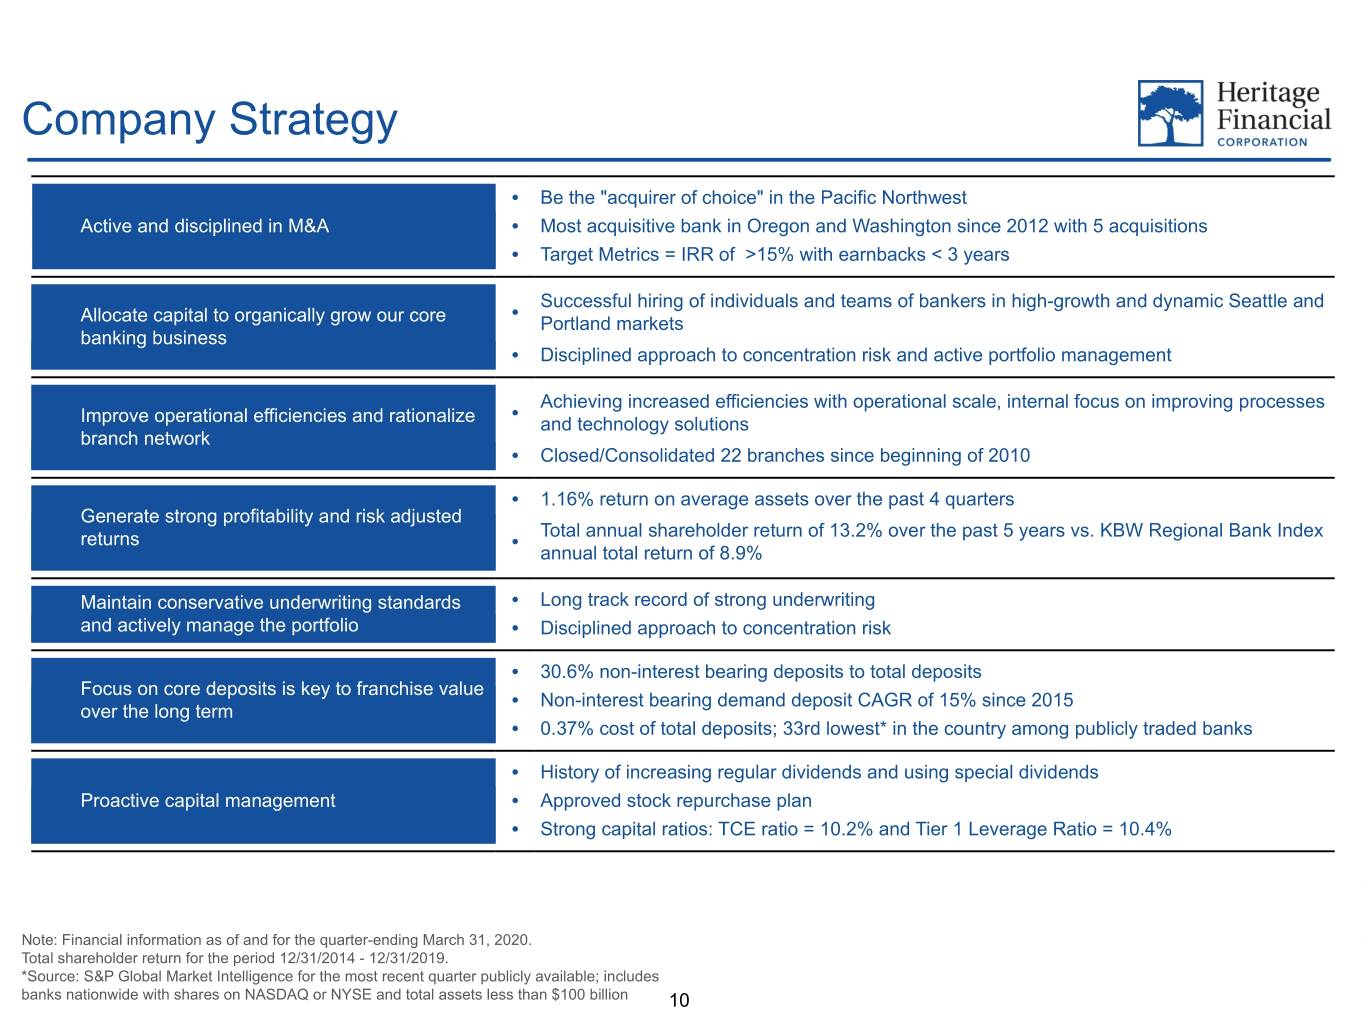
R: 20 Company Strategy G: 80 Ÿ Be the "acquirer of choice" in the Pacific Northwest B: 155 Active and disciplined in M&A Ÿ Most acquisitive bank in Oregon and Washington since 2012 with 5 acquisitions Ÿ Target Metrics = IRR of >15% with earnbacks < 3 years Ÿ Successful hiring of individuals and teams of bankers in high-growth and dynamic Seattle and R: 105 Allocate capital to organically grow our core Portland markets banking business G: 149 Ÿ Disciplined approach to concentration risk and active portfolio management B: 253 Ÿ Achieving increased efficiencies with operational scale, internal focus on improving processes Improve operational efficiencies and rationalize and technology solutions branch network Ÿ Closed/Consolidated 22 branches since beginning of 2010 Ÿ 1.16% return on average assets over the past 4 quarters Generate strong profitability and risk adjusted returns Ÿ Total annual shareholder return of 13.2% over the past 5 years vs. KBW Regional Bank Index annual total return of 8.9% Ÿ Maintain conservative underwriting standards Long track record of strong underwriting and actively manage the portfolio Ÿ Disciplined approach to concentration risk Ÿ 30.6% non-interest bearing deposits to total deposits Focus on core deposits is key to franchise value Ÿ Non-interest bearing demand deposit CAGR of 15% since 2015 over the long term Ÿ 0.37% cost of total deposits; 33rd lowest* in the country among publicly traded banks Ÿ History of increasing regular dividends and using special dividends Proactive capital management Ÿ Approved stock repurchase plan Ÿ Strong capital ratios: TCE ratio = 10.2% and Tier 1 Leverage Ratio = 10.4% Note: Financial information as of and for the quarter-ending March 31, 2020. Total shareholder return for the period 12/31/2014 - 12/31/2019. *Source: S&P Global Market Intelligence for the most recent quarter publicly available; includes banks nationwide with shares on NASDAQ or NYSE and total assets less than $100 billion 10
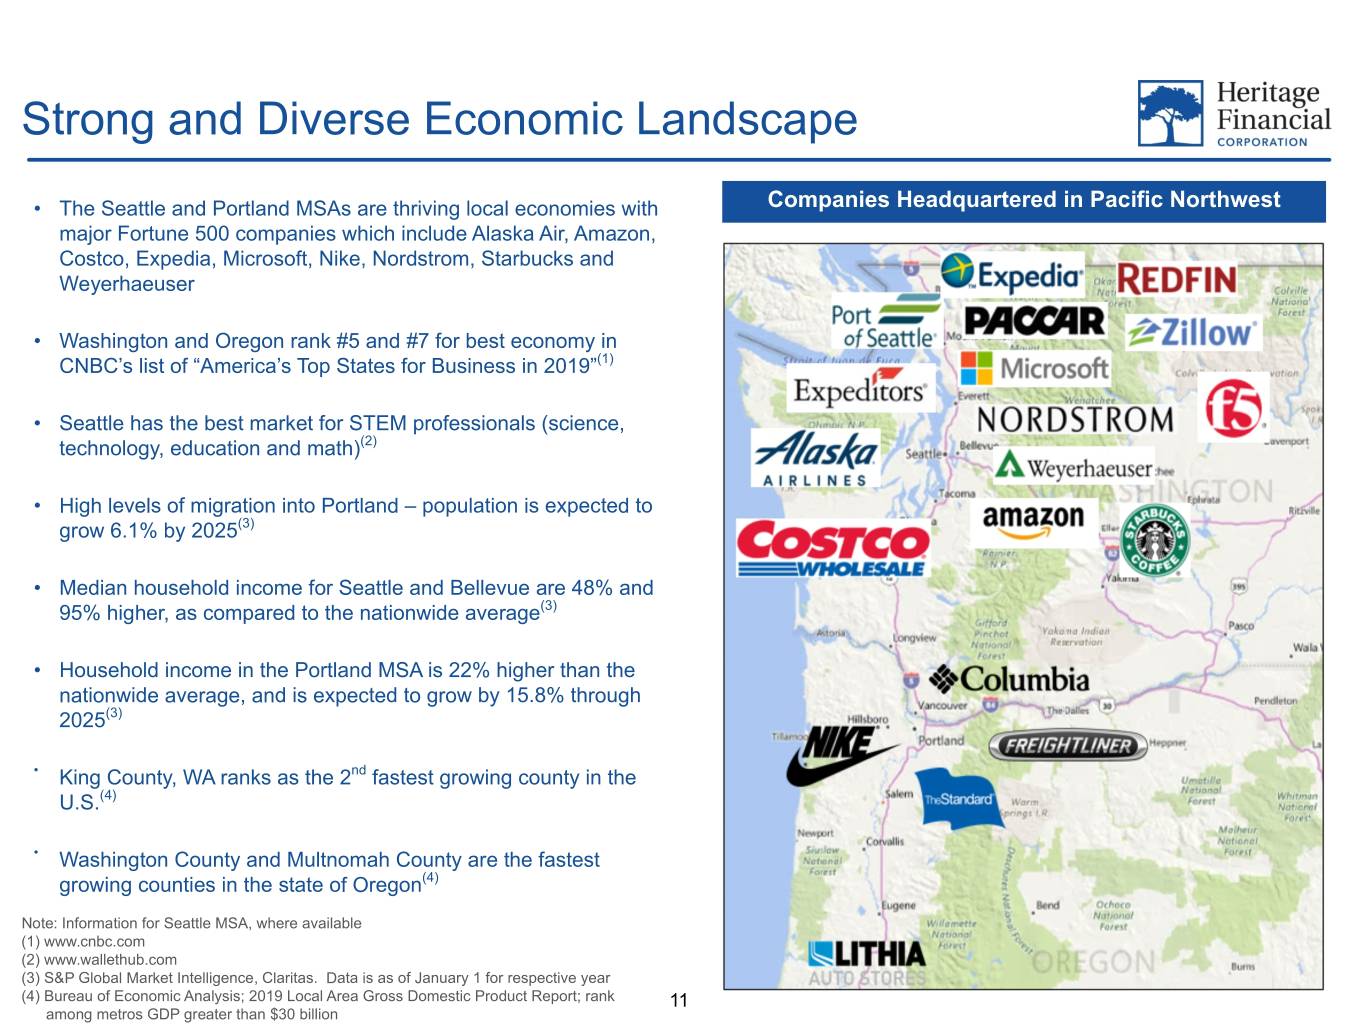
R: 20 Strong and Diverse Economic Landscape G: 80 • The Seattle and Portland MSAs are thriving local economies with Companies Headquartered in Pacific Northwest B: 155 major Fortune 500 companies which include Alaska Air, Amazon, Costco, Expedia, Microsoft, Nike, Nordstrom, Starbucks and Weyerhaeuser R: 105 • Washington and Oregon rank #5 and #7 for best economy in G: 149 CNBC’s list of “America’s Top States for Business in 2019”(1) B: 253 • Seattle has the best market for STEM professionals (science, technology, education and math)(2) • High levels of migration into Portland – population is expected to grow 6.1% by 2025(3) • Median household income for Seattle and Bellevue are 48% and 95% higher, as compared to the nationwide average(3) • Household income in the Portland MSA is 22% higher than the nationwide average, and is expected to grow by 15.8% through 2025(3) • King County, WA ranks as the 2nd fastest growing county in the U.S.(4) • Washington County and Multnomah County are the fastest growing counties in the state of Oregon(4) Note: Information for Seattle MSA, where available (1) www.cnbc.com (2) www.wallethub.com (3) S&P Global Market Intelligence, Claritas. Data is as of January 1 for respective year (4) Bureau of Economic Analysis; 2019 Local Area Gross Domestic Product Report; rank 11 among metros GDP greater than $30 billion
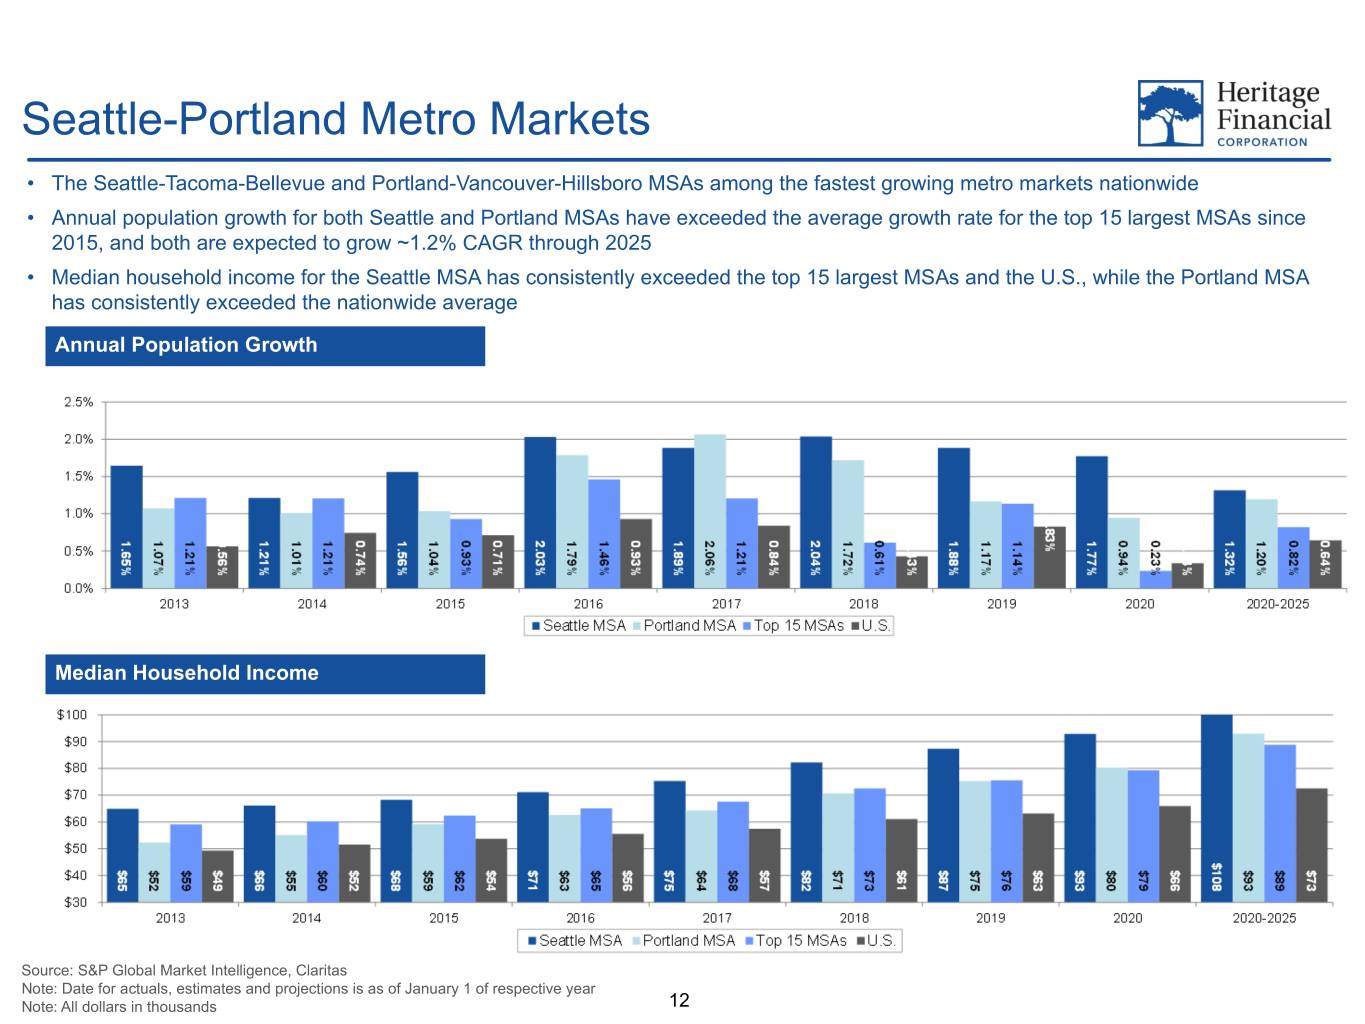
R: 20 Seattle-Portland Metro Markets G: 80 • The Seattle-Tacoma-Bellevue and Portland-Vancouver-Hillsboro MSAs among the fastest growing metro markets nationwide B: 155 • Annual population growth for both Seattle and Portland MSAs have exceeded the average growth rate for the top 15 largest MSAs since 2015, and both are expected to grow ~1.2% CAGR through 2025 • Median household income for the Seattle MSA has consistently exceeded the top 15 largest MSAs and the U.S., while the Portland MSA R: 105 has consistently exceeded the nationwide average G: 149 Annual Population Growth B: 253 Median Household Income Source: S&P Global Market Intelligence, Claritas Note: Date for actuals, estimates and projections is as of January 1 of respective year Note: All dollars in thousands 12
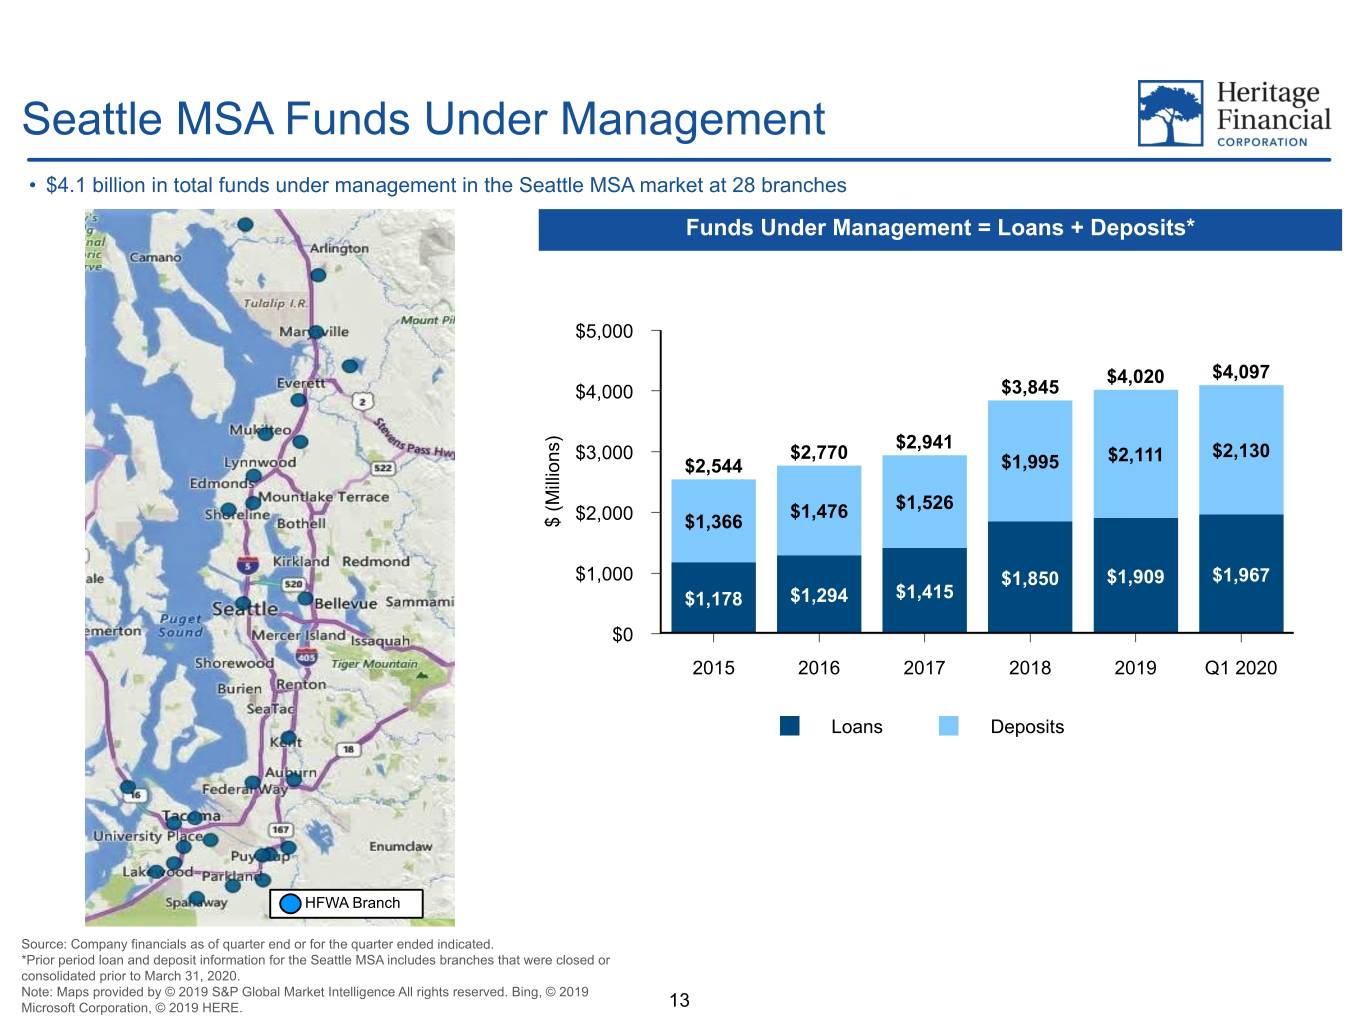
R: 20 Seattle MSA Funds Under Management G: 80 • $4.1 billion in total funds under management in the Seattle MSA market at 28 branches B: 155 Funds Under Management = Loans + Deposits* R: 105 $5,000 G: 149 $4,020 $4,097 B: 253 $4,000 $3,845 ) s $2,941 $2,130 n $2,770 $3,000 $1,995 $2,111 o $2,544 i l l i M ( $1,526 $2,000 $1,476 $ $1,366 $1,000 $1,850 $1,909 $1,967 $1,178 $1,294 $1,415 $0 2015 2016 2017 2018 2019 Q1 2020 Loans Deposits HFWA Branch Source: Company financials as of quarter end or for the quarter ended indicated. *Prior period loan and deposit information for the Seattle MSA includes branches that were closed or consolidated prior to March 31, 2020. Note: Maps provided by © 2019 S&P Global Market Intelligence All rights reserved. Bing, © 2019 Microsoft Corporation, © 2019 HERE. 13
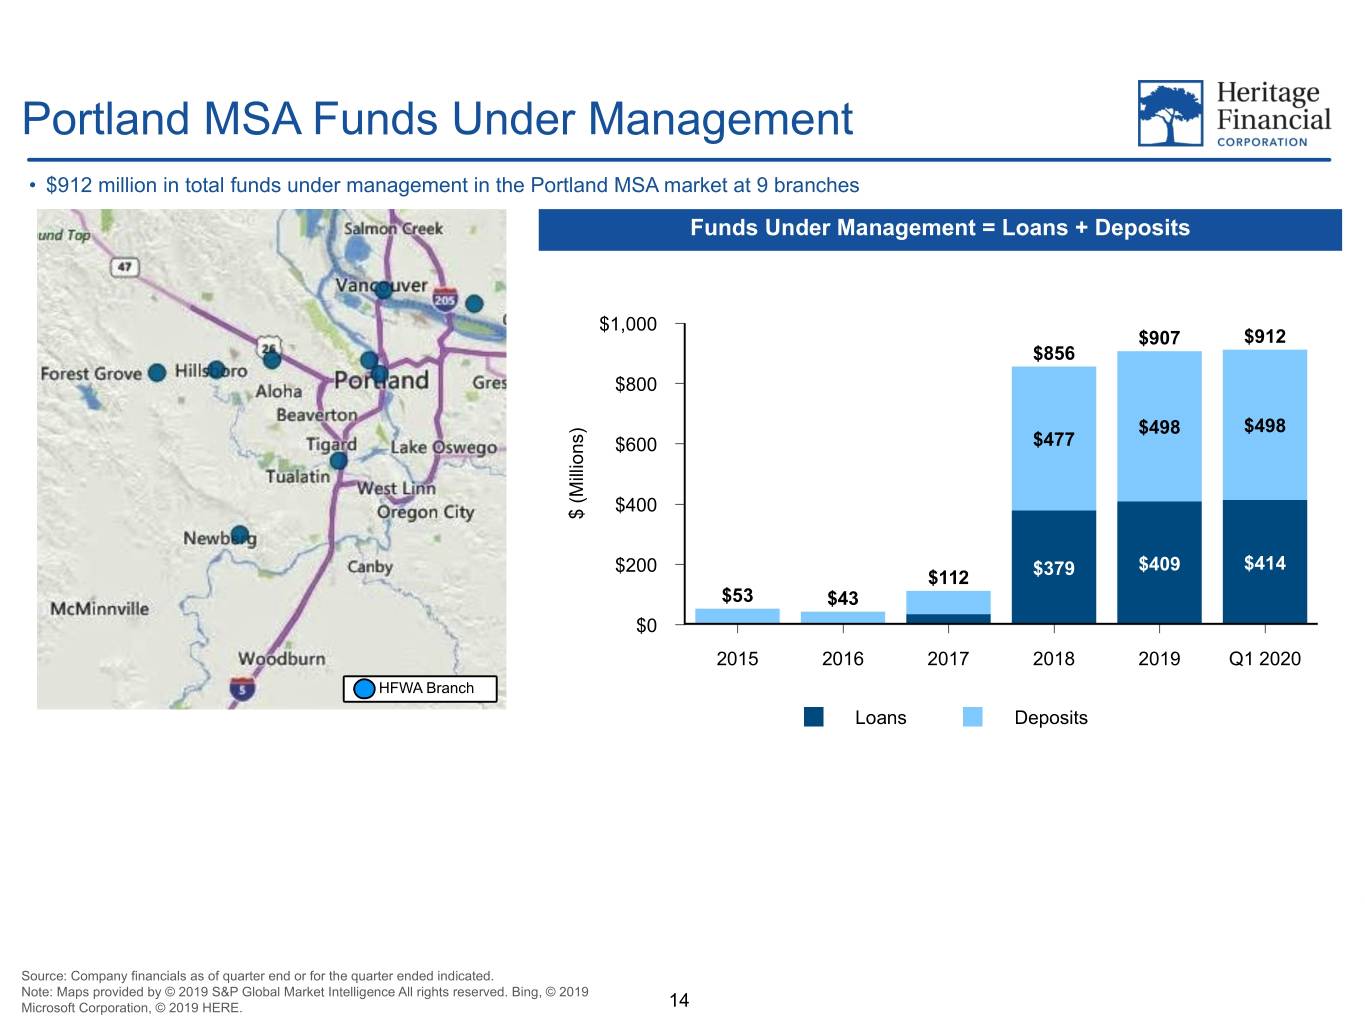
R: 20 Portland MSA Funds Under Management G: 80 • $912 million in total funds under management in the Portland MSA market at 9 branches B: 155 Funds Under Management = Loans + Deposits R: 105 $1,000 $907 $912 G: 149 $856 B: 253 $800 ) $498 $498 s $477 n $600 o i l l i M ( $400 $ $200 $409 $414 $112 $379 $53 $43 $0 2015 2016 2017 2018 2019 Q1 2020 HFWA Branch Loans Deposits Source: Company financials as of quarter end or for the quarter ended indicated. Note: Maps provided by © 2019 S&P Global Market Intelligence All rights reserved. Bing, © 2019 Microsoft Corporation, © 2019 HERE. 14
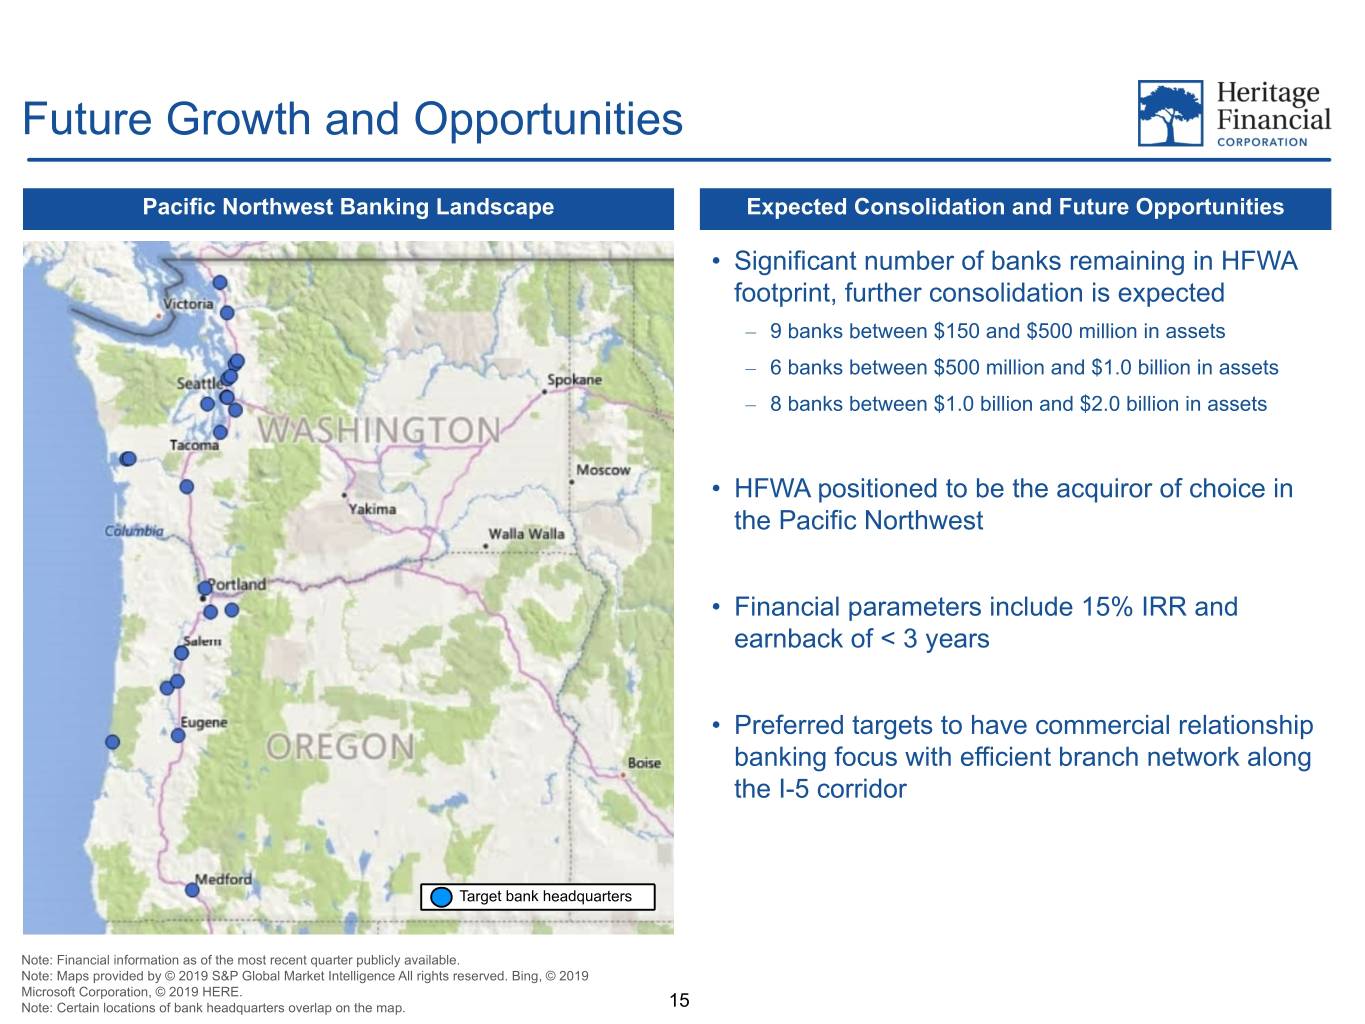
R: 20 Future Growth and Opportunities G: 80 B: 155 Pacific Northwest Banking Landscape Expected Consolidation and Future Opportunities • Significant number of banks remaining in HFWA footprint, further consolidation is expected R: 105 – 9 banks between $150 and $500 million in assets G: 149 – 6 banks between $500 million and $1.0 billion in assets B: 253 – 8 banks between $1.0 billion and $2.0 billion in assets • HFWA positioned to be the acquiror of choice in the Pacific Northwest • Financial parameters include 15% IRR and earnback of < 3 years • Preferred targets to have commercial relationship banking focus with efficient branch network along the I-5 corridor Target bank headquarters Note: Financial information as of the most recent quarter publicly available. Note: Maps provided by © 2019 S&P Global Market Intelligence All rights reserved. Bing, © 2019 Microsoft Corporation, © 2019 HERE. Note: Certain locations of bank headquarters overlap on the map. 15
R: 20 G: 80 B: 155 R: 105 G: 149 B: 253 Financial Update 16
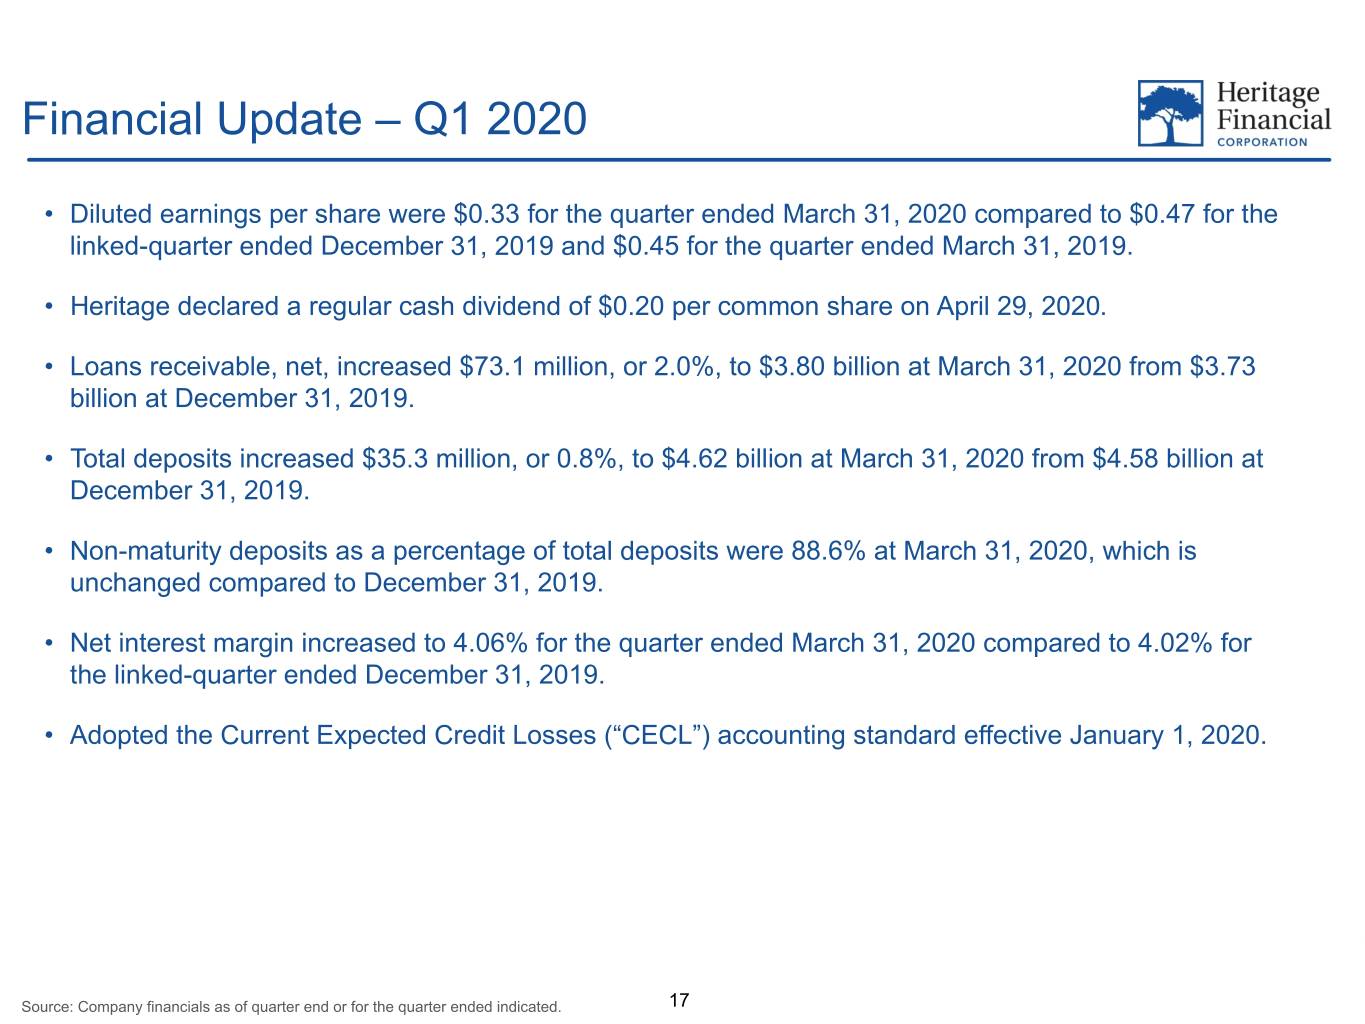
R: 20 Financial Update – Q1 2020 G: 80 B: 155 • Diluted earnings per share were $0.33 for the quarter ended March 31, 2020 compared to $0.47 for the linked-quarter ended December 31, 2019 and $0.45 for the quarter ended March 31, 2019. R: 105 • Heritage declared a regular cash dividend of $0.20 per common share on April 29, 2020. G: 149 • Loans receivable, net, increased $73.1 million, or 2.0%, to $3.80 billion at March 31, 2020 from $3.73 B: 253 billion at December 31, 2019. • Total deposits increased $35.3 million, or 0.8%, to $4.62 billion at March 31, 2020 from $4.58 billion at December 31, 2019. • Non-maturity deposits as a percentage of total deposits were 88.6% at March 31, 2020, which is unchanged compared to December 31, 2019. • Net interest margin increased to 4.06% for the quarter ended March 31, 2020 compared to 4.02% for the linked-quarter ended December 31, 2019. • Adopted the Current Expected Credit Losses (“CECL”) accounting standard effective January 1, 2020. Source: Company financials as of quarter end or for the quarter ended indicated. 17
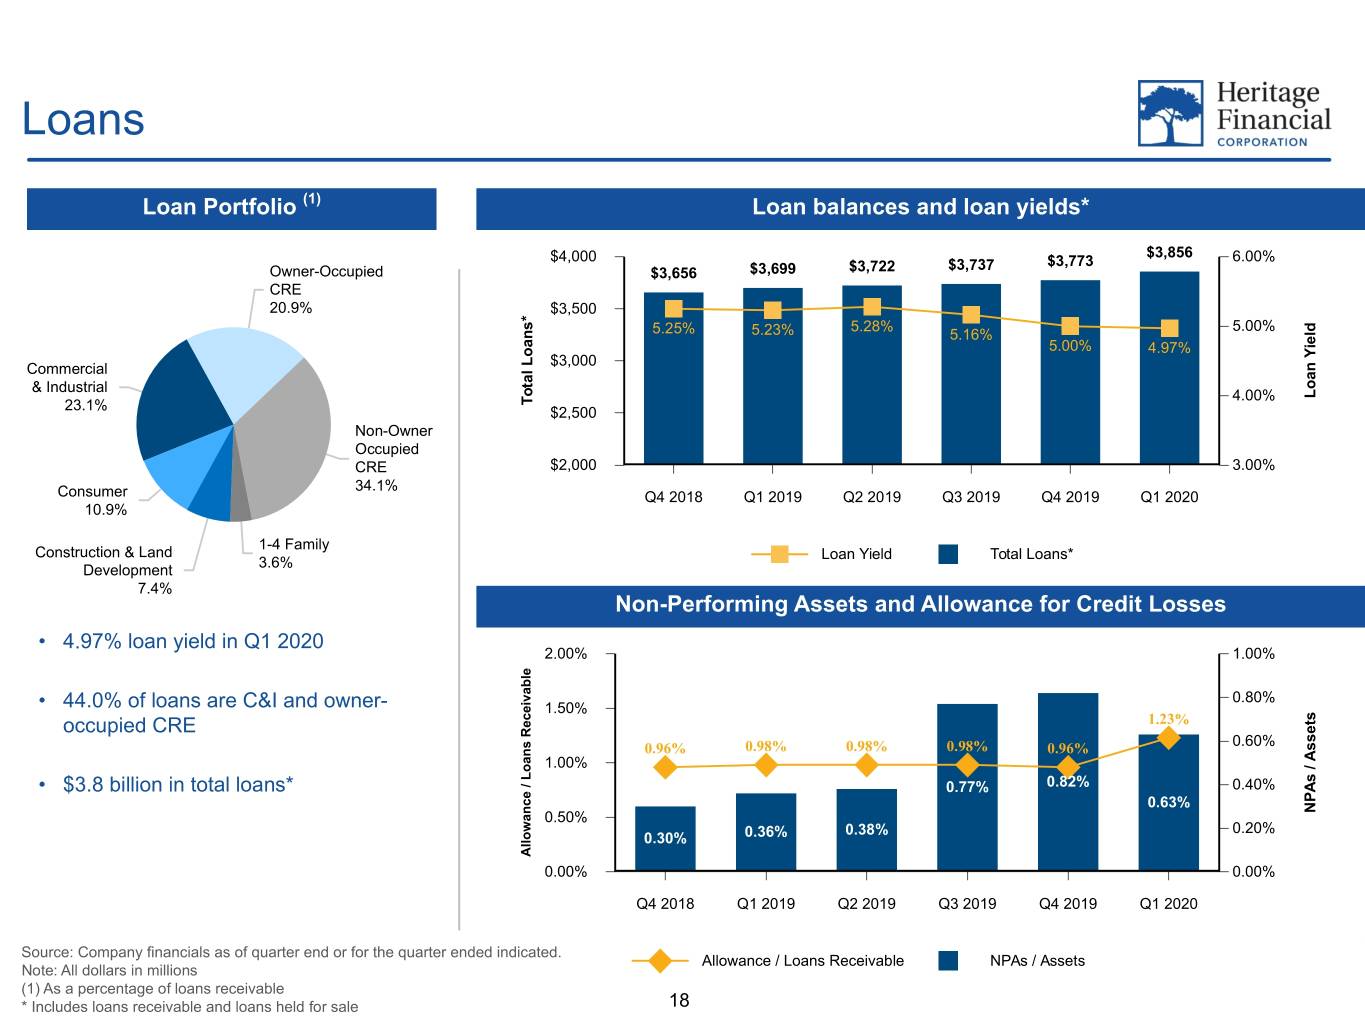
R: 20 Loans G: 80 (1) B: 155 Loan Portfolio Loan balances and loan yields* $4,000 $3,856 6.00% $3,737 $3,773 Owner-Occupied $3,656 $3,699 $3,722 CRE 20.9% $3,500 * s 5.28% 5.00% d R: 105 5.25% 5.23% l n 5.16% e a 5.00% 4.97% i o Y L $3,000 n G: 149 Commercial l a a t & Industrial o o 4.00% L T B: 253 23.1% $2,500 Non-Owner Occupied CRE $2,000 3.00% 34.1% Consumer Q4 2018 Q1 2019 Q2 2019 Q3 2019 Q4 2019 Q1 2020 10.9% 1-4 Family Construction & Land Loan Yield Total Loans* 3.6% Development 7.4% Non-Performing Assets and Allowance for Credit Losses • 4.97% loan yield in Q1 2020 2.00% 1.00% e l b a v 0.80% • 44.0% of loans are C&I and owner- i e 1.50% s c 1.23% t e occupied CRE e R s s 0.60% 0.98% 0.98% 0.98% s n 0.96% 0.96% A a 1.00% / o L s / 0.82% • $3.8 billion in total loans* 0.77% 0.40% A e P c 0.63% N n a 0.50% w 0.38% 0.20% o 0.36% l 0.30% l A 0.00% 0.00% Q4 2018 Q1 2019 Q2 2019 Q3 2019 Q4 2019 Q1 2020 Source: Company financials as of quarter end or for the quarter ended indicated. Allowance / Loans Receivable NPAs / Assets Note: All dollars in millions (1) As a percentage of loans receivable * Includes loans receivable and loans held for sale 18
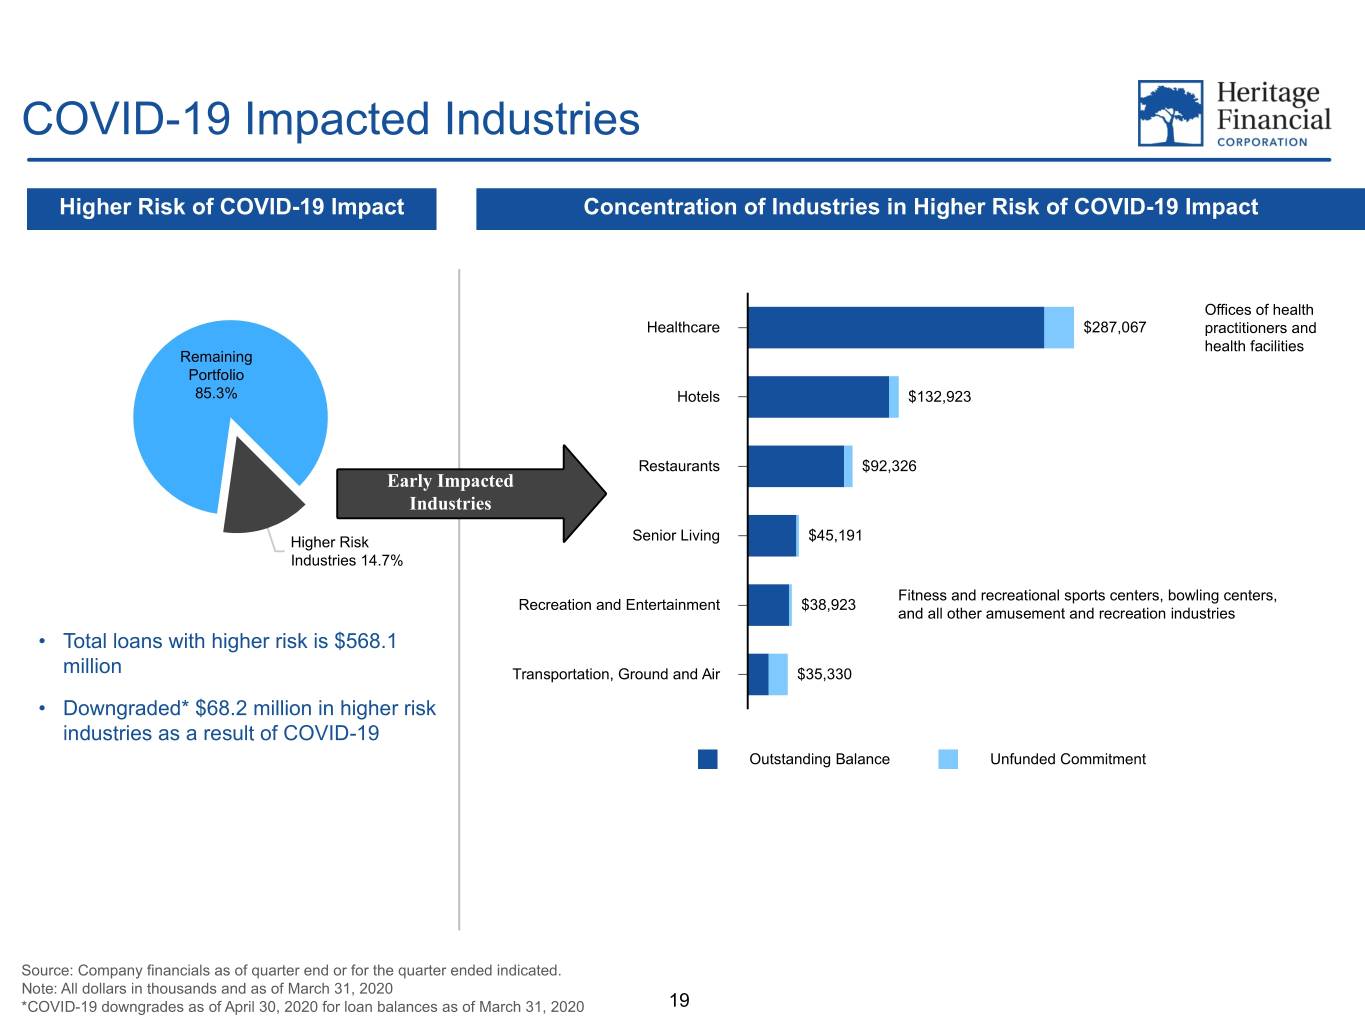
R: 20 COVID-19 Impacted Industries G: 80 B: 155 Higher Risk of COVID-19 Impact Concentration of Industries in Higher Risk of COVID-19 Impact Offices of health R: 105 Healthcare $287,067 practitioners and health facilities Remaining G: 149 Portfolio B: 253 85.3% Hotels $132,923 Restaurants $92,326 Early Impacted Industries Higher Risk Senior Living $45,191 Industries 14.7% Fitness and recreational sports centers, bowling centers, Recreation and Entertainment $38,923 and all other amusement and recreation industries • Total loans with higher risk is $568.1 million Transportation, Ground and Air $35,330 • Downgraded* $68.2 million in higher risk industries as a result of COVID-19 Outstanding Balance Unfunded Commitment Source: Company financials as of quarter end or for the quarter ended indicated. Note: All dollars in thousands and as of March 31, 2020 *COVID-19 downgrades as of April 30, 2020 for loan balances as of March 31, 2020 19
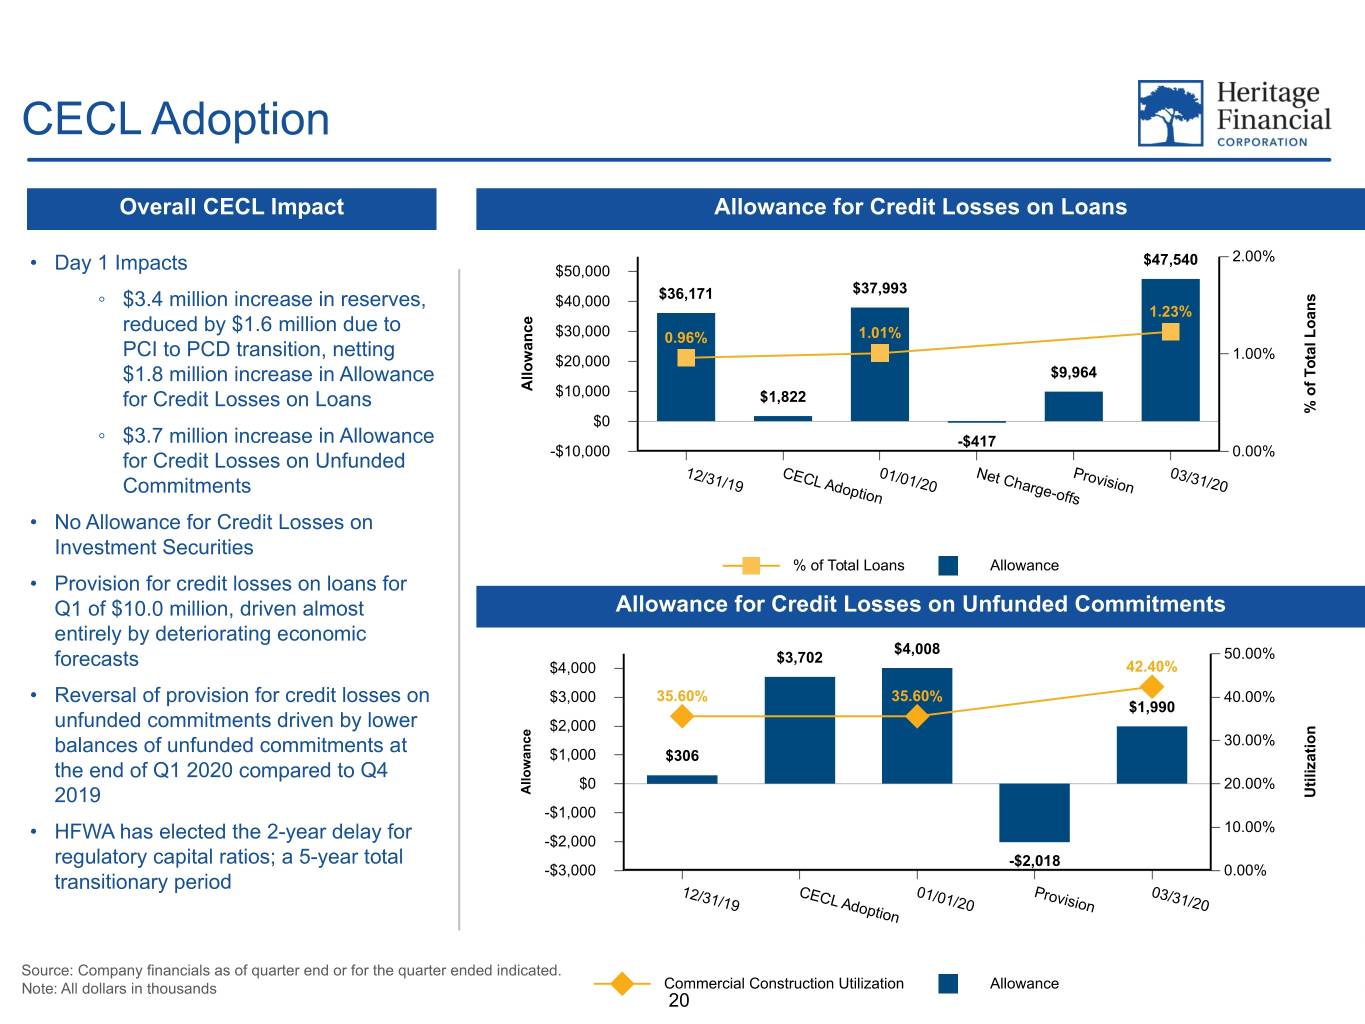
R: 20 CECL Adoption G: 80 B: 155 Overall CECL Impact Allowance for Credit Losses on Loans $47,540 2.00% • Day 1 Impacts $50,000 $37,993 ◦ $3.4 million increase in reserves, $40,000 $36,171 s n 1.23% a e o R: 105 reduced by $1.6 million due to c $30,000 1.01% L n 0.96% l a a PCI to PCD transition, netting 1.00% t w $20,000 o o G: 149 l T $1.8 million increase in Allowance l $9,964 f A for Credit Losses on Loans $10,000 $1,822 o B: 253 % $0 ◦ $3.7 million increase in Allowance -$417 for Credit Losses on Unfunded -$10,000 0.00% 12 C 01 N Pr 03 /31/ ECL /01/ et Ch ovis /31/ Commitments 19 Adop 20 arge ion 20 tion -offs • No Allowance for Credit Losses on Investment Securities % of Total Loans Allowance • Provision for credit losses on loans for Q1 of $10.0 million, driven almost Allowance for Credit Losses on Unfunded Commitments entirely by deteriorating economic $4,008 $3,702 50.00% forecasts $4,000 42.40% • Reversal of provision for credit losses on $3,000 35.60% 35.60% 40.00% $1,990 unfunded commitments driven by lower $2,000 n e c o 30.00% i n balances of unfunded commitments at t a $1,000 $306 a z w i o l the end of Q1 2020 compared to Q4 l i l $0 20.00% t A 2019 U -$1,000 10.00% • HFWA has elected the 2-year delay for -$2,000 regulatory capital ratios; a 5-year total -$2,018 -$3,000 0.00% transitionary period 1 C 0 P 0 2/31 ECL 1/01 rovi 3/31 /19 Ado /20 sion /20 ption Source: Company financials as of quarter end or for the quarter ended indicated. Note: All dollars in thousands Commercial Construction Utilization Allowance 20
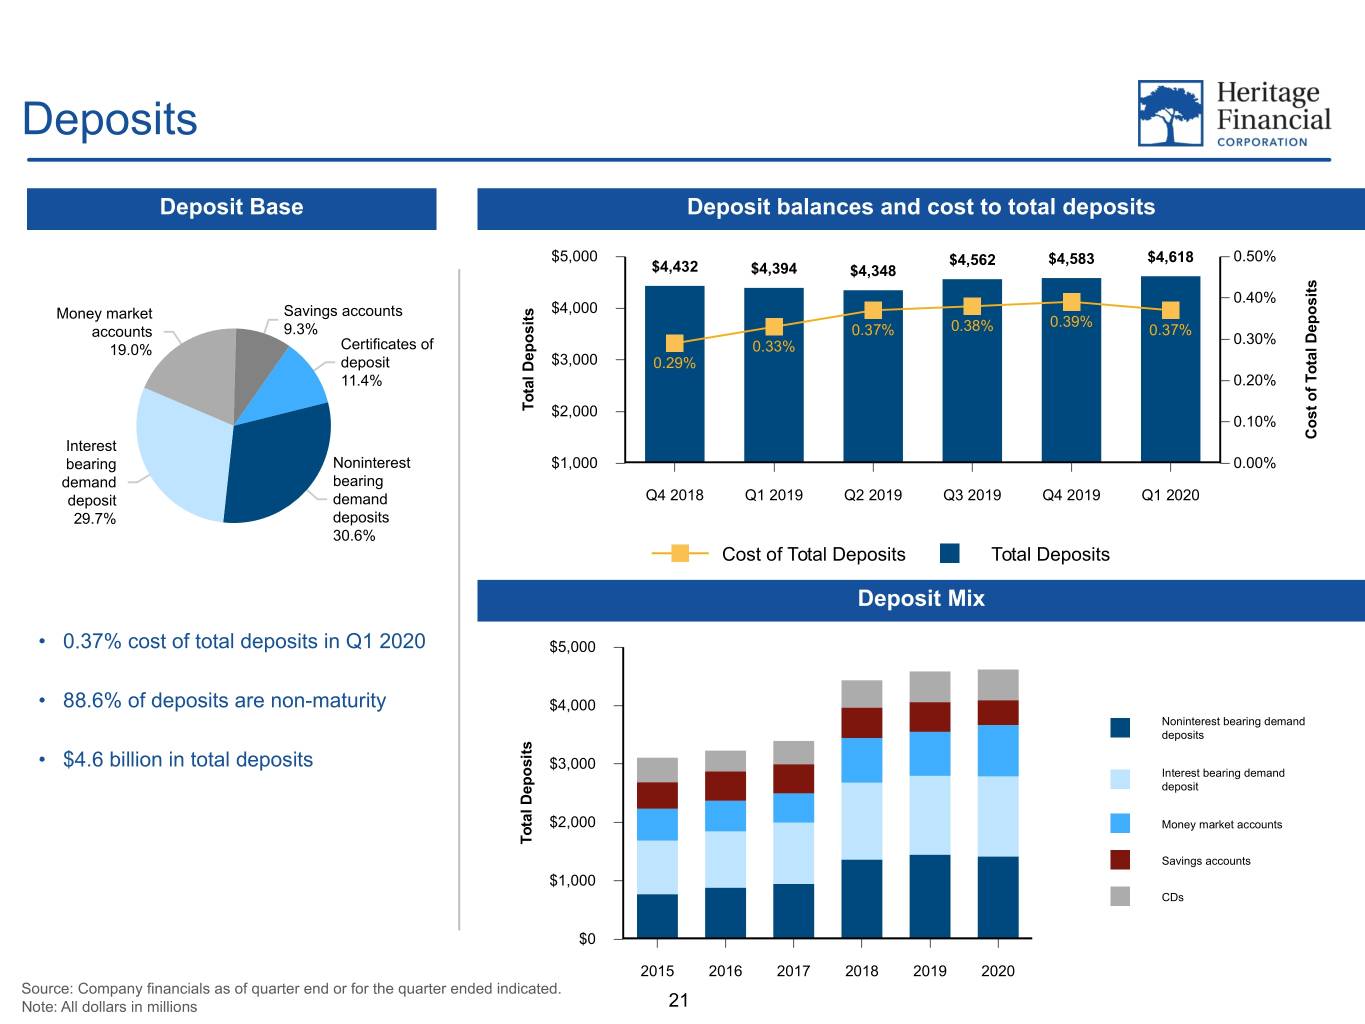
R: 20 Deposits G: 80 B: 155 Deposit Base Deposit balances and cost to total deposits $5,000 $4,562 $4,583 $4,618 0.50% $4,432 $4,394 $4,348 s t i 0.40% s o Savings accounts s $4,000 Money market t p i 0.39% e R: 105 accounts 9.3% s 0.37% 0.38% 0.37% o 0.30% D l 19.0% Certificates of p 0.33% a e deposit $3,000 0.29% t D G: 149 o l 0.20% T 11.4% a f t o o t B: 253 T $2,000 s 0.10% o Interest C bearing Noninterest $1,000 0.00% demand bearing deposit demand Q4 2018 Q1 2019 Q2 2019 Q3 2019 Q4 2019 Q1 2020 29.7% deposits 30.6% Cost of Total Deposits Total Deposits Deposit Mix • 0.37% cost of total deposits in Q1 2020 $5,000 • 88.6% of deposits are non-maturity $4,000 Noninterest bearing demand deposits s t i • $4.6 billion in total deposits s $3,000 o Interest bearing demand p deposit e D l a t $2,000 Money market accounts o T Savings accounts $1,000 CDs $0 2015 2016 2017 2018 2019 2020 Source: Company financials as of quarter end or for the quarter ended indicated. Note: All dollars in millions 21
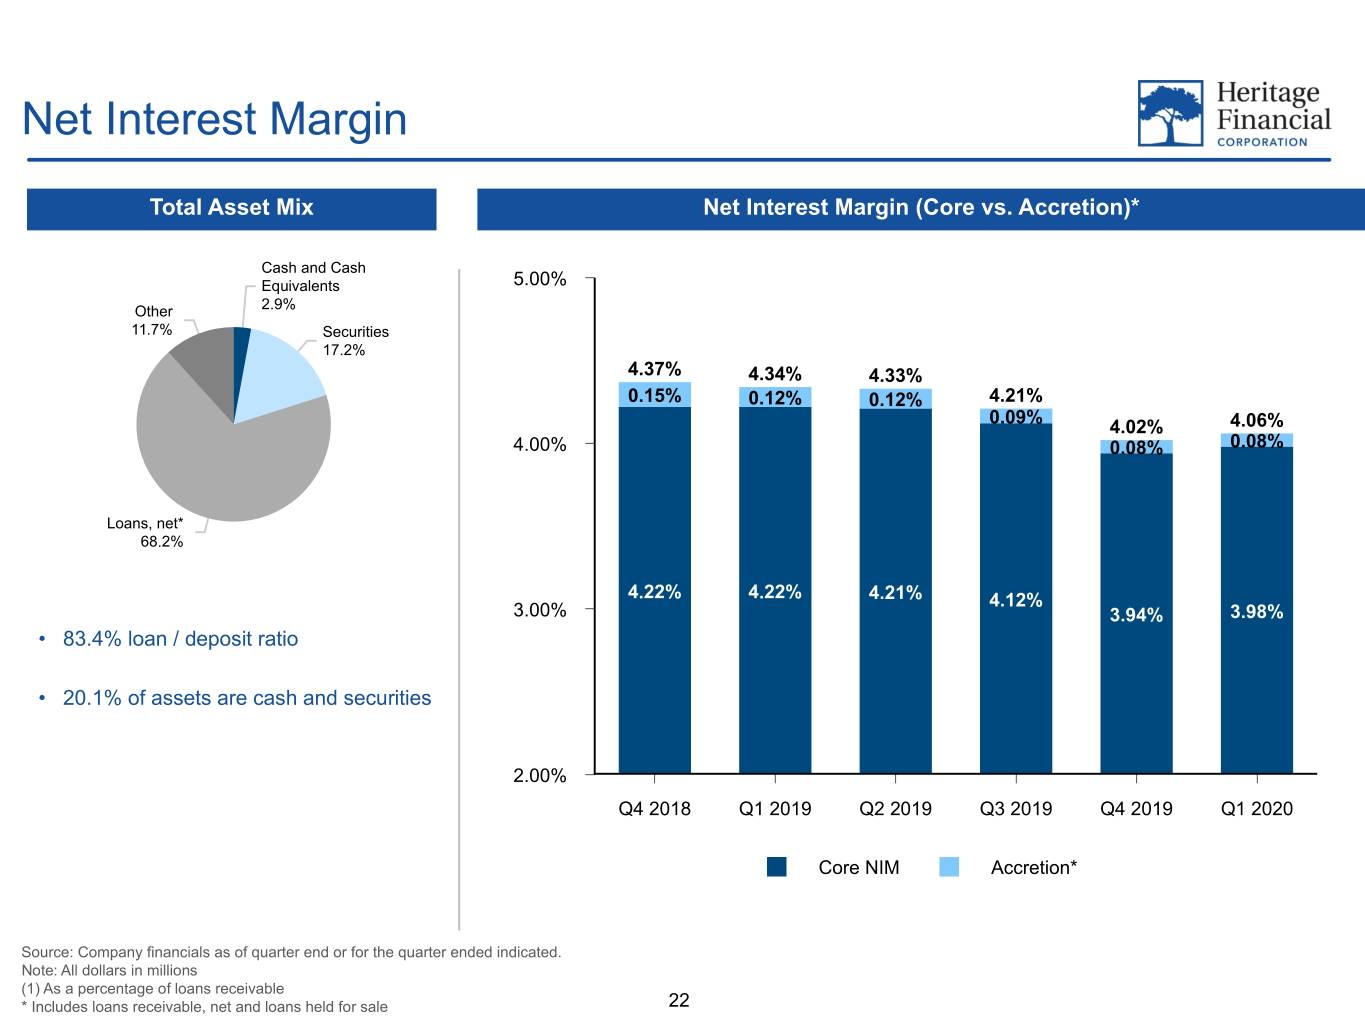
R: 20 Net Interest Margin G: 80 B: 155 Total Asset Mix Net Interest Margin (Core vs. Accretion)* Cash and Cash Equivalents 5.00% Other 2.9% R: 105 11.7% Securities 17.2% G: 149 4.37% 4.34% 4.33% 0.15% 0.12% 0.12% 4.21% B: 253 0.09% 4.02% 4.06% 4.00% 0.08% 0.08% Loans, net* 68.2% 4.22% 4.22% 4.21% 4.12% 3.00% 3.94% 3.98% • 83.4% loan / deposit ratio • 20.1% of assets are cash and securities 2.00% Q4 2018 Q1 2019 Q2 2019 Q3 2019 Q4 2019 Q1 2020 Core NIM Accretion* Source: Company financials as of quarter end or for the quarter ended indicated. Note: All dollars in millions (1) As a percentage of loans receivable * Includes loans receivable, net and loans held for sale 22
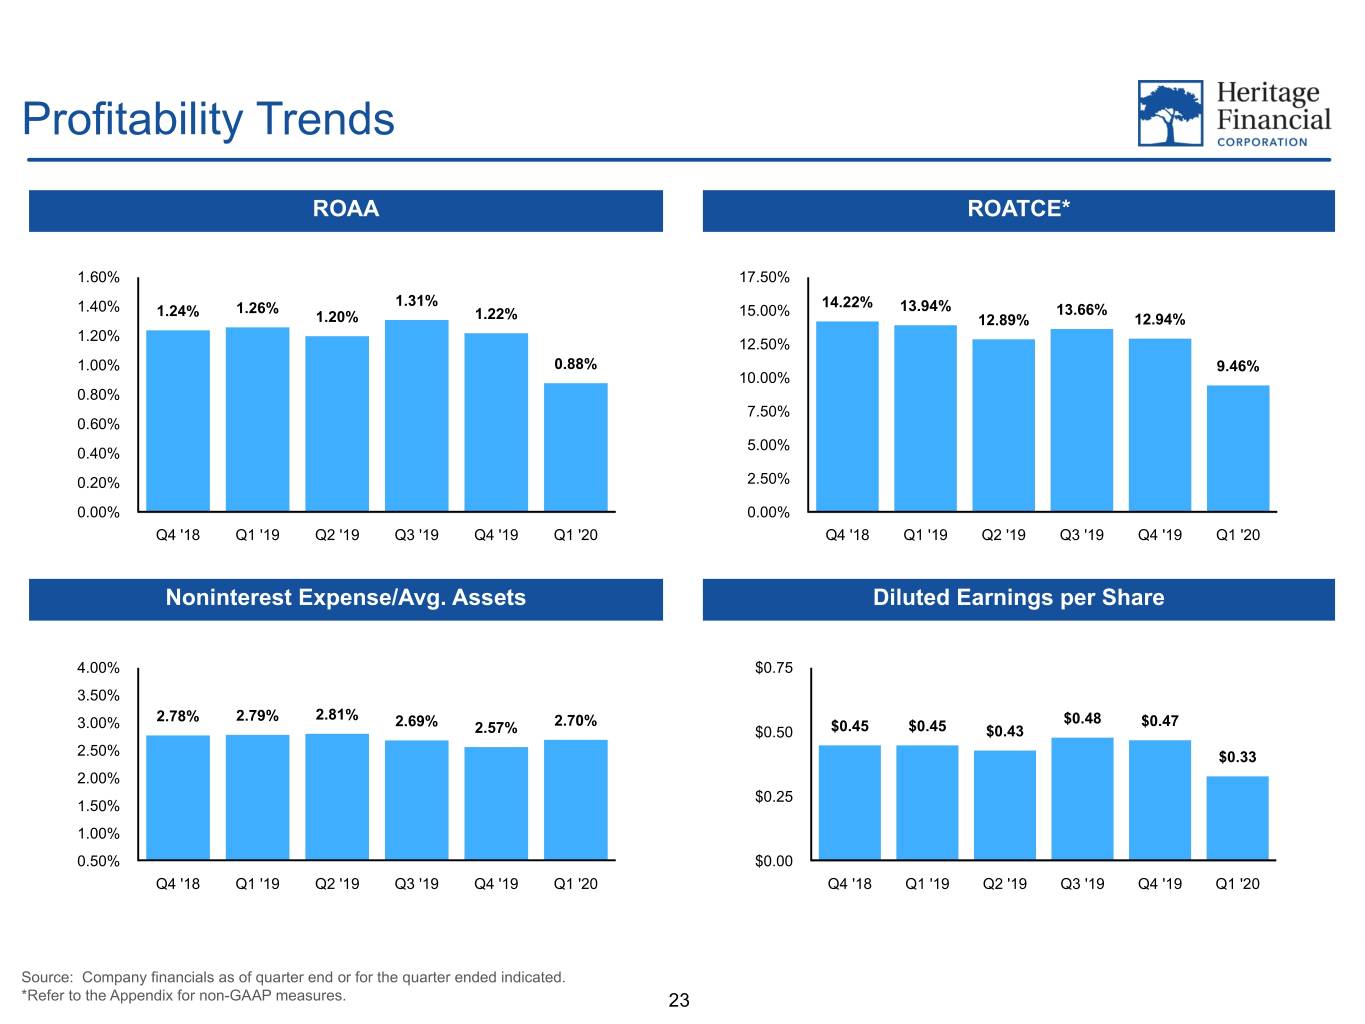
R: 20 Profitability Trends G: 80 B: 155 ROAA ROATCE* 1.60% 17.50% 1.31% 14.22% 1.40% 1.24% 1.26% 15.00% 13.94% 13.66% R: 105 1.20% 1.22% 12.89% 12.94% 1.20% 12.50% G: 149 1.00% 0.88% 9.46% 10.00% 0.80% B: 253 7.50% 0.60% 5.00% 0.40% 0.20% 2.50% 0.00% 0.00% Q4 '18 Q1 '19 Q2 '19 Q3 '19 Q4 '19 Q1 '20 Q4 '18 Q1 '19 Q2 '19 Q3 '19 Q4 '19 Q1 '20 Noninterest Expense/Avg. Assets Diluted Earnings per Share 4.00% $0.75 3.50% 2.81% 3.00% 2.78% 2.79% 2.69% 2.70% $0.48 $0.47 2.57% $0.50 $0.45 $0.45 $0.43 2.50% $0.33 2.00% $0.25 1.50% 1.00% 0.50% $0.00 Q4 '18 Q1 '19 Q2 '19 Q3 '19 Q4 '19 Q1 '20 Q4 '18 Q1 '19 Q2 '19 Q3 '19 Q4 '19 Q1 '20 Source: Company financials as of quarter end or for the quarter ended indicated. *Refer to the Appendix for non-GAAP measures. 23
R: 20 G: 80 B: 155 R: 105 G: 149 B: 253 Shareholder Return 24
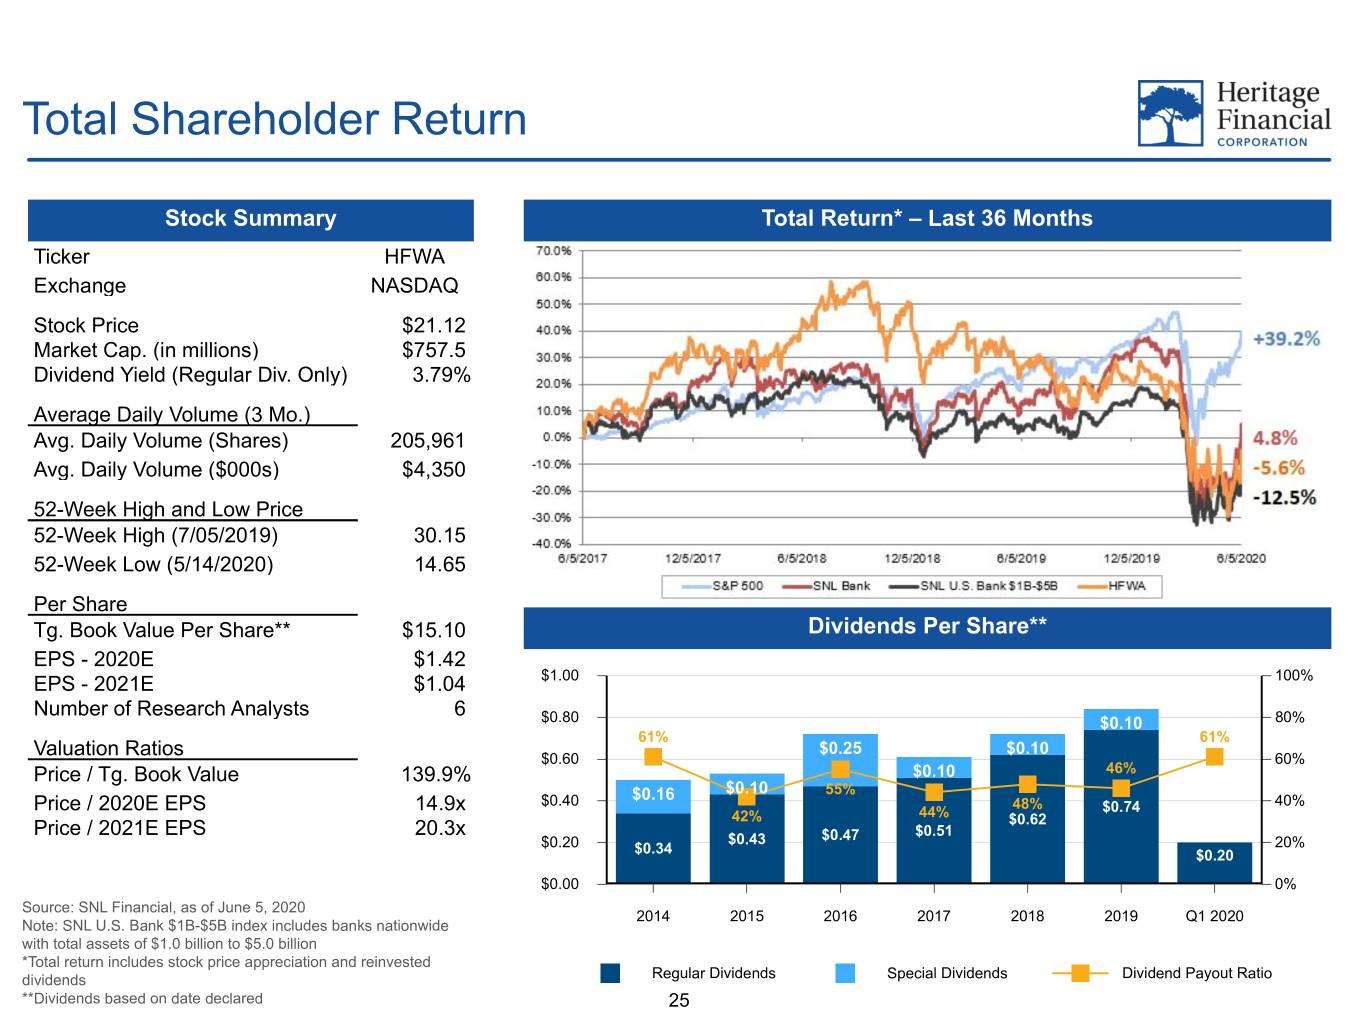
R: 20 Total Shareholder Return G: 80 B: 155 Stock Summary Total Return* – Last 36 Months Ticker HFWA Exchange NASDAQ R: 105 Stock Price $21.12 Market Cap. (in millions) $757.5 G: 149 Dividend Yield (Regular Div. Only) 3.79% B: 253 Average Daily Volume (3 Mo.) Avg. Daily Volume (Shares) 205,961 Please keep the row spacing in the left-most table as-is. The Avg. Daily Volume ($000s) $4,350 goal is to have the row underneath a border (1st row, row 52-Week High and Low Price below avg daily volume, row below 52 week, row below 52-Week High (7/05/2019) 30.15 per share, row below valuation ratios) to be larger than the rest so that the border doesn't "bleed" into the data 52-Week Low (5/14/2020) 14.65 Per Share these rows should be 16 pixels Dividends Per Share** other rows with data in them should be 13 pixels Tg. Book Value Per Share** $15.10 blank rows should be 8 pixels EPS - 2020E $1.42 EPS - 2021E $1.04 $1.00 100% Number of Research Analysts 6 $0.80 $0.10 80% 61% 61% $0.25 $0.10 Valuation Ratios $0.60 60% Price / Tg. Book Value 139.9% $0.10 46% $0.16 $0.10 55% Price / 2020E EPS 14.9x $0.40 48% $0.74 40% 42% 44% $0.62 Price / 2021E EPS 20.3x $0.51 $0.20 $0.43 $0.47 20% $0.34 $0.20 $0.00 0% Source: SNL Financial, as of June 5, 2020 2014 2015 2016 2017 2018 2019 Q1 2020 Note: SNL U.S. Bank $1B-$5B index includes banks nationwide with total assets of $1.0 billion to $5.0 billion *Total return includes stock price appreciation and reinvested dividends Regular Dividends Special Dividends Dividend Payout Ratio **Dividends based on date declared 25
R: 20 G: 80 B: 155 R: 105 G: 149 B: 253 Appendix - Reconciliations of non-GAAP Financial Measures 26
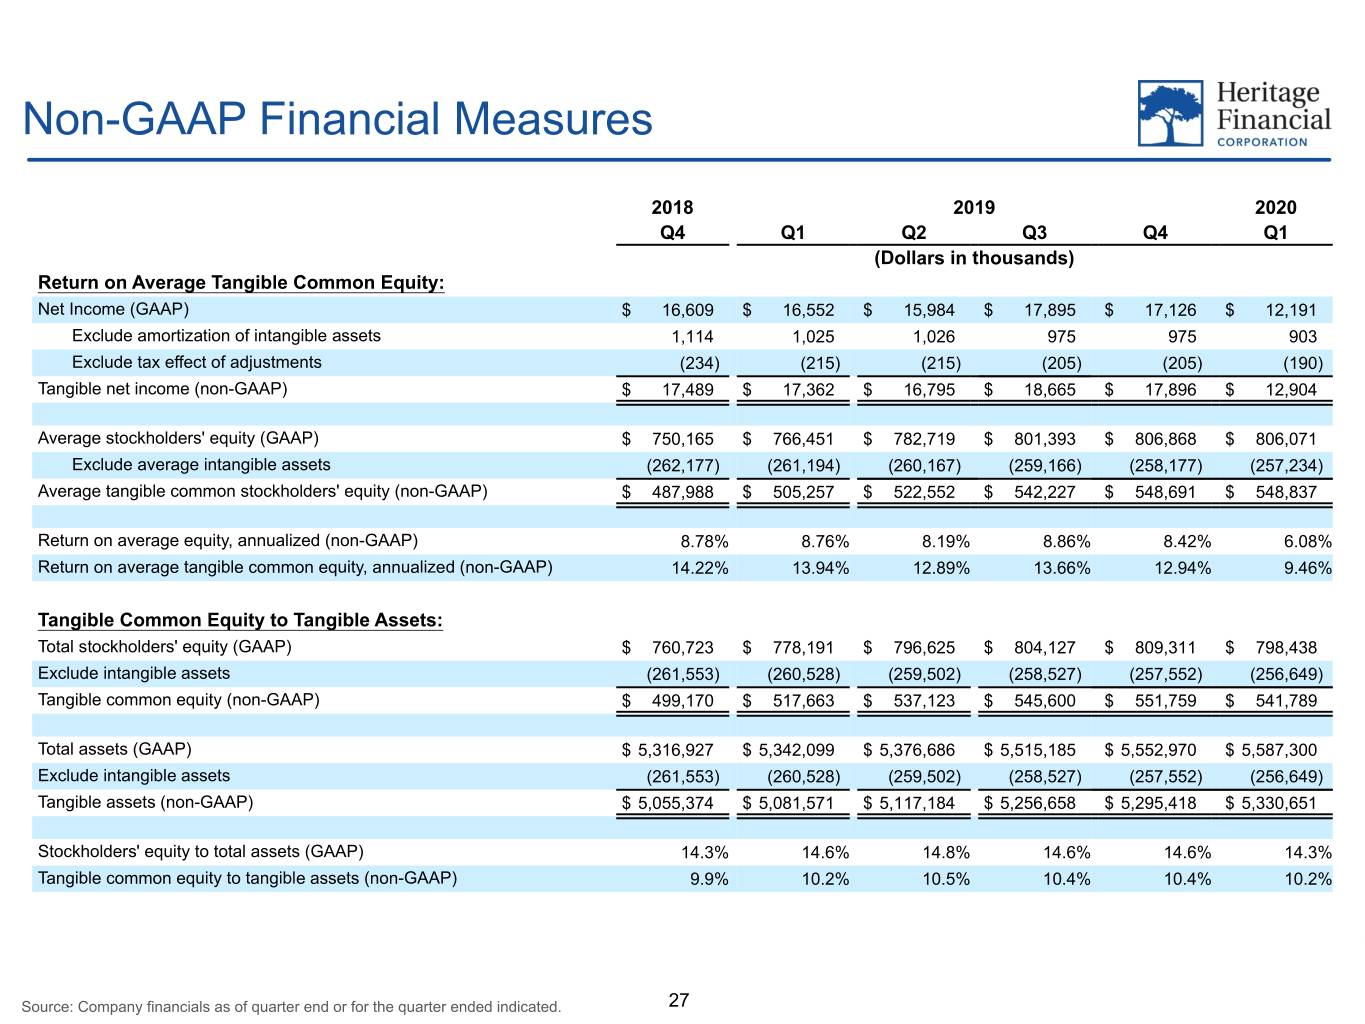
R: 20 Non-GAAP Financial Measures G: 80 2018 2019 2020 B: 155 Q4 Q1 Q2 Q3 Q4 Q1 (Dollars in thousands) Return on Average Tangible Common Equity: R: 105 Net Income (GAAP) $ 16,609 $ 16,552 $ 15,984 $ 17,895 $ 17,126 $ 12,191 Exclude amortization of intangible assets 1,114 1,025 1,026 975 975 903 G: 149 Exclude tax effect of adjustments (234) (215) (215) (205) (205) (190) B: 253 Tangible net income (non-GAAP) $ 17,489 $ 17,362 $ 16,795 $ 18,665 $ 17,896 $ 12,904 Average stockholders' equity (GAAP) $ 750,165 $ 766,451 $ 782,719 $ 801,393 $ 806,868 $ 806,071 Exclude average intangible assets (262,177) (261,194) (260,167) (259,166) (258,177) (257,234) Average tangible common stockholders' equity (non-GAAP) $ 487,988 $ 505,257 $ 522,552 $ 542,227 $ 548,691 $ 548,837 Return on average equity, annualized (non-GAAP) 8.78% 8.76% 8.19% 8.86% 8.42% 6.08% Return on average tangible common equity, annualized (non-GAAP) 14.22% 13.94% 12.89% 13.66% 12.94% 9.46% Tangible Common Equity to Tangible Assets: Total stockholders' equity (GAAP) $ 760,723 $ 778,191 $ 796,625 $ 804,127 $ 809,311 $ 798,438 Exclude intangible assets (261,553) (260,528) (259,502) (258,527) (257,552) (256,649) Tangible common equity (non-GAAP) $ 499,170 $ 517,663 $ 537,123 $ 545,600 $ 551,759 $ 541,789 Total assets (GAAP) $ 5,316,927 $ 5,342,099 $ 5,376,686 $ 5,515,185 $ 5,552,970 $ 5,587,300 Exclude intangible assets (261,553) (260,528) (259,502) (258,527) (257,552) (256,649) Tangible assets (non-GAAP) $ 5,055,374 $ 5,081,571 $ 5,117,184 $ 5,256,658 $ 5,295,418 $ 5,330,651 Stockholders' equity to total assets (GAAP) 14.3% 14.6% 14.8% 14.6% 14.6% 14.3% Tangible common equity to tangible assets (non-GAAP) 9.9% 10.2% 10.5% 10.4% 10.4% 10.2% Source: Company financials as of quarter end or for the quarter ended indicated. 27
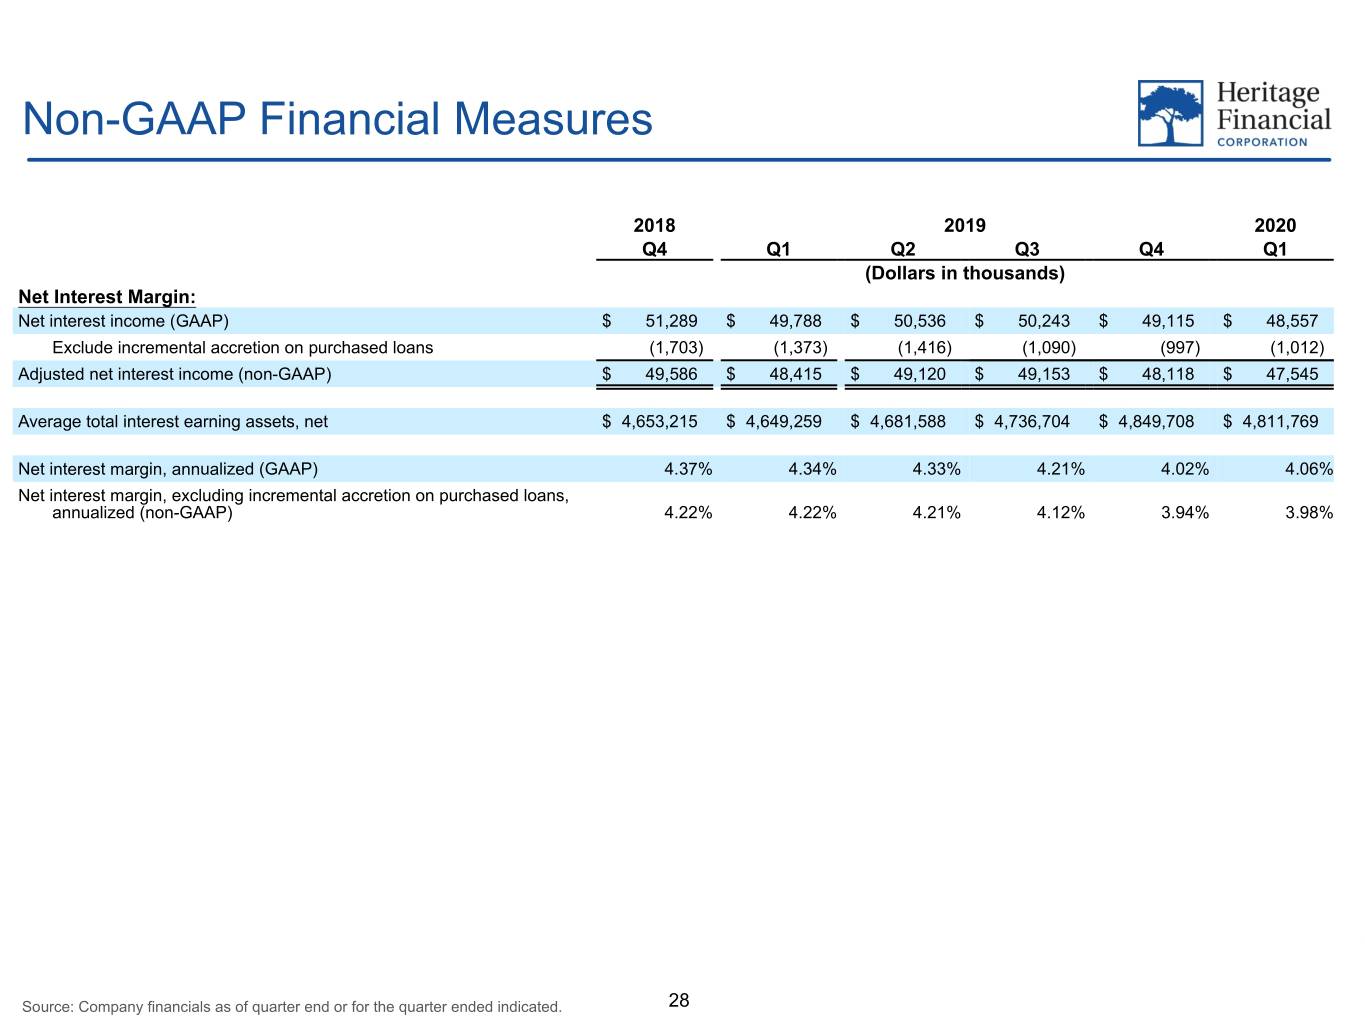
R: 20 Non-GAAP Financial Measures G: 80 B: 155 2018 2019 2020 Q4 Q1 Q2 Q3 Q4 Q1 (Dollars in thousands) Net Interest Margin: R: 105 Net interest income (GAAP) $ 51,289 $ 49,788 $ 50,536 $ 50,243 $ 49,115 $ 48,557 Exclude incremental accretion on purchased loans (1,703) (1,373) (1,416) (1,090) (997) (1,012) G: 149 Adjusted net interest income (non-GAAP) $ 49,586 $ 48,415 $ 49,120 $ 49,153 $ 48,118 $ 47,545 B: 253 Average total interest earning assets, net $ 4,653,215 $ 4,649,259 $ 4,681,588 $ 4,736,704 $ 4,849,708 $ 4,811,769 Net interest margin, annualized (GAAP) 4.37% 4.34% 4.33% 4.21% 4.02% 4.06% Net interest margin, excluding incremental accretion on purchased loans, annualized (non-GAAP) 4.22% 4.22% 4.21% 4.12% 3.94% 3.98% Source: Company financials as of quarter end or for the quarter ended indicated. 28
Questions and Answers 29
