Attached files
| file | filename |
|---|---|
| 8-K - FORM 8-K - GREAT SOUTHERN BANCORP, INC. | tm2021994d1_8k.htm |
Exhibit 99.1

June 2020
Safe Harbor/Legal Disclaimer This presentation contains statements that are considered forward - looking statements within the meaning of and are intended to b e covered by the safe harbor provisions of the Private Securities Litigation Reform Act of 1995. Forward - looking statements typically are identified with use of terms such as “may,” “might,” “will,” “would,” “should,” “expect,” “plan,” “anticipate,” “believe,” “estimate,” “predict,” “potential,” “could,” “continue” and the negative of these terms and sim ilar words, although some forward - looking statements may be expressed differently. Forward - looking statements also include, but are not limited to, statements regarding plans, objec tives, expectations or consequences of announced transactions, known trends and statements about future performance, operations, products and services of Great Sout her n Bancorp, Inc. (“we,” “us,” “our” or the “Issuer”) and its subsidiaries. Our ability to predict results or the actual effects of future plans or strategies is inheren tly uncertain. You should be aware that our actual results could differ materially from those contained in the forward - looking statements. The novel coronavirus disease, or COVID - 19, pand emic is adversely affecting us, our customers, counterparties, employees, and third - party service providers, and the ultimate extent of the impacts on our business, financial position, results of operations, liquidity, and prospects is uncertain. Continued deterioration in general business and economic conditions, including further increases in u nem ployment rates, or turbulence in domestic or global financial markets could adversely affect our revenues and the values of our assets and liabilities, reduce the availab ili ty of funding, lead to a tightening of credit, and further increase stock price volatility. In addition, changes to statutes, regulations, or regulatory policies or practices as a resu lt of, or in response to COVID - 19, could affect us in substantial and unpredictable ways. Other factors that could cause or contribute to such differences include, but are not limited to: ( i ) expected revenues, cost savings, earnings accretion, synergies and other benefits from our merger and acquisition activities might not be realized within the anticipated time frames or at all, and c ost s or difficulties relating to integration matters, including but not limited to customer and employee retention, might be greater than expected; (ii) changes in economic condit ion s, either nationally or in our market areas; (iii) fluctuations in interest rates; (iv) the risks of lending and investing activities, including changes in the level and direct ion of loan delinquencies and write - offs and changes in estimates of the adequacy of the allowance for loan losses; (v) the possibility of other - than - temporary impairments of securitie s held in our securities portfolio; (vi) our ability to access cost - effective funding; (vii) fluctuations in real estate values and both residential and commercial real estate market c onditions; (viii) the ability to adapt successfully to technological changes to meet customers' needs and developments in the marketplace; (ix) the possibility that security measur es implemented might not be sufficient to mitigate the risk of a cyber - attack or cyber theft, and that such security measures might not protect against systems failures or interru ptions; (x) legislative or regulatory changes that adversely affect our business, including, without limitation, the Dodd - Frank Wall Street Reform and Consumer Protection Act of 2 010 and its implementing regulations, the overdraft protection regulations and customers' responses thereto and the Tax Cut and Jobs Act of 2017; (xi) changes in accou nti ng policies and practices or accounting standards, including Accounting Standards Update 2016 - 13, Credit Losses (Topic 326), “Measurement of Credit Losses on Financial Instruments,” commonly referenced as the Current Expected Credit Loss model, which, upon adoption, is expected to result in an increase in our allowance for credit lo sse s; (xii) results of examinations of us by our regulators, including the possibility that the regulators may, among other things, require us to limit our business activitie s, change our business mix, increase our allowance for loan losses, write - down assets or increase our capital levels, or affect our ability to borrow funds or maintain or increase dep osits, which could adversely affect our liquidity and earnings; (xiii) costs and effects of litigation, including settlements and judgments; (xiv) competition; (xv) uncertainty re gar ding the future of LIBOR; (xvi) natural disasters, war, terrorist activities or civil unrest and their effects on economic and business environments in which we operate; and (vii) o the r risks discussed under the heading “Risk Factors” in the preliminary prospectus supplement, as well as the risk factors included in the documents incorporated therein by referenc e, including under Item 1A of our Annual Report on Form 10 - K for the year ended December 31, 2019 and Part II, Item 1A of our Quarterly Report on Form 10 - Q for the quarter ended M arch 31, 2020, all of which could cause actual results to differ from those set forth in the forward - looking statements. There can be no assurance that other factors not currently anticipated by us will not materially and adversely affect our bus ine ss, financial condition and results of operations. Readers are cautioned not to place undue reliance on our forward - looking statements, which reflect management’s analysis and exp ectations only as of the date of such statements. Forward - looking statements speak only as of the date they are made, and we do not intend, and undertake no obligatio n, to publicly revise or update forward - looking statements, whether as a result of new information, future events or otherwise, except as required by federal securities law. Any investor in our securities should consider all risks and uncertainties disclosed in our filings with the Securities and E xch ange Commission (the “SEC”) described under the heading “Where You Can Find More Information” in the preliminary prospectus supplement, all of which are accessible on the SE C’s website at www.sec.gov. The Issuer has filed a registration statement (including a prospectus) (File No. 333 - 237548) and a preliminary prospectus supple ment with the SEC for the offering to which this presentation relates. Before you invest, you should read the prospectus in that registration statement, the preliminary prosp ect us supplement and other documents the Issuer has filed with the SEC for more complete information about the Issuer and this offering. You may get these documents for free by vis iting EDGAR on the SEC’s website at www.sec.gov. Alternatively, the Issuer, any underwriter or any dealer participating in the offering will arrange to send you the prospectus and the related preliminary prospectus supplement if you request it by calling Piper Sandler & Co. toll - free at (866) 805 - 4128 or emailing FSG - DCM@psc.com or by contac ting Keefe, Bruyette & Woods, A Stifel Company at 1 - 800 - 966 - 1559. This presentation may not be used in connection with any offer to sell, or solicitation of an offer to buy, any securities in a state or jurisdiction in which such offer or solicitation is not permitted by law or in which the person making the offer or solicitation is not qualified to do so or to any person to wh om it is unlawful to make such offer or solicitation. 2

Terms of the Proposed Offering 3 Joint Book - Runners: Security: Amount: Rating: Structure: Issuance Type: Term: Call Date: Use of Proceeds: Issuer: Co - Manager: Great Southern Bancorp, Inc. (NASDAQ: GSBC) Subordinated Notes $ 50 million BBB - by Kroll Bond Rating Agency, Inc. Fixed - to - Floating Rate S - 3 Shelf / SEC Registered 10 Years 5 Years General corporate purposes, including potential acquisitions and stock repurchases Piper Sandler & Co. Keefe, Bruyette & Woods, A Stifel Company Janney Montgomery Scott LLC

Proven Leadership Team 4 Strategy / Financial / Joseph Turner President & CEO • Joined Great Southern Bank in 1991 and became a director of Great Southern in 1997 • B ecame President and CEO of Great Southern in 1999 • Has 29 years of experience at Great Southern Rex Copeland CFO & Treasurer • Joined Great Southern Bank in 2000 • Prior to joining, served other financial services companies in areas of corporate accounting, internal audit, and independent public accounting • Has 34 years of experience in banking and public accounting with 20 years as CFO and Treasurer of Great Southern Lending / Credit / John Bugh Chief Lending Officer • Joined Great Southern Bank in 2011 • Responsible for all production in commercial, retail and community development lending • Has 31 years of experience in the banking industry, including roles at the FDIC, LaSalle Bank and Private Bank Kevin Baker Chief Credit Officer • Joined Great Southern Bank in 2005 • Responsible for credit underwriting, loan operations and special assets • Has 31 years of experience in the banking industry, including roles at the FDIC, LaSalle Bank and First Bank of Illinois Debbie Flowers Director of Credit Risk • Joined Great Southern Bank in 1997 • Responsible for credit review and loan portfolio monitoring • Has 40 years of experience in the banking industry, including roles at the FDIC and Boatmen’s Bank
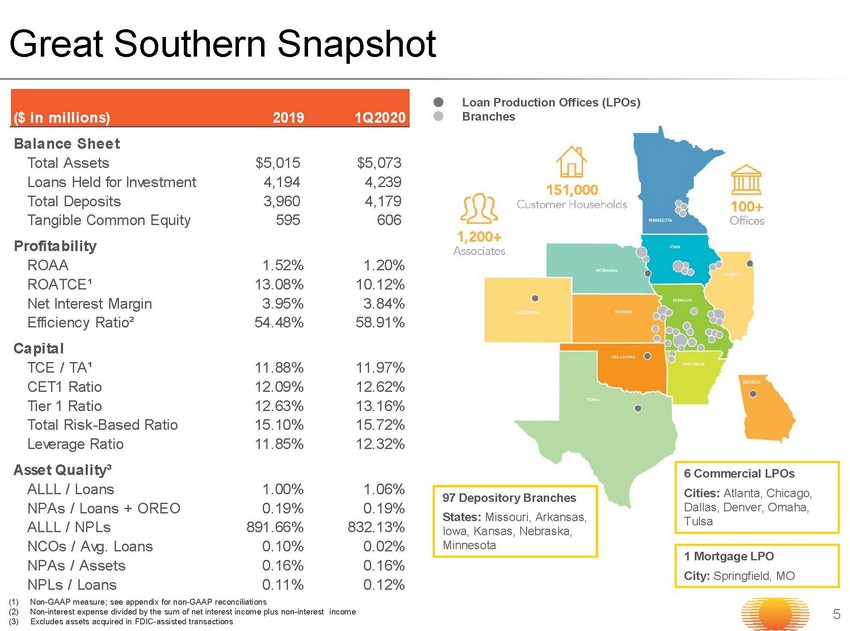
($ in millions) 2019 1Q2020 Balance Sheet Total Assets $5,015 $5,073 Loans Held for Investment 4,194 4,239 Total Deposits 3,960 4,179 Tangible Common Equity 595 606 Profitability ROAA 1.52% 1.20% ROATCE¹ 13.08% 10.12% Net Interest Margin 3.95% 3.84% Efficiency Ratio² 54.48% 58.91% Capital TCE / TA¹ 11.88% 11.97% CET1 Ratio 12.09% 12.62% Tier 1 Ratio 12.63% 13.16% Total Risk-Based Ratio 15.10% 15.72% Leverage Ratio 11.85% 12.32% Asset Quality³ ALLL / Loans 1.00% 1.06% NPAs / Loans + OREO 0.19% 0.19% ALLL / NPLs 891.66% 832.13% NCOs / Avg. Loans 0.10% 0.02% NPAs / Assets 0.16% 0.16% NPLs / Loans 0.11% 0.12% Great Southern Snapshot 5 (1) Non - GAAP measure; see appendix for non - GAAP reconciliations (2) Non - interest expense divided by the sum of net interest income plus non - interest income (3) Excludes assets acquired in FDIC - assisted transactions Loan Production Offices (LPOs) Branches 97 Depository Branches States: Missouri, Arkansas, Iowa, Kansas, Nebraska, Minnesota 6 Commercial LPOs Cities: Atlanta, Chicago, Dallas, Denver, Omaha, Tulsa 1 Mortgage LPO City: Springfield, MO

Investment Thesis • Focused on long - term growth and profitability with a 97 year history • Exceptional credit quality • Well capitalized, diversified loan portfolio and low - cost deposit base • Strong core operating earnings power • Diverse retail banking franchise • Experienced management team working through economic cycles • Proven M&A track record - - value buyer • High percentage of insider ownership of 23% aligns interests with stakeholders 6

$392 $417 $461 $523 $595 $606 $0 $700 $4,104 $4,551 $4,415 $4,676 $5,015 $5,073 $0 $6,000 7 Track Record of Consistent Growth Note: Dollar values in millions (1) See appendix for non - GAAP reconciliation of tangible common equity (page 33) Total Assets Gross Loans HFI Tangible Common Equity¹ $3,379 $3,797 $3,763 $4,027 $4,194 $4,239 $0 $5,000

8 Highly Disciplined Acquisition Strategy Note: Dollar values in millions Source: S&P Global Market Intelligence (1) As of March 31, 2020 Acquisition Loans Deposits Number of Target Date County State Acquired Assumed Branches Valley Bank 06/20/2014 Scott IA $193.2 $365.6 13 InterBank 04/27/2012 Hennepin MN 393.3 454.3 4 Sun Security Bank 10/07/2011 Various MO 240.5 280.1 27 Vantus Bank 09/04/2009 Woodbury IA 331.5 349.9 15 TeamBank 03/20/2009 Miami KS 435.8 512.0 17 FDIC-assisted Total -- -- -- $1,594.3 $1,961.9 76 Fifth Third Bancorp 01/29/2016 St. Louis MO $158.9 $228.3 12 Boulevard Bank 03/21/2014 Newton MO 10.9 92.6 2 Branches Total -- -- -- 169.8 320.9 14 Grand Total -- -- -- $1,764.1 $2,282.8 90 FDIC-assisted Branches 7 Acquisitions in 11 years and only $7.8 million of Goodwill and Other Intangibles¹

9 Strong Core Earnings Power Note: Dollar values in millions, except per share amounts (1) Non - interest expense divided by the sum of net interest income plus non - interest income (2) See appendix for non - GAAP reconciliation of return on tangible common equity (page 33 ) Pre - Provision Net Revenue ROAA Net Income / Diluted EPS 1.14% 1.04% 1.16% 1.49% 1.52% 1.20% 0.00% 1.80% Efficiency Ratio¹ ROATCE² 12.2% 11.3% 11.6% 13.7% 13.1% 10.1% 0.0% 16.0% $67.6 $71.1 $79.4 $89.1 $96.2 $23.6 $21.5 $0.0 $100.0 62.9% 62.9% 59.0% 56.4% 54.5% 58.9% 50.0% 80.0% $46.5 $45.3 $51.6 $67.1 $73.6 $17.6 $14.9 $3.28 $3.21 $3.64 $4.71 $5.14 $1.23 $1.04 $0.00 $6.00 $0.0 $80.0

(1) Excludes impact of FDIC - acquired loan accretion; see appendix for non - GAAP reconciliation of core net interest margin (page 32) 10 Stable Net Interest Margin 5.48% 4.89% 4.63% 5.07% 5.37% 5.15% 4.53% 4.05% 3.74% 3.99% 3.95% 3.84% 0.42% 0.50% 0.57% 0.79% 1.17% 1.07% 4.60% 4.44% 4.50% 4.94% 5.19% 4.97% 3.76% 3.64% 3.62% 3.87% 3.79% 3.68% 0.00% 6.00% 2015 2016 2017 2018 2019 1Q2020 Annual. Loan Yield (GAAP) NIM Cost of Deposits Core Loan Yield Core NIM¹
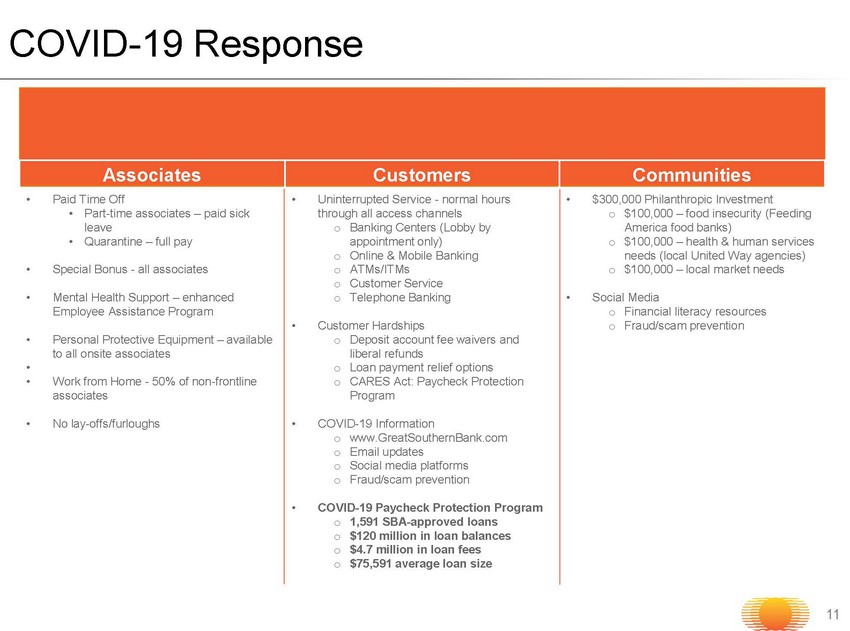
Associates Customers Communities • Paid Time Off • Part - time associates – paid sick leave • Quarantine – full pay • Special Bonus - all associates • Mental Health Support – enhanced Employee Assistance Program • Personal Protective Equipment – available to all onsite associates • • Work from Home - 50% of non - frontline associates • No lay - offs/furloughs • Uninterrupted Service - normal hours through all access channels o Banking Centers (Lobby by appointment only) o Online & Mobile Banking o ATMs/ITMs o Customer Service o Telephone Banking • Customer Hardships o Deposit account fee waivers and liberal refunds o Loan payment relief options o CARES Act: Paycheck Protection Program • COVID - 19 Information o www.GreatSouthernBank.com o Email updates o Social media platforms o Fraud/scam prevention • COVID - 19 Paycheck Protection Program o 1,591 SBA - approved loans o $120 million in loan balances o $4.7 million in loan fees o $75,591 average loan size • $300 ,000 Philanthropic Investment o $100,000 – food insecurity (Feeding America food banks) o $100,000 – health & human services needs (local United Way agencies) o $100,000 – local market needs • Social Media o Financial literacy resources o Fraud/scam prevention COVID - 19 Response 11

Highly Disciplined Credit Management Asset Quality Trends¹ 12 (1) Excludes FDIC - acquired assets 1.07% 0.86% 0.63% 0.25% 0.16% 0.16% 0.00% 3.00% 2015 2016 2017 2018 2019 1Q2020 0.20% 0.29% 0.26% 0.13% 0.10% 0.02% 0.00% 1.00% 2015 2016 2017 2018 2019 1Q2020 Annual. 1.20% 1.04% 1.01% 0.98% 1.00% 1.06% 0.80% 1.40% 2015 2016 2017 2018 2019 1Q2020 230.24% 265.60% 324.23% 609.67% 891.66% 832.13% 0.00% 1000.00% 2015 2016 2017 2018 2019 1Q2020 NPAs / Assets NCOs / Average Loans Reserves / Loans Reserves / NPLs

Operating in Stable Midwest Markets Unemployment Rate by State 13 Source: US Bureau of Labor Statistics Rank State April 2020 Preliminary Unemployment Rate Depository Branch Locations Commercial LPO Rank State April 2020 Preliminary Unemployment Rate Depository Branch Locations Commercial LPO 1 Connecticut 7.9 25 Florida 12.9 2 Minnesota 8.1 Yes 28 Oklahoma 13.7 Tulsa 3 Nebraska 8.3 Yes Omaha 29 Wisconsin 14.1 4 North Dakota 8.5 30 Oregon 14.2 5 Wyoming 9.2 31 Delaware 14.3 6 Missouri 9.7 Yes 32 Louisiana 14.5 6 Utah 9.7 32 New York 14.5 8 Maryland 9.9 34 Tennessee 14.7 9 Arkansas 10.2 Yes USA 14.7 9 Iowa 10.2 Yes 35 Massachusetts 15.1 9 South Dakota 10.2 35 Pennsylvania 15.1 12 Maine 10.6 37 West Virginia 15.2 12 Virginia 10.6 38 New Jersey 15.3 14 District of Columbia 11.1 39 Kentucky 15.4 15 Kansas 11.2 Yes 39 Mississippi 15.4 16 Colorado 11.3 Denver 39 Washington 15.4 16 Montana 11.3 42 California 15.5 16 New Mexico 11.3 43 Vermont 15.6 19 Idaho 11.5 44 New Hampshire 16.3 20 Georgia 11.9 Atlanta 45 Illinois 16.4 Chicago 21 South Carolina 12.1 46 Ohio 16.8 22 North Carolina 12.2 47 Indiana 16.9 23 Arizona 12.6 48 Rhode Island 17.0 24 Texas 12.8 Dallas 49 Hawaii 22.3 25 Alabama 12.9 50 Michigan 22.7 25 Alaska 12.9 51 Nevada 28.2 NOTE: US Bureau of Labor Statitsics

14 Note: Financial data as of March 31, 2020 (1) Includes Home Equity Loans of $121.6 million Diversified Loan Portfolio $4.2 Billion Consumer ¹ 7.3% Single Family Real Estate 14.8% Multifamily Real Estate 21.9% Commercial Real Estate 36.0% Const. & Land Dev 13.6% Commercial Business/Bonds 6.4% Kansas City 6.1% Kansas Other 1.7% St Louis 17.4% Springfield 8.5% Branson 1.5% Missouri Other 6.3% Iowa/ Nebraska/ South Dakota 7.6% Minnesota 7.7% Tulsa 6.3% Oklahoma Other 2.1% Fayetteville 2.2% Atlanta 1.4% Chicago 4.0% Denver 1.8% Dallas 3.2% Texas Other 5.6% Other Regions 16.6% By Type By Region
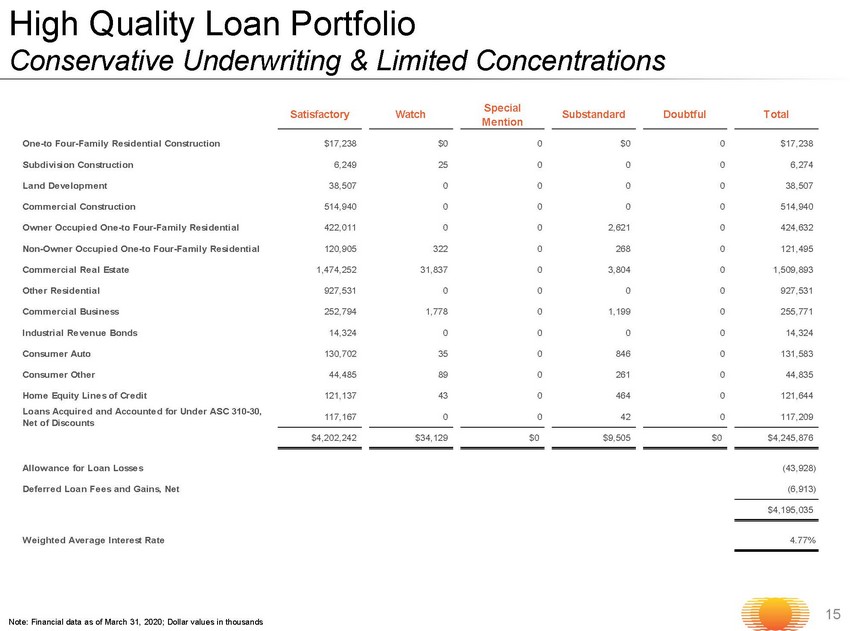
High Quality Loan Portfolio Conservative Underwriting & Limited Concentrations 15 Note: Financial data as of March 31, 2020; Dollar values in thousands One-to Four-Family Residential Construction $17,238 $0 0 $0 0 $17,238 Subdivision Construction 6,249 25 0 0 0 6,274 Land Development 38,507 0 0 0 0 38,507 Commercial Construction 514,940 0 0 0 0 514,940 Owner Occupied One-to Four-Family Residential 422,011 0 0 2,621 0 424,632 Non-Owner Occupied One-to Four-Family Residential 120,905 322 0 268 0 121,495 Commercial Real Estate 1,474,252 31,837 0 3,804 0 1,509,893 Other Residential 927,531 0 0 0 0 927,531 Commercial Business 252,794 1,778 0 1,199 0 255,771 Industrial Revenue Bonds 14,324 0 0 0 0 14,324 Consumer Auto 130,702 35 0 846 0 131,583 Consumer Other 44,485 89 0 261 0 44,835 Home Equity Lines of Credit 121,137 43 0 464 0 121,644 Loans Acquired and Accounted for Under ASC 310-30, Net of Discounts 117,167 0 0 42 0 117,209 $4,202,242 $34,129 $0 $9,505 $0 $4,245,876 Allowance for Loan Losses (43,928) Deferred Loan Fees and Gains, Net (6,913) $4,195,035 Weighted Average Interest Rate 4.77% TotalSatisfactory Watch Special Mention Substandard Doubtful
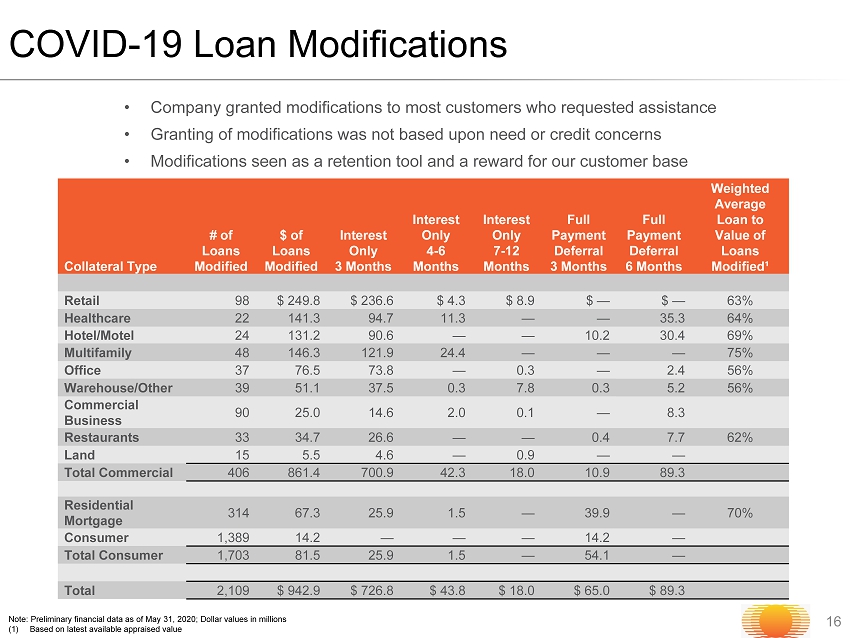
COVID - 19 Loan Modifications 1 6 Collateral Type # of Loans Modified $ of Loans Modified Interest Only 3 Months Interest Only 4 - 6 Months Interest Only 7 - 12 Months Full Payment Deferral 3 Months Full Payment Deferral 6 Months Weighted Average Loan to Value of Loans Modified¹ Retail 98 $ 249.8 $ 236.6 $ 4.3 $ 8.9 $ — $ — 63% Healthcare 22 141.3 94.7 11.3 — — 35.3 64% Hotel/Motel 24 131.2 90.6 — — 10.2 30.4 69% Multifamily 48 146.3 121.9 24.4 — — — 75% Office 37 76.5 73.8 — 0.3 — 2.4 56% Warehouse/Other 39 51.1 37.5 0.3 7.8 0.3 5.2 56% Commercial Business 90 25.0 14.6 2.0 0.1 — 8.3 Restaurants 33 34.7 26.6 — — 0.4 7.7 62% Land 15 5.5 4.6 — 0.9 — — Total Commercial 406 861.4 700.9 42.3 18.0 10.9 89.3 Residential Mortgage 314 67.3 25.9 1.5 — 39.9 — 70% Consumer 1,389 14.2 — — — 14.2 — Total Consumer 1,703 81.5 25.9 1.5 — 54.1 — Total 2,109 $ 942.9 $ 726.8 $ 43.8 $ 18.0 $ 65.0 $ 89.3 Note: Preliminary financial data as of May 31, 2020; Dollar values in millions (1) Based on latest available appraised value • Company granted modifications to most customers who requested assistance • Granting of modifications was not based upon need or credit concerns • Modifications seen as a retention tool and a reward for our customer base

Hilton $81M 38% Marriott $79M 37% Wyndham $4M 2% Choice $8M 4% IHG $23M 11% Independent $18M 8% Minneapolis 20.1% Chicago 11.8% Branson 3.6% Other Missouri 9.8% Tulsa 6.2% Springfield 4.9% Iowa 3.9% St. Louis 7.4% Other Regions 32.2% 17 Note: Financial data as of March 31, 2020 Sectors with Escalated Monitoring: Hotel/Motel Portfolio $213M Hotel/Motel/Resorts by Geography Hotel/Motel by Flag • $213 million or 5% of the total loan portfolio • Average loan size of $ 4.3 million, with the top 20 loans comprising 9 0% of the portfolio, the remaining 30 loans comprise 10% of the portfolio • 56% weighted average LTV • 100% of the portfolio was pass rated • $131 million, or 62 %, of the loans have secured a payment modification as of May 31 , 2020 • Conservative underwriting and direct dialogues with sophisticated sponsors drives plan to conserve cash and fund operations • Well - diversified geographically throughout the Midwest in markets less impacted by COVID - 19 and are beginning to re - open $213M
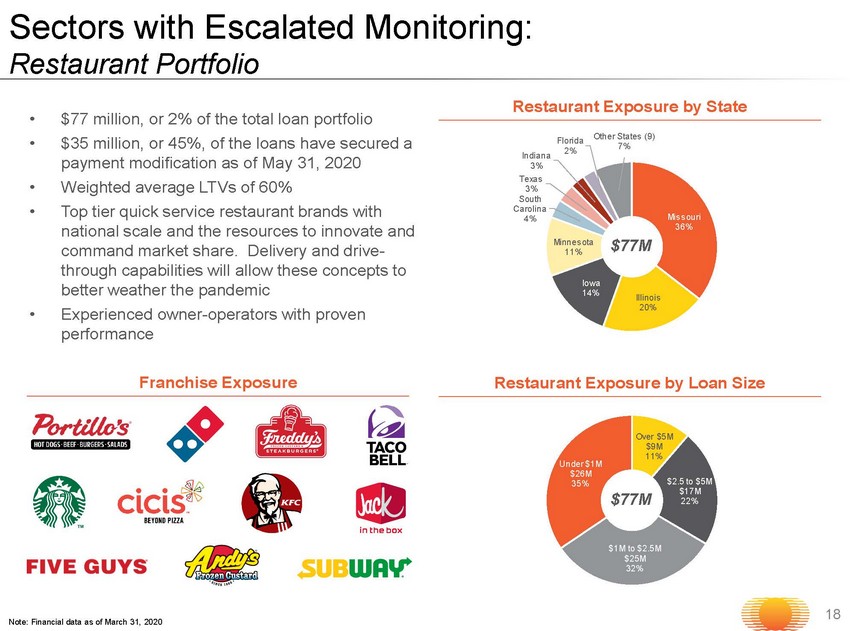
Over $5M $9M 11% $2.5 to $5M $17M 22% $1M to $2.5M $25M 32% Under $1M $26M 35% • $77 million, or 2% of the total loan portfolio • $ 3 5 million, or 45 %, of the loans have secured a payment modification as of May 31 , 2020 • Weighted average LTVs of 60% • Top tier quick service restaurant brands with national scale and the resources to innovate and command market share. Delivery and drive - through capabilities will allow these concepts to better weather the pandemic • Experienced owner - operators with proven performance 18 Note: Financial data as of March 31 , 2020 Sectors with Escalated Monitoring: Restaurant Portfolio $7 7 M Missouri 36% Illinois 20% Iowa 14% Minnesota 11% South Carolina 4% Texas 3% Indiana 3% Florida 2% Other States (9) 7% Restaurant Exposure by Loan Size Restaurant Exposure by State $77M Franchise Exposure
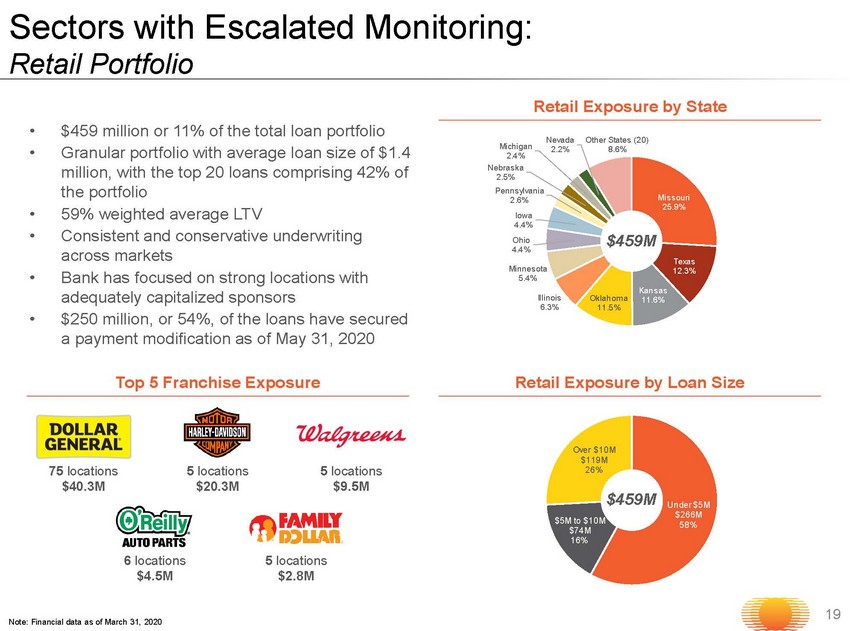
Missouri 25.9% Texas 12.3% Kansas 11.6% Oklahoma 11.5% Illinois 6.3% Minnesota 5.4% Ohio 4.4% Iowa 4.4% Pennsylvania 2.6% Nebraska 2.5% Michigan 2.4% Nevada 2.2% Other States (20) 8.6% • $459 million or 11 % of the total loan portfolio • Granular portfolio with average loan size of $1.4 million , with the top 20 loans comprising 42 % of the portfolio • 59% weighted average LTV • Consistent and conservative underwriting across markets • Bank has focused on strong locations with adequately capitalized sponsors • $250 million, or 54 %, of the loans have secured a payment modification as of May 31, 2020 Under $5M $266M 58% $5M to $10M $74M 16% Over $10M $119M 26% 19 Note: Financial data as of March 31, 2020 Sectors with Escalated Monitoring: Retail Portfolio $459M Retail Exposure by Loan Size Retail Exposure by State $459M Top 5 Franchise Exposure 75 locations $40.3M 6 locations $4.5M 5 locations $9.5M 5 locations $2.8M 5 locations $20.3M
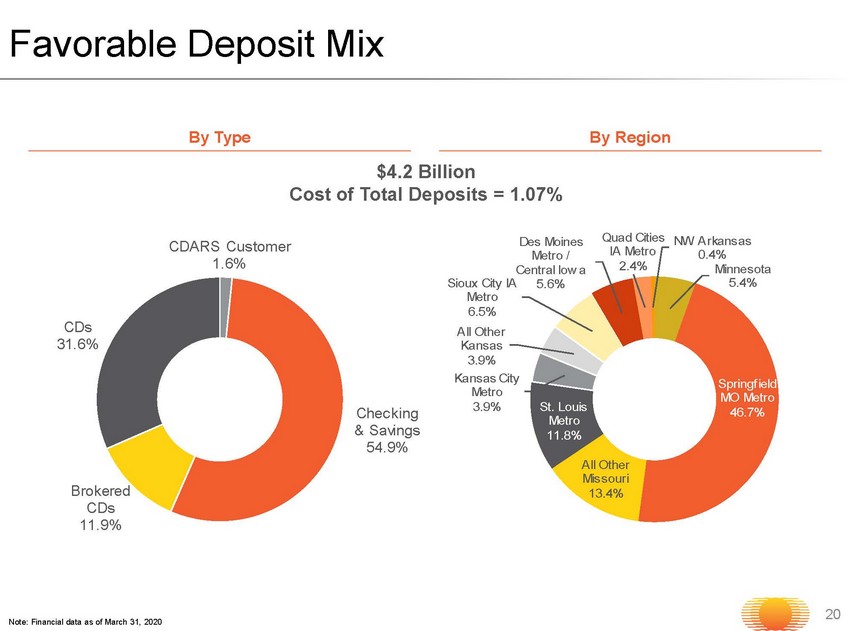
20 Favorable Deposit Mix $4.2 Billion Cost of Total Deposits = 1.07% CDARS Customer 1.6% Checking & Savings 54.9% Brokered CDs 11.9% CDs 31.6% Minnesota 5.4% Springfield MO Metro 46.7% All Other Missouri 13.4% St. Louis Metro 11.8% Kansas City Metro 3.9% All Other Kansas 3.9% Sioux City IA Metro 6.5% Des Moines Metro / Central Iowa 5.6% Quad Cities IA Metro 2.4% NW Arkansas 0.4% Note: Financial data as of March 31, 2020 By Type By Region
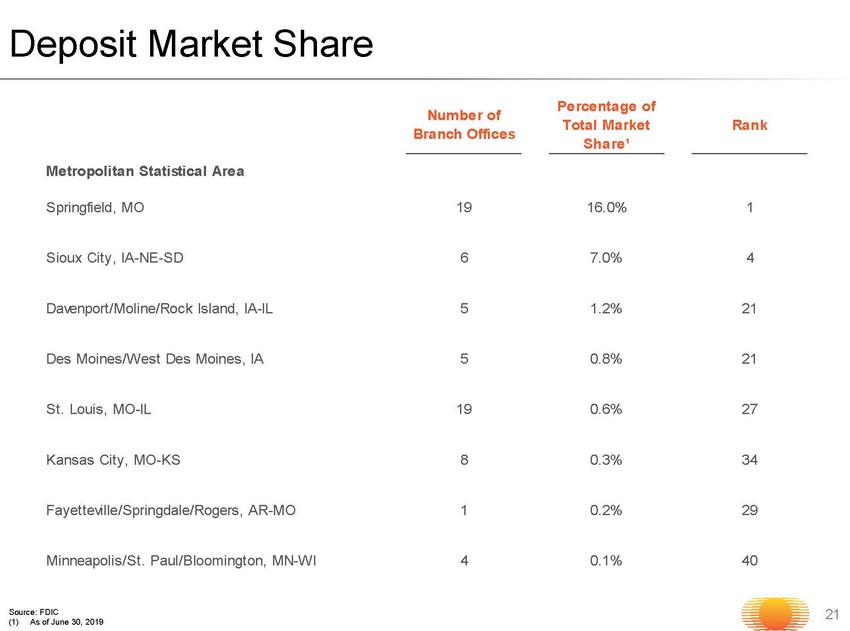
Deposit Market Share 21 Metropolitan Statistical Area Springfield, MO 19 16.0% 1 Sioux City, IA-NE-SD 6 7.0% 4 Davenport/Moline/Rock Island, IA-IL 5 1.2% 21 Des Moines/West Des Moines, IA 5 0.8% 21 St. Louis, MO-IL 19 0.6% 27 Kansas City, MO-KS 8 0.3% 34 Fayetteville/Springdale/Rogers, AR-MO 1 0.2% 29 Minneapolis/St. Paul/Bloomington, MN-WI 4 0.1% 40 Number of Branch Offices Percentage of Total Market Share¹ Rank Source: FDIC (1) As of June 30, 2019

Balance Sheet Repricing - - As of March 31, 2020 22 • The results of our modeling indicate that net interest income is not likely to be significantly affected either positively or ne gatively in the first twelve months following a rate change • Our portfolios are relatively well matched in a twelve - month horizon. In a situation where market interest rates decrease significantly in a short period of time, as they did in March 2020: • Our Net Interest Margin may decrease in the very near term (first one to three months), due to fairly rapid decreases in LIBO R interest rates. In the subsequent months we expect that our Net Interest Margin will stabilize and begin to improve, as rene wal interest rates on maturing time deposits are expected to decrease compared to the current rates paid on those products. – Total CDs = $1.9 billion – $1.6 billion of CDs with a weighted average cost of 1.71% will reprice by 6/30/2021 • The effects of interest rate changes, if any, on net interest income are expected to be greater in the 12 to 36 months follow ing rate changes. • In response to the coronavirus pandemic, the FRB decreased interest rates on two occasions in March 2020, a 0.50% decrease on March 3rd and a 1.00% decrease on March 16th. At March 31, 2020, the Federal Funds rate stood at 0.25%. • A substantial portion of our loan portfolio ($1.97 billion at March 31, 2020) is tied to the one - month or three - month LIBOR inde x and is subject to adjustment at least once within 90 days after March 31, 2020. Of these loans, $1.81 billion had interest r ate floors. • Great Southern also has a portfolio of loans ($203 million at March 31, 2020) tied to a "prime rate" of interest and will adj ust immediately with changes to the “prime rate” of interest.

Liquidity Sources 23 Note: Financial data as of March 31, 2020; Dollar values in millions (1) Does not include additional capacity to add brokered and national rateline CDs Cash and Cash Equivalents $ 240.5 Unpledged Securities 249.8 On - balance Sheet Liquidity 490.3 Available to Borrow on Secured Line at Federal Home Loan Bank 1,027.1 Total Long - term Liquidity Sources 1,517.4 Short - term Liquidity Source: Available to Borrow on Secured line at Federal Reserve Bank 368.0 Total Liquidity Sources ¹ $1,885.4
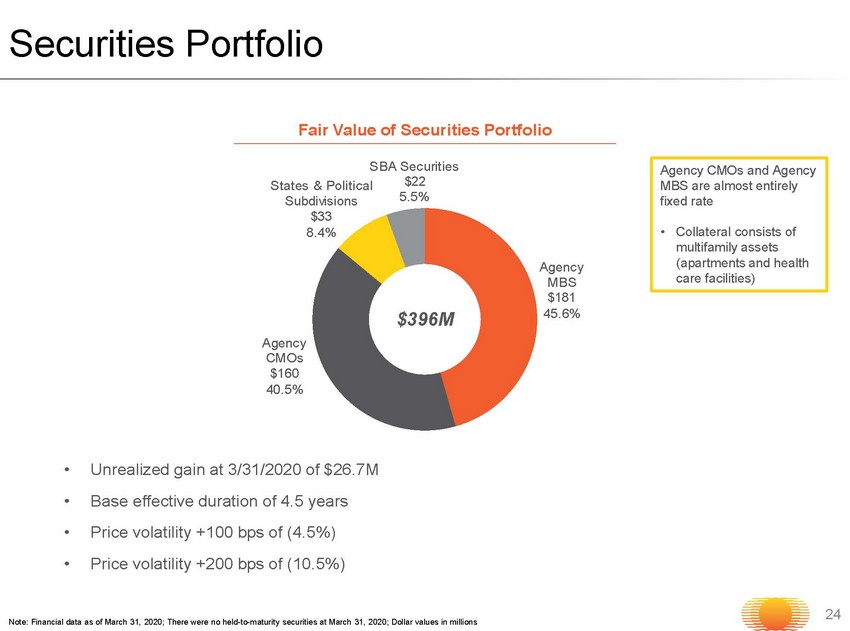
Securities Portfolio 24 Note: Financial data as of March 31, 2020; There were no held - to - maturity sec urities at March 31, 2020; Dollar values in millions Fair Value of Securities Portfolio Agency MBS $181 45.6% Agency CMOs $160 40.5% States & Political Subdivisions $33 8.4% SBA Securities $22 5.5% • Unrealized gain at 3/31/2020 of $26.7M • Base effective duration of 4.5 years • Price volatility +100 bps of (4.5%) • Price volatility +200 bps of (10.5%) Agency CMOs and Agency MBS are almost entirely fixed rate • Collateral consists of multifamily assets (apartments and health care facilities) $ 396 M

Consistently Strong Capital and TBV¹ Growth 25 $28.26 $29.88 $32.71 $36.94 $41.72 $43.06 9.58% 9.20% 10.46% 11.20% 11.88% 11.97% 5.00% 15.00% $15.00 $45.00 2015 2016 2017 2018 2019 1Q2020 TBVPS TCE Ratio (1) See appendix for non - GAAP reconciliation of tangible common equity to tangible assets (page 33)

Holding Company Capitalization 26 Note: Financial data as of March 31, 2020; Assumes $ 50 million subordinated debt issuance, a 1.45% underwriting fee, $350K other offering expenses, 20% risk weighting on net procee ds and $0 down - streamed to the bank (1) See appendix for non - GAAP reconciliation of tangible common equity to tangible assets (page 33 ) (Dollars in thousands) Sub Debt Issuance Actual Adjustments Pro Forma Regulatory Capital Common Equity Tier 1 Capital 585,829$ -$ 585,829$ Additional Tier 1 Capital 25,000 - 25,000 Tier 1 Capital 610,829 - 610,829 ALLL 43,928 - 43,928 Sub Debt 75,000 50,000 125,000 Tier 2 Capital 118,928 50,000 168,928 Total Capital 729,757$ 50,000$ 779,757$ Total Assets for Regulatory Ratios Risk-Weighted Assets 4,643,265 9,785 4,653,050 Total Assets For Leverage Ratio 4,956,742 48,925 5,005,667 TCE and TA Tangible Common Equity 606,423 - 606,423 Tangible Assets 5,065,211 48,925 5,114,136 Capital Ratios TCE / TA 11.97% 11.86% Leverage Ratio 12.32% 12.20% CE Tier 1 Capital Ratio 12.62% 12.59% Tier 1 Ratio 13.16% 13.13% Total Capital Ratio 15.72% 16.76%
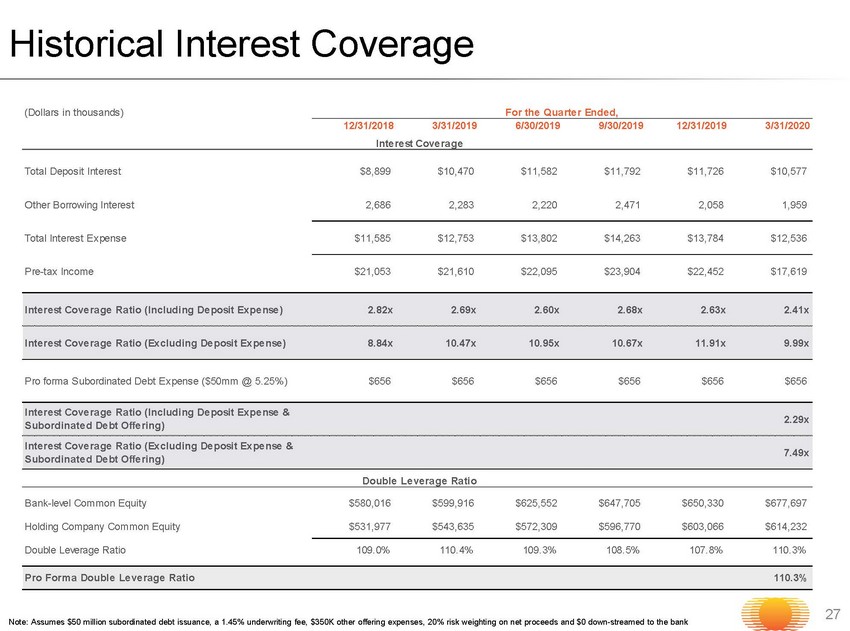
Historical Interest Coverage 27 Note: Assumes $50 million subordinated debt issuance, a 1.45% underwriting fee, $350K other offering expenses, 20% risk weigh tin g on net proceeds and $0 down - streamed to the bank (Dollars in thousands) For the Quarter Ended, 12/31/2018 3/31/2019 6/30/2019 9/30/2019 12/31/2019 3/31/2020 Interest Coverage Total Deposit Interest $8,899 $10,470 $11,582 $11,792 $11,726 $10,577 Other Borrowing Interest 2,686 2,283 2,220 2,471 2,058 1,959 Total Interest Expense $11,585 $12,753 $13,802 $14,263 $13,784 $12,536 Pre-tax Income $21,053 $21,610 $22,095 $23,904 $22,452 $17,619 Interest Coverage Ratio (Including Deposit Expense) 2.82x 2.69x 2.60x 2.68x 2.63x 2.41x Interest Coverage Ratio (Excluding Deposit Expense) 8.84x 10.47x 10.95x 10.67x 11.91x 9.99x Pro forma Subordinated Debt Expense ($50mm @ 5.25%) $656 $656 $656 $656 $656 $656 Interest Coverage Ratio (Including Deposit Expense & Subordinated Debt Offering) 2.29x Interest Coverage Ratio (Excluding Deposit Expense & Subordinated Debt Offering) 7.49x Double Leverage Ratio Bank-level Common Equity $580,016 $599,916 $625,552 $647,705 $650,330 $677,697 Holding Company Common Equity $531,977 $543,635 $572,309 $596,770 $603,066 $614,232 Double Leverage Ratio 109.0% 110.4% 109.3% 108.5% 107.8% 110.3% Pro Forma Double Leverage Ratio 110.3%
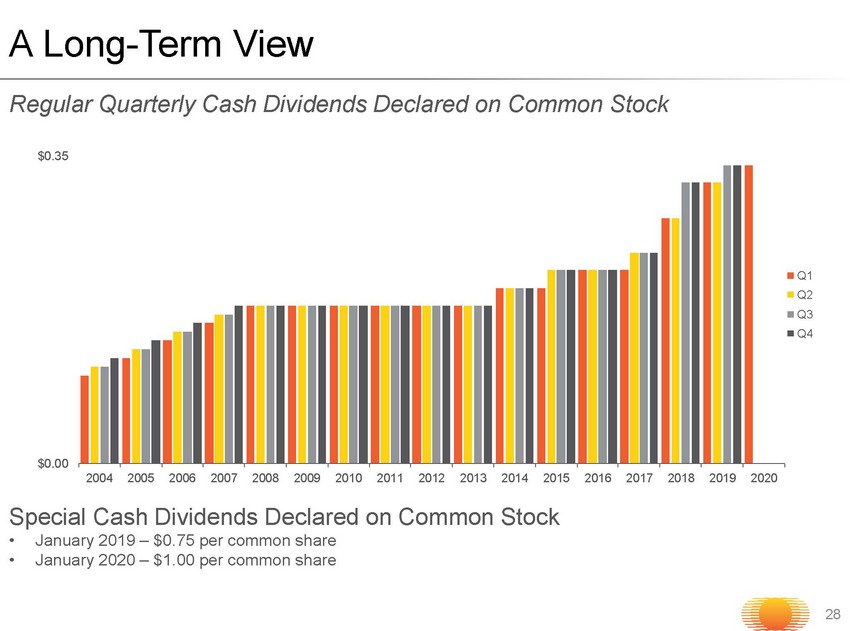
A Long - Term View 28 Regular Quarterly Cash Dividends Declared on Common Stock $0.00 $0.35 2004 2005 2006 2007 2008 2009 2010 2011 2012 2013 2014 2015 2016 2017 2018 2019 2020 Q1 Q2 Q3 Q4 Special Cash Dividends Declared on Common Stock • January 2019 – $0.75 per common share • January 2020 – $1.00 per common share
Thank You • For more information: x Visit our Web site: www.GreatSouthernBank.com x Sign up for e - mail notification to get the latest Great Southern news x Call us with questions: 417.895.5242 29

Appendix 30
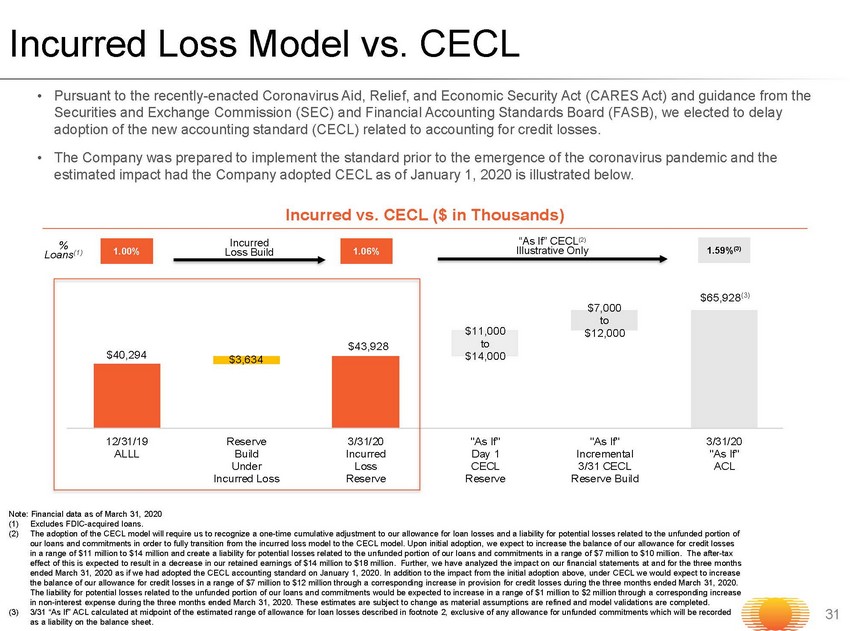
$40,294 $43,928 $65,928 (3) $3,634 $11,000 to $14,000 $7,000 to $12,000 12/31/19 ALLL Reserve Build Under Incurred Loss 3/31/20 Incurred Loss Reserve "As If" Day 1 CECL Reserve "As If" Incremental 3/31 CECL Reserve Build 3/31/20 "As If" ACL Incurred Loss Build • Pursuant to the recently - enacted Coronavirus Aid, Relief, and Economic Security Act (CARES Act) and guidance from the Securities and Exchange Commission (SEC) and Financial Accounting Standards Board (FASB), we elected to delay adoption of the new accounting standard (CECL) related to accounting for credit losses. • The Company was prepared to implement the standard prior to the emergence of the coronavirus pandemic and the estimated impact had the Company adopted CECL as of January 1, 2020 is illustrated below. 31 Incurred Loss Model vs. CECL Incurred vs. CECL ($ in Thousands) 1.00% 1.06% “As If” CECL (2) Illustrative Only Note: Financial data as of March 31, 2020 (1) Excludes FDIC - acquired loans. (2) The adoption of the CECL model will require us to recognize a one - time cumulative adjustment to our allowance for loan losses an d a liability for potential losses related to the unfunded portion of our loans and commitments in order to fully transition from the incurred loss model to the CECL model. Upon initial adoption, we expect to increase the balance of our allowance for credit losses in a range of $11 million to $14 million and create a liability for potential losses related to the unfunded portion of our l oan s and commitments in a range of $7 million to $10 million. The after - tax effect of this is expected to result in a decrease in our retained earnings of $14 million to $18 million. Further, we have ana lyzed the impact on our financial statements at and for the three months ended March 31, 2020 as if we had adopted the CECL accounting standard on January 1, 2020. In addition to the impact from the in itial adoption above, under CECL we would expect to increase the balance of our allowance for credit losses in a range of $7 million to $12 million through a corresponding increase in pr ovi sion for credit losses during the three months ended March 31, 2020. The liability for potential losses related to the unfunded portion of our loans and commitments would be expected to increase in a range of $1 million to $2 million through a corresponding increase in non - interest expense during the three months ended March 31, 2020. These estimates are subject to change as material assumpti ons are refined and model validations are completed. (3) 3/31 “As If” ACL calculated at midpoint of the estimated range of allowance for loan losses described in footnote 2, exclusiv e o f any allowance for unfunded commitments which will be recorded as a liability on the balance sheet. % Loans (1) 1.59% (3)

Non - GAAP Reconciliation 32 This presentation contains certain financial information determined by methods other than in accordance with accounting princ ipl es generally accepted in the United States (“GAAP”). These non - GAAP financial measures include core net interest income, core net interest margin, return on average tangib le common equity, tangible common equity, tangible assets and the ratio of tangible common equity to tangible assets. We calculate core net interest income and core net interest margin by subtracting the impact of adjustments regarding changes in expected cash flows related to our pools of loans we acquired through FDIC - assisted transactions from reported net interest income and net interest margin. Management be lieves that core net interest income and core net interest margin are useful in assessing the Company’s core performance and trends, in light of the fluctuations that ca n occur related to updated estimates of the fair value of the loan pools we acquired in the 2009, 2011, 2012 and 2014 FDIC - assisted transactions. In calculating return on average tangible common equity, tangible common equity, tangible assets and the ratio of tangible co mmo n equity to tangible assets, we subtract average intangible assets from average common equity and intangible assets from common equity and from total assets. Managem ent believes that the presentation of these measures excluding the impact of intangible assets provides useful supplemental information that is helpful in understa ndi ng our financial condition and results of operations, as they provide a method to assess management’s success in utilizing our tangible capital as well as our capital str ength. Management also believes that providing measures that exclude balances of intangible assets, which are subjective components of valuation, facilitates the com parison of our performance with the performance of our peers. In addition, management believes that these are standard financial measures used in the banking in dus try to evaluate performance. These non - GAAP financial measures are supplemental and are not a substitute for any analysis based on GAAP financial measures. B ecause not all companies use the same calculation of non - GAAP measures, this presentation may not be comparable to other similarly titled measures as calculated by other companies. Non - GAAP Reconciliation : Core Net Interest Income and Core Net Interest Margin FY 2015 FY 2016 FY 2017 FY 2018 FY 2019 Qtr. ended 03/31/2020 $000 % $000 % $000 % $000 % $000 % $000 % Reported Net Interest Income/Margin $168,354 4.53 $163,056 4.05 $155,156 3.74 $168,192 3.99 $180,392 3.95 $44,938 3.84 Less: Impact of FDIC - assisted acquired loan accretion adjustments 28,531 0.77 16,393 0.41 5,014 0.12 5,134 0.12 7,431 0.16 1,866 0.16 Core Net Interest Income/Margin $139,823 3.76 $146,663 3.64 $150,142 3.62 $163,058 3.87 $172,961 3.79 $43,072 3.68

Non - GAAP Reconciliation (cont.) 33 Non - GAAP Reconciliation : Return on Average Tangible Common Equity, Tangible Common Equity, Tangible Assets and Ratio of Tangible Common Equity to Tangible Assets (Dollars in thousands) FY 2015 FY 2016 FY 2017 FY 2018 FY 2019 03/31/2020 Net Income Available to Common Shareholders (a) $45,948 $45,342 $51,564 $67,109 $73,612 $14,868 Average Common Equity $383,439 $414,799 $455,704 $498,508 $571,637 $599,011 Less: Average Intangible Assets 6,679 12,592 11,713 10,046 8,681 7,967 Average Tangible Common Equity (b) $376,760 $402,207 $443,991 $488,462 $562,956 $591,044 Return on Average Tangible Common Equity (a)/(b) 12.20% 11.27% 11.61% 13.74% 13.08% 10.12% Common Equity At Period End $398,227 $429,806 $471,662 $531,977 $603,066 $614,232 Less: Intangible Assets At Period End 5,758 12,500 10,850 9,288 8,098 7,809 Tangible Common Equity At Period End (c) $392,469 $417,306 $460,812 $522,689 $594,968 $606,423 Total Assets at Period End $4,104,189 $4,550,663 $4,414,521 $4,676,200 $5,015,072 $5,073,020 Less: Intangible Assets At Period End 5,758 12,500 10,850 9,288 8,098 7,809 Tangible Assets as Period End (d) $4,098,431 $4,538,163 $4,403,671 $4,666,912 $5,006,974 $5,065,211 Tangible Common Equity to Tangible Assets (c)/(d) 9.58% 9.20% 10.46% 11.20% 11.88% 11.97%