Attached files
| file | filename |
|---|---|
| EX-99.2 - EX-99.2 - DYCOM INDUSTRIES INC | dyfy2021q1non-gaapreco.htm |
| 8-K - 8-K - DYCOM INDUSTRIES INC | dy-20200608.htm |

Exhibit 99.1 Investor Presentation June 2020
Important Information Caution Concerning Forward-Looking Statements This presentation contains “forward-looking statements”. Other than statements of historical facts, all statements contained in this presentation, including statements regarding the Company’s future financial position, future revenue, prospects, plans and objectives of management, are forward-looking statements. Words such as “outlook,” “believe,” “expect,” “anticipate,” “estimate,” “intend,” “should,” “could,” “project,” and similar expressions, as well as statements in future tense, identify forward-looking statements. You should not consider forward-looking statements as a guarantee of future performance or results. Forward-looking statements are based on information available at the time those statements are made and/or management’s good faith belief at that time with respect to future events. Such statements are subject to risks and uncertainties that could cause actual performance or results to differ materially from those expressed in or suggested by the forward-looking statements. These risks and uncertainties include those related to the impact of the COVID-19 pandemic on operating results, cash flows and/or financial condition and the impacts of the measures taken in response to the COVID-19 pandemic as well as the other risks and uncertainties discussed within Item 1, Business, Item 1A, Risk Factors, and Item 7, Management’s Discussion and Analysis of Financial Condition and Results of Operations, of our Annual Report on Form 10-K for fiscal 2020, filed with the U.S. Securities and Exchange Commission (“SEC”) on March 2, 2020, as well as our past and future filings with the SEC. The forward-looking statements in this presentation are expressly qualified in their entirety by this cautionary statement and are only made as of the date of this presentation. The Company undertakes no obligation to update these forward-looking statements to reflect new information, or events or circumstances arising after such date. Non-GAAP Financial Measures This presentation includes certain “Non-GAAP” financial measures as defined by Regulation G of the SEC. As required by the SEC, an explanation of the Non-GAAP financial measures and a reconciliation of those measures to the most directly comparable GAAP financial measures are provided in the Company’s Form 8-K filed with the SEC on June 8, 2020 and on the Company’s Investor Center website at https://ir.dycomind.com. Non-GAAP financial measures should be considered in addition to, but not as a substitute for, the Company’s reported GAAP results. 2
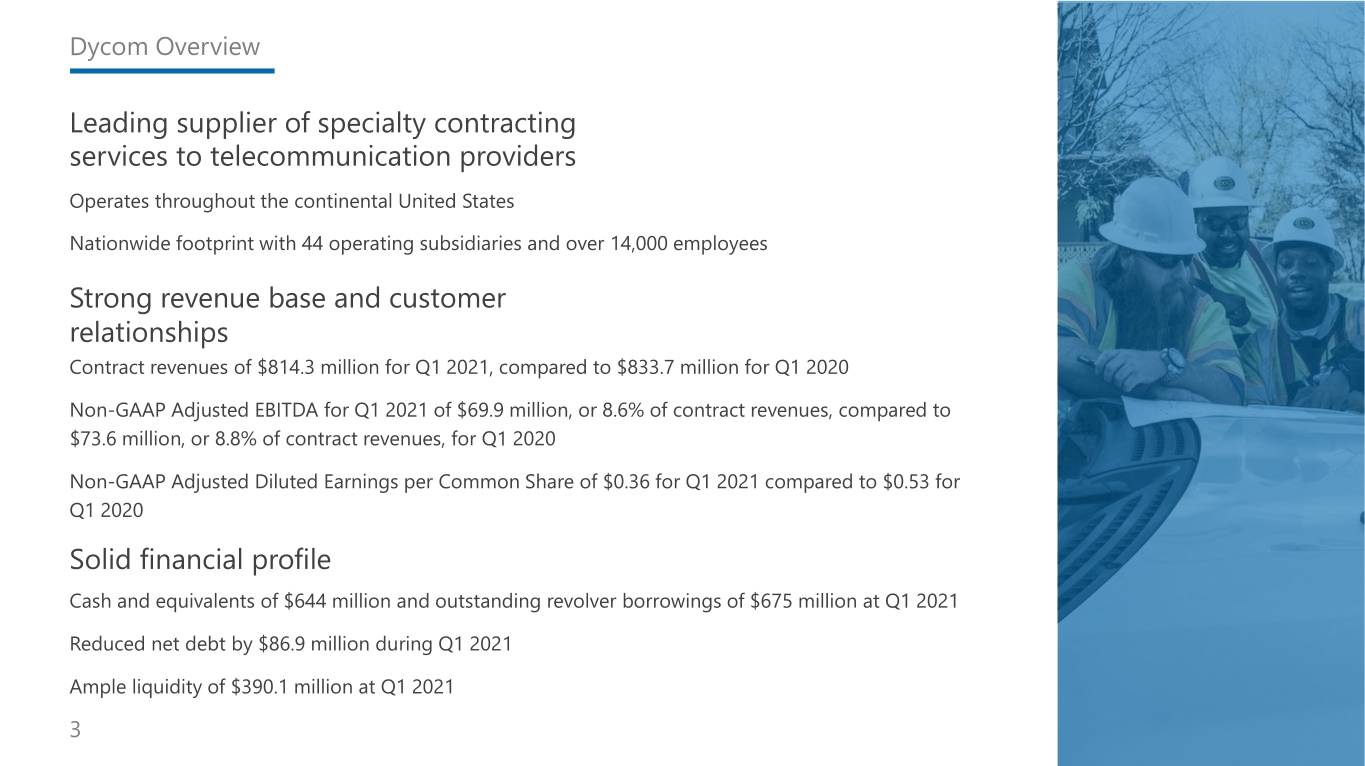
Dycom Overview Leading supplier of specialty contracting services to telecommunication providers Operates throughout the continental United States Nationwide footprint with 44 operating subsidiaries and over 14,000 employees Strong revenue base and customer relationships Contract revenues of $814.3 million for Q1 2021, compared to $833.7 million for Q1 2020 Non-GAAP Adjusted EBITDA for Q1 2021 of $69.9 million, or 8.6% of contract revenues, compared to $73.6 million, or 8.8% of contract revenues, for Q1 2020 Non-GAAP Adjusted Diluted Earnings per Common Share of $0.36 for Q1 2021 compared to $0.53 for Q1 2020 Solid financial profile Cash and equivalents of $644 million and outstanding revolver borrowings of $675 million at Q1 2021 Reduced net debt by $86.9 million during Q1 2021 Ample liquidity of $390.1 million at Q1 2021 3
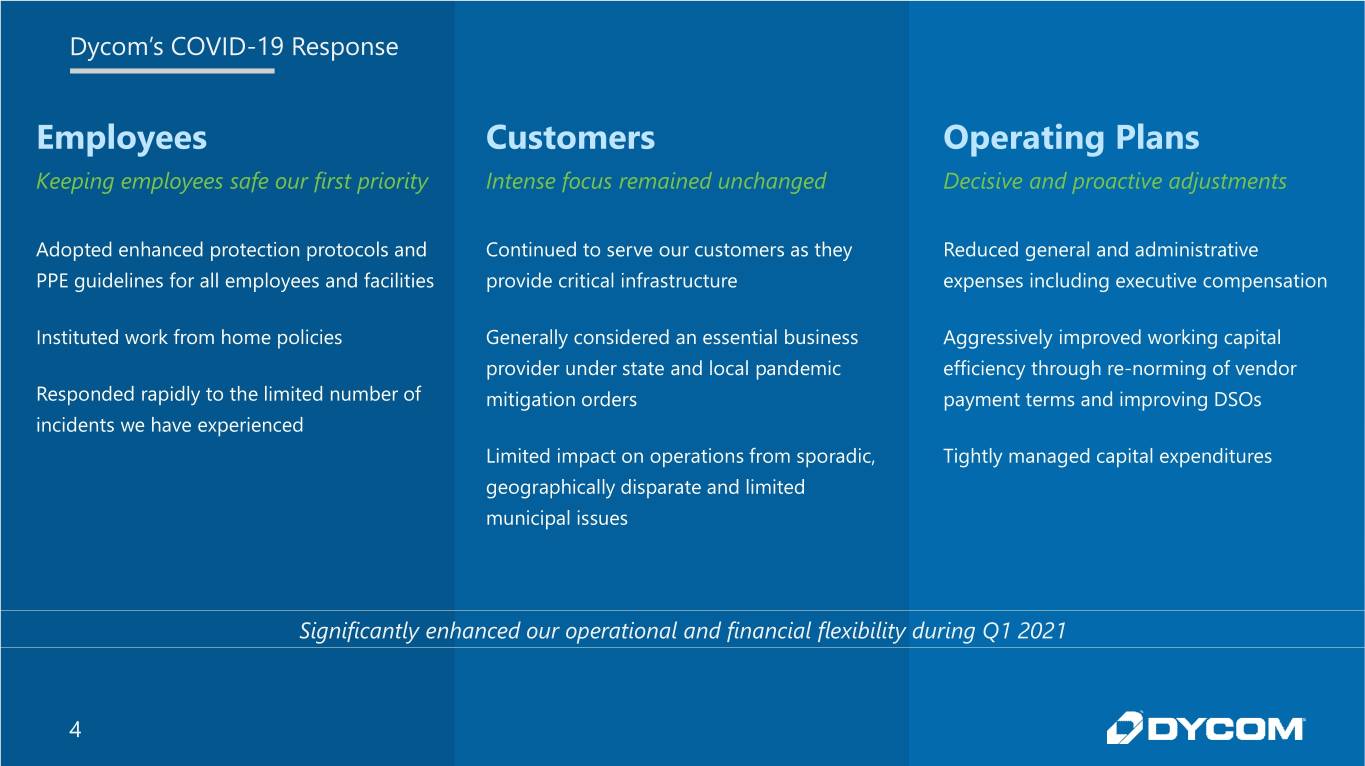
Dycom’s COVID-19 Response Employees Customers Operating Plans Keeping employees safe our first priority Intense focus remained unchanged Decisive and proactive adjustments Adopted enhanced protection protocols and Continued to serve our customers as they Reduced general and administrative PPE guidelines for all employees and facilities provide critical infrastructure expenses including executive compensation Instituted work from home policies Generally considered an essential business Aggressively improved working capital provider under state and local pandemic efficiency through re-norming of vendor Responded rapidly to the limited number of mitigation orders payment terms and improving DSOs incidents we have experienced Limited impact on operations from sporadic, Tightly managed capital expenditures geographically disparate and limited municipal issues Significantly enhanced our operational and financial flexibility during Q1 2021 4
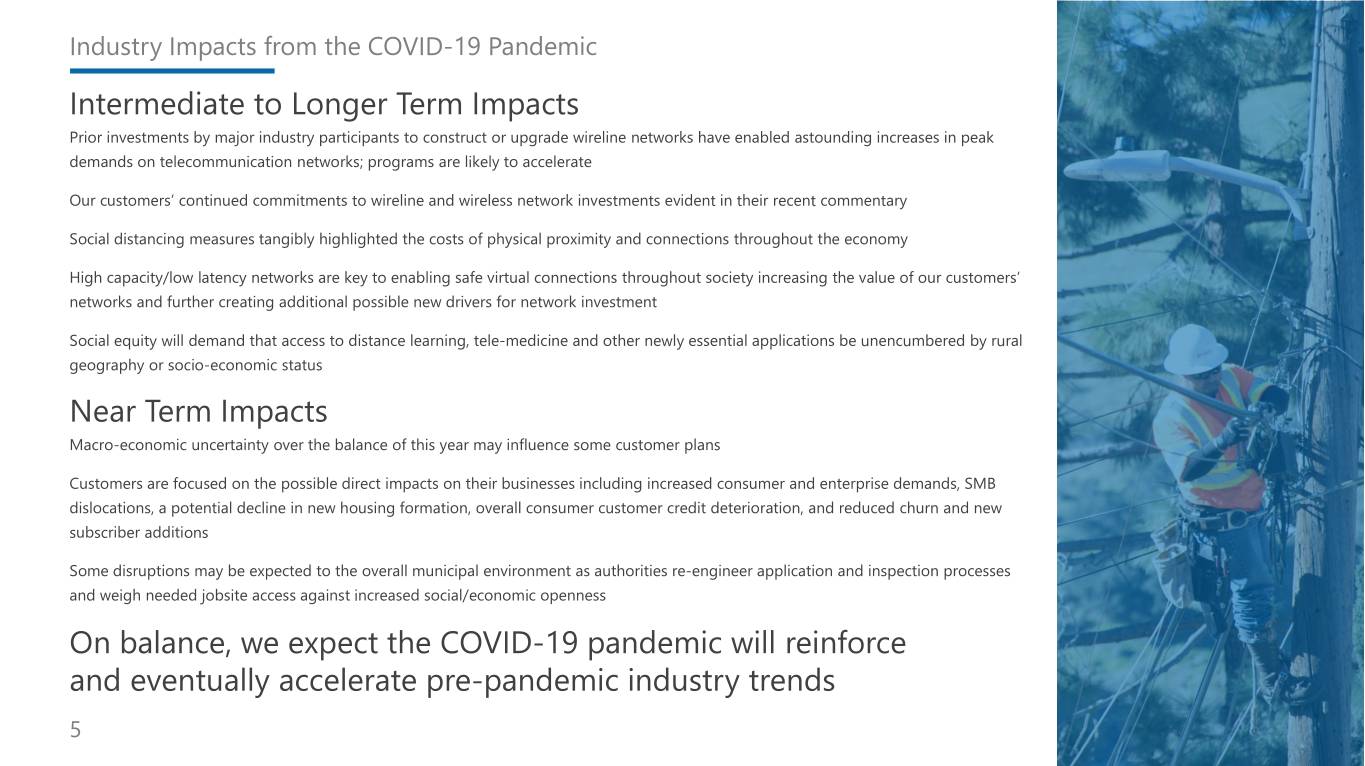
Industry Impacts from the COVID-19 Pandemic Intermediate to Longer Term Impacts Prior investments by major industry participants to construct or upgrade wireline networks have enabled astounding increases in peak demands on telecommunication networks; programs are likely to accelerate Our customers’ continued commitments to wireline and wireless network investments evident in their recent commentary Social distancing measures tangibly highlighted the costs of physical proximity and connections throughout the economy High capacity/low latency networks are key to enabling safe virtual connections throughout society increasing the value of our customers’ networks and further creating additional possible new drivers for network investment Social equity will demand that access to distance learning, tele-medicine and other newly essential applications be unencumbered by rural geography or socio-economic status Near Term Impacts Macro-economic uncertainty over the balance of this year may influence some customer plans Customers are focused on the possible direct impacts on their businesses including increased consumer and enterprise demands, SMB dislocations, a potential decline in new housing formation, overall consumer customer credit deterioration, and reduced churn and new subscriber additions Some disruptions may be expected to the overall municipal environment as authorities re-engineer application and inspection processes and weigh needed jobsite access against increased social/economic openness On balance, we expect the COVID-19 pandemic will reinforce and eventually accelerate pre-pandemic industry trends 5
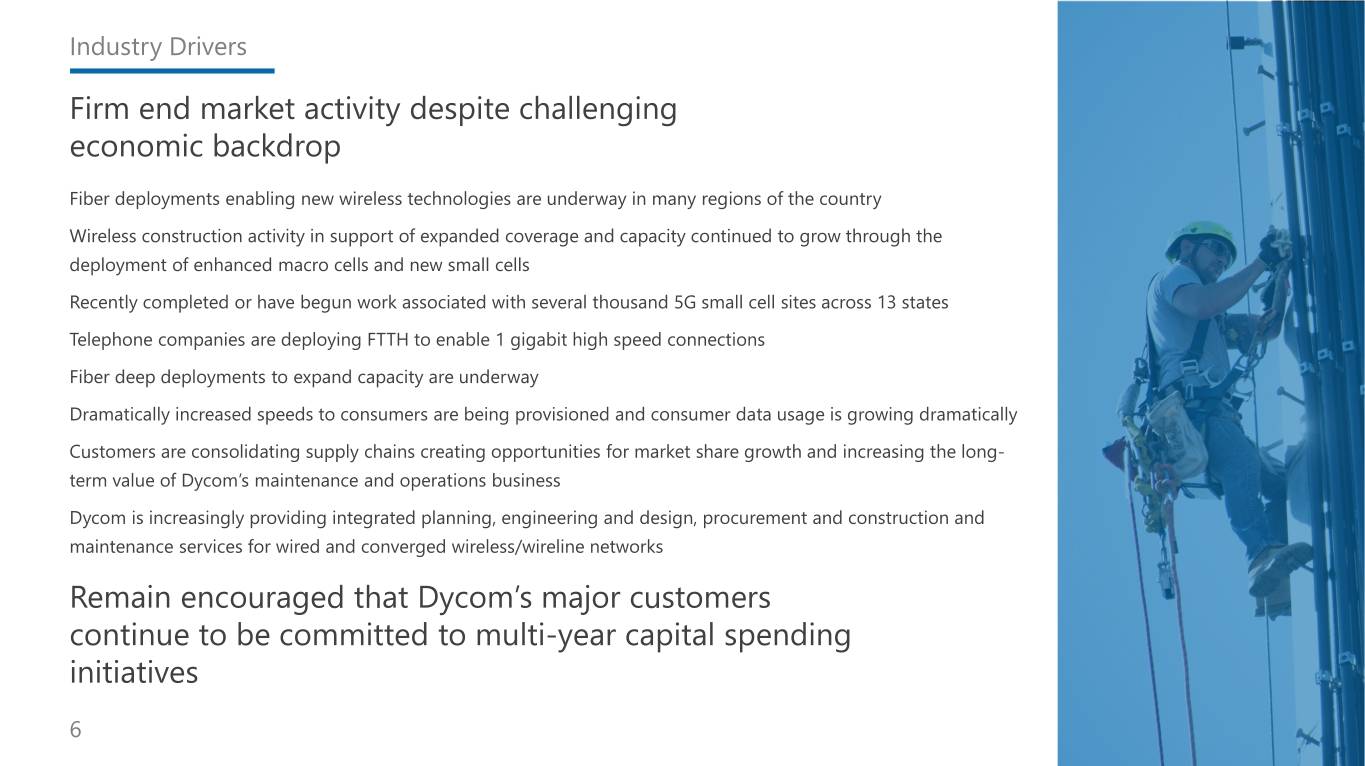
Industry Drivers Firm end market activity despite challenging economic backdrop Fiber deployments enabling new wireless technologies are underway in many regions of the country Wireless construction activity in support of expanded coverage and capacity continued to grow through the deployment of enhanced macro cells and new small cells Recently completed or have begun work associated with several thousand 5G small cell sites across 13 states Telephone companies are deploying FTTH to enable 1 gigabit high speed connections Fiber deep deployments to expand capacity are underway Dramatically increased speeds to consumers are being provisioned and consumer data usage is growing dramatically Customers are consolidating supply chains creating opportunities for market share growth and increasing the long- term value of Dycom’s maintenance and operations business Dycom is increasingly providing integrated planning, engineering and design, procurement and construction and maintenance services for wired and converged wireless/wireline networks Remain encouraged that Dycom’s major customers continue to be committed to multi-year capital spending initiatives 6
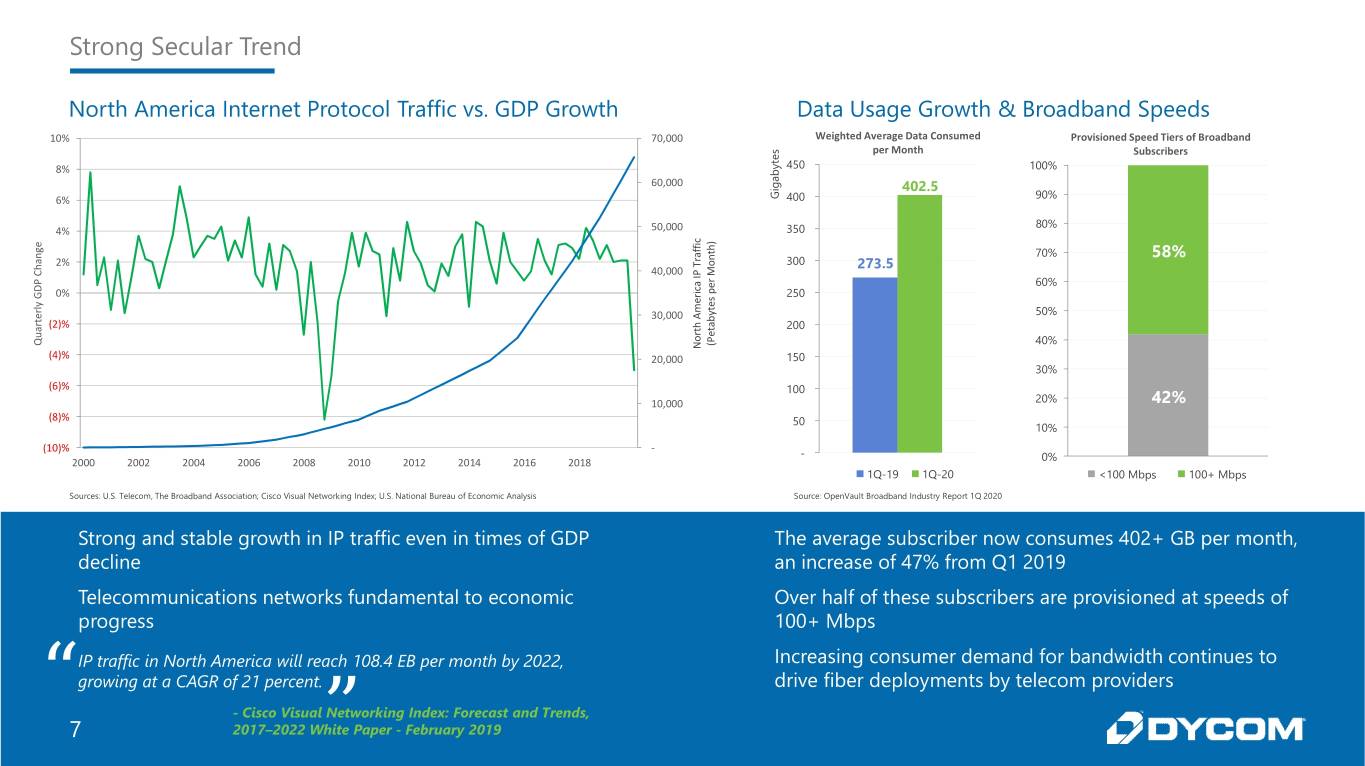
Strong Secular Trend North America Internet Protocol Traffic vs. GDP Growth Data Usage Growth & Broadband Speeds 10% 70,000 Weighted Average Data Consumed Provisioned Speed Tiers of Broadband s per Month Subscribers e t 8% y 450 100% b a 60,000 g i 402.5 6% G 400 90% 80% 4% 50,000 350 c ) i e f h f g t a n 70% n 58% r a o 2% T 300 h 273.5 P M C 40,000 I r P a e 60% c D i p r G 0% 250 s e y e l t m r y 50% e A 30,000 b t r a (2)% h t t 200 a r e u o P Q ( 40% N (4)% 20,000 150 30% (6)% 100 10,000 20% 42% (8)% 50 10% (10)% - - 2000 2002 2004 2006 2008 2010 2012 2014 2016 2018 0% 1Q-19 1Q-20 <100 Mbps 100+ Mbps Sources: U.S. Telecom, The Broadband Association; Cisco Visual Networking Index; U.S. National Bureau of Economic Analysis Source: OpenVault Broadband Industry Report 1Q 2020 Strong and stable growth in IP traffic even in times of GDP The average subscriber now consumes 402+ GB per month, decline an increase of 47% from Q1 2019 Telecommunications networks fundamental to economic Over half of these subscribers are provisioned at speeds of progress 100+ Mbps IP traffic in North America will reach 108.4 EB per month by 2022, Increasing consumer demand for bandwidth continues to “ growing at a CAGR of 21 percent. drive fiber deployments by telecom providers - Cisco Visual Networking Index: Forecast and Trends, 7 2017–2022 White” Paper - February 2019
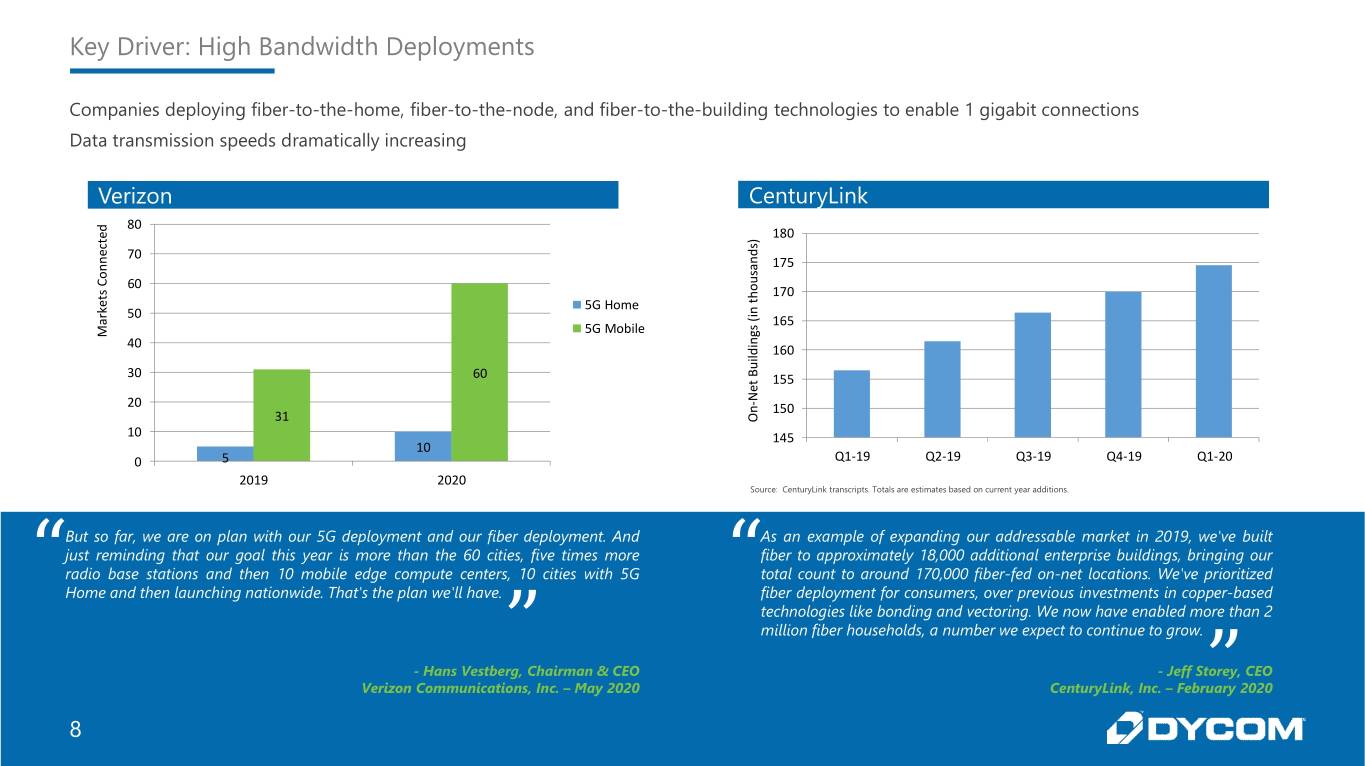
Key Driver: High Bandwidth Deployments Companies deploying fiber-to-the-home, fiber-to-the-node, and fiber-to-the-building technologies to enable 1 gigabit connections Data transmission speeds dramatically increasing Verizon CenturyLink d 80 e 180 ) t s c d e 70 n n a 175 n s o u C 60 o s h 170 t t e 5G Home k n i r 50 ( a 165 5G Mobile s g M n 40 i d 160 l i u B 30 60 t 155 e N 20 - n 150 31 O 10 145 10 0 5 Q1-19 Q2-19 Q3-19 Q4-19 Q1-20 2019 2020 Source: CenturyLink transcripts. Totals are estimates based on current year additions. But so far, we are on plan with our 5G deployment and our fiber deployment. And As an example of expanding our addressable market in 2019, we've built just reminding that our goal this year is more than the 60 cities, five times more fiber to approximately 18,000 additional enterprise buildings, bringing our “ radio base stations and then 10 mobile edge compute centers, 10 cities with 5G “ total count to around 170,000 fiber-fed on-net locations. We've prioritized Home and then launching nationwide. That's the plan we'll have. fiber deployment for consumers, over previous investments in copper-based technologies like bonding and vectoring. We now have enabled more than 2 ” million fiber households, a number we expect to continue to grow. - Hans Vestberg, Chairman & CEO - Jeff Storey, CEO Verizon Communications, Inc. – May 2020 CenturyLink, Inc. – February” 2020 8
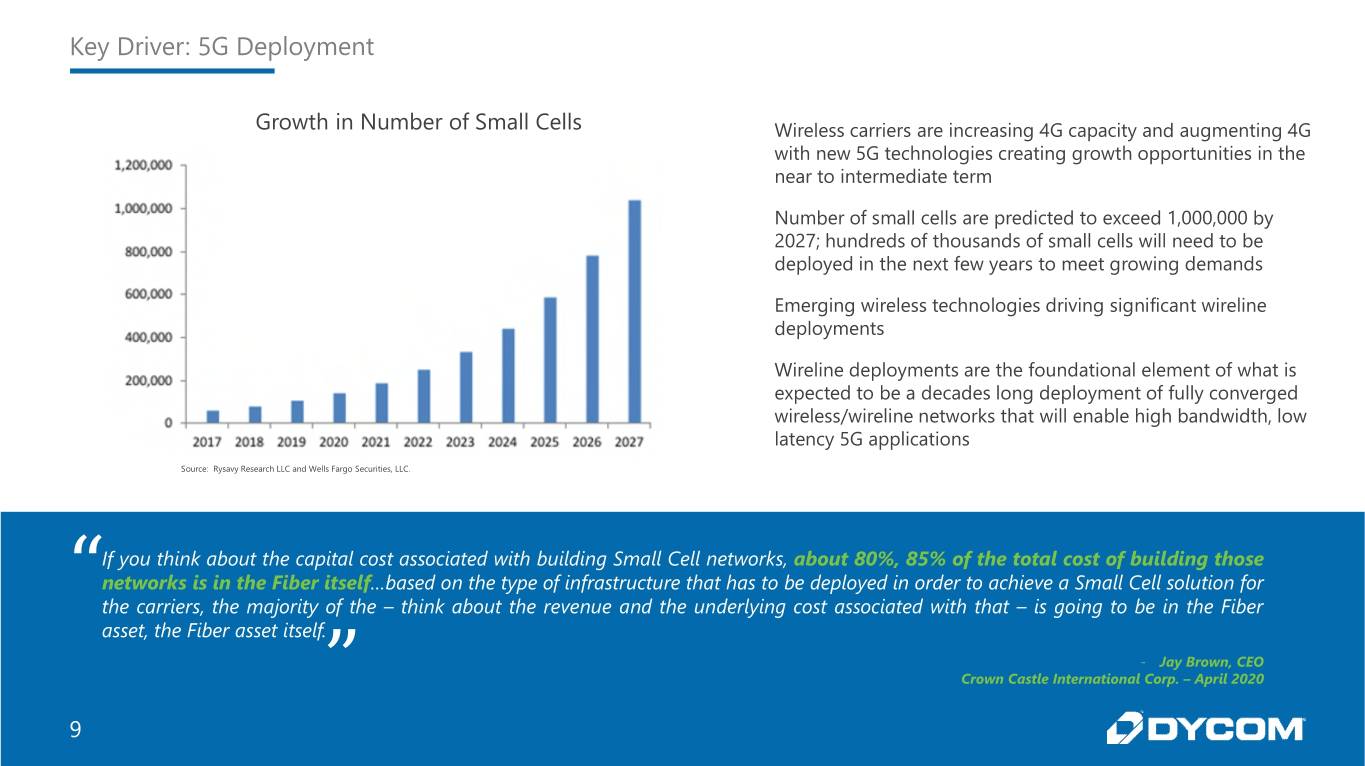
Key Driver: 5G Deployment Growth in Number of Small Cells Wireless carriers are increasing 4G capacity and augmenting 4G with new 5G technologies creating growth opportunities in the near to intermediate term Number of small cells are predicted to exceed 1,000,000 by 2027; hundreds of thousands of small cells will need to be deployed in the next few years to meet growing demands Emerging wireless technologies driving significant wireline deployments Wireline deployments are the foundational element of what is expected to be a decades long deployment of fully converged wireless/wireline networks that will enable high bandwidth, low latency 5G applications Source: Rysavy Research LLC and Wells Fargo Securities, LLC. If you think about the capital cost associated with building Small Cell networks, about 80%, 85% of the total cost of building those “ networks is in the Fiber itself…based on the type of infrastructure that has to be deployed in order to achieve a Small Cell solution for the carriers, the majority of the – think about the revenue and the underlying cost associated with that – is going to be in the Fiber asset, the Fiber asset itself. - Jay Brown, CEO ” Crown Castle International Corp. – April 2020 9
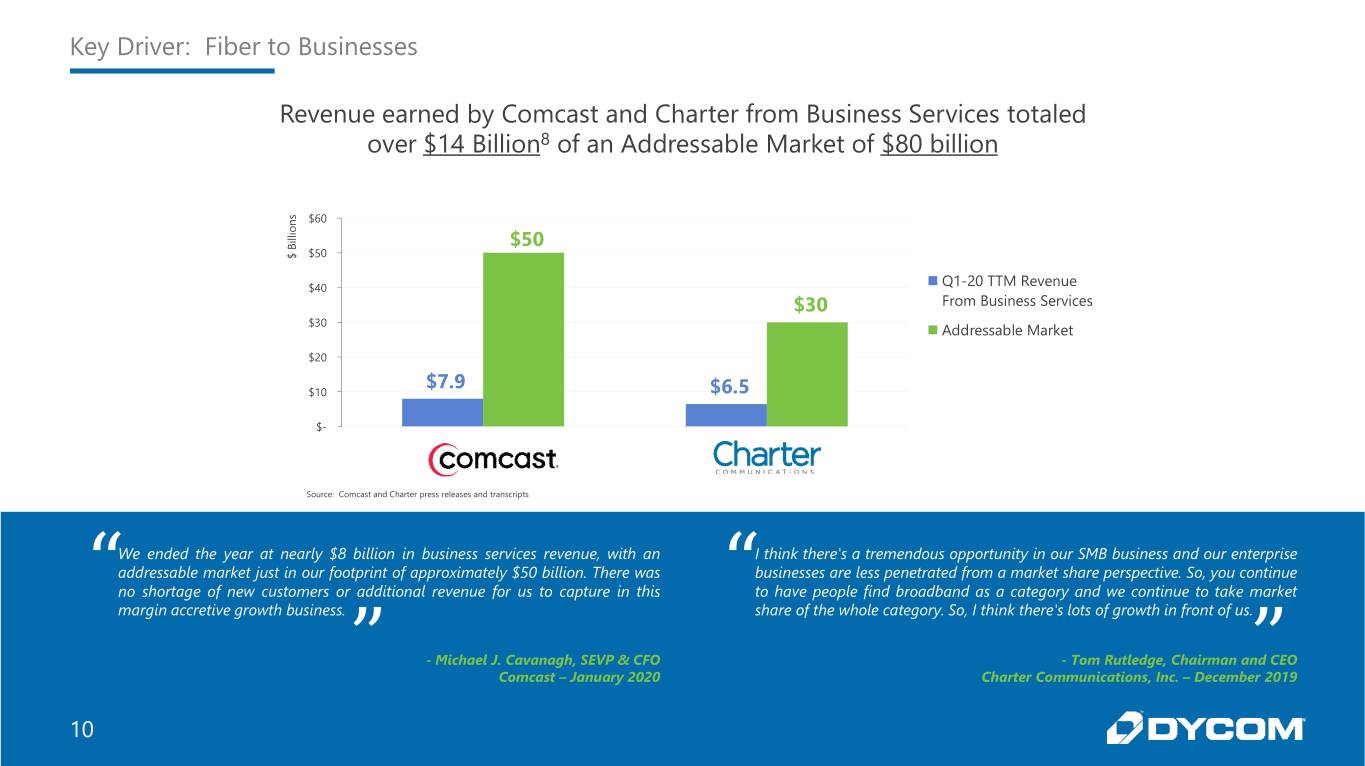
Key Driver: Fiber to Businesses Revenue earned by Comcast and Charter from Business Services totaled over $14 Billion8 of an Addressable Market of $80 billion s $60 n o i l l i B $50 $ $50 $40 Q1-20 TTM Revenue $30 From Business Services $30 Addressable Market $20 $7.9 $10 $6.5 $- Source: Comcast and Charter press releases and transcripts We ended the year at nearly $8 billion in business services revenue, with an I think there's a tremendous opportunity in our SMB business and our enterprise addressable market just in our footprint of approximately $50 billion. There was businesses are less penetrated from a market share perspective. So, you continue “ no shortage of new customers or additional revenue for us to capture in this “ to have people find broadband as a category and we continue to take market margin accretive growth business. share of the whole category. So, I think there's lots of growth in front of us. ” - Michael J. Cavanagh, SEVP & CFO - Tom Rutledge, Chairman and” CEO Comcast – January 2020 Charter Communications, Inc. – December 2019 10
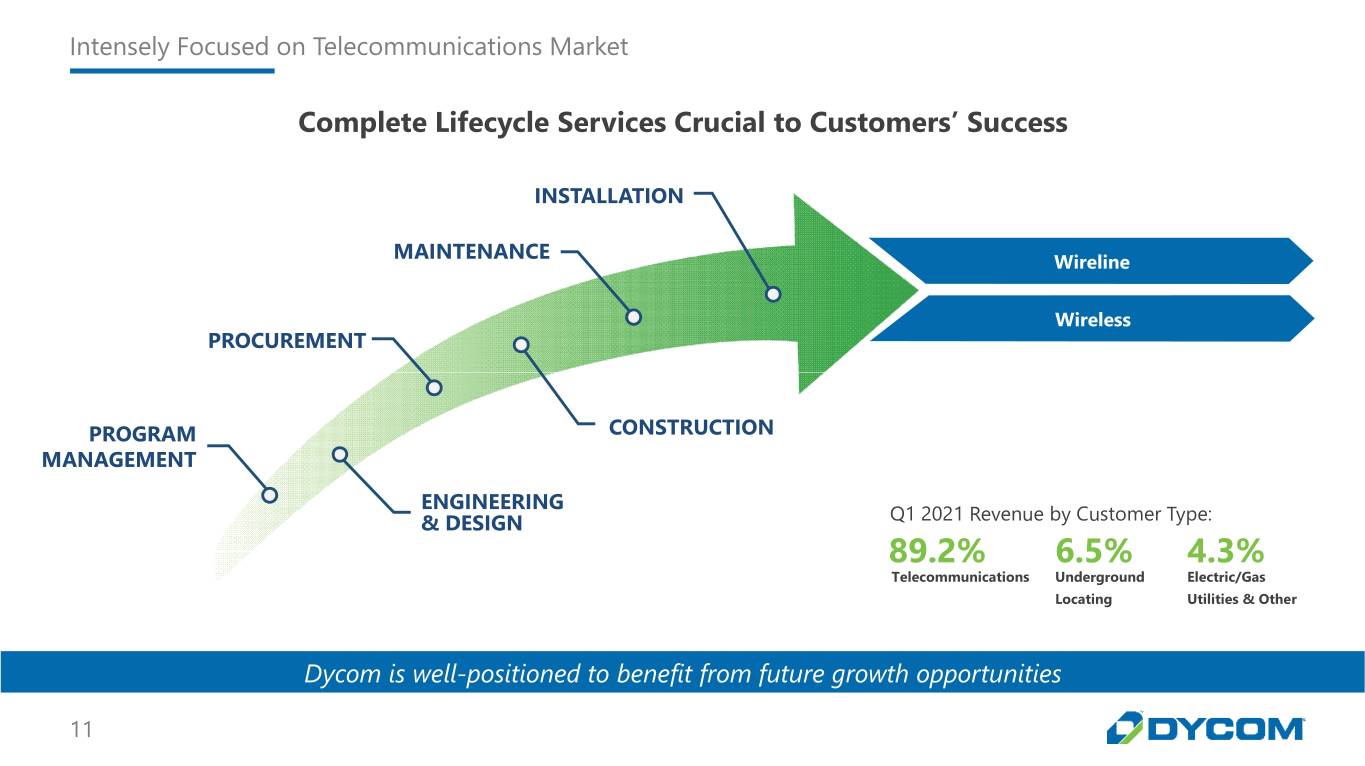
Intensely Focused on Telecommunications Market Complete Lifecycle Services Crucial to Customers’ Success INSTALLATION MAINTENANCE Wireline Wireless PROCUREMENT PROGRAM CONSTRUCTION MANAGEMENT ENGINEERING & DESIGN Q1 2021 Revenue by Customer Type: 89.2% 6.5% 4.3% Telecommunications Underground Electric/Gas Locating Utilities & Other Dycom is well-positioned to benefit from future growth opportunities 11
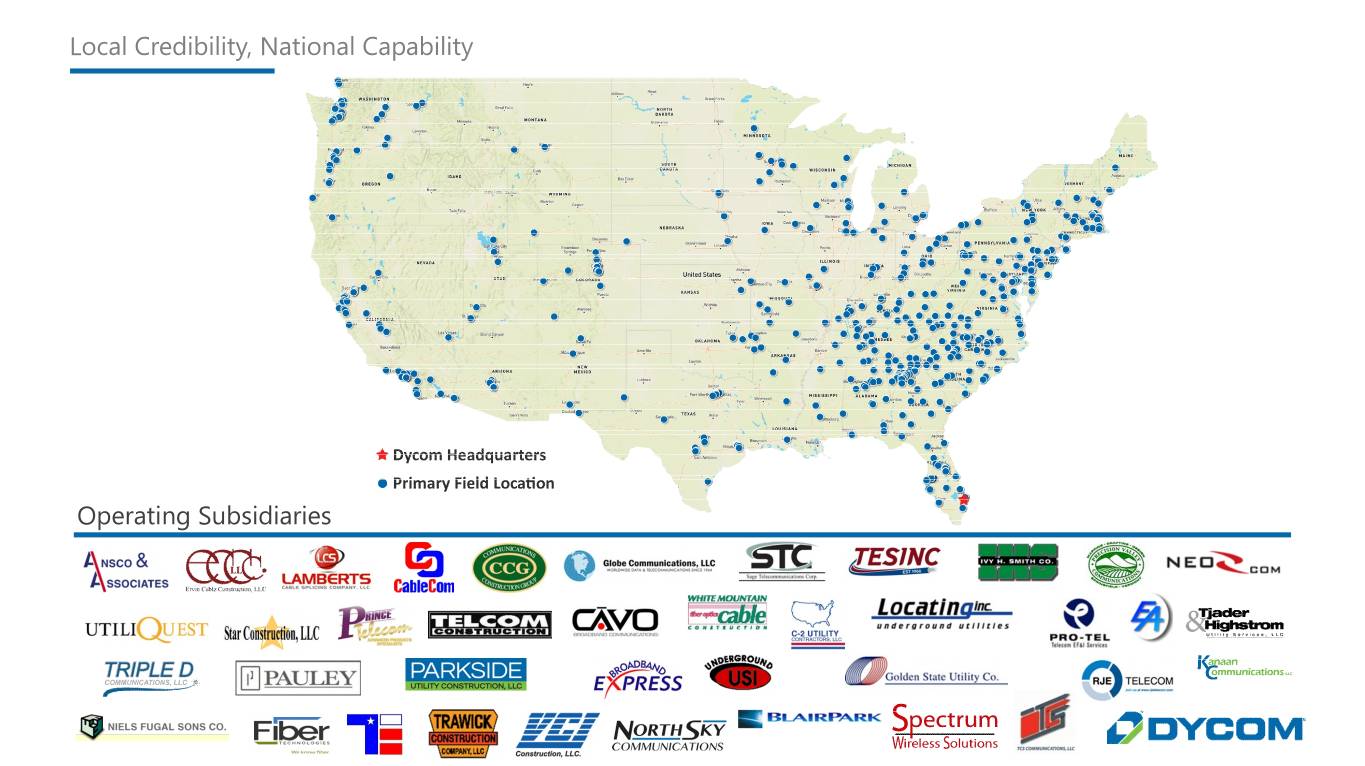
Local Credibility, National Capability Operating Subsidiaries
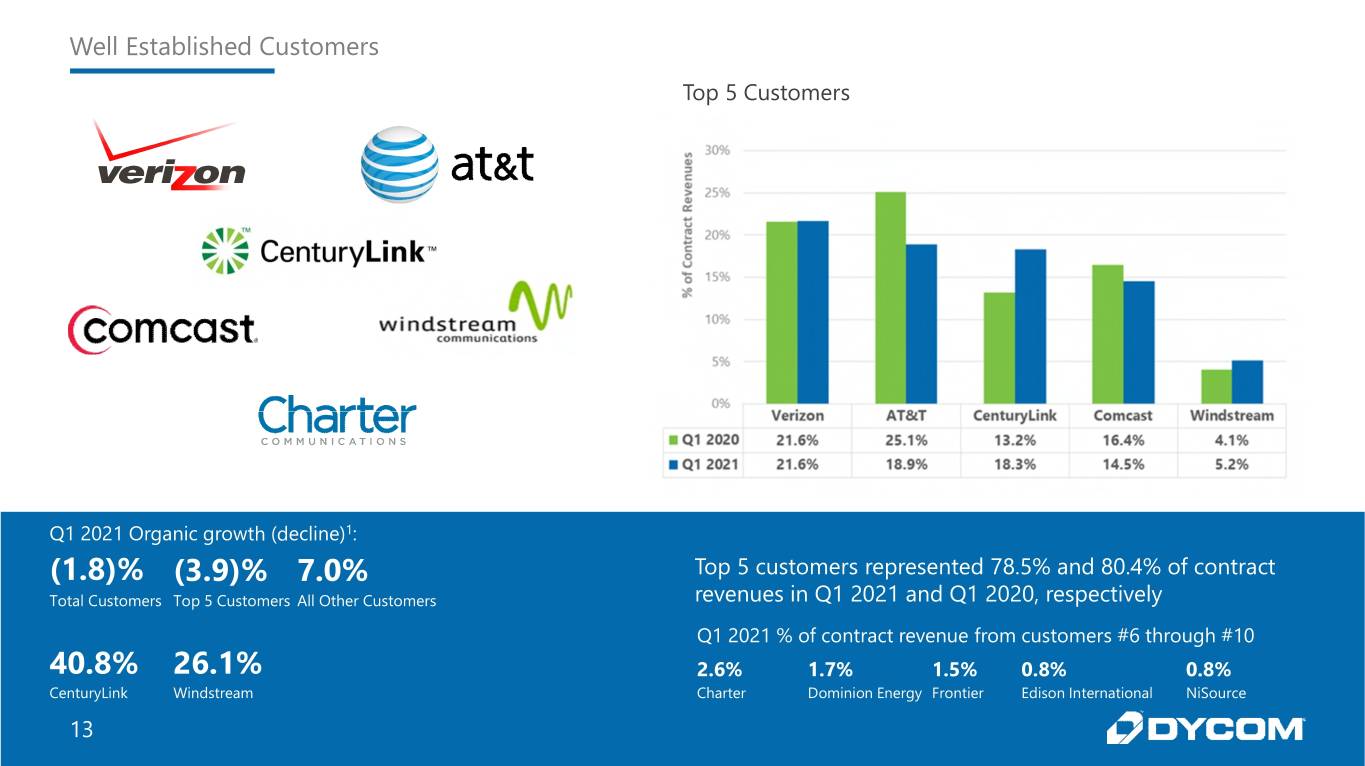
Well Established Customers Top 5 Customers Q1 2021 Organic growth (decline)1: (1.8)% (3.9)% 7.0% Top 5 customers represented 78.5% and 80.4% of contract Total Customers Top 5 Customers All Other Customers revenues in Q1 2021 and Q1 2020, respectively Q1 2021 % of contract revenue from customers #6 through #10 40.8% 26.1% 2.6% 1.7% 1.5% 0.8% 0.8% CenturyLink Windstream Charter Dominion Energy Frontier Edison International NiSource 13
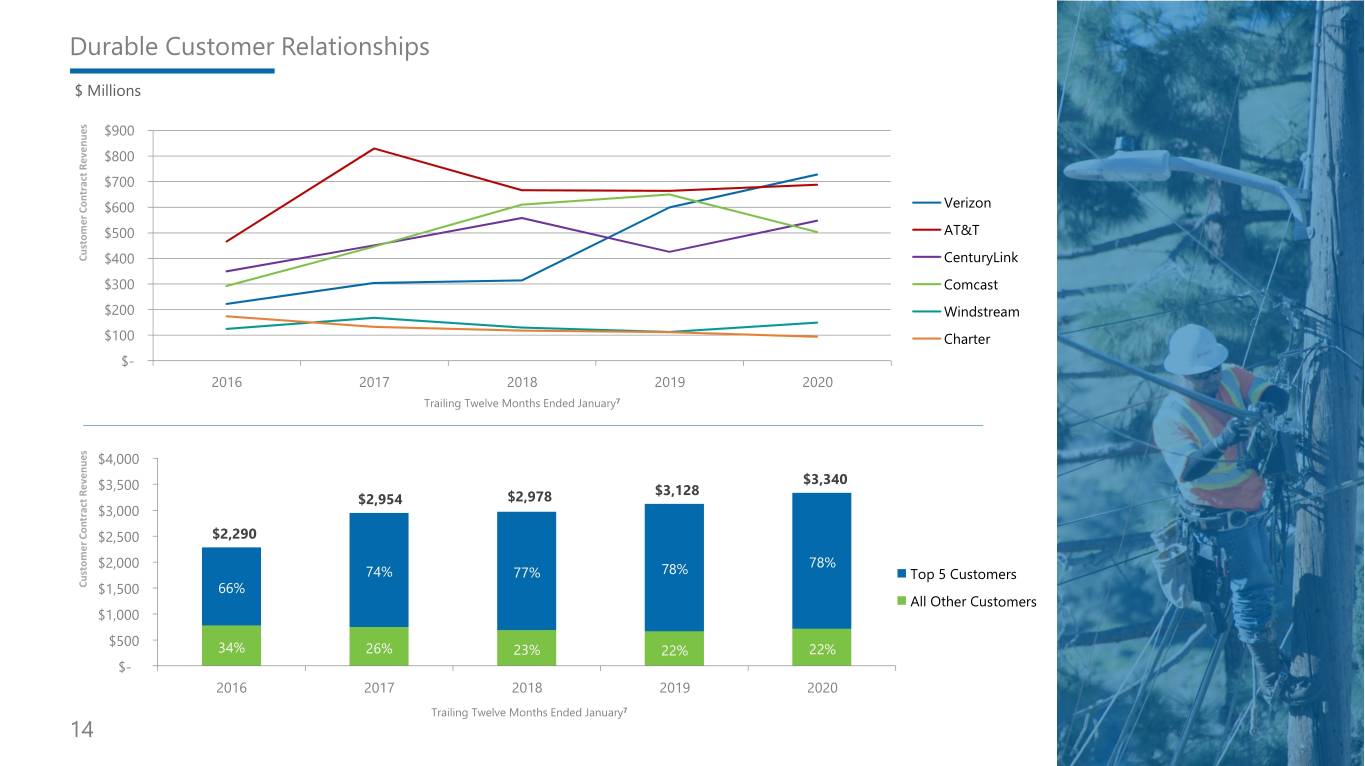
Durable Customer Relationships $ Millions s e $900 u n e v e $800 R t c a $700 r t n o Verizon C $600 r e m AT&T o $500 t s u C $400 CenturyLink $300 Comcast $200 Windstream $100 Charter $- 2016 2017 2018 2019 2020 Trailing Twelve Months Ended January7 s e u $4,000 n e v $3,340 e $3,500 R $3,128 t $2,978 c $2,954 a r $3,000 t n o C $2,500 $2,290 r e m o t $2,000 78% s 74% 77% 78% u Top 5 Customers C $1,500 66% All Other Customers $1,000 $500 34% 26% 23% 22% 22% $- 2016 2017 2018 2019 2020 Trailing Twelve Months Ended January7 14
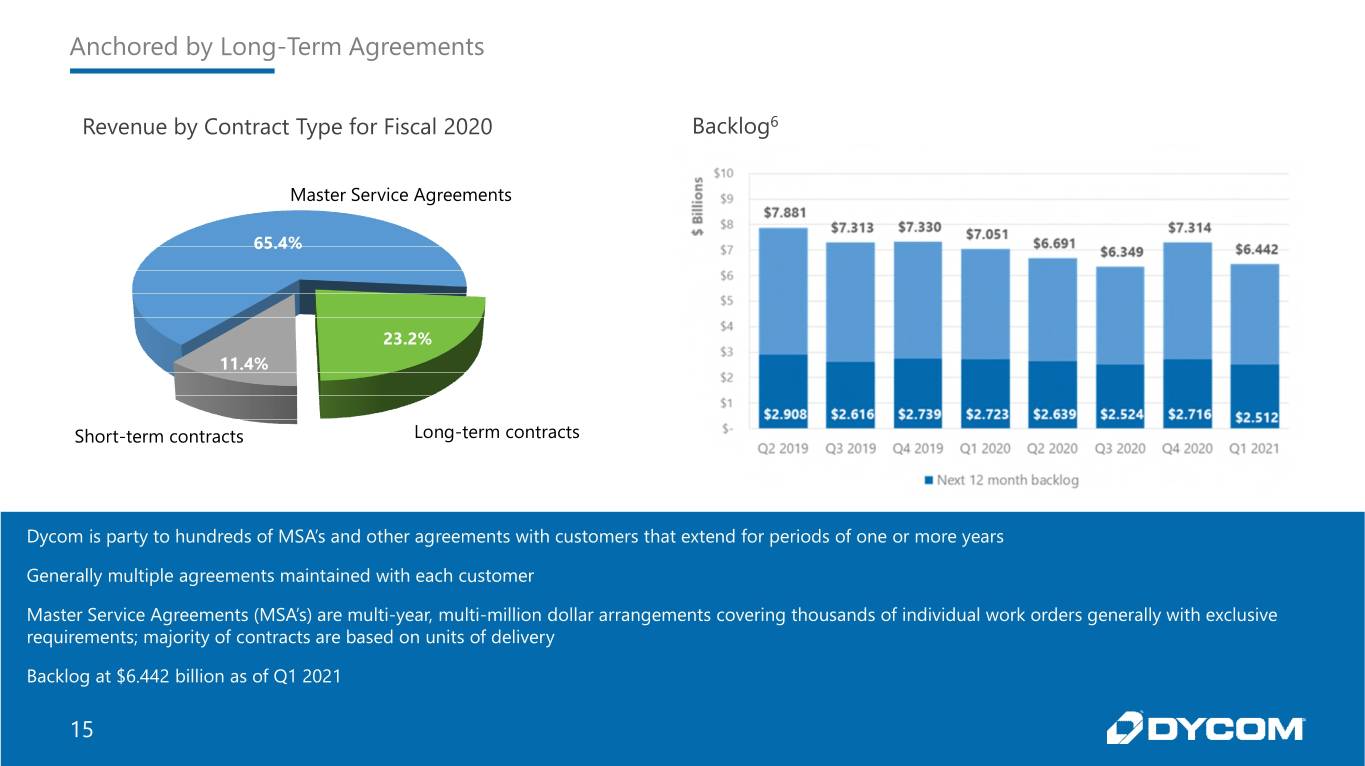
Anchored by Long-Term Agreements Revenue by Contract Type for Fiscal 2020 Backlog6 Master Service Agreements 65.4% 23.2% 11.4% Short-term contracts Long-term contracts Dycom is party to hundreds of MSA’s and other agreements with customers that extend for periods of one or more years Generally multiple agreements maintained with each customer Master Service Agreements (MSA’s) are multi-year, multi-million dollar arrangements covering thousands of individual work orders generally with exclusive requirements; majority of contracts are based on units of delivery Backlog at $6.442 billion as of Q1 2021 15
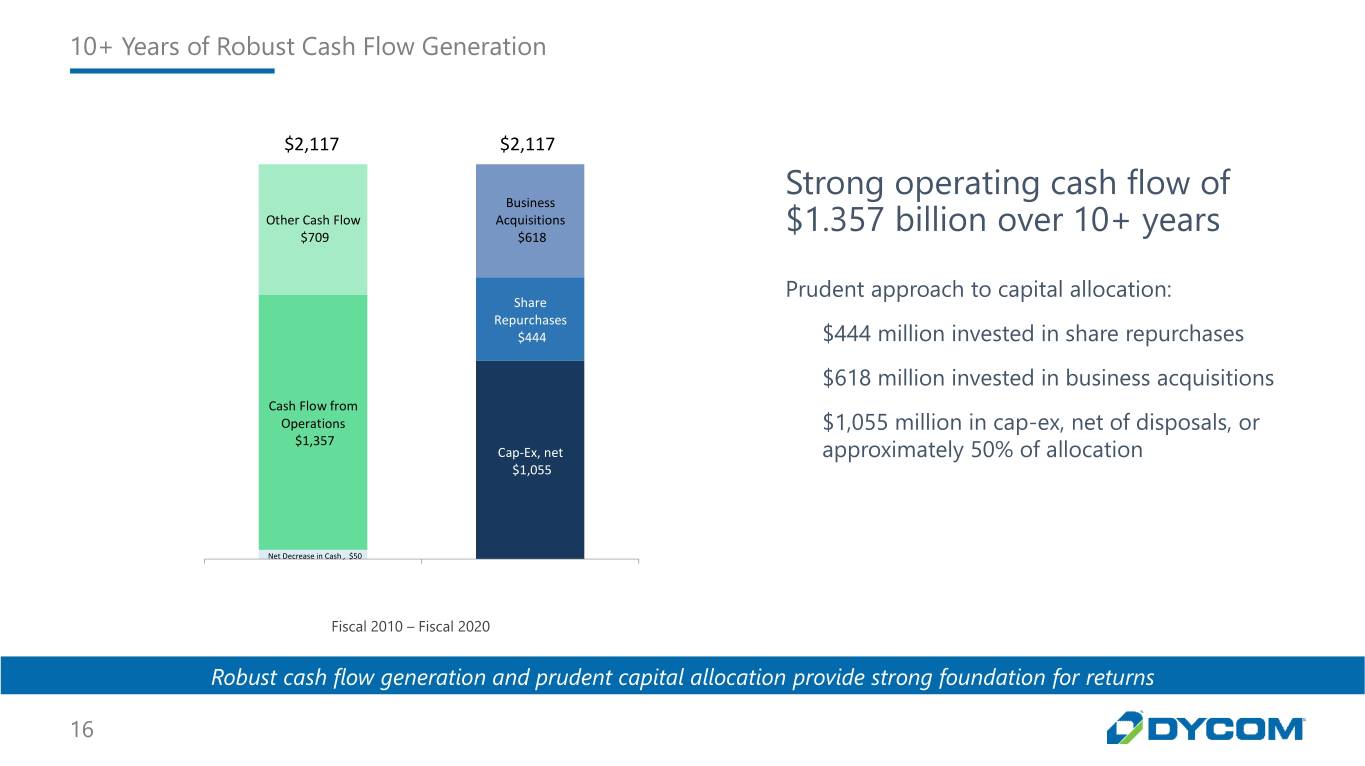
10+ Years of Robust Cash Flow Generation $2,117 $2,117 Strong operating cash flow of Business Other Cash Flow Acquisitions $709 $618 $1.357 billion over 10+ years Prudent approach to capital allocation: Share Repurchases $444 $444 million invested in share repurchases $618 million invested in business acquisitions Cash Flow from Operations $1,055 million in cap-ex, net of disposals, or $1,357 Cap-Ex, net approximately 50% of allocation $1,055 Net Decrease in Cash , $50 Fiscal 2010 – Fiscal 2020 Robust cash flow generation and prudent capital allocation provide strong foundation for returns 16

Financial Update
Financial Overview Strong market opportunities Contract revenues of $814.3 million for Q1 2021, compared to $833.7 million for Q1 2020 Non-GAAP Adjusted EBITDA for Q1 2021 of $69.9 million, or 8.6% of contract revenues, compared to $73.6 million, or 8.8% of contract revenues, for Q1 2020 Non-GAAP Adjusted Diluted Earnings per Common Share of $0.36 for Q1 2021 compared to $0.53 for Q1 2020 Solid financial profile Cash and equivalents of $644 million and outstanding revolver borrowings of $675 million at Q1 2021 Reduced net debt by $86.9 million during Q1 2021 Ample liquidity of $390.1 million at Q1 2021 18
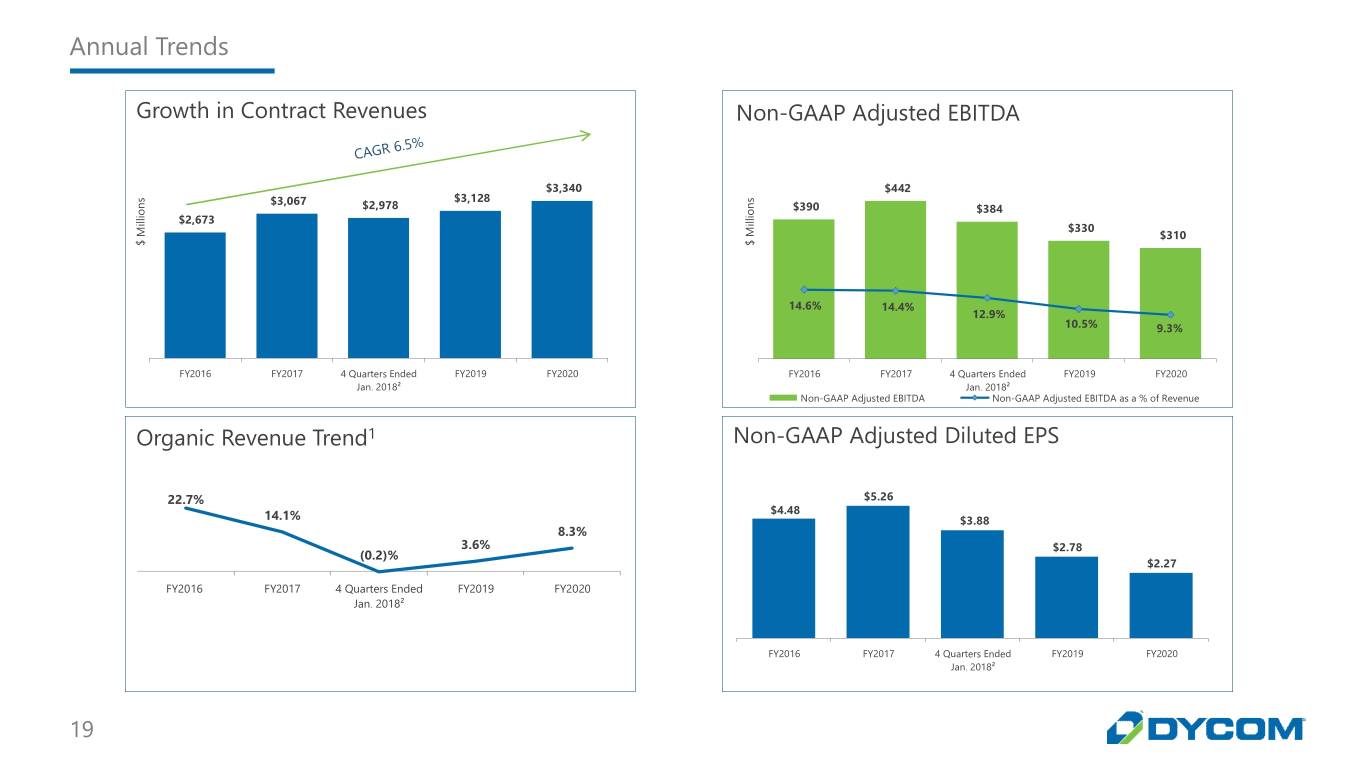
Annual Trends Growth in Contract Revenues Non-GAAP Adjusted EBITDA $3,340 $442 s $3,067 $3,128 s n $2,978 n $390 o o $384 i i l l l $2,673 l i i $330 M M $310 $ $ 14.6% 14.4% 12.9% 10.5% 9.3% FY2016 FY2017 4 Quarters Ended FY2019 FY2020 FY2016 FY2017 4 Quarters Ended FY2019 FY2020 Jan. 2018² Jan. 2018² Non-GAAP Adjusted EBITDA Non-GAAP Adjusted EBITDA as a % of Revenue Organic Revenue Trend1 Non-GAAP Adjusted Diluted EPS 22.7% $5.26 $4.48 14.1% $3.88 8.3% 3.6% $2.78 (0.2)% $2.27 FY2016 FY2017 4 Quarters Ended FY2019 FY2020 Jan. 2018² FY2016 FY2017 4 Quarters Ended FY2019 FY2020 Jan. 2018² 19
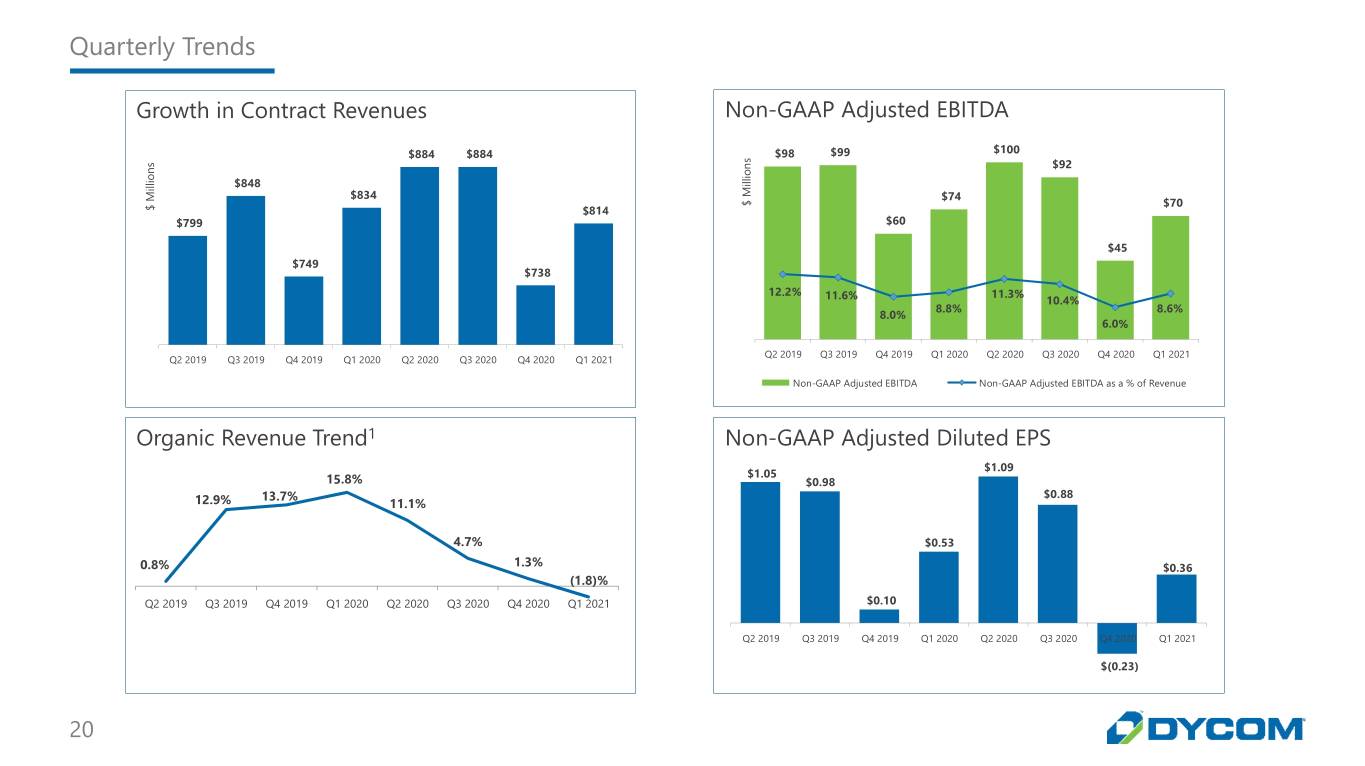
Quarterly Trends Growth in Contract Revenues Non-GAAP Adjusted EBITDA $884 $884 $98 $99 $100 s s n $92 n o i o l i l l i l $848 i M M $834 $74 $ $70 $ $814 $799 $60 $45 $749 $738 12.2% 11.3% 11.6% 10.4% 8.8% 8.6% 8.0% 6.0% Q2 2019 Q3 2019 Q4 2019 Q1 2020 Q2 2020 Q3 2020 Q4 2020 Q1 2021 Q2 2019 Q3 2019 Q4 2019 Q1 2020 Q2 2020 Q3 2020 Q4 2020 Q1 2021 Non-GAAP Adjusted EBITDA Non-GAAP Adjusted EBITDA as a % of Revenue Organic Revenue Trend1 Non-GAAP Adjusted Diluted EPS $1.09 $1.05 15.8% $0.98 13.7% $0.88 12.9% 11.1% 4.7% $0.53 0.8% 1.3% $0.36 (1.8)% Q2 2019 Q3 2019 Q4 2019 Q1 2020 Q2 2020 Q3 2020 Q4 2020 Q1 2021 $0.10 Q2 2019 Q3 2019 Q4 2019 Q1 2020 Q2 2020 Q3 2020 Q4 2020 Q1 2021 $(0.23) 20
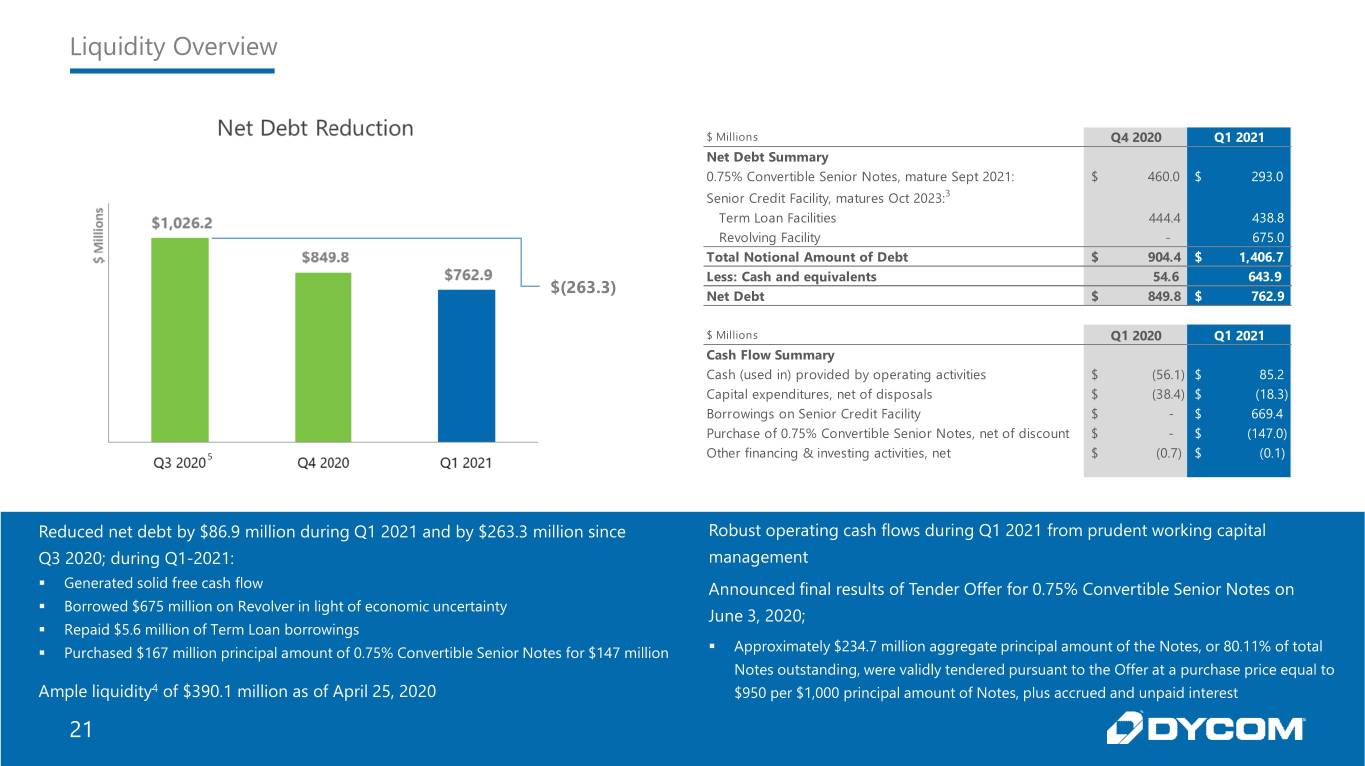
Liquidity Overview $ Millions Q4 2020 Q1 2021 Net Debt Summary 0.75% Convertible Senior Notes, mature Sept 2021: $ 460.0 $ 293.0 Senior Credit Facility, matures Oct 2023:3 Term Loan Facilities 444.4 438.8 Revolving Facility - 675.0 Total Notional Amount of Debt $ 904.4 $ 1,406.7 Less: Cash and equivalents 54.6 643.9 $(263.3) Net Debt $ 849.8 $ 762.9 $ Millions Q1 2020 Q1 2021 Cash Flow Summary Cash (used in) provided by operating activities $ (56.1) $ 85.2 Capital expenditures, net of disposals $ (38.4) $ (18.3) Borrowings on Senior Credit Facility $ - $ 669.4 Purchase of 0.75% Convertible Senior Notes, net of discount $ - $ (147.0) 5 Other financing & investing activities, net $ (0.7) $ (0.1) Reduced net debt by $86.9 million during Q1 2021 and by $263.3 million since Robust operating cash flows during Q1 2021 from prudent working capital Q3 2020; during Q1-2021: management . Generated solid free cash flow Announced final results of Tender Offer for 0.75% Convertible Senior Notes on . Borrowed $675 million on Revolver in light of economic uncertainty June 3, 2020; . Repaid $5.6 million of Term Loan borrowings . Purchased $167 million principal amount of 0.75% Convertible Senior Notes for $147 million . Approximately $234.7 million aggregate principal amount of the Notes, or 80.11% of total Notes outstanding, were validly tendered pursuant to the Offer at a purchase price equal to Ample liquidity4 of $390.1 million as of April 25, 2020 $950 per $1,000 principal amount of Notes, plus accrued and unpaid interest 21
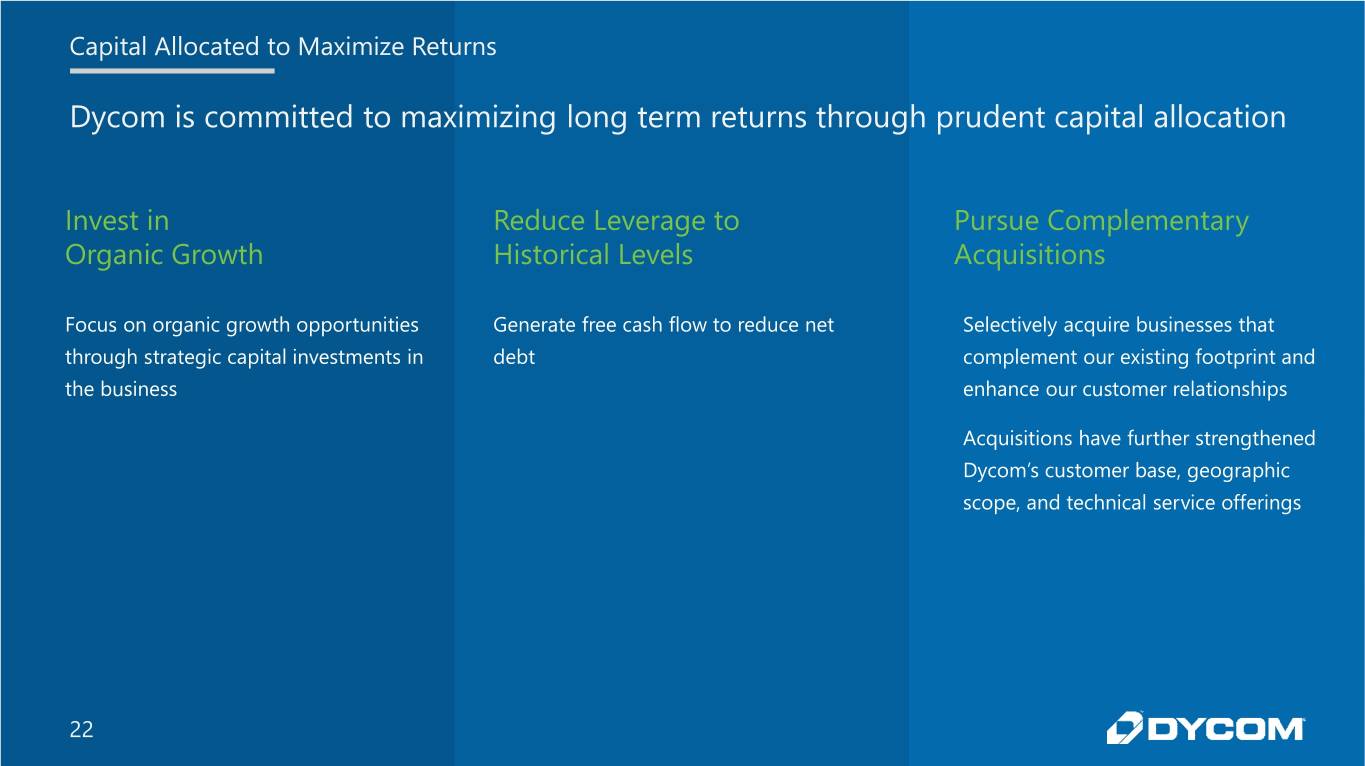
Capital Allocated to Maximize Returns Dycom is committed to maximizing long term returns through prudent capital allocation Invest in Reduce Leverage to Pursue Complementary Organic Growth Historical Levels Acquisitions Focus on organic growth opportunities Generate free cash flow to reduce net Selectively acquire businesses that through strategic capital investments in debt complement our existing footprint and the business enhance our customer relationships Acquisitions have further strengthened Dycom’s customer base, geographic scope, and technical service offerings 22

Questions and Answers 23

Selected Information from Q1 2021 Dycom Results Conference Call Materials The following slide, 24, was used on May 19, 2020 in connection with the Company’s conference call for its fiscal 2021 first quarter results and is included for your convenience. Reference is made to slide 2 titled “Important Information” with respect to these slides. The information and statements contained in slide 24 that are forward-looking are based on information that was available at the time the slide was initially prepared and/or management’s good faith belief at that time with respect to future events. Except as required by law, the Company may not update forward-looking statements even though its situation may change in the future. For a full copy of the conference call materials, including the conference call transcript, see the Company’s Form 8-Ks filed with the Securities and Exchange Commission on May 19, 2020.
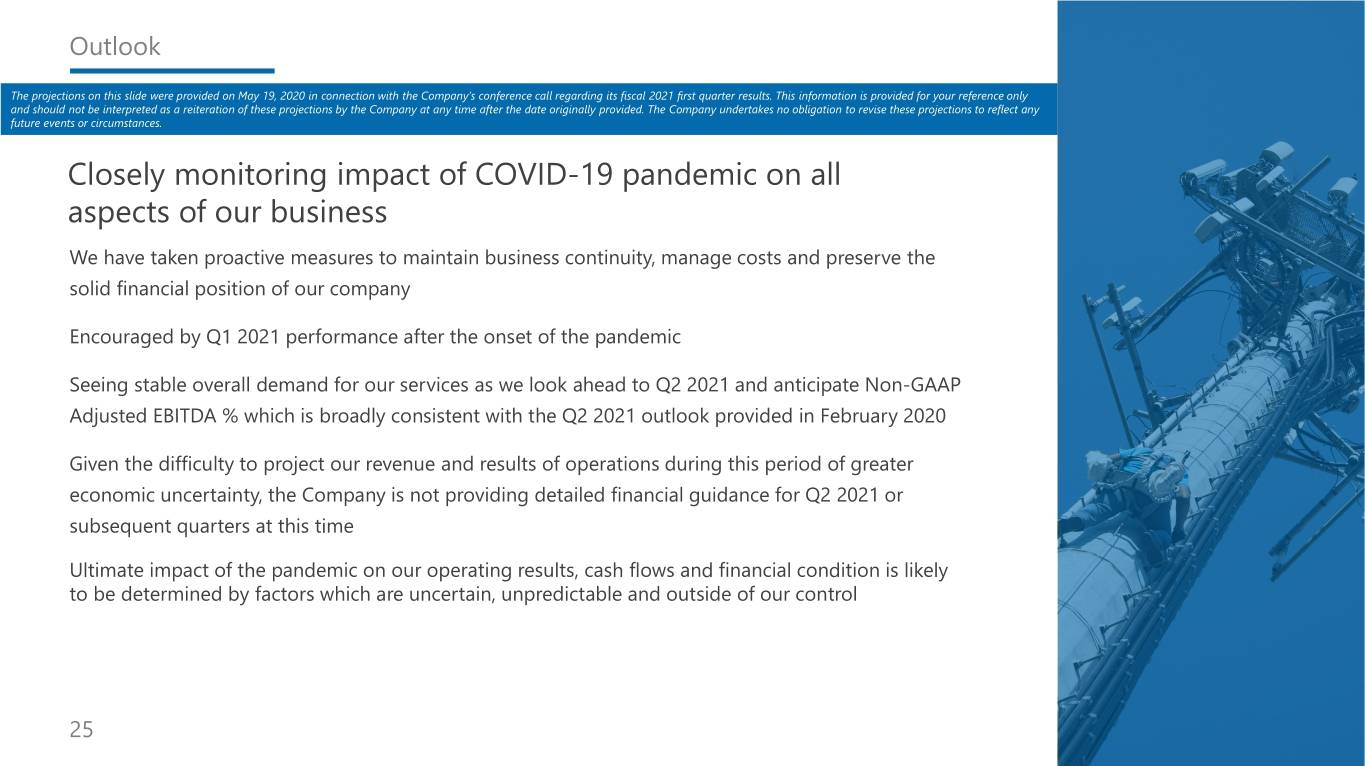
Outlook The projections on this slide were provided on May 19, 2020 in connection with the Company’s conference call regarding its fiscal 2021 first quarter results. This information is provided for your reference only and should not be interpreted as a reiteration of these projections by the Company at any time after the date originally provided. The Company undertakes no obligation to revise these projections to reflect any future events or circumstances. Closely monitoring impact of COVID-19 pandemic on all aspects of our business We have taken proactive measures to maintain business continuity, manage costs and preserve the solid financial position of our company Encouraged by Q1 2021 performance after the onset of the pandemic Seeing stable overall demand for our services as we look ahead to Q2 2021 and anticipate Non-GAAP Adjusted EBITDA % which is broadly consistent with the Q2 2021 outlook provided in February 2020 Given the difficulty to project our revenue and results of operations during this period of greater economic uncertainty, the Company is not providing detailed financial guidance for Q2 2021 or subsequent quarters at this time Ultimate impact of the pandemic on our operating results, cash flows and financial condition is likely to be determined by factors which are uncertain, unpredictable and outside of our control 25
Notes 1) Organic growth (decline) % adjusted for revenues from acquired businesses and storm restoration services, when applicable. 2) Due to the change in the Company’s fiscal year end, the Company’s fiscal 2018 six month transition period consisted of Q1 2018 and Q2 2018. Amounts provided for the 4 Quarters Ended Jan. 2018 represent the aggregate of Q3 2017, Q4 2017, Q1 2018 and Q2 2018 for comparative purposes to other twelve month periods presented. 3) As of April 25, 2020 and January 25, 2020, the Company had $52.2 million and $52.3 million, respectively, of standby letters of credit outstanding under the Senior Credit Facility. The Senior Credit Facility matures in October 2023. 4) As of both April 25, 2020 and January 25, 2020, Liquidity represents the sum of the Company’s availability on its revolving facility, including the incremental amount of eligible cash and equivalents above $50 million as permitted by the Company’s Senior Credit Facility and other available cash and equivalents. 5) Net debt as of Q3 2020 consisted of $485.0 million 0.75% Convertible Senior Notes due September 2021, $450.0 million Term Loan Facilities and $103.0 million Revolving Facility, offset by $11.8 million in cash and equivalents. 6) Our backlog represents an estimate of services to be performed pursuant to master service agreements and other contractual agreements over the terms of those contracts. These estimates are based on contract terms and evaluations regarding the timing of the services to be provided. In the case of master service agreements, backlog is estimated based on the work performed in the preceding twelve-month period, when available. When estimating backlog for newly initiated master service agreements and other long and short-term contracts, we also consider the anticipated scope of the contract and information received from the customer in the procurement process. A significant majority of our backlog comprises services under master service agreements and other long-term contracts. Backlog is not a measure defined by United States generally accepted accounting principles; however, it is a common measurement used in our industry. Our methodology for determining backlog may not be comparable to the methodologies used by others. 7) Due to the change in the Company’s fiscal year end, the Company’s fiscal 2018 six month transition period consisted of Q1 2018 and Q2 2018. For comparative purposes all amounts provided are for 4 Quarters Ended January. 8) For the trailing twelve months (“TTM”) ended March 30, 2020. 26
