Attached files
| file | filename |
|---|---|
| EX-32.2.1 - EX-32.2.1 - TESSCO TECHNOLOGIES INC | tess-20200329ex32217688e.htm |
| EX-32.1.1 - EX-32.1.1 - TESSCO TECHNOLOGIES INC | tess-20200329ex3211a061e.htm |
| EX-31.2.1 - EX-31.2.1 - TESSCO TECHNOLOGIES INC | tess-20200329ex3121589fa.htm |
| EX-31.1.1 - EX-31.1.1 - TESSCO TECHNOLOGIES INC | tess-20200329ex3111c4b26.htm |
| EX-23.1.1 - EX-23.1.1 - TESSCO TECHNOLOGIES INC | tess-20200329ex2311f6a5c.htm |
| EX-21.1.1 - EX-21.1.1 - TESSCO TECHNOLOGIES INC | tess-20200329ex21117134e.htm |
| EX-10.7.4 - EX-10.7.4 - TESSCO TECHNOLOGIES INC | tess-20200329ex10741517f.htm |
| EX-10.3.6 - EX-10.3.6 - TESSCO TECHNOLOGIES INC | tess-20200329ex103687176.htm |
| EX-10.3.5 - EX-10.3.5 - TESSCO TECHNOLOGIES INC | tess-20200329ex1035e00dd.htm |
| EX-10.3.4 - EX-10.3.4 - TESSCO TECHNOLOGIES INC | tess-20200329ex10340dd42.htm |
| EX-10.3.3 - EX-10.3.3 - TESSCO TECHNOLOGIES INC | tess-20200329ex103348edb.htm |
| EX-10.3.2 - EX-10.3.2 - TESSCO TECHNOLOGIES INC | tess-20200329ex1032d5f97.htm |
| EX-4.1.1 - EX-4.1.1 - TESSCO TECHNOLOGIES INC | tess-20200329ex411abb3b5.htm |
UNITED STATES SECURITIES AND EXCHANGE COMMISSION
Washington, D.C. 20549
FORM 10-K
|
☒ |
ANNUAL REPORT PURSUANT TO SECTION 13 OR 15(d) OF THE SECURITIES EXCHANGE ACT OF 1934 FOR THE FISCAL YEAR ENDED March 29, 2020 |
|
☐ |
TRANSITION REPORT PURSUANT TO SECTION 13 OR 15(d) OF THE SECURITIES EXCHANGE ACT OF 1934 FOR THE TRANSITION PERIOD FROM ______ TO ______ |
Commission file number 001-33938

TESSCO Technologies Incorporated
(Exact name of registrant as specified in its charter)
|
DELAWARE |
52-0729657 |
|
(State or other jurisdiction of |
(I.R.S. Employer |
|
incorporation or organization) |
Identification No.) |
|
|
|
|
11126 McCormick Road, Hunt Valley, Maryland |
21031 |
|
(Address of principal executive offices) |
(Zip Code) |
|
|
|
|
Registrant’s telephone number, including area code (410) 229-1000 |
|
|
|
|
|
Securities registered pursuant to Section 12(b) of the Act: |
|
|
|
|
|
Title of each class: |
|
Trading Symbol |
|
Name of each exchange on which registered: |
|
Common Stock, $0.01 par value |
|
TESS |
|
Nasdaq Global Select Market |
|
|
|
|
Securities registered pursuant to Section 12(g) of the Act: |
|
|
|
|
|
None |
|
Indicate by check mark if the registrant is a well-known seasoned issuer (as defined in Rule 405 of the Act). Yes ☐ No ☒
Indicate by check mark if the registrant is not required to file reports pursuant to Section 13 or 15(d) of the Act. Yes ☐ No ☒
Indicate by check mark whether the registrant (1) has filed all reports required to be filed by Section 13 or 15(d) of the Securities Exchange Act of 1934 during the preceding 12 months (or for such shorter period that the registrant was required to file such reports), and (2) has been subject to such filing requirements for the past 90 days.
Yes ☒ No ☐
Indicate by check mark whether the registrant has submitted electronically every Interactive Data File required to be submitted pursuant to Rule 405 of Regulation S-T (§232.405 of this chapter) during the preceding 12 months (or for such shorter period that the registrant was required to submit such files). Yes ☒ No ☐
Indicate by check mark whether the registrant is a large accelerated filer, an accelerated filer, a non-accelerated filer, smaller reporting company, or an emerging growth company. See the definitions of “large accelerated filer,” “accelerated filer,” “smaller reporting company,” and “emerging growth company” in Rule 12b-2 of the Exchange Act.
Large accelerated filer ☐ Accelerated filer ☒ Non-accelerated filer ☐ (Do not check if a smaller reporting company)
Smaller reporting company ☒ Emerging growth company ☐
If an emerging growth company, indicate by check mark if the registrant has elected not to use the extended transition period for complying with any new or revised financial accounting standards provided pursuant to Section 13(a) of the Exchange Act. ☐
Indicate by check mark whether the registrant has filed a report on and attestation to its management’s assessment of the effectiveness of its internal control over financial reporting under Section 404(b) of the Sarbanes-Oxley Act (15 U.S.C. 7262(b)) by the registered public accounting firm that prepared or issued its audit report. Yes ☒ No ☐
Indicate by check mark whether the registrant is a shell company (as defined in Rule 12b-2 of the Exchange Act). Yes ☐ No ☒
The aggregate market value of Common Stock, $0.01 par value, held by non-affiliates of the registrant based on the closing sales price of the Common Stock as quoted on the Nasdaq Global Market as of September 29, 2019, was $93,599,964.
The number of shares of the registrant's Common Stock, $0.01 par value, outstanding as of May 29, 2020, was 8,641,700.
DOCUMENTS INCORPORATED BY REFERENCE: Portions of the definitive Proxy Statement for the registrant’s 2020 Annual Meeting of Shareholders, scheduled to be held July 24, 2020, are incorporated by reference into Part III of this Annual Report on Form 10-K.
2
General
TESSCO Technologies Incorporated (which we sometimes refer to as “Tessco”, “we”, or the “Company”) is a value-added technology distributor, manufacturer, and solutions provider serving commercial and retail customers in the wireless infrastructure and mobile device accessories markets. The Company was founded more than 35 years ago with a commitment to deliver industry-leading products, knowledge, solutions, and customer service. Tessco supplies over 46,000 products from more than 350 of the industry’s top manufacturers in mobile communications, Wi-Fi, Internet of Things, wireless backhaul, and more. Tessco is a single source for outstanding customer experience, expert knowledge, and complete end-to-end solutions for the wireless industry.
Our customers include a diversified mix of carrier and public network operators, tower owners, program managers, contractors, integrators, private system operators (including railroads, utilities, mining operators and oil and gas operators), federal, state and local governments, manufacturers, value-added resellers, retail carrier stores and their independent agents, as well as other local and national retailers. We currently serve an average of approximately 8,500 different customers per month.
We provide our customers with products, services, and solutions to help them support these primary applications:
|
· |
Broadband |
|
· |
DAS for In-Building Cellular and Public Safety Coverage |
|
· |
First Responder Communications and FirstNet™ |
|
· |
IoT (Internet of Things) |
|
· |
Microwave |
|
· |
Power Systems |
|
· |
Small Cell and Macro Cell Wireless Base Station Infrastructure |
|
· |
In-Vehicle and Mobile Communications |
|
· |
Wi-Fi Networks |
|
· |
Test and Maintenance |
|
· |
Wireless Backhaul |
|
· |
Mobile Devices and Accessories |
We source and develop our product offerings from leading manufacturers throughout the world, and also offer innovative, high quality products developed and manufactured under our own proprietary brand, Ventev®.
Our operational platform removes complexity for customers and suppliers by streamlining the management of the supply chain and lowering total inventory and cost by providing guaranteed availability and complete, on-time delivery to the point of use.
We began our “total source” operations in 1982, reincorporated as a Delaware corporation in 1987, and have been listed on the Nasdaq Market (currently, Nasdaq Global Select) (symbol: TESS), since 1994. We operate under ISO 9001:2015 and TL 9000:2016 R (6) registrations.
For information regarding our website address and regarding material available free of charge through the website, see the information appearing under the heading “Available Information” included in Item 7 to this Annual Report on Form 10-K for the fiscal year ended March 29, 2020.
3
Customers
The Company evaluates its business within two segments: commercial and retail. The commercial segment consists of the following two markets: (1) public carriers that are generally responsible for building and maintaining the infrastructure system and provide airtime service to individual subscribers; and (2) value-added resellers and integrators, which includes value-added resellers, the government channel and private system operator markets. The retail segment includes retailers, independent dealer agents and carriers. Retail inventory typically has a shorter more defined life cycle and is, typically, ultimately used by individual end users. Commercial inventory typically has a life cycle that tends to be tied to changes in regulation or technology and includes products typically used by business entities or governments.
Sales to the public carrier market accounted for approximately 29% of our fiscal year 2020 revenues, sales to the value-added resellers and integrator market accounted for 47% of fiscal year 2020 revenues, and sales to our retail market accounted for 24% of fiscal year 2020 revenues. These percentages reflect a significant fiscal year 2020 shift in revenue toward the two Commercial Segment markets offset by a reduction in the Retail Segment.
Our top ten customer relationships totaled 31% of our total revenue for fiscal year 2020, and revenue from our largest customer accounted for 11% of our total revenues.
Approximately 96% of our sales have been made to customers in the United States during each of the past three fiscal years, although we currently sell to customers in almost 100 countries. Due to our diverse product offering and our wide customer base, our business is not significantly affected by seasonality in the aggregate. However, sales to our retailers generally peak in conjunction with significant handset launches and the winter holiday season and decline significantly in our fourth fiscal quarter. Also, our base station infrastructure sales could be affected by weather conditions in the United States, especially in our fourth fiscal quarter.
Products and Services
We principally offer competitively priced, manufacturer branded products, ranging from simple hardware items to sophisticated test equipment, with per item prices ranging from less than $1 to over $50,000 and gross profit margins ranging from less than 5% to 99%. We offer products classified into the following four categories: base station infrastructure; network systems; installation, test and maintenance products; and mobile devices and accessories, which accounted for approximately 53%, 16%, 5%, and 26% of fiscal year 2020 revenues, respectively.
Base station infrastructure products are used to build, repair and upgrade wireless broadband systems. These products include base station antennas, cable and transmission lines, small towers, lightning protection devices, connectors, power systems, enclosures, grounding, jumpers, miscellaneous hardware, and mobile antennas. Network systems products include fixed and mobile broadband radio equipment, wireless networking filtering systems, distributed antenna systems, two-way radios and security and surveillance products. Installation, test and maintenance products are used to install, tune, and maintain wireless communications equipment. Products include sophisticated analysis equipment and various frequency-, voltage- and power-measuring devices, as well as an assortment of tools, hardware, GPS, safety, replacement and component parts and supplies required by service technicians. Mobile devices and accessory products include cellular, smart phone and data device accessories such as power supplies, cases, screen protectors, speakers, mobile amplifiers, bluetooth and corded headsets, mounts, car antennas, music accessories and data and memory cards.
While we principally provide manufacturer branded products, a variety of products are developed, manufactured and offered under Tessco-owned brand, Ventev. These products generally consist of mobile device accessory power solutions and network infrastructure products, such as radio enclosures, cable and antennas. Sales of these products were 11% of our total sales in fiscal year 2020. This percentage reflects a significant reduction in sale of mobile device accessories in fiscal year 2020 as a result of a decline in overall retail sales. Sales of mobile device accessories were significantly lower in the fourth quarter of fiscal year 2020, due to the impact of the coronavirus (COVID-19) pandemic on the retail market.
4
Tessco’s Technical Services and Solutions Development team is a key element of our offerings as a value-added distributor. This team includes Sales Engineering, Solution Architects, System Designers and Customer Technical Support (“CTS”). The broad product and supplier knowledge along with the multiple supplier certifications have also been recognized as a great benefit by our supplier partners and customers. The Sales Engineers provide regional coverage supporting Tessco’s customers on the total Solution portfolio. Solution Architects are specialists in their area of expertise providing consultation and system design. The CTS team are product level experts ensuring the correct devices are specified based on the application. This team can also recommend additional ancillary products (antennas, cables, power, enclosures, etc.) needed to provide a complete solution for the customer’s application.
These teams provide customer support on thousands of calls and thousands of support ticket-items per year. They have completed designs covering solutions for DAS (Distributed Antenna Systems), IOT (Internet of Things), WiFi, Networking, Wireless Broadband, Power Systems and Test Systems. These solutions teams support both existing and emerging markets, including Smart Cities, Smart Buildings, Small Cell, FirstNet, Utilities, Transportation, Network Service Providers (NSP) and fortune 500 companies.
As part of our commitment to customer service, we typically allow most customers to return most products for any reason, for credit, within 30 days of the date of purchase. Total returns and credits have been less than 3% of revenues in each of the past three fiscal years.
Revenues from sales of products purchased from our largest wireless infrastructure and mobile device and accessories suppliers accounted for 23% and 7%, respectively, of total fiscal year 2020 revenues. Sales of products purchased from our ten largest suppliers generated approximately 50% of our total fiscal year 2020 revenues.
The amount of purchases we make from each of our approximately 350 suppliers may significantly increase or decrease over time. As the level of business changes, we may request, or be requested by our suppliers, to adjust the terms of our relationships. Therefore, our ability to purchase and re-sell products from each of our suppliers depends on being able to reach and maintain agreements with these suppliers on acceptable business terms. In addition, the agreements and arrangements on which most of our larger supplier relationships are based are typically of limited duration and terminable for any or no reason by either party upon notice of varying lengths, usually between several months or otherwise short notice. Generally, we believe that alternative sources of supply are available for many of the product types we carry, although we may be unable, or find it more difficult, to source branded products from other than the manufacturer.
The scope of products available for purchase from a given supplier may fluctuate and is generally limited only by the scope of the supplier’s catalog and available inventory. Therefore, we may source the same product type from multiple suppliers, although in some instances branded products are available only from the manufacturer or a particular supplier, and in some instances, customers might favor one supplier or brand over another. The terms of the supplier contract typically apply to all products purchased from a particular supplier, whether or not the item is specifically identified in the contract.
When negotiating with suppliers, we seek the most favorable terms available under the circumstances. Our preferred terms include among others, terms that provide for product warranty and return rights, as well as product liability and intellectual property indemnification rights, in each case consistent with our preferred business methods and objectives. We have not been able, nor do we expect in the future to be able, to negotiate the inclusion of all our preferred terms, or our preferred language for those terms, in every supplier contract. The degree of our success in this regard is largely a function of the parties’ relative bargaining positions.
We are dedicated to superior performance, quality and consistency of service in an effort to maintain and expand supplier relationships but there can be no assurance that we will continue to be successful in this regard in the future, or that competitive pressures or other events beyond our control will not have a negative impact on our ability to maintain these relationships or to continue to derive revenues from these relationships.
5
Method of Operation
We believe that we have developed a highly integrated, technologically advanced and efficient method of operation based on the following key tenets:
|
· |
Understanding and anticipating customers' needs and building solutions by cultivating lasting relationships; |
|
· |
Providing customers with sales, service and technical support, 24 hours a day, 7 days a week, 365 days a year; |
|
· |
Providing customers what they need, when and where they need it by delivering integrated product and supply chain solutions; and |
|
· |
Helping customers enhance their operations by providing real-time order tracking and performance measurement. |
Market Development and Sales: In order to meet the needs of a dynamic and diverse marketplace, our sales and marketing activities are focused on our customers across three broad markets: 1) public carriers 2) value-added resellers and integrators, and 3) retailers. This organization allows for the development of unique product and solution offerings to meet the needs of our diverse customer base.
We understand and anticipate our customers’ needs, resulting in comprehensive solutions and long-lasting relationships. Our customer base includes more than 195,000 fully opted in contacts across the full breadth of the wireless industry, with over 250,000 additional active contacts in our database, representing potential new customers. We are able to identify each contact’s unique need for information and the way in which they wish to receive it. This can include targeted marketing materials, including email marketing, web marketing, advertisements, direct mailers, and trade show marketing, to drive purchases and new business development. For instance, our email publication The Wireless Update® is sent to a targeted list of 108,000 contacts each week.
Our dedicated sales team provides customer service and maintains key information about every customer or potential customer utilizing our Customer Relationship Management (CRM) and marketing automation tools ensuring a positive experience at every interaction and allowing us to identify promising leads and allocate resources to convert them to customers. We serve approximately 8,500 customers each month and our goal is to create an experience that nurtures loyalty among our customers and delivers mutually beneficial outcomes in every transaction.
6
Solutions Development and Engineering and Product Management: We actively monitor advances in technologies and industry trends, through both market research and continual customer and manufacturer interaction to enhance our product offering as new wireless communications products and technologies are developed. To complement our broad product portfolio, we provide technical expertise and consultation to assist our customers in understanding technology and choosing the right products for their specific application. Our personnel, including those we refer to as “Solution Architects” offer applications engineering to market-specific needs such as:
|
· |
DAS (Distributed Antennae Systems), Cellular and Public Safety |
|
· |
IoT (Internet of Things) |
|
· |
Networking |
|
· |
Power Systems |
|
· |
Test Systems |
|
· |
Broadband: microwave, backhaul, etc. |
|
· |
WiFi |
These Solution Architects also offer design services such as:
|
· |
DAS |
|
· |
IoT |
|
· |
Power |
|
· |
Test |
|
· |
WiFi |
|
· |
Broadband |
|
· |
Network systems including video surveillance, SCADA |
|
· |
Tower design/calculations |
In addition to determining the product offering, our Product and Solutions Development and Engineering Teams provide the technical foundation for both customers and our personnel. Our product management software is continually updated to add new products and additional technical information in response to manufacturer specification changes and customer inquiries. This system contains detailed information on each SKU offered, including full product descriptions, category classifications, technical specifications, illustrations, product cost, pricing and delivery information, alternative and associated products, and purchase and sales histories. This information is available on a real-time basis to all of our personnel for product development, procurement, technical support, cataloging and marketing.
Strategic Marketing – As a thought leader in the wireless industry, Tessco’s marketing materials educate the industry and promote our services and unique value proposition. Through WirelessNow, our retail focused industry publication, we offer product recommendations, trend reports, and expert market analysis to help thousands of retail customers improve sell through, drive traffic and sales, and maximize their revenue. Our weekly commercial digital newsletter, The Wireless Update, keeps 108,000 of our customers informed on the latest news in the industry, new products and solutions from our manufacturers, upcoming events and training opportunities, and more. In addition, strategic marketing supports the organization through the development of compelling original content, training programs, and other customer and manufacturer programs that solve business challenges and increase the value Tessco provides to the industry.
Tessco.com® is our e-commerce site and the digital gateway to our comprehensive industry expertise, products, and solutions for wireless. In addition to access to our inventory of products for every solution, Tessco.com features:
|
· |
Powerful parametric product search capabilities; |
|
· |
Real-time product availability; |
|
· |
Real-time customer-specific pricing; |
|
· |
Easy ordering capabilities that allow for the construction and configuration of complete, end-to-end solution that can be converted to an order, or saved, copied, shared, uploaded and emailed; |
7
|
· |
A variety of customer service, financial and technical support pages, including account controls which include all of the tools necessary to track and manage orders, update an account, find the right support, review saved orders, handle warranty claims, and explore Tessco’s capabilities; |
|
· |
Order confirmation – specifying the contents, order status, delivery date, tracking number and total cost of an order; |
|
· |
Order reservations, order status, and order history; and |
|
· |
Manufacturer portal pages designed to showcase each manufacturer partner’s offer in a custom fashion. |
Tessco.com empowers our customers to make better decisions by delivering product knowledge so they are fully informed. This destination also enables our manufacturers to reach a broad and diverse customer base with their product offer and brand features.
Customer Support and Order Entry: Our customer support teams are responsible for delivering sales and customer support services through an effective and efficient transaction system. We also continually monitor our customer service performance through customer surveys and process auditing. By combining our broad product offering with a commitment to superior customer service, we seek to reduce a customer's overall procurement costs by enabling the customer to consolidate the number of suppliers from which it obtains products, while also reducing the customer's need to maintain high inventory levels.
Our information technology system provides detailed information on every customer account, including recent inquiries, buying and credit histories, separate buying locations within a customer account and contact history for key personnel, as well as detailed product information, including technical, product availability and pricing information. The information technology system enables any customer support representative to provide any customer with personalized service and also allows non-technical personnel to provide a high level of technical product information and order assistance.
We believe that our commitment to providing prompt, professional and efficient customer service before, during and after the sale enables us to maximize sales, customer satisfaction and customer retention. The monthly average number of non-consumer customers decreased from approximately 10,500 for fiscal year 2019 to approximately 8,500 in fiscal year 2020, primarily due to the decline in retail market. Due to the addition of several larger new relationships, the average monthly purchase per customer increased from $4,800 in fiscal year 2019 to $5,300 in fiscal year 2020.
Procurement and Inventory Management: Our product management and purchasing system provides customers with a total source of broad and deep product availability, while attempting to maximize the return on our inventory investment.
We use our information technology system to monitor and manage our inventory. Historical sales results, sales projections and information regarding supplier lead times are all used to determine appropriate inventory levels. Our information technology system also provides early warning reports regarding upcoming inventory requirements. As of March 29, 2020, and March 31, 2019, we had an immaterial level of backlog orders. Most backlog orders as of March 29, 2020 are expected to be filled within 90 days of fiscal year-end. For fiscal years ended March 29, 2020, and March 31, 2019, inventory write-offs and reserves were 3.0% and 0.9% of total purchases, respectively. Inventory write-offs and reserves increased significantly for fiscal 2020, partially due to the uncertainty caused by the COVID-19 pandemic. In many cases, we are able to return slow-moving inventory to our suppliers pursuant to stock rotation agreements. Inventory turns for fiscal years 2020 and 2019 were 6.3 and 6.7, respectively.
Fulfillment and Distribution: Orders are received at our Timonium, Maryland, Reno, Nevada and San Antonio, Texas customer sales support centers. As orders are received, customer representatives have access to technical information, alternative and complementary product selections, product availability and pricing information, as well as customer purchasing and credit histories and recent inquiry summaries. An automated warehouse management system, which is integrated with the product planning and procurement system, allows us to ensure inventory control, to minimize multiple product shipments to complete an order and to limit inventory duplication. Bar-coded labels are used on every product, allowing distribution center personnel to utilize radio frequency scanners to locate products, fill orders and update
8
inventory records in real-time, thus reducing overhead associated with the distribution functions. We contract with a variety of freight line and parcel transportation carrier partners to deliver orders to customers.
Performance and Delivery Guarantee (PDG) charges are generally calculated on the basis of the weight of the products ordered and on the delivery service requested, rather than on distance to the customer. We believe that this approach emphasizes on-time delivery instead of shipment dates, enabling customers to minimize their inventories and reduce their overall procurement costs while guaranteeing date specific delivery, thereby encouraging them to make us their total source supplier.
Information Technology: Our information technology system is critical to the success of our operations. We have made and continue to make substantial investments in the development of these systems, which integrate cataloging, marketing, sales, fulfillment, inventory control and purchasing, financial control and internal and external communications. The information technology system includes highly developed customer and product databases and is integrated with our Configuration, Fulfillment and Delivery system. The information contained in these systems is available on a real-time basis to all of our employees as needed and is utilized in every area of our operations.
We believe that we have been successful to date in pursuing a highly integrated, technologically advanced and efficient method of operations; however, disruption to our day-to-day operations, including failure of our information technology or distribution systems, or freight carrier interruption, could impair our ability to receive and process orders or to ship products in a timely and cost-efficient manner.
Competition
The wireless communications distribution industry is competitive and fragmented, and is comprised of distributors such as Brightstar, D&H, Ingram Micro, Superior Communications and VoiceComm in our retail segment and Alliance Corporation, Anixter, Comstor, Graybar, KGPCo Logistics, Ingram Micro, Primus, Talley Communications, Tech Data, Site Pro 1, VAV Wireless, Westcon and Winncom in our commercial markets. In addition, many manufacturers sell and fulfill directly to customers. Barriers to entry for distributors are relatively low, particularly in the mobile devices and accessory market, and the risk of new competitors entering the market is high. In addition, the agreements or arrangements with our customers or suppliers looking to us for product and supply chain solutions are typically of limited duration and are often terminable by either party upon several months or otherwise short notice. Accordingly, our ability to maintain these relationships is subject to competitive pressures and challenges. Some of our current competitors have substantially greater capital resources and sales and distribution capabilities than we do. In response to competitive pressures from any of our current or future competitors, we may be required to lower selling prices in order to maintain or increase market share, and such measures could adversely affect our operating results. We believe, however, that our strength in service, the breadth and depth of our product offering, our information technology system, our knowledge and expertise in wireless technologies and the wireless marketplace, and our large customer base and purchasing relationships with approximately 400 manufacturers, provide us with a significant competitive advantage over new entrants to the market.
Continuing changes in the wireless communications industry, including risks associated with conflicting technology, changes in technology, inventory obsolescence, and consolidation among wireless carriers, could adversely affect future operating results.
We believe that the principal competitive factors in supplying products to the wireless communications industry are the quality and consistency of customer service, particularly timely delivery of complete orders, breadth and quality of products offered and total procurement costs to the customer. We believe that we compete favorably with respect to each of these factors. In particular, we believe we differentiate ourselves from our competitors based on the breadth of our product offering, our ability to quickly provide products and supply chain solutions in response to customer demand and technological advances, our knowledge and expertise in wireless technologies and the wireless marketplace, the level of our customer service and the reliability of our order fulfillment process.
9
Intellectual Property
We seek to protect our intellectual property through a combination of trademarks, service marks, confidentiality agreements, trade secret protection and, if and when appropriate, patent protection. Thus far, we have generally sought to protect our intellectual property, including our product data and information, customer information and information technology systems, through trademark filings and nondisclosure, confidentiality and trade secret agreements. We typically require our employees, consultants, and others having access to our intellectual property, to sign confidentiality and nondisclosure agreements. There can be no assurance that these confidentiality and nondisclosure agreements will be honored, or whether they can be fully enforced, or that other entities may not independently develop systems, technologies or information similar to that on which we rely.
TESSCO Communications Incorporated, a wholly-owned subsidiary of TESSCO Technologies Incorporated, maintains a number of registered trademarks and service marks in connection with our business activities, including: A Simple Way of Doing Business Better®, Chargesync®, LinkUPS®, Solutions That Make Wireless Work®, TerraWave Solutions®, TESSCO®, TESSCO Making Wireless Work®, TESSCO Technologies®, Tessco.com®, Ventev®, The Vital Link to a Wireless World®, Wireless Now®, Wireless Solutions®, The Wireless Update®, Your Total Source®, and Your Virtual Inventory®, among many others. Our general policy is to file for trademark and service mark protection for each of our trademarks and trade names and to enforce our rights against any infringement.
We currently hold one patent related to our online order entry system and seven patents related to our Ventev® products. We intend, if and when appropriate, to seek patent protection for any additional patentable technology. The ability to obtain patent protection involves complex legal and factual questions. Others may obtain patent protection for technologies that are important to our business, and as a result, our business may be adversely affected. In response to patents of others, we may need to license the right to use technology patented by others, or in the event that a license cannot be obtained, to design our systems around the patents of others.
Environmental Regulation
We are subject to various laws and governmental regulations concerning environmental matters and employee safety and health matters in the United States. Compliance with these federal, state and local laws and regulations related to protection of the environment and employee safety and health has had no material effect on our business. There were no material capital expenditures for environmental projects in fiscal year 2020, and there are no material expenditures planned for such purposes in fiscal year 2021.
Employees
As of March 29, 2020, we had 678 full-time equivalent employees. Of our full-time equivalent employees, 331 were engaged in customer and supplier service, marketing, sales and product management, 231 were engaged in fulfillment and distribution operations and 116 were engaged in administration and technology systems services. No employees are covered by collective bargaining agreements. We consider our employee relations to be excellent.
10
Executive Officers
Executive officers are appointed annually by the Board of Directors and, subject to the terms of any applicable employment agreement, serve at the discretion of the Board of Directors. Information regarding our named executive officers is as follows:
|
|
|
|
|
|||||
|
Name |
|
Age |
|
Position |
|
|
||
|
|
|
|
|
|
|
|
||
|
Sandip Mukerjee |
|
57 |
|
President and Chief Executive Officer |
|
Sandip Mukerjee joined the Company in August of 2019. Mr. Mukerjee served as President, Global Professional and Consulting Business, Nokia Software from 2016 to 2018. Before that, Mr. Mukerjee worked for Alcatel where he held the positions of Sr. Vice President, Wireless and Software Strategy from 2006 to 2010 and then President and General Manager, Advanced Communications from 2010 to 2013 and President & General Manager, IP Platforms for the Americas. |
||
|
|
|
|
|
|
|
|
||
|
Aric M. Spitulnik |
|
48 |
|
Senior Vice President, Secretary, and Chief Financial Officer |
|
Aric Spitulnik joined the Company in 2000. Mr. Spitulnik was appointed Controller in 2005 and Vice President in 2006. In 2012, he was appointed Corporate Secretary, and in 2014 he was appointed Senior Vice President. Since October 2013, Mr. Spitulnik has served as the Company’s Chief Financial Officer. |
||
|
|
|
|
|
|
|
|
||
|
Douglas A. Rein |
|
60 |
|
Senior Vice President of Performance Systems and Operations |
|
Douglas Rein joined the Company in July 1999 as Senior Vice President of Performance Systems and Operations. Previously, he was director of operations for Compaq Computer Corporation and Vice President, distribution and logistics operations for Intelligent Electronics. |
||
|
|
|
|
|
|
|
|
||
|
Elizabeth S. Robinson |
|
53 |
|
Senior Vice President, Retail Sales and Product Marketing |
|
Elizabeth Robinson joined the Company in 1998. Ms. Robinson was appointed Director of Sales in 2001, and Vice President in 2004. In 2011, she was appointed Vice President of Mobile Devices and Accessories, and then for the Mobility Group in 2016. In 2017, she was appointed Senior Vice President, leading Retail Sales and Product Management. |
||
|
|
|
|
|
|
|
|
||
11
|
|
|
|
|
|||||
|
Name |
|
Age |
|
Position |
|
|
||
|
|
|
|
|
|
|
|
||
|
Joseph M. Cawley, Jr. |
|
56 |
|
Senior Vice President, and Chief Information Officer |
|
Joseph Cawley started with the Company in June 2017 as Vice President, Technology Development and Services. Mr. Cawley was appointed Senior Vice President and Chief Information Officer in April 2019. Prior to joining the Company, Mr. Cawley worked for the Williamsburg Foundation from 2007 until 2017. He started his career there as Director, IT Program Office, and then Vice President/CIO from 2012 until 2017. Before the Williams Foundation, Mr. Cawley worked for IBM in several technical leadership roles for more than 20 years, his last being Director of Worldwide Support. |
||
12
We are not able to identify or control all circumstances that could occur in the future that may adversely affect our business and operating results. The following are certain risk factors that could adversely affect our business, financial position and results of operations. These risk factors and others described in this Annual Report on Form 10-K should be considered in connection with evaluating the forward-looking statements contained in this Annual Report on Form 10-K because these factors could cause the actual results and conditions to differ materially from those projected in the forward-looking statements. Additional risks and uncertainties that management is not aware of or focused on, or that management currently deems immaterial may also adversely affect our business, financial position and results of operations. If our business, financial position and results of operations are adversely affected by any of these or other adverse events, our stock price would also likely be adversely affected.
RISKS RELATING TO OUR BUSINESS
We face risks related to adverse global or national economic conditions or events (including health epidemics and trade wars and other outbreaks and events beyond our control) that could significantly disrupt our business and adversely affect our business, financial position and results of operations.
Our business, financial position and results of operations could be adversely affected by weak or unstable global or national economic conditions, including international trade protection measures and disputes, such as those between the United States and China, and public health issues or events, such as the COVID-19 pandemic discussed below. A significant portion of our product offerings, including a majority of our private label Ventev products and products we acquire from our suppliers, are manufactured in foreign countries, including China and Vietnam, and many of the component parts of our products manufactured in Vietnam are sourced from China. Our ability to meet our customers' demands depends, in part, on our ability to obtain timely and adequate delivery of inventory from our suppliers. Weak or unstable global or national economic conditions could harm our suppliers’ businesses, contributing to product shortages or delays, supply chain disruptions, increased product costs and other adverse effects on their operations, which could hamper our ability or preclude us from obtaining timely and adequate delivery of inventory from our suppliers, as needed to support our business. In addition, many products produced for others in the industries we serve, and which our product offerings are intended to complement, are subject to many of the same risks and uncertainties as are ours, and perhaps others. If production or sales of those products are impacted by negative events, so will be the demand for our complementary products. Any of these events or occurrences could have a negative impact on our business, financial positions and results of operations.
In late December 2019, a strain of coronavirus, commonly referred to as COVID-19, surfaced in Wuhan, China. On January 30, 2020, the World Health Organization declared this coronavirus outbreak a health emergency of international concern. During the fourth quarter of fiscal year 2020, COVID-19 spread to the U.S. and resulted in most states imposing restrictions on travel, business operations and gatherings. As a result, many of our retail customers were temporarily closed or significantly impacted by lower foot traffic. We have also seen a significant, albeit a less significant, impact to our Commercial segment as many non-essential projects have been delayed or project venues have been unreachable. Our business and results of operations have been, and may continue to be, adversely affected to the extent the coronavirus continues to harm the U.S. and world economy generally, or otherwise interferes with our supply chain or the manufacture of products that ours are intended to complement.
We may also experience negative effects from future health epidemics or outbreaks or other world events or disasters beyond our control. These events are impossible to forecast and difficult to mitigate. As a consequence, our operating results for a particular period may be more difficult to predict. Any of these events could have a material adverse effect on our business, results of operations and financial condition.
We face significant competition in the wireless communications distribution industry.
The wireless communications distribution industry is competitive and fragmented, and is comprised of several national distributors, as well as numerous regional distributors. In addition, many manufacturers sell and fulfill directly to customers. Barriers to entry for distributors are relatively low, particularly in the mobile devices and accessory market,
13
and the risk of new competitors entering the market is high. Some of our current competitors have substantially greater capital resources and sales and distribution capabilities than we do. In response to competitive pressures from any of our current or future competitors, we may be required to lower selling prices in order to maintain or increase market share, and such measures could adversely affect our operating results. We are also seeing increased competition in the form of e-commerce sites as consumers and business are increasingly looking to the internet to purchase goods.
We offer no assurance that we will not lose market share, or that we will not be forced in the future to reduce our prices in response to the actions of our competitors, thereby reducing our gross margins. Furthermore, to remain competitive we may be forced to offer more credit or extended payment terms to our customers. This could increase our required capital, financing costs, and the amount of our bad debt expenses.
We typically purchase and sell our products and services on the basis of individual sales or purchase orders, and even in those cases where we have standing agreements or arrangements with our customers and suppliers, those agreements and arrangements typically contain no purchase or sale obligations and are otherwise terminable by either party upon several months or otherwise short notice.
Our sales to customers and our purchases from suppliers are largely governed by individual sales or purchase orders, so there is no guarantee of future business. In some cases, we have formal agreements or arrangements with significant customers or suppliers, but they are largely administrative in nature and are terminable by either party upon several months or otherwise short notice, and they typically contain no purchase or sale obligations. Many of our customer and supplier contracts contain “evergreen” clauses, although this too is largely a matter of administrative convenience, because the contracts are nevertheless typically terminable on short notice, and because no purchase and sale obligation in any event arises other than pursuant to an accepted purchase order. When negotiating with customers and suppliers, we seek the most favorable terms available under the circumstances. Our preferred supplier terms include, among others, terms that provide for product warranty and return rights, as well as product liability and intellectual property indemnification rights, in each case consistent with our preferred business methods and objectives. We have not been able, nor do we expect in the future to be able to negotiate the inclusion of all our preferred terms, or our preferred language for those terms, in every contract. The degree of our success in this regard is largely a function of the parties’ relative bargaining positions.
When unable to negotiate the inclusion of our preferred terms or preferred language in a particular supplier contract, we assess any increased risk presented, as well as mitigating factors, analyze our overall business objectives, and then proceed accordingly. In some instances, we refuse the contract and seek other sources for the product, and in other instances business objectives and circumstances are determined to outweigh or mitigate any increased risk, or otherwise dictate that we proceed with the contract, notwithstanding. We consistently seek to manage contractual risks resulting from supplier contracts not including our preferred terms or language. However, these risks persist, and even when we are successful in negotiating our preferred terms, performance of these terms is not assured.
If our suppliers refuse to, or for any reason are unable to, supply products to us in sufficient quantities to meet demand, or at all, and if we are not able to procure those products from alternative sources, we may not be able to maintain appropriate inventory levels to meet customer demand and our financial position and results of operations would be adversely affected. Similarly, if customers decide to purchase from other sources, instead of from us, or experience significant changes in demand internally or from their own customer bases, become financially unstable (including on account of unforeseen events or events beyond their control, such as the COVID-19 pandemic), or are acquired by another company, our ability to generate revenues from these customers may, or in some cases would, be significantly affected, resulting in an adverse effect on our financial position and results of operations.
The loss or any change in the business habits of key customers or suppliers may have a material adverse effect on our financial position and results of operations.
Because our standing arrangements and agreements with our customers and suppliers typically contain no purchase or sale obligations and are terminable by either party upon several months or otherwise relatively short notice, we are subject to significant risks associated with the loss or change at any time in the business habits and financial
14
condition of key customers or suppliers. We have experienced the loss and changes in the business habits of key customer and supplier relationships in the past and expect to do so again in the future. This is the nature of our business.
Sales of products purchased from our largest wireless infrastructure (23%) and mobile device and accessories (7%) suppliers, generated approximately 30% of our total revenues in fiscal year 2020, and sales of products purchased from our largest ten suppliers generated approximately 50% of fiscal year 2020 total revenues. As is the case with many of our supplier and customer relationships, our contractual arrangements with these large suppliers are terminable by either party upon several months’ notice. If these contracts or our relationships with these suppliers terminate for any reason, or if any of our other significant supplier relationships terminate for any reason, and we are not able to sell or procure a sufficient supply of those products from alternative sources, or at all, our financial position and results of operations would be adversely affected. Our suppliers are subject to many if not all of the same (or similar) risks and uncertainties to which we are subject, as well as other risks and uncertainties, and we compete with others for their business. Accordingly, we are at a continual risk of loss of their business on account of a number of factors and forces, many of which are largely beyond our control.
In fiscal year 2020, our largest customer accounted for 11% of our total revenues. In the Commercial market, 29% of our commercial sales in fiscal 2020 were made to five customers. In the retail market, 35% of our retail sales in fiscal 2020 were made to five customers. Also, customer mix can change rapidly, and we may see changes in customer concentrations in the future. If or when any of our significant customer relationships terminate for any reason, and we are not able to replace those customers and associated revenues, our financial position and results of operations would be adversely affected.
The loss of customer relationships and the corresponding reduction in the volume of product sales identified to those relationships, can also affect our negotiating ability with suppliers supplying those products. This can affect our margins on sales of those products to other customers. If we are unable to replace those products at favorable pricing and terms, or if we are unable to acquire those products from suppliers or offer those products to our customers on favorable terms, our competitiveness may suffer and result in reduced revenues and profits. Like our suppliers, our customers are subject to many if not all of the same (or similar) risks and uncertainties to which we are subject, as well as other risks and uncertainties, and we compete with others for their business. Accordingly, we are at continual risk of loss of their business on account of a number of factors and forces, many of which are largely beyond our control.
There can be no assurance that we will be successful in replacing any of our past, present or future supplier or customer relationships if and when lost, or that we will not suffer a substantial reduction in revenues as a result of loss of any such relationship. As such, supplier, customer, or revenue loss would adversely affect our financial position and results of operations.
Changes in customer or product mix could cause our gross margin percentage to decline.
We continually experience changes in customer and product mix that affects gross margin. Changes in customer and product mix result primarily from changes in customer demand, customer acquisitions or losses, selling and marketing activities and competition.
Our business depends on the continued tendency of wireless equipment manufacturers and network operators to outsource aspects of their business to us in the future.
We provide functions such as distribution, inventory management, fulfillment, customized packaging, e-commerce solutions, and other outsourced services for many wireless manufacturers and network operators. Certain wireless equipment manufacturers and network operators have elected, and others may elect, to undertake these services internally. Additionally, our customer service levels, industry consolidation, competition, deregulation, technological changes or other developments could reduce the degree to which members of the global wireless industry rely on outsourced logistic services such as the services we provide. Any significant change in the market for our outsourced services could have a material adverse effect on our business. Our outsourced services are generally provided under short-term contractual arrangements. The failure to obtain renewals or otherwise maintain these agreements on terms, including price, consistent with our current terms could have an adverse effect on our business.
15
We require substantial capital to operate, and the inability to obtain financing on favorable terms will adversely impact our business, financial position and results of operations.
Our business requires substantial capital to operate and to finance accounts receivable and product inventory that are not financed by trade creditors. We have historically relied upon cash generated from operations, revolving credit facilities and trade credit from our suppliers to satisfy our capital needs and finance growth. The impact of the COVID-19 pandemic on financial markets continues to evolve, and as this occurs and new regulations come into effect, and as the financial markets change on account of other forces and events, the cost of acquiring financing and the methods of financing may change. Changes in our credit rating or other market factors may increase our interest expense or other costs of capital, or capital may not be available to us on competitive terms to fund our working capital needs. Our existing secured revolving credit facility contains various financial and other covenants that may limit our ability to borrow or limit our flexibility in responding to business conditions. In addition, even if the terms of our revolving credit facility would otherwise allow or require, our lenders may refuse to lend to us through no fault of ours. The inability to maintain or when necessary obtain adequate sources of financing could have an adverse effect on our business. Our existing secured revolving credit facility includes variable rate debt, thus exposing us to risk of fluctuations in interest rates. Such fluctuations in interest rates could have an adverse effect on our business, financial position and results of operations. We may in the future use interest rate swaps in an effort to achieve a desired proportion of fixed and variable rate debt. We would utilize these derivative financial instruments to enhance our ability to manage risk, including interest rate exposures that exist as part of our ongoing business operations. However, our use of these instruments may not effectively limit or eliminate our exposure to a decline in operating results due to changes in interest rates.
Our ability to maintain and borrow under our revolving credit agreement could be constrained by the level of eligible receivables and product inventory and by any failure to meet certain financial and other covenants in our revolving credit agreement.
Our borrowing availability under our secured revolving credit facility is determined in part by a borrowing base and is limited to certain amounts of eligible accounts receivable and inventory. If the value of these accounts receivable and product inventory were to decrease significantly, the amount available for borrowing under the facility would decrease and our ability to borrow under the facility could be significantly impacted. Borrowing under the facility is also conditioned upon compliance with financial and other covenants included in the revolving credit agreement and a related guaranty and security agreement. Among these is a covenant to maintain a fixed charge coverage ratio at any time during which the borrowing availability is otherwise less than $10 million. There are no assurances that we will be able to comply with all applicable covenants in these agreements, and in the event that we do not, our ability to borrow under our secured revolving credit facility could be limited or suspended or could terminate.
If we fail to meet our payment or other obligations under our secured revolving credit facility, our lenders could foreclose on, and acquire control of, a significant portion of our assets.
Indebtedness under our secured revolving credit facility is secured by continuing first priority security interests in our inventory, accounts receivable, and deposit accounts, and on all documents, instruments, general intangibles, letter of credit rights, and chattel paper relating to inventory and accounts, and to all proceeds of the foregoing. If we fail to meet our payment or other obligations under our secured revolving credit facility, our lenders could foreclose on these assets, which would have a material adverse effect on our business, results of operations and financial condition.
Compliance with regulations regarding the use of “conflict minerals” could limit the supply and increase the cost of certain of our products, and customers may seek other sources if we are unable to demonstrate to their satisfaction that our products are conflict free.
Increased focus on environmental protection and social responsibility initiatives led to the passage of Section 1502 of the Dodd-Frank Wall Street Reform and Consumer Protection Act of 2010 (the "Dodd-Frank Act"), and its implementing SEC regulations. The Dodd-Frank Act imposes supply chain diligence and disclosure requirements for certain manufacturers of products containing specific minerals that may originate in or near the Democratic Republic of
16
the Congo (the "DRC") and finance or benefit local armed groups. These "conflict minerals" are commonly found in certain of the products that we acquire from suppliers and distribute to customers and are also found in certain products in our Ventev® product line that we contract to be manufactured by others or that we assemble. The implementation of these regulations may limit the sourcing and availability of some of the raw materials used in certain of these products. This in turn may affect our ability to obtain sufficient quantities of our products and may affect related pricing. Because we are considered a manufacturer of certain of our Ventev® products, we are subject to additional “conflict minerals” diligence and disclosure requirements with regard to these products. Some of our customers may elect to disqualify us as a supplier if we are unable to verify that the products we sell to them are DRC conflict free.
Weakness in the global economic environment may have significant effects on our customers and suppliers that could result in material adverse effects on our business, operating results, and stock price.
Weakness in the global economic environment – may include, among other things, significant reductions in available capital and liquidity from banks and other providers of credit, substantial reductions and/or fluctuations in equity and currency values worldwide, significant decreases in consumer confidence and consumer and business spending, high rates of unemployment and concerns that the worldwide economy experience other significant challenges – could materially adversely affect our customers’ access to capital or willingness to spend capital on our products, and/or their levels of cash liquidity with which to pay for our products. In addition, our suppliers’ access to capital and liquidity could be affected, which may in turn adversely impact their ability to maintain inventories, production levels, and/or product quality, or cause them to raise prices or lower production levels, or result in their ceasing operation.
The potential effects of weakness in the global economic environment are difficult to forecast and mitigate. As a consequence, our operating results for a particular period may be more difficult to predict. Any of the foregoing effects could have a material adverse effect on our results of operations and financial condition, and could adversely affect our stock price.
We may be unable to successfully execute our merchandising and marketing strategic initiatives.
We are focusing our sales and marketing efforts and initiatives to maximize sales. If we fail to successfully execute these initiatives, our business, financial position and results of operations could be adversely affected.
The telecommunications products marketplace is dynamic and challenging because of the continued introduction of new products and services.
We must constantly introduce new products, services and product features to meet competitive pressures. We may be unable to timely change our existing merchandise sales mix in order to meet these competitive pressures, which may result in increased inventory costs, inventory write-offs or loss of market share.
Additionally, our inventory may also lose value due to price changes made by our significant suppliers, in cases where our arrangements with these suppliers do not provide for inventory price protection, or in cases where the supplier is unable or unwilling to provide these protections.
Consolidation among wireless service carriers could result in the loss of significant customers.
The wireless service carrier industry has experienced significant consolidation in recent years. If any of our significant customers or partners are acquired or consolidate with other carriers, or are otherwise involved in any significant transaction that results in them ceasing to do business with us, or significantly reducing the level of business that they do with us, our revenues from those customers could be affected, resulting in an adverse effect on our financial position and results of operations.
17
The failure of our information technology or telecommunication systems, or our inability to maintain or upgrade our information technology or telecommunication systems without incident or delay, or undue cost, could have a material adverse effect on our business, financial position and results of operations.
We are highly dependent upon our internal information technology and telecommunication systems, many of which are proprietary, to operate our business. These systems support all aspects of our business operations, including means of internal and external communication, inventory and order management, shipping, receiving and accounting. Most of our information technology systems contain a number of internally developed applications. In addition, all of these systems require continued maintenance and also require upgrading or replacement from time to time. There can be no assurance that these systems will not fail or experience disruptions, that we will be able to attract and retain qualified personnel necessary for the operation of such systems, that we will be able to expand and improve our systems, that we will be able to convert to new systems efficiently as and when necessary, or that we will be able to integrate new programs effectively with our existing programs, in each case without incident or delay, or undue cost.
We, like most businesses, are subject to risk of cyber-attack and incur significant costs in efforts to defend these attacks.
We like most businesses are continually subject to risk of cyber-attack and are continually engaged in an effort to defend against and to ward off attacks from hackers and others. We have experienced cyber-attacks from time to time. Any of such problems, or any significant damage or destruction of these systems, including pursuant to or as a result of system security breaches, data protection breaches or other cyber-attacks, could result in significant disruption in our business and operations, harm our relationship with our customers or suppliers, and result in significant losses in revenues. Corrective action and compliance with applicable privacy and data protection laws could be costly. Any of these or similar events or occurrences could have an adverse effect on our business, financial position and results of operations.
We depend heavily on e-commerce, and website security breaches or internet disruptions could have a material adverse effect on our business, financial position and results of operations.
We rely on the internet (including Tessco.com®) for a significant percentage of our orders and information exchanges with our customers. The internet and individual websites have experienced a number of disruptions and slowdowns, some of which were caused by organized attacks. In addition, some websites have experienced security breakdowns. There can be no assurances that our website will not experience any material breakdowns, disruptions or breaches in security. If we were to experience a security breakdown, disruption or breach that compromised sensitive information, this could harm our relationship with our customers or suppliers. Disruption of our website or the internet in general could impair our order processing or more generally prevent our customers and suppliers from accessing information or placing orders. This could have an adverse effect on our business, financial position and results of operations.
System security breaches or data protection breaches could adversely disrupt our business and harm our reputation, financial position and results of operations.
We manage and store various proprietary information and sensitive or confidential data relating to our business. In addition, we routinely process, store and transmit large amounts of data, including sensitive and personally identifiable information, including customer credit card data and other information. Breaches of our security measures or the accidental loss, inadvertent disclosure or unapproved dissemination of proprietary information or sensitive or confidential data about us or our customers or suppliers, including the potential loss or disclosure of such information or data as a result of fraud, trickery or other forms of deception, could expose us, our customers or the individuals affected to a risk of loss or misuse of this information, result in litigation and potential liability for us, damage our brand and reputation or otherwise harm our business. In addition, the cost and operational consequences of implementing further data protection measures could be significant. Such breaches, costs and consequences could adversely affect our business, results of operations or cash flows.
We are also subject to payment card association operating rules, certification requirements and rules governing electronic funds transfers, including the Payment Card Industry Data Security Standard (PCI DSS), a security standard applicable to companies that collect, store or transmit certain data regarding credit and debit cards, holders and transactions.
18
From time to time we may not be fully or materially compliant with PCI DSS or other payment card operating rules. Any failure to comply fully or materially with the PCI DSS now or at any point in the future may violate payment card association operating rules and the terms of our contracts with payment processors and merchant banks, and could subject us to fines, penalties, damages and civil liability, and could result in the loss of our ability to accept credit and debit card payments. Maintaining compliance with these regulations is costly and there is no guarantee that we will be successful or avoid fines, penalties, damages or civil liability, and even if successful, there is no guarantee that PCI DSS compliance will prevent illegal or improper use of our payment systems or the theft, loss or misuse of data pertaining to credit and debit cards, credit and debit card holders and credit and debit card transactions.
The inability to hire or retain certain key professionals, management and staff could adversely affect our business, financial condition and results of operations.
The nature of our business includes (but is not limited to) a high volume of transactions, business complexity, wide geographical coverage, and broad scope of products, suppliers, and customers. In order to compete, we must attract, retain and motivate executives and other key employees, including those in managerial, technical, sales, marketing and support positions. Hiring and retaining qualified executives, information technology and business generation personnel are critical to our business. Most of the members of our senior management team are parties to employment contracts or arrangements with us that provide for, among other things, various severance payments or benefits upon termination of their employment under certain circumstances, including termination by the Company without “cause” or for “good reason”, and those contracts generally renew from year to year, except for the employment contract with Mr. Mukerjee, our CEO, which commenced in August 2019 and expires in March 2023. The loss of any of the members of our senior management team, could have an adverse effect on our business, financial position and results of operations.
To attract, retain and motivate qualified employees, we rely heavily on stock-based incentive awards such as Performance Stock Units (PSUs) and stock options. If performance targets associated with PSUs are not met, or the value of such awards does not appreciate as measured by the performance of the price of our common stock and/or if our other stock-based compensation, such as stock options, otherwise ceases to be viewed as a valuable benefit, our ability to attract, retain and motivate our employees could be adversely impacted, which could negatively affect our business, financial position and results of operations and/or require us to increase the amount we spend on cash and other forms of compensation. Our ability to issue PSUs, stock options and other equity instruments is also limited by the provisions of and our available shares under our current and/or future stock incentive plans, which may be subject to shareholder approval. We may currently issue awards under our incentive plan only through June 4, 2029, and as of May 15, 2020, the most recent date when PSUs and other equity instruments were issued, there were 407,222 shares available for future awards. Therefore, our ability to offer stock-based incentive awards may be limited, which may have an adverse effect on our continued ability to attract and retain, and motivate, our employees, and, subsequently, on our business, financial position and results of operations. In addition, an increase in the number of shares for future awards, under either current or future compensation or incentive plans or arrangements could lead to dilution of our other stockholders.
The damage or destruction of any of our principal distribution or administrative facilities could materially adversely impact our business, financial position and results of operations.
If either of our distribution centers in Hunt Valley, Maryland or Reno, Nevada, were to be significantly damaged or destroyed, we could suffer a loss of product inventory and our ability to conduct our business in the ordinary course could be materially and adversely affected. Similarly, if our office locations in Maryland, Nevada or Texas were to be significantly damaged or destroyed, our ability to conduct marketing, sales and other corporate activities in the ordinary course could be adversely affected.
We depend on third parties to manufacture products that we distribute and, accordingly, rely on their quality control procedures.
Product manufacturers typically provide limited warranties directly to the end consumer or to us, which we generally pass through to our customers. If a product we distribute for a manufacturer has quality or performance problems, our ability to provide products to our customers could be disrupted, which could adversely affect our operations.
19
We are subject to potential declines in inventory value.
We are subject to the risk that the value of our inventory will decline as a result of price reductions by suppliers or technological obsolescence or failure. It is the policy of many of our suppliers to protect distributors like us from the loss in value of inventory due to technological change or failure, or the suppliers’ price reductions. Some suppliers (including those who manufacture our proprietary products), however, may be unwilling or unable to pay us for price protection claims or products returned to them under purchase agreements. No assurance can be given that such practices to protect distributors like us will continue, that unforeseen new product developments, product failure or product obsolescence will not adversely affect us, or that we will be able to successfully manage our existing and future inventories.
Our future operating results depend on our ability to purchase a sufficient amount of finished goods and bulk inventory to meet the demands of our customers.
Our ability to meet our customers' demands depends, in part, on our ability to obtain timely and adequate delivery of inventory from our suppliers. We have experienced shortages in the past that have negatively impacted our operations. Although we work closely with our suppliers to avoid these types of shortages, there can be no assurances that we will not encounter these problems in the future. Furthermore, certain of our products or components are available only from a single source or limited sources. We may not be able to diversify sources in a timely manner. A reduction or interruption in supplies or a significant increase in the price of supplies could have a negative impact on our results of operations or financial condition.
If our business does not perform well, or if we otherwise experience a decline in the fair values of a portion or all of our business, we may be required to recognize impairments of our intangible or other long-lived assets, which could adversely affect our results of operations or financial condition.
Indefinite lived intangible assets and goodwill that are not amortized are initially recorded at fair value, and are reviewed for impairment at least annually or more frequently if impairment indicators are present.
In assessing the recoverability of goodwill and indefinite lived intangible assets, we make estimates and assumptions about sales, operating margin, growth rates and discount rates based on our budgets, business plans, economic projections, anticipated future cash flows and marketplace data. There are inherent uncertainties related to these factors and management’s judgment in applying these factors. We first perform a qualitative analysis to determine if it is more likely than not that goodwill or indefinite lived intangible assets are impaired. This analysis includes assumptions and estimates related to macroeconomic, industry and company specific events and trends. In the event that we find it is more likely than not that an impairment has occurred a quantitative analysis is performed. We could be required to evaluate the recoverability of goodwill and indefinite lived assets prior to the annual assessment if we experience disruptions to the business, unexpected significant declines in operating results, divestiture of a significant component of our business or sustained market capitalization declines. These types of events and the resulting analyses could result in indefinite lived asset impairment charges in the future. As of March 29, 2020, we had $795,000 of indefinite lived intangible assets, which represented approximately 0.4% of total assets.
Deferred income tax represents the tax effect of the differences between the book and tax bases of assets and liabilities. Deferred tax assets are assessed periodically by management to determine if they are realizable. Factors in management’s determination include the current tax laws, historical results, performance of the business, projections of future taxable income, and the feasibility of ongoing tax planning strategies. If based on available information, it is more likely than not that the deferred income tax asset will not be realized then a valuation allowance must be established with a corresponding charge to net income. Such charges could have an adverse effect on our results of operations or financial condition.
Our future results of operations may be impacted by prolonged weakness in the economic environment which may result in an impairment of the long-lived assets or the recording of a valuation allowance on our deferred tax assets, which could adversely affect our results of operations or financial condition.
20
We primarily rely on trademark filings and confidentiality agreements to protect our intellectual property rights.
In an effort to protect our intellectual property, including our product data, customer information and information technology systems, through trademark filings and nondisclosure, confidentiality and trade secret agreements, we typically require our employees, consultants and others having access to this information or our technology to execute confidentiality and non-disclosure agreements. These agreements, however, may not provide us with adequate protection against improper use or disclosure of confidential information, and these agreements may be breached. A breach of confidentiality could adversely affect our business. In addition, in some situations, these agreements may conflict with, or be subject to, the rights of third parties with whom our employees, consultants and others have previous employment or consulting relationships. Also, others may independently develop substantially equivalent proprietary information and techniques or otherwise gain access to our trade secrets. Adequate remedies may not exist in the event of unauthorized use or disclosure of our confidential information. The disclosure of our proprietary information or trade secrets could impair our competitive position and could have an adverse effect on our business, financial condition and results of operations. Others may obtain patent protection for technologies that are important to our business, and as a result, our business, financial position and results of operations may be adversely affected. In response to patents of others, we may need to license the rights to use the technology patented by others, or in the event that a license cannot be obtained, design our systems around the patents of others. There can be no assurances as to our ability to obtain any such licenses or to design around the patents of others, and our inability to do so could have an adverse effect on our business, financial position and results of operations.
We offer credit to our customers and, therefore, are subject to significant credit risk.
We sell our products to a large and diverse customer base. We finance a significant portion of such sales through trade credit, typically by providing 30-day payment terms. As a result, our business could be adversely affected in the event of a deterioration of the financial condition of our customers, resulting in the customers’ inability to repay us. This risk may increase if there is a general economic downturn affecting a large number of our customers and in the event our customers do not adequately manage their business or properly disclose their financial condition. Also, several of our larger customers, including tier 1 public carrier customers, require greater than 30-day payment terms which could increase our credit risk and decrease our operating cash flow.
We may explore additional growth through acquisitions.
As part of our growth strategy, we may continue to pursue the acquisition of companies that either complement or expand our existing business. As a result, we from time to time evaluate potential acquisition opportunities, which may be material in size and scope. In addition to those risks to which our business and the acquired businesses are generally subject to, the acquisition of these businesses gives rise to transactional and transitional risks, and the risk that the anticipated benefits will not be realized.
Risks associated with the foreign suppliers from whom our products are sourced could adversely affect our financial performance.
The products we sell are sourced from a wide variety of domestic and international suppliers. Global sourcing of many of the products we sell is an important factor in our financial performance. Since the onset of the weakness in the global economic environment due to the COVID-19 pandemic, certain of our suppliers, particularly those in the far-east, have experienced financial difficulties and we believe it is possible that a limited number of suppliers may either cease operations or require increased prices in order to fulfill their obligations. Changes in our relationships with suppliers or increases in the costs of purchased raw materials, component parts or finished goods could result in delays, inefficiencies or our inability to market products. In addition, our profit margins would decrease if prices of purchased raw materials, component parts, or finished goods increase and we are unable to pass on those increases to our customers. The adoption or expansion of trade restrictions or the occurrence of trade wars could have a material adverse effect on our business, financial position and results of operation.
21
We rely on independent shipping companies to deliver inventory to us and to ship products to customers.
We rely on arrangements with independent shipping companies, for the delivery of our products from suppliers and to customers. The failure or inability of these shipping companies to deliver products, or the unavailability of their shipping services, even temporarily, could have a material adverse effect on our business. We may also be adversely affected by an increase in freight surcharges due to rising fuel costs and added security. This could adversely impact our selling, general and administrative expenses or lead to price increases to our customers which could decrease customer demand for our products.
Changes in accounting rules could have a material adverse impact on our results of operations.
We prepare our financial statements in conformity with accounting principles generally accepted in the United States. These accounting principles are subject to interpretation by the Financial Accounting Standards Board, the Public Company Accounting Oversight Board, the United States Securities and Exchange Commission (SEC), the American Institute of Certified Public Accountants and various other bodies formed to interpret and create appropriate accounting policies. A change in these policies or a new interpretation of an existing policy could have a significant effect on our reported results and may affect our reporting of transactions.
Changes in income tax and other regulatory legislation.
We operate in compliance with applicable laws and regulations and make plans for our structure and operations based upon existing laws and anticipated future changes in the law. When new legislation is enacted with minimal advance notice, or when new interpretations or applications of existing laws are made, we may need to implement changes in our policies or structure. We are susceptible to unanticipated changes in legislation, especially relating to income and other taxes, import/export laws, hazardous materials and other laws related to trade, accounting and business activities. Such changes in legislation may have an adverse effect on our business.
We may be subject to litigation.
We may be subject to legal claims or regulatory matters involving stockholder, consumer, antitrust, intellectual property and other issues. Litigation is subject to inherent uncertainties, and unfavorable rulings could occur. An unfavorable ruling could include monetary damages or other adverse effects. Were an unfavorable ruling to occur, there exists the possibility of a material adverse impact on our business, financial position and results of operations for the period in which the ruling occurred or future periods.
We may incur product liability claims which could be costly and could harm our reputation.
The sale of our products subjects us to the risk of product liability claims. We have also been increasing our focus on sales of our proprietary Ventev® products and on providing an increased level of support services, including product and network designs, which also subjects us to risk of product liability and performance claim risk. We seek to allocate product liability risk to our suppliers where available, but may not be successful in doing so. We currently maintain product liability insurance, but our product liability insurance coverage is subject to various coverage exclusions and limits and may not be obtainable in the future on terms acceptable to us, or at all. We do not know whether claims against us with respect to our products and services, if any, would be successfully defended or whether we might be successful in allocating that risk to others, or whether our insurance would be sufficient to cover liabilities resulting from such claims. Any claims successfully brought against us could adversely affect our financial condition, and if substantial and relating to our products or industry generally, could adversely affect our business as a whole.
22
Our expanding offering of private labeled products may have a negative impact on our relationship with our manufacturer partners.
Our product offering includes a growing number of our own proprietary products, which represented approximately 11% of our sales in fiscal year 2020. Our proprietary products often compete with other manufacturers' branded items that we offer. A manufacturer may choose to not sell its products to us, or may substantially increase the price of products to us, in response to the competition created by the sales of our proprietary branded products. Either could have an adverse effect on our business and financial performance.
A significant portion of our product offerings, including a majority of our private label Ventev products and products we acquire from our suppliers, are manufactured in foreign countries, making the price and availability of these products susceptible to international trade risks and other international conditions.
A significant portion of our products are manufactured in foreign countries, including Vietnam and China. The countries, specifically Mexico and China, in which many of our products currently are manufactured or may be manufactured in the future are or could become subject to trade restrictions imposed by the U.S., including increased tariffs or quotas, embargoes and customs restrictions, which would increase the cost or could reduce the supply of products available to us, and could have a material adverse effect on our business, financial condition and results of operations. Recently, uncertainty has increased regarding tax and trade policies, border adjustments, tariffs and government regulations affecting trade between the U.S. and other countries, such as Mexico and China. This includes the imposition of tariffs or penalties on products manufactured outside the U.S., including the May 9, 2019 announcement of the United States government’s imposition of a 25% tariff on a range of products exported from China to the U.S. on or after May 10, 2019. China thereafter announced a plan to impose tariffs on imports to China of a wide range of American products, in retaliation for the American tariffs. In January 2020, China and the U.S. entered the first phase of an economic and trade agreement. There is no assurance that a broader trade agreement will be successfully negotiated between the U.S. and China to reduce or eliminate existing tariffs applicable to the business of the Company.
There is also a concern that the imposition of additional tariffs by the United States could result in the adoption of tariffs by other countries as well. Such tariffs on imports from foreign countries, as well as changes in tax and trade policies, such as a border adjustment tax or disallowance of certain tax deductions for imported product, could materially increase our manufacturing costs, the costs of our imported products or our income tax expense, which would have a material adverse effect on our financial condition and results of operations. Tariffs imposed by China or other foreign countries on imports of our products could also adversely affect our international e-commerce sales. Any increase in manufacturing costs, the cost of our products or limitation on the amount of products we are able to purchase, could have a material adverse effect on our financial condition and results of operations. Unless we are able to sufficiently mitigate their effects as applicable to us, the persistence or increase of tariffs, may adversely affect us or our business.
23
Legislative or regulatory action could be taken that could limit our ability to use certain foreign suppliers to supply us with products.
Members of the U.S. Congress and certain regulatory agencies have raised concerns about American companies purchasing equipment and software from Chinese telecommunications companies, including concerns relating to alleged violations of intellectual property rights by Chinese companies and potential security risks posed by U.S. companies purchasing technical equipment and software from Chinese companies. In October 2012, the U.S. House of Representatives Permanent Select Committee on Intelligence issued a report asserting that network equipment manufactured by Chinese telecommunications companies poses a security threat to the United States and recommending the use of other network suppliers. The report also recommends that Congress consider adopting legislation to address these and other purported risks. Any such legislative or regulatory requirement that restricts us from purchasing or utilizing equipment or software from Chinese or other foreign companies with which we do or seek to do business, any determination by foreign companies upon which we rely to cease doing business in the United States, any determination by any of our suppliers or customers not to do business with us on account of actual or perceived business relationships that we may have with these suspect Chinese or other foreign companies, or any determination that we otherwise make that it is either necessary or advantageous for us to cease doing business with such foreign companies, could limit our product offerings, result in increased costs of goods and have a material adverse effect on our financial condition and results of operations.
Claims that our products infringe the proprietary rights of others could harm our business and cause us to incur significant costs.
Our industry has increasingly been subject to patent and other intellectual property rights litigation. We expect this trend to continue and accelerate and expect that we may be required to defend against this type of litigation, not only asserted against our own intellectual property rights, but also against the intellectual property of products which we have purchased for resale. Further, we may be obligated to indemnify and defend our customers if the products or services we supply to them are alleged to infringe a third party’s intellectual property rights. While we may be able to seek indemnification from our suppliers to protect our customers and us from such claims, there is no assurance that we will be successful in negotiating contractual terms with our suppliers to provide for such indemnification, or that we will otherwise be successful in obtaining such indemnification or that we will be protected from such claims. We may also be prohibited from marketing products, could be forced to market products without desirable features, or could incur substantial costs to defend legal actions, including where third parties claim that we or suppliers who may or may not have indemnified us are infringing upon their intellectual property rights. In recent years, individuals and groups have begun purchasing intellectual property assets for the sole purpose of making claims of infringement and attempting to extract settlements from target companies. Even if we believe that such infringement claims are without merit, the claims can be time-consuming and costly to defend and divert management’s attention and resources away from our business. Claims of intellectual property infringement may require us to enter into costly settlements or pay costly damage awards, or face a temporary or permanent injunction prohibiting us from marketing or selling certain products or services, which could affect our ability to compete effectively. If an infringement claim is successful, we may be required to pay damages or seek royalty or license arrangements, which may not be available on commercially reasonable terms. Even if we have an agreement that indemnifies us against such costs, the indemnifying party may be unable or unwilling to uphold its contractual obligations to us.
We may be adversely affected by laws or regulations.
We are subject to various U.S. Federal, state and local, and non-U.S. laws and regulations. We cannot predict the substance or impact of pending or future legislation or regulations, or the application thereof. The introduction of new laws or regulations or changes in existing laws or regulations, or the interpretations thereof, could increase the cost of doing business for us or our customers or suppliers or restrict our actions and adversely affect our financial condition, operating results and cash flows. For example, annual disclosure and reporting requirements relating to the SEC’s conflict minerals rule require us to perform a reasonable country of origin inquiry and conduct further due diligence measures on our supply chain. There are costs and uncertainties associated with complying with these disclosure requirements, including for diligence to determine the sources of conflict minerals that we may find to be used in our products.
24
RISKS RELATED TO OWNERSHIP OF OUR COMMON STOCK
A significant portion of our voting stock is controlled by our executive officers, directors and beneficial owners of 5% or more of our common stock.
Our executive officers, directors and beneficial owners of 5% or more of our common stock and their affiliates, in the aggregate, beneficially owned approximately 58% of our outstanding common stock as of March 29, 2020. Robert B. Barnhill, Jr., our Chairman of the Board, beneficially owned approximately 19% of our outstanding common stock as of March 29, 2020. These shareholders, and particularly if they decide to act together, have or would have the ability to significantly influence all matters requiring shareholder approval, including the election of directors and any significant corporate transaction requiring shareholder approval.
Effective as of the first quarter of fiscal 2021, our Board of Directors suspended our quarterly cash dividend. We may not be able to pay dividends on our common stock in the future, which could impair the value of our common stock.
Effective as of the first quarter of fiscal 2021, our Board of Directors suspended our quarterly cash dividend. We had paid a quarterly dividend on our common stock beginning with the second quarter of fiscal year 2010. Any future declaration of dividends remains subject to further determination from time to time by our Board of Directors. Our ability to pay dividends in the future will depend on our financial results, liquidity and financial condition, and a determination by our Board of Directors that the payment of dividends is then appropriate. Under Delaware law, dividends to shareholders may be made only from the surplus of a company, or, in certain situations, from the net profits for the current fiscal year or the fiscal year before which the dividend is declared. Our secured revolving credit facility restricts our ability to pay cash dividends upon a default, and when our borrowing availability is below $15.0 million, or in certain more limited circumstances $11.3 million, and contains other financial covenants and ratios that could restrict future dividend payments. There is no assurance that we will or will be able to pay dividends at any time in the future, or if we are able to, that our Board of Directors will determine to declare dividends in the future, at previous rates or at all. If we begin at some future date to pay dividends and then discontinue or reduce the amount or frequency of any such dividends, the value of our common stock may be impaired.
Our quarterly financial results may fluctuate, which could lead to volatility in our stock price.
Our revenue and operating results have fluctuated from quarter to quarter in the past and may continue to do so in the future. As a result, you should not rely on quarter-to-quarter comparisons of our operating results as an indication of our future performance. Fluctuations in our revenue and operating results could negatively affect the trading price of our stock. Most of our operating expenses, such as compensation expenses, do not vary directly with the amount of sales and are difficult to adjust in the short term. As a result, if sales in a particular quarter are below expectations for that quarter, we may not proportionately reduce operating expenses for that quarter, and therefore such a sales shortfall would have a disproportionate effect on our net income for the quarter. Therefore, our revenue and results of operations may, in the future, be below the expectations of analysts and investors, which could cause our stock price to decline. Factors that are likely to cause our revenue and operating results to fluctuate include the risk factors discussed throughout this section.
Without approval of our Board of Directors, it may be difficult for a third party to acquire control of the Company. This could affect the price of our common stock.
Certain provisions of our certificate of incorporation and bylaws, including advance notice bylaws, and applicable provisions of the Delaware General Corporation Law (DGCL) may each make it more difficult for or may prevent a third party from acquiring control of us or changing our Board of Directors and management. We are afforded the protections of Section 203 of the DGCL, which will prevent us from engaging in a business combination with a person who acquires at least 15% of our common stock for a period of three years from the date such person acquired such common stock, unless Board of Director or shareholder approval were obtained. Some believe that the provisions described above, as well as any resulting delay or prevention of a change of control transaction or changes in our Board of Directors or management, could deter potential acquirers or prevent the completion of a transaction in which our shareholders could receive a substantial premium over the then current market price for their shares. We, on the other hand, believe that these provisions serve to protect our shareholders against abusive takeover tactics, to preserve and maximize the value of the Company for
25
all shareholders, and to better ensure that each shareholder will be treated fairly in the event of an unsolicited offer to acquire the Company.
Potential uncertainty resulting from unsolicited acquisition proposals and related matters may adversely affect our business.
In the past we have received, and in the future, we may receive, unsolicited proposals to acquire our company or our assets. For example, in September 2010, the Board of Directors received an unsolicited non-binding proposal for the acquisition of all of our stock. The review and consideration of acquisition proposals and related matters could require the expenditure of significant management time and personnel resources. Such proposals may also create uncertainty for our employees, customers and suppliers. Any such uncertainty could make it more difficult for us to retain key employees and hire new talent, and could cause our customers and suppliers to not enter into new arrangements with us or to terminate existing arrangements. Additionally, we and members of our Board of Directors could be subject to future lawsuits related to unsolicited proposals to acquire us. Any such future lawsuits could become time consuming and expensive.
Item 1B. Unresolved Staff Comments.
None.
Our corporate headquarters and primary distribution center, known as the Global Logistics Center (GLC), is located in a Company-owned 184,000 square-foot facility north of Baltimore City, in Hunt Valley, Maryland.
Our sales, marketing and administrative offices are located in 102,200 square feet of leased office space near the GLC, in Timonium, Maryland. The monthly rent payments range from $179,700 to $203,800 throughout the remaining lease term, which expires on December 31, 2025.
In addition, we lease 66,000 square feet of office and warehouse space adjacent to the GLC in Hunt Valley, Maryland. The monthly rent for this facility ranges from $39,300 to $43,000 throughout the remaining lease term, which expires on July 31, 2023, subject to our annual option to terminate.
Additional sales and marketing offices are located in 13,100 square feet of leased office space in San Antonio, Texas. Monthly rent payments range from $18,600 to $19,100 and the lease expires October 31, 2021.
West coast sales and fulfillment are facilitated by our Company-owned 115,000 square-foot Americas Sales & Logistics Center (ALC) located in Reno, Nevada. The ALC is used to configure and fulfill product and supply chain solutions, provide disaster backup for the GLC, and allow for future growth of staffing and increased fulfillment capabilities.
While we anticipate the need for additional space, we believe our existing facilities are generally adequate for our current requirements and that suitable additional space will be available as needed to accommodate future expansion of our operations.
Lawsuits and claims are filed against us from time to time in the ordinary course of business. We do not believe that any lawsuits or claims currently pending against the Company, individually or in the aggregate, are material, or will have a material adverse effect on our financial condition or results of operations. In addition, from time to time, we are also subject to review from federal and state taxing authorities in order to validate the amounts of income, sales and/or use taxes which have been claimed and remitted. Currently, our California sales tax returns for the period January 1, 2016 through December 31, 2018 and Illinois sales tax returns for the period March 1, 2018 through July 31, 2018 are under examination by applicable taxing authorities.
26
As we are routinely audited by state taxing authorities, we have estimated exposure and established reserves for our estimated sales tax audit liability.
Item 4. Mine Safety Disclosures
Not applicable.
27
Item 5. Market for Registrant's Common Equity, Related Stockholder Matters and Issuer Purchases of Equity Securities.
Our common stock has been publicly traded since September 28, 1994, on the Nasdaq Market (currently Nasdaq Global Select), under the symbol "TESS."
As of May 29, 2020, the number of shareholders of record of the Company was 162. We estimate that the number of beneficial owners as of that date was approximately 3,049.
On July 28, 2009, we announced that our Board of Directors had decided to commence a cash dividend program and thereafter our Board of Directors declared dividends on a quarterly basis, through the fourth quarter of fiscal 2020. On April 28, 2020, the Board of Directors suspended Tessco’s dividend in an effort to further strengthen its cash position as the Company continues to monitor and address the effects of the COVID-19 pandemic. Any future declaration of dividends and the establishment of any corresponding record and payment dates remains subject to further determination from time to time by the Board of Directors. Additional information with respect to the quarterly dividends declared in fiscal years 2020 and 2019 is contained in our Selected Financial Data. The declaration and payment of future dividends will depend on many factors, including, but not limited to, our earnings, financial condition, business development needs and regulatory considerations, and is at the discretion of our Board of Directors. Our revolving credit facility may limit the amount of cash dividends that we may pay based on financial covenants and ratios that may restrict the future payment of dividends.
We also withhold shares from our employees and directors from time to time to facilitate employees’ minimum federal and state tax withholdings related to vested performance stock units, restricted stock and exercised stock options. For fiscal years 2020 and 2019 the total value of shares withheld for taxes were $201,000 and $111,000, respectively.
Our secured revolving credit facility with SunTrust Bank restricts our ability to pay dividends and to repurchase our shares, either upon a default or when our borrowing availability is below $15.0 million, or in certain more limited circumstances $11.3 million, and also limits to $2.0 million the aggregate dollar value of shares that may be withheld or repurchased in connection with satisfaction of tax withholding obligations related to vested equity grants during any 12 month period. This revolving credit facility also contains other financial covenants and ratios that could restrict dividends and repurchases. At March 29, 2020 we had the ability to withhold or repurchase $1.8 million in additional shares of our common stock during fiscal 2020, without violating this covenant.
The information required by Item 201(d) of Regulation S-K, pursuant to paragraph (a) of Item 5 of Form 10-K, is incorporated by reference to the information set forth under the caption “Equity Compensation Plan Information” in the Company’s Proxy Statement for the 2020 Annual Meeting of Shareholders, which is anticipated to be filed pursuant to Regulation 14A no later than one hundred twenty (120) days following the end of the fiscal year reported on.
28
Stock Performance Graph
The graph set forth below shows the value of an investment of $100 on March 29, 2015 in each of the Company’s common stock, the Russell 2000 Index and a peer group for the period of March 29, 2015 to March 29, 2020. The graph assumes that all dividends, if any, were reinvested.
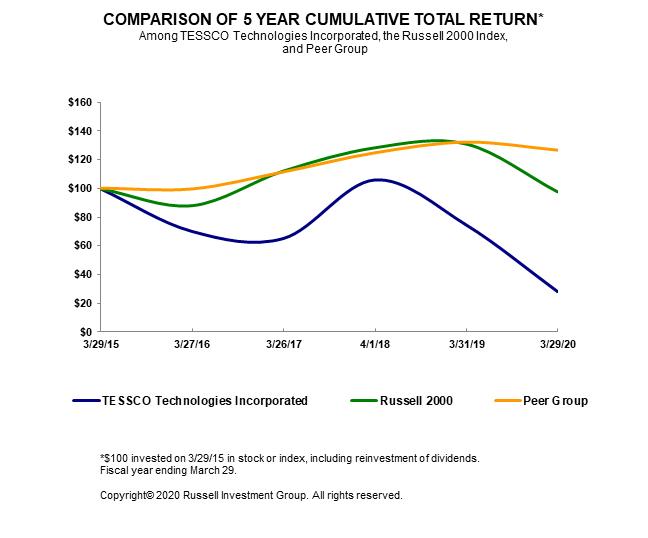
|
|
|
3/29/2015 |
|
3/27/2016 |
|
3/26/2017 |
|
4/1/2018 |
|
3/31/2019 |
|
3/29/2020 |
|
||||||
|
TESSCO Technologies Incorporated |
|
$ |
100.00 |
|
$ |
70.30 |
|
$ |
65.37 |
|
$ |
106.21 |
|
$ |
74.84 |
|
$ |
28.33 |
|
|
Russell 2000 |
|
|
100.00 |
|
|
88.25 |
|
|
112.38 |
|
|
128.62 |
|
|
131.25 |
|
|
97.88 |
|
|
Peer Group (1) |
|
|
100.00 |
|
|
99.43 |
|
|
111.42 |
|
|
124.82 |
|
|
132.34 |
|
|
126.73 |
|
(1) – The Peer Group consists of the following: Anixter International Inc., ScanSource Inc., Tech Data Corp and W.W. Grainger Inc.
The peer group was selected based on a review of publicly available information about these companies and the Company’s determination that they are engaged in business similar to that of the Company.
29
Item 6. Selected Financial Data.
|
|
|
Fiscal Years Ended |
|
|||||||||||||
|
|
|
March 29, 2020 |
|
March 31, 2019 |
|
April 1, 2018 |
|
March 26, 2017 |
|
March 27, 2016 |
|
|||||
|
STATEMENT OF |
|
|
|
|
|
|
|
|
|
|
|
|
|
|
|
|
|
Revenues |
|
$ |
540,298,300 |
|
$ |
606,813,800 |
|
$ |
580,274,700 |
|
$ |
533,295,100 |
|
$ |
530,682,100 |
|
|
Cost of goods sold |
|
|
448,475,300 |
|
|
485,455,100 |
|
|
460,046,300 |
|
|
421,527,300 |
|
|
418,716,200 |
|
|
Gross profit |
|
|
91,823,000 |
|
|
121,358,700 |
|
|
120,228,400 |
|
|
111,767,800 |
|
|
111,965,900 |
|
|
Selling, general and administrative expenses |
|
|
107,814,700 |
|
|
113,213,700 |
|
|
112,326,700 |
|
|
108,416,300 |
|
|
102,932,300 |
|
|
Goodwill impairment |
|
|
11,677,700 |
|
|
— |
|
|
— |
|
|
— |
|
|
— |
|
|
Restructuring charge |
|
|
488,000 |
|
|
— |
|
|
— |
|
|
806,600 |
|
|
— |
|
|
Operating expenses |
|
|
119,980,400 |
|
|
113,213,700 |
|
|
112,326,700 |
|
|
109,222,900 |
|
|
102,932,300 |
|
|
(Loss) income from operations |
|
|
(28,157,400) |
|
|
8,145,000 |
|
|
7,901,700 |
|
|
2,544,900 |
|
|
9,033,600 |
|
|
Interest, net |
|
|
1,116,300 |
|
|
853,800 |
|
|
429,100 |
|
|
58,600 |
|
|
161,300 |
|
|
(Loss) income before provision for income taxes |
|
|
(29,273,700) |
|
|
7,291,200 |
|
|
7,472,600 |
|
|
2,486,300 |
|
|
8,872,300 |
|
|
(Benefit from) provision for income taxes |
|
|
(7,704,800) |
|
|
1,745,400 |
|
|
2,277,200 |
|
|
1,041,200 |
|
|
3,531,800 |
|
|
Net (loss) income |
|
$ |
(21,568,900) |
|
$ |
5,545,800 |
|
$ |
5,195,400 |
|
$ |
1,445,100 |
|
$ |
5,340,500 |
|
|
Diluted (loss) earnings per share |
|
$ |
(2.53) |
|
$ |
0.65 |
|
$ |
0.61 |
|
$ |
0.17 |
|
$ |
0.65 |
|
|
Cash dividends declared per common share |
|
$ |
0.62 |
|
$ |
0.80 |
|
$ |
0.80 |
|
$ |
0.80 |
|
$ |
0.80 |
|
|
Percentage of Revenues |
|
|
|
|
|
|
|
|
|
|
|
|
|
|
|
|
|
Revenues |
|
|
100.0 |
% |
|
100.0 |
% |
|
100.0 |
% |
|
100.0 |
% |
|
100.0 |
% |
|
Cost of goods sold |
|
|
83.0 |
|
|
80.0 |
|
|
79.3 |
|
|
79.0 |
|
|
78.9 |
|
|
Gross profit |
|
|
17.0 |
|
|
20.0 |
|
|
20.7 |
|
|
21.0 |
|
|
21.1 |
|
|
Selling, general and administrative expenses |
|
|
20.0 |
|
|
18.7 |
|
|
19.4 |
|
|
20.3 |
|
|
19.4 |
|
|
Goodwill impairment |
|
|
2.2 |
|
|
— |
|
|
— |
|
|
— |
|
|
— |
|
|
Restructuring charge |
|
|
0.1 |
|
|
— |
|
|
— |
|
|
0.2 |
|
|
— |
|
|
Operating expenses |
|
|
22.2 |
|
|
18.7 |
|
|
19.4 |
|
|
20.5 |
|
|
19.4 |
|
|
(Loss) income from operations |
|
|
(5.2) |
|
|
1.3 |
|
|
1.4 |
|
|
0.5 |
|
|
1.7 |
|
|
Interest, net |
|
|
0.2 |
|
|
0.1 |
|
|
0.1 |
|
|
— |
|
|
— |
|
|
(Loss) income before provision for income taxes |
|
|
(5.4) |
|
|
1.2 |
|
|
1.3 |
|
|
0.5 |
|
|
1.7 |
|
|
(Benefit from) provision for income taxes |
|
|
(1.4) |
|
|
0.3 |
|
|
0.4 |
|
|
0.2 |
|
|
0.7 |
|
|
Net (loss) income |
|
|
(4.0) |
% |
|
0.9 |
% |
|
0.9 |
% |
|
0.3 |
% |
|
1.0 |
% |
|
|
|
Fiscal Years Ended |
|
||||||||
|
|
|
March 29, 2020 |
|
March 31, 2019 |
|
April 1, 2018 |
|
March 26, 2017 |
|
March 27, 2016 |
|
|
SELECTED OPERATING DATA |
|
|
|
|
|
|
|
|
|
|
|
|
Average non-consumer buyers per month |
|
8,500 |
|
10,500 |
|
11,600 |
|
12,500 |
|
12,200 |
|
|
Return on assets (1) |
|
(10.4) |
% |
2.7 |
% |
2.8 |
% |
0.8 |
% |
3.0 |
% |
|
Return on equity (2) |
|
(22.4) |
% |
5.1 |
% |
4.8 |
% |
1.3 |
% |
4.7 |
% |
30
|
|
|
As of Fiscal Years Ended |
|
|||||||||||||
|
|
|
March 29, 2020 |
|
March 31, 2019 |
|
April 1, 2018 |
|
March 26, 2017 |
|
March 27, 2016 |
|
|||||
|
BALANCE SHEET DATA |
|
|
|
|
|
|
|
|
|
|
|
|
|
|
|
|
|
Working capital |
|
$ |
51,164,700 |
|
$ |
74,636,000 |
|
$ |
74,789,400 |
|
$ |
77,194,500 |
|
$ |
82,523,600 |
|
|
Total assets |
|
|
208,708,700 |
|
|
206,495,800 |
|
|
199,423,700 |
|
|
173,980,500 |
|
|
169,416,000 |
|
|
Short-term debt |
|
|
25,563,900 |
|
|
14,380,400 |
|
|
10,862,700 |
|
|
26,500 |
|
|
251,100 |
|
|
Long-term debt |
|
|
— |
|
|
— |
|
|
2,300 |
|
|
29,800 |
|
|
1,706,500 |
|
|
Shareholders' equity |
|
|
83,702,700 |
|
|
108,787,200 |
|
|
108,051,600 |
|
|
108,016,300 |
|
|
112,527,300 |
|
|
(1) |
Net income divided by the average total assets. |
|
(2) |
Net income divided by the average total equity. |
Item 7. Management's Discussion and Analysis of Financial Condition and Results of Operations.
This Management’s Discussion and Analysis of Results of Operations and Financial Condition (MD&A) should be read in conjunction with the other sections of this Annual Report on Form 10-K, including Part I, “Item 1: Business,” Part II, “Item 6: Selected Financial Data,” and Part II, “Item 8: Financial Statements and Supplementary Data.” The various sections of this MD&A contain a number of forward-looking statements, all of which are based on our current expectations and could be affected by the uncertainties and risk factors described throughout this filing, including Part I, “Item 1A: Risk Factors.” Our actual results may differ materially from those described in any such forward-looking statement.
Business Overview and Environment
TESSCO Technologies Incorporated (“Tessco”, “we”, “our”, “us”, or the “Company”) architects and delivers innovative product and value chain solutions to support wireless systems. Although we sell products to customers in almost 100 countries, approximately 96% of our sales are to customers in the United States. We have operations and office facilities in Timonium and Hunt Valley, Maryland, Reno, Nevada and San Antonio, Texas.
The Company evaluates its business within two segments: commercial and retail. The commercial segment consists of the following customer markets: (1) public carriers that are generally responsible for building and maintaining the infrastructure system and provide airtime service to individual subscribers; (2) value-added resellers and integrators, which includes value-added resellers, government channels and private system operator markets. The retail segment includes retailers, independent dealer agents and carriers. Retail inventory typically has a shorter more defined life cycle and is, typically, ultimately used by individual end users. Commercial inventory typically has a life cycle that tends to be tied to changes in regulation or technology and includes products typically used by business entities or governments.
We offer a wide range of products that are classified into four categories: base station infrastructure; network systems; installation, test and maintenance; and mobile devices and accessories. Base station infrastructure products are used to build, repair and upgrade wireless telecommunications. Sales of traditional base station infrastructure products, such as base station radios, cable and transmission lines and antennas are in part dependent on capital spending in the wireless communications industry. Network systems products are used to build and upgrade computing and internet networks. In this category, we have also been growing our offering of wireless broadband, network equipment, security and surveillance products, which are not as dependent on the overall capital spending of the industry. Installation, test and maintenance products are used to install, tune, and maintain wireless communications equipment. This category is made up of sophisticated analysis equipment and various frequency-, voltage- and power-measuring devices, replacement parts and components as well as an assortment of tools, hardware and supplies required by service technicians. Mobile devices and accessory products include cellular phone and data device accessories. Our customers generally have the ability to purchase from any of our product categories.
The wireless communications distribution industry is competitive and fragmented, and is comprised of several national distributors. In addition, many manufacturers sell direct. Barriers to entry for distributors are relatively low, particularly in the mobile devices and accessory market, and the risk of new competitors entering the market is high. Consolidation of larger wireless carriers has and will most likely continue to impact our current and potential customer base. In addition, the agreements or arrangements with our customers or suppliers looking to us for product and supply chain solutions are typically of limited duration and are terminable by either party upon several months or otherwise short
31
notice. Our ability to maintain these relationships is subject to competitive pressures and challenges. We believe, however, that our strength in service, the breadth and depth of our product offering, our information technology system, our large customer base and our purchasing relationships with approximately 350 manufacturers provide us with a significant competitive advantage over new entrants to the market.
Results of Operations
The following tables summarize the results of our operations for fiscal years 2020, 2019 and 2018:
|
(Dollars in thousands, except per share data) |
|
|
|
|
|
|
|
2019 to 2020 |
|
|
|
|
2018 to 2019 |
|
||||||
|
|
|
2020 |
|
2019 |
|
$ Change |
|
% Change |
|
2018 |
|
$ Change |
|
% Change |
|
|||||
|
Segment Revenues |
|
|
|
|
|
|
|
|
|
|
|
|
|
|
|
|
|
|
|
|
|
Commercial Segment: |
|
|
|
|
|
|
|
|
|
|
|
|
|
|
|
|
|
|
|
|
|
Public Carriers |
|
$ |
156,396 |
|
$ |
156,983 |
|
$ |
(587) |
|
(0.4) |
% |
$ |
115,061 |
|
$ |
41,922 |
|
36.4 |
% |
|
Value-added resellers and integrators |
|
|
252,619 |
|
|
262,062 |
|
|
(9,443) |
|
(3.6) |
% |
|
270,615 |
|
|
(8,553) |
|
(3.2) |
% |
|
Total Commercial Revenues |
|
|
409,015 |
|
|
419,045 |
|
|
(10,030) |
|
(2.4) |
% |
|
385,676 |
|
|
33,369 |
|
8.7 |
% |
|
Retail Segment: |
|
|
|
|
|
|
|
|
|
|
|
|
|
|
|
|
|
|
|
|
|
Retail |
|
|
131,283 |
|
|
187,769 |
|
|
(56,486) |
|
(30.1) |
% |
|
194,599 |
|
|
(6,830) |
|
(3.5) |
% |
|
Total Revenues |
|
$ |
540,298 |
|
$ |
606,814 |
|
$ |
(66,516) |
|
(11.0) |
% |
$ |
580,275 |
|
$ |
26,539 |
|
4.6 |
% |
|
|
|
|
|
|
|
|
|
|
|
|
|
|
|
|
|
|
|
|
|
|
|
|
|
|
|
|
|
|
|
2019 to 2020 |
|
|
|
|
2018 to 2019 |
|
||||||
|
|
|
2020 |
|
2019 |
|
$ Change |
|
% Change |
|
2018 |
|
$ Change |
|
% Change |
|
|||||
|
Segment Gross Profit |
|
|
|
|
|
|
|
|
|
|
|
|
|
|
|
|
|
|
|
|
|
Commercial Segment: |
|
|
|
|
|
|
|
|
|
|
|
|
|
|
|
|
|
|
|
|
|
Public Carriers |
|
$ |
18,699 |
|
$ |
20,275 |
|
$ |
(1,576) |
|
(7.8) |
% |
$ |
16,707 |
|
$ |
3,568 |
|
21.4 |
% |
|
Value-added resellers and integrators |
|
|
60,943 |
|
|
64,130 |
|
|
(3,187) |
|
(5.0) |
% |
|
64,620 |
|
|
(490) |
|
(0.8) |
% |
|
Total Commercial Gross Profit |
|
|
79,642 |
|
|
84,405 |
|
|
(4,763) |
|
(5.6) |
% |
|
81,327 |
|
|
3,078 |
|
3.8 |
% |
|
Retail Segment: |
|
|
|
|
|
|
|
|
|
|
|
|
|
|
|
|
|
|
|
|
|
Retail |
|
|
12,181 |
|
|
36,954 |
|
|
(24,773) |
|
(67.0) |
% |
|
38,901 |
|
|
(1,947) |
|
(5.0) |
% |
|
Total Gross Profit |
|
|
91,823 |
|
|
121,359 |
|
|
(29,536) |
|
(24.3) |
% |
|
120,228 |
|
|
1,131 |
|
0.9 |
% |
|
|
|
|
|
|
|
|
|
|
|
|
|
|
|
|
|
|
|
|
|
|
|
Selling, general and administrative expenses |
|
|
107,815 |
|
|
113,214 |
|
|
(5,399) |
|
(4.8) |
% |
|
112,327 |
|
|
887 |
|
0.8 |
% |
|
Goodwill impairment |
|
|
11,678 |
|
|
— |
|
|
11,678 |
|
100.0 |
% |
|
— |
|
|
— |
|
— |
|
|
Restructuring Charge |
|
|
488 |
|
|
— |
|
|
488 |
|
100.0 |
% |
|
— |
|
|
— |
|
— |
|
|
Operating Expenses |
|
|
119,980 |
|
|
113,214 |
|
|
6,767 |
|
6.0 |
% |
|
112,327 |
|
|
887 |
|
0.8 |
% |
|
(Loss) income from operations |
|
|
(28,157) |
|
|
8,145 |
|
|
(36,303) |
|
(445.7) |
% |
|
7,901 |
|
|
244 |
|
3.1 |
% |
|
Interest, net |
|
|
1,116 |
|
|
854 |
|
|
262 |
|
30.6 |
% |
|
429 |
|
|
425 |
|
99.0 |
% |
|
(Loss) income before provision for income taxes |
|
|
(29,274) |
|
|
7,291 |
|
|
(36,564) |
|
(501.5) |
% |
|
7,472 |
|
|
(181) |
|
(2.4) |
% |
|
(Benefit from) provision for income taxes |
|
|
(7,705) |
|
|
1,745 |
|
|
(9,450) |
|
(541.4) |
% |
|
2,277 |
|
|
(532) |
|
(23.4) |
% |
|
Net (loss) income |
|
$ |
(21,569) |
|
$ |
5,545 |
|
|
(27,114) |
|
(489.0) |
% |
$ |
5,195 |
|
|
351 |
|
6.8 |
% |
|
|
|
|
|
|
|
|
|
|
|
|
|
|
|
|
|
|
|
|
|
|
|
Diluted (loss) earnings per share |
|
$ |
(2.53) |
|
$ |
0.65 |
|
$ |
(3.18) |
|
(489.2) |
% |
$ |
0.61 |
|
|
0.04 |
|
6.6 |
% |
32
Fiscal Year 2020 Compared to Fiscal Year 2019
Revenues. Revenue for fiscal year 2020 decreased by 11.0% as compared to fiscal year 2019. In the commercial segment, revenue decreased by 2.4%. Revenue in our public carrier market and value-added resellers and integrators market decreased by 0.4% and 3.6%, respectively. The decline in the commercial segment was primarily because we are not yet realizing the full benefits of our sales strategy refinements in the value-added resellers and integrators market. Revenues in our retail segment decreased by 30.1%. This decrease was largely driven by a combination of continued overall softness in our retail segment, significantly lower revenues from one of our more significant retail customers following its change in business model and subsequent transition of its business elsewhere, and the impact of COVID-19 in the fourth quarter of fiscal year 2020 that affected both of our business segments. We expect the challenges we have been facing in our retail segment to continue for the foreseeable future. We also expect the challenges we have been facing in our commercial segment to continue for the foreseeable future, but to a much lesser extent.
Cost of Goods Sold. Cost of goods sold for fiscal year 2020 decreased by 7.6% as compared to fiscal year 2019. In the commercial segment, cost of goods sold decreased by 1.6%. Cost of goods sold in our value-added resellers and integrators market decreased by 3.2%, partially offset by cost of goods sold increase in our public carrier market of 0.7%, The decline in the commercial segment was primarily due to a decrease in related revenue in the value-added resellers and integrators market. Cost of goods sold in our retail segment decreased by 21.0%. This decrease was largely driven by a decrease in retail segment revenue as discussed above. Cost of goods sold in the retail segment were also impacted by increased tariffs associated with imports of Ventev product from China, and inventory write-offs, including changes in inventory reserves, largely associated with the market softness, the discontinuance of several OEM phone devices and uncertainty caused by the COVID-19 pandemic. Total inventory write-offs, including changes in inventory reserves, were $14.9 million and $5.1 million for fiscal years 2020 and 2019, respectively.
The imposition of tariffs on products that we imported increased the costs of those products and adversely affected our gross profits and overall financial performance. A significant portion of our Ventev products are manufactured in foreign countries, including China and increasingly of late, Vietnam. On May 9, 2019, the United States government announced a 25% tariff on a range of products from China that are exported to the U.S. Responding to this, we have been successful in moving the manufacturing of a majority of our Ventev products out of China in an effort to mitigate tariff costs, but we will continue to incur additional tariff costs on product we have manufactured in, or component parts we continue to source from, China. In January 2020, China and the U.S. entered the first phase of an economic and trade agreement. There is no assurance that a broader trade agreement will be successfully negotiated between the U.S. and China to reduce or eliminate existing tariffs applicable to the business of the Company
Gross Profit. Gross profit decreased by 24.3% in fiscal year 2020 as compared to fiscal year 2019. This compares to a decline in revenue of 11.0% in fiscal year 2020 as compared to fiscal year 2019. In the commercial segment, gross profit decreased from 20.1% to 19.5%. Within our commercial segment, gross profit in our public carrier market and value-added resellers and integrators market decreased from 12.9% to 12.0% and from 24.5% to 24.1%, respectively. We experienced margin compression within our public carrier market primarily due to a change in customer mix, with increased sales going to larger customers which require better pricing. Within the retail segment, gross profit decreased from 19.7% to 9.3% in fiscal year 2020 as compared to fiscal year 2019. This decrease in gross profit was a result of a decrease in retail revenue, increased tariff costs, and the inventory write-offs discussed above. As a result of these drivers on gross profit, overall gross profit margin decreased to 17.0% in fiscal year 2020, compared to 20.0% in fiscal year 2019.
As discussed above, the COVID-19 pandemic has had a material impact on our results of operations in fiscal 2020. Tessco’s distribution centers remain open and our office workers are largely working remotely. However, the COVID-19 pandemic has primarily impacted our retail segment as a result of store closures and lower foot traffic due to “stay at home” or similar orders in various states. Our commercial segment has also been impacted, but to a much lesser extent, due to delays in non-essential projects or inability of our customers to access project venues or locations. We have recorded incremental reserves in accounts receivable, inventory and sales returns, totaling approximately $6.1 million during the fourth quarter of fiscal 2020. We expect the COVID-19 pandemic to continue to have an impact on our revenues and gross profit, particularly in the retail segment for at least the first half of fiscal 2020, and possibly into future periods.
33
Our ongoing ability to earn revenues and gross profits from customers and suppliers looking to us for product and supply chain solutions is dependent upon a number of factors. The terms, and accordingly the factors, applicable to each relationship often differ. Among these factors are the strength of the customer’s or supplier’s business, the supply and demand for the product or service, including price stability, changing customer or supplier requirements, and our ability to support the customer or supplier and to continually demonstrate that we can improve the way they do business. In addition, the agreements or arrangements on which our customer and supplier relationships are based are typically of limited duration, typically do not include any obligation in respect of any specific product purchase or sale and are terminable by either party upon several months or otherwise short notice. Our customer relationships could also be affected by wireless carrier consolidation or global financial crisis, including the COVID-19 pandemic or other events beyond our control.
We account for inventory at the lower of cost or net realizable value and as a result write-offs/write-downs occur due to damage, deterioration, obsolescence, changes in prices and other causes. These expenses were 3% or less of overall purchases for each of the last three fiscal years.
Selling, General, Administrative and Restructuring Expenses. Total selling, general and administrative expenses decreased 4.8% during fiscal year 2020 as compared to fiscal year 2019. Total selling, general and administrative expenses as a percentage of revenues increased from 18.7% in fiscal year 2019 to 20.0% in fiscal year 2020. The following are descriptions of changes in significant components of selling, general, administrative, goodwill charges and restructuring expenses.
|
· |
Compensation and benefits expenses decreased by $4.0 million in fiscal year 2020 as compared to fiscal year 2019, mainly due to a decrease in variable compensation in both sales and operations related to the decline in overall revenues. |
|
· |
Performance bonus expense (including both cash and equity plans) decreased by $2.0 million in fiscal year 2020 as compared to fiscal year 2019. Our bonus programs are typically based on achieving annual performance targets. The relationship between expected performance and actual performance led to lower bonus expenses in fiscal 2020, as compared to fiscal 2019. |
|
· |
Freight out expense decreased by $2.7 million in fiscal year 2020 as compared to fiscal year 2019, due to lower sales volume. |
|
· |
Expenses related to information technology increased by $2.8 million in fiscal year 2020 as compared to fiscal year 2019, primarily due to increased cost to support our sales initiatives and to build more efficient and effective systems. |
The Company also incurred a $0.5 million restructuring charge related to severance expense for the first quarter of fiscal 2020, and a $11.7 million non-cash goodwill impairment loss during fiscal 2020. The goodwill impairment was due to the decline of results in fiscal year 2020 and future year projections, the significant reduction in our market capitalization during the second half of the fiscal year (due to decrease in stock price) and significant decline in market multiples considered in the market based valuation.
We continually evaluate the credit worthiness of our existing customer receivable portfolio and provide an appropriate reserve based on this evaluation. We also evaluate the credit worthiness of prospective and current customers and make decisions regarding extension of credit terms to such customers based on this evaluation. Accordingly, we recorded a provision for bad debts of $2,100,000 and $1,721,200 for fiscal year 2020 and fiscal year 2019, respectively. The increase in bad debts for fiscal year 2020 primarily relate to reserves recorded in the fourth quarter based on the uncertainly of the COVID-19 pandemic.
Interest, Net. Net interest expense increased from $853,800 in fiscal year 2019 to $1,116,300 in fiscal year 2020. The increase is primarily related to higher borrowing levels on our secured revolving credit facility. Refer to Note 6 of the financial statements included as part of this Annual Report on Form 10-K for additional information on our borrowings.
34
Income Taxes, Net Income and Diluted Earnings Per Share. The effective tax rates in fiscal year 2020 and 2019 were 26.3% and 23.9%, respectively. The increase in the effective tax rate is primarily a result of provisions in the recently enacted CARES Act which allows the Company to carry back certain net operating losses up to five years. These net operating losses were applied against net income that was taxed at a higher federal rate prior to the Tax Cuts & Jobs Act which was signed into law in December 2017 (the “2017 Tax Act”) and went into effect in the third quarter of fiscal 2018. The benefit of the carry back provision of the CARES Act was partially offset by valuation allowances recorded in fiscal year 2020 on the deferred tax assets. As a result of the factors discussed above, net income and diluted earnings per share for fiscal year 2020 decreased 488.9% and 489.2%, respectively, compared with fiscal year 2019.
Fiscal Year 2019 Compared to Fiscal Year 2018
Revenues. Revenue for fiscal year 2019 increased by 4.6% as compared to fiscal year 2018. In the commercial segment, revenue increased by 8.7% for fiscal year 2019 as compared to fiscal year 2018. Revenue in our public carrier market for fiscal year 2019 increased by 36.4% as compared to fiscal year 2018, largely due to increased spending among our Tier 1 public carrier and contractor customers, and also due in part to better execution of our selling strategy in this market. The growth was partially offset by a decline in the value-added resellers and integrators market by 3.2% for fiscal year 2019 as compared to fiscal year 2018. The revenue growth within our commercial segment was partially offset by a 3.5% decrease in our retail segment revenue for fiscal year 2019 as compared to fiscal year 2018. This decrease was due in part to lower sales of key phone launches and less retail store traffic.
Cost of Goods Sold. Cost of goods sold for fiscal year 2019 increased by 5.5% as compared to fiscal year 2018. In the commercial segment, cost of goods sold increased by 10.0% for fiscal year 2019 as compared to fiscal year 2018. Cost of goods sold in our public carrier market increased by 39.0% for fiscal year 2019 as compared to fiscal year 2018, largely due to increased spending among our Tier 1 public carrier and contractors customers. The growth was partially offset by a decline in the value-added resellers and integrators market of 3.9% for fiscal year 2019 as compared to fiscal year 2018. The cost of goods sold growth within our commercial segment was partially offset by a 3.1% decrease in our retail segment cost of goods sold for fiscal year 2019 as compared to fiscal year 2018. This decrease was due in part to lower sales of key phone launches and less retail store traffic.
Gross Profit. Gross profit increased by 0.9% in fiscal year 2019 as compared to fiscal year 2018. In the commercial segment, gross profit increased by 3.8%. This increase was primarily driven by increases in our public carrier market of 21.4% and was offset by a decrease in value-added resellers and integrators market of 0.8%. We experienced margin compression within our public carrier market primarily due to a change in customer mix, with increased sales going to larger customers which required better pricing. Within the retail segment, gross profit decreased by 5.0% in fiscal year 2019 as compared to fiscal year 2018. This decrease in gross margin was a result of product mix and the decrease in sales. Overall gross profit margin decreased to 20.0% in fiscal year 2019, compared to 20.7% in fiscal year 2018, primarily due to changes in customer mix, including the increase in lower margin sales in the public carrier market.
Selling, General, Administrative and Restructuring Expenses. Total selling, general, administrative and restructuring expenses increased 0.8% during fiscal year 2019 as compared to fiscal year 2018. Total selling, general, administrative and restructuring expenses as a percentage of revenues decreased from 19.4% in fiscal year 2018 to 18.7% in fiscal year 2019. The following are descriptions of changes in significant components of selling, general, administrative and restructuring expenses.
|
· |
Performance bonus expense (including both cash and equity plans) decreased by $1.1 million in fiscal year 2019 as compared to fiscal year 2018. Our bonus programs are typically based on achieving annual performance targets. The relationship between expected performance and actual performance led to lower bonus expenses in fiscal 2019, as compared to fiscal 2018. |
|
· |
Compensation and benefits expenses decreased by $0.9 million in fiscal year 2019 as compared to fiscal year 2018, mainly due to $0.8 million in severance costs related to a restructuring of our sales and product teams in fiscal year 2018. |
|
· |
Freight out expense increased by $1.7 million in fiscal year 2019 as compared to fiscal year 2018, due to our increased sales and higher freight costs from freight service providers. |
35
|
· |
Expenses related to information technology increased by $1.3 million in fiscal year 2019 as compared to fiscal year 2018 primarily due to increased cost to support our sales initiatives and to build more efficient and effective systems. |
We continually evaluate the credit worthiness of our existing customer receivable portfolio and provide an appropriate reserve based on this evaluation. We also evaluate the credit worthiness of prospective and current customers and make decisions regarding extension of credit terms to such customers based on this evaluation. Accordingly, we recorded a provision for bad debts of $1,721,200 and $797,100 for fiscal year 2019 and fiscal year 2018, respectively.
Interest, Net. Net interest expense increased from $429,100 in fiscal year 2018 to $853,800 in fiscal year 2019. The increase is primarily related to higher borrowing levels on our secured revolving credit facility. Refer to Note 6 the financial statements included as part of this Annual Report on Form 10-K for additional information on our borrowings.
Income Taxes, Net Income and Diluted Earnings Per Share. The effective tax rates in fiscal year 2019 and 2018 were 23.9% and 30.5%, respectively. The effective tax rate was lower for fiscal 2019, primarily due to the Tax Cuts & Jobs Act which was signed into law in December 2017 (the “2017 Tax Act”) and went into effect in the third quarter of fiscal 2018. As a result of the factors discussed above, net income and diluted earnings per share for fiscal year 2019 increased 6.7% and 6.6%, respectively, compared with fiscal year 2018.
Liquidity and Capital Resources
In summary, our cash flows were as follows:
|
|
|
|
|
|
|
|
|
|
|
|
|
|
|
2020 |
|
2019 |
|
2018 |
|
|||
|
Cash flow provided by (used in) operating activities |
|
$ |
908,200 |
|
$ |
8,246,700 |
|
$ |
(9,247,100) |
|
|
Cash flow used in investing activities |
|
|
(6,845,700) |
|
|
(5,164,700) |
|
|
(3,539,400) |
|
|
Cash flow provided by (used in) financing activities |
|
|
5,957,200 |
|
|
(3,071,100) |
|
|
4,265,800 |
|
|
Net increase (decrease) in cash and cash equivalents |
|
$ |
19,700 |
|
$ |
10,900 |
|
$ |
(8,520,700) |
|
We generated $0.9 million of net cash from operating activities during fiscal year 2020. This inflow was driven by net loss (net of depreciation and amortization, goodwill impairment loss, and non-cash stock compensation expense) and a decrease in accounts receivable, partially offset by an increase in prepaid expenses and an increase in deferred income taxes. Accounts receivable decreased due to the timing of sales at the end of the fourth quarter of fiscal year 2020 as compared to the fourth quarter of fiscal year 2019. Prepaid expenses increased due to an increase in prepaid income taxes. Due to the recently enacted CARES Act, the Company is able to carry back net operating losses up to five years and receive a refund of taxes paid in prior years.
We generated $8.2 million of net cash from operating activities during fiscal year 2019. This inflow was driven by net income (net of depreciation and amortization and non-cash stock compensation expense), an increase in accounts payable and a decrease in inventory, partially offset by an increase in accounts receivable. Accounts payable increased due to strategic purchase of inventory during the fourth quarter with extended terms to support our public carrier business. Inventory decreased due to an intentional reduction of overall inventory in line with our efforts to manage working capital. Accounts receivable increased due to the timing of sales at the end of the fourth quarter of fiscal year 2019 as compared to the fourth quarter of fiscal year 2018.
We used $9.2 million of net cash from operating activities during fiscal year 2018. This outflow was driven by increases in accounts receivable and inventory, partially offset by net income (net of depreciation and amortization and non-cash stock compensation expense), and an increase in accounts payable. Increasing sales to our public carrier customers required significant investments in inventory and at times resulted in larger accounts receivable balances. Accounts payable also increased in response to our higher inventory levels. Both current and potential opportunities within
36
our public carrier business required an increase in working capital investments. As such, on October 19, 2017 we entered into the Amended and Restated Credit Agreement, as discussed below, based upon our anticipated borrowing and cash needs.
Capital expenditures of $6.8 million in fiscal year 2020 were up from $5.2 million in fiscal year 2019 and from $3.5 million in fiscal year 2018. Fiscal year 2020, 2019 and 2018 capital expenditures were largely comprised of investments in information technology of $6.8 million, $4.4 million, and $2.8 million, respectively.
Cash flows generated from financing in fiscal year 2020 were primarily related to borrowings from our line of credit partially offset by cash dividends paid to shareholders. During the fourth quarter of fiscal year 2020, the Board of Directors decreased the cash dividend from $0.20 to $0.02 in order to reallocate resources to increase investment in the technology and talent to accelerate the Company’s long-term growth. Subsequent to fiscal year 2020, the Board of Directors suspended Tessco’s dividend to further strengthen its cash position as the Company continues to monitor and address the effects of the COVID-19 pandemic. Cash flows used in financing in fiscal year 2019 were primarily related to cash dividends paid to shareholders partially offset by borrowings from our line of credit. Cash flows generated from financing in fiscal year 2018 were primarily related to borrowings from our line of credit partially offset by cash dividends paid to shareholders.
On June 24, 2016, the Company and its primary operating subsidiaries entered into a Credit Agreement (the “Credit Agreement”) with SunTrust Bank, as Administrative Agent and Lender, and Wells Fargo Bank, National Association, as a Lender, for a senior asset based secured revolving credit facility of up to $35 million (the “Revolving Credit Facility”). This replaced our previously existing $35 million unsecured revolving credit facility with both SunTrust Bank and Wells Fargo Bank, National Association, which had no outstanding principal balance at the time of replacement. The replacement Revolving Credit Facility included terms providing for its maturity after five years, on June 24, 2021, and for a $5.0 million sublimit for the issuance of standby letters of credit and a $10.0 million sublimit for swing line loans. Borrowing Availability under the replacement Revolving Credit Facility as it was initially established is determined in part in accordance with a Borrowing Base, defined in the Credit Agreement, generally, as 85% of Eligible Receivables minus Reserves.
The Credit Agreement also set forth financial covenants, including a fixed charge coverage ratio to be maintained at any time during which the borrowing availability, as determined in accordance with the Credit Agreement, falls below $10 million, as well as terms that could limit our ability to engage in specified transactions or activities, including (but not limited to) investments and acquisitions, sales of assets, payment of dividends, issuance of additional debt and other matters.
Pursuant to a related Guaranty and Security Agreement by and among the Company, the other Company affiliate borrowers under the Credit Agreement and other subsidiaries of the Company, referred to collectively as the Loan Parties, and SunTrust Bank, as Administrative Agent, the Loan Parties’ obligations, which include the obligations under the Credit Agreement, were guaranteed by those Loan Parties not otherwise borrowers, and secured by continuing first priority security interests in the Company’s and the other Loan Parties’ (including both borrowers and guarantors) inventory, accounts receivable and deposit accounts, and in all documents, instruments, general intangibles, letter of credit rights and chattel paper, in each case to the extent relating to inventory and accounts, and all proceeds of the foregoing. The security interests were granted in favor of the Administrative Agent, for the benefit of the Lenders party to the Credit Agreement from time to time. The obligations secured also include certain other obligations of the Loan Parties to the Lenders and their affiliates arising from time to time, relating to swaps, hedges and cash management and other bank products.
Effective July 13, 2017, we entered into a First Amendment to Credit Agreement, pursuant to which, the term “Availability” as used in the Credit Agreement was amended for a period of time ending no later than October 31, 2017, to allow for the inclusion of an additional sum when calculating “Availability” for certain limited purposes. This additional sum equals the lesser of $10 million, and the amount by which the Borrowing Base exceeds $35 million. This First Amendment did not provide for any increase in the $35 million Aggregate Revolving Commitment Amount, but allowed the Company greater flexibility under the Credit Agreement for a limited period of time, until October 31, 2017, and was sought by the Company in response to business opportunities identified by the Company. Capitalized terms used but not otherwise defined in this and the preceding three paragraphs have the meanings ascribed to each in the Credit Agreement
37
or First Amendment, as applicable.
On October 19, 2017, the Company and its primary operating subsidiaries, as co-borrowers, entered into an Amended and Restated Credit Agreement with SunTrust Bank, as Administrative Agent and Lender, and Wells Fargo Bank, National Association, as a Lender (the “Amended and Restated Credit Agreement”). Pursuant to the Amended and Restated Credit Agreement, the Credit Agreement for the secured Revolving Credit Facility, as previously established in June 2016, was amended and restated in order to, among other things, increase the Company’s borrowing limit from up to $35 million to up to $75 million. Capitalized terms used but not otherwise defined in this and the following three paragraphs have the meanings ascribed to each in the Amended and Restated Credit Agreement.
In addition to expanding the borrowing limit, the Amended and Restated Credit Facility extended the applicable maturity date to October 19, 2021. The Amended and Restated Credit Agreement otherwise includes representations, warranties, affirmative and negative covenants (including restrictions) and other terms generally consistent with those applicable to the facility as existing prior to the execution and delivery of the Amended and Restated Credit Agreement, but with certain modifications. The Amended and Restated Credit Agreement provides for a $5.0 million sublimit for the issuance of standby letters of credit, a $12.5 million sublimit for swingline loans and an accordion feature which, subject to certain conditions, could increase the aggregate amount of the commitments to up to $125 million, with the optional commitments being provided by existing Lenders or new lenders reasonably acceptable to the Administrative Agent. No Lender is obligated to increase its commitment. Availability is determined in accordance with a Borrowing Base, which has been expanded to include not only Eligible Receivables but also Eligible Inventory and is generally: (A) the sum of (i) 85% of Eligible Receivables; (ii) the Inventory Formula Amount for all Eligible Inventory which is aged less than 181 days; and (iii) the lesser of (x) $4 million and (y) the Inventory Formula Amount for all Eligible Inventory which is aged at least 181 days; minus (B) Reserves. Upon closing, there was $23.4 million outstanding under the Amended and Restated Credit Agreement.
Like the secured Revolving Credit Facility as existing prior to the execution and delivery of the Amended and Restated Credit Agreement, borrowings under the secured Revolving Credit Facility as now evidenced by the Amended and Restated Credit Agreement initially accrue interest from the applicable borrowing date at an Applicable Rate equal to the Eurodollar Rate plus the Applicable Margin. The Eurodollar Rate is the rate per annum obtained by dividing (i) LIBOR by (ii) a percentage equal to 1.00 minus the Eurodollar Reserve Percentage. When the Applicable Rate is the Eurodollar Rate plus the Applicable Margin, the Applicable Margin is 1.50% if Average Availability is greater than or equal to $15 million, and 1.75% otherwise. Under certain circumstances, the Applicable Rate is subject to change at the Lenders’ option from the Eurodollar Rate plus the Applicable Margin to the Base Rate plus the Applicable Margin. In any event, following an Event of Default, in addition to changing the Applicable Rate to the Base Rate plus the Applicable Margin, the Lenders’ may at their option set the Applicable Margin at 0.50% if the Base Rate applies or 1.75% if the Eurodollar Rate applies, and increase the Applicable Rate by an additional 200 basis points. The Applicable Rate adjusts on the first Business Day of each calendar month. The Company is required to pay a monthly Commitment Fee on the average daily unused portion of the revolving credit facility provided for pursuant to the Amended and Restated Credit Agreement, at a per annum rate equal to 0.25%. As of March 29, 2020, we had a $25.6 million outstanding balance on the Revolving Credit Facility; therefore, we had $49.4 million available, subject to the Borrowing Base limitations and compliance with the other applicable terms of the Credit Agreement, including the covenants referenced above.
In connection with entering into the Amended and Restated Credit Agreement, the Company and the other Loan Parties executed and delivered to SunTrust Bank, as Administrative Agent, a Reaffirmation Agreement, pursuant to which the obligations of the Loan Parties under the Guaranty and Security Agreement delivered by the Loan Parties in connection with the secured credit facility as previously existing (including the previously existing guaranty by the Loan Parties not otherwise Borrowers and the previously existing grant by the Company and the other Loan Parties of a continuing first priority security interest in inventory, accounts receivable and deposit accounts, and on all documents, instruments, general intangibles, letter of credit rights, and all proceeds) were ratified and confirmed as respects the Obligations arising under the Amended and Restated Credit Facility from time to time.
At the end of fiscal year 2020, we were in compliance with the financial covenants applicable under our revolving credit facility with SunTrust Bank.
38
Working capital (current assets less current liabilities) decreased to $51.2 million as of March 29, 2020 as compared to $74.6 million as of March 31, 2019. Shareholders' equity was $83.7 million as of March 29, 2020, and $108.8 million as of March 31, 2019.
We believe that our existing cash, payments from customers, pending tax refunds and availability under our revolving credit facility (including any amendment or replacement thereof), or if needed, financing we believe would be available to us from other sources, will be sufficient to support our operations for at least the next twelve months. We expect to meet short-term liquidity needs through cash on our balance sheet and operating cash flow, supplemented by our revolving credit facility; and we expect to meet long-term liquidity needs through these same resources. If we were to undertake an acquisition or other major capital purchases that require funds in excess of our existing sources of liquidity, we would look to sources of funding from additional credit facilities, debt and/or equity issuances. There can be no assurances that such additional future sources of funding, either to fund an acquisition or major capital purchase, or to support our cash flow needs in the event of the termination of our existing revolving credit facility before it can be replaced with an asset based facility, would be available on terms acceptable to us, if at all.
In addition, our liquidity could be negatively impacted by decreasing revenues and profits resulting from a decrease in demand for our products or a reduction in capital expenditures by our customers, or by the weakened financial conditions of our customers or suppliers, in each case as a result of a possible downturn in the global economy, caused in part by the COVID-19 pandemic among other factors.
Contractual Obligations
The following tables reflect a summary of our contractual cash obligations and other commercial commitments as of March 29, 2020:
|
|
|
Payment Due by Fiscal Year |
|
|||||||||||||
|
|
|
|
|
|
Less Than |
|
|
|
|
|
|
|
More Than |
|
||
|
|
|
Total |
|
1 Year |
|
Years 1-3 |
|
Years 4-5 |
|
5 Years |
|
|||||
|
|
|
|
|
|
|
|
|
|
|
|
|
|
|
|
|
|
|
Revolving credit facility (1) |
|
$ |
25,856,600 |
|
$ |
25,751,400 |
|
$ |
105,200 |
|
$ |
— |
|
$ |
— |
|
|
Lease Obligations |
|
|
16,631,000 |
|
|
3,125,500 |
|
|
6,182,300 |
|
|
5,335,600 |
|
|
1,987,600 |
|
|
Other Long-Term Liabilities (2) |
|
|
1,002,300 |
|
|
63,300 |
|
|
126,600 |
|
|
126,600 |
|
|
685,800 |
|
|
Total contractual cash obligations |
|
$ |
43,489,900 |
|
$ |
28,940,200 |
|
$ |
6,414,100 |
|
$ |
5,462,200 |
|
$ |
2,673,400 |
|
|
(1) |
We are subject to a 0.25% fee on the unused portion of our revolving credit facility. This balance includes both the unused fees and current balance on our revolving credit facility. |
|
(2) |
Other Long-Term Liabilities reflected on the Consolidated Balance Sheet include amounts owed under a Supplemental Executive Retirement Plan. |
Critical Accounting Policies and Estimates
Our discussion and analysis of our financial condition and results of our operations are based on our consolidated financial statements, which have been prepared in accordance with accounting principles generally accepted in the United States. The preparation of these financial statements requires us to make estimates and judgments that affect the reported amount of assets, liabilities, revenues and expenses and related disclosure of contingent assets and liabilities. Actual results may differ from these estimates under different assumptions or conditions.
We have identified the policies below as critical to our business operations and the understanding of our results of operations:
Revenue Recognition. We account for revenue in accordance with ASC No. 606, Revenue from Contracts with Customers, which we adopted on April 2, 2018, using the modified retrospective method. We recognize revenue when control of promised goods is transferred to the customer. The amount of revenue recognized reflects the consideration to
39
which the Company expects to be entitled in exchange for transferring the goods.
During fiscal 2018, we complied with ASC No. 605, Revenue Recognition. We recorded revenues when 1) persuasive evidence of an arrangement exists, 2) delivery has occurred or services have been rendered, 3) price to the buyer is fixed or determinable, and 4) collectability is reasonably assured.
In most cases, shipments are made using FOB shipping terms. FOB destination terms are used for a portion of sales, and revenue for these sales is recorded when the product is received by the customer. Prices are always fixed at the time of sale. Historically, there have not been any material price concessions provided to customers, future discounts provided by the Company, or other incentives subsequent to a sale. The Company sells under normal commercial terms and, therefore, only records sales on transactions where collectability is reasonably assured. The Company recognizes revenues net of sales tax.
We recognize revenues from sales transactions containing sales returns provisions at the time of the sale. The potential for customer returns are considered a component of variable consideration under ASC No. 606 and it is therefore considered when estimating the transaction price for a sale. We use the most likely amount method to determine the amount of expected returns. The amount of expected returns is recognized as a refund liability, representing the obligation to return the customer’s consideration. The return asset is measured at the former carrying amount of the inventory, less any expected costs to recover the goods.
Our current and potential customers are continuing to look for ways to reduce their inventories and lower their total costs, including distribution, order taking and fulfillment costs, while still providing their customers excellent service. Some of these companies have turned to us to implement supply chain solutions, including purchasing inventory, assisting in demand forecasting, configuring, packaging, kitting and delivering products and managing customer and supplier relations, from order taking through cash collections. In performing these solutions, we assume varying levels of involvement in the transactions and varying levels of credit and inventory risk. As our offerings continually evolve to meet the needs of our customers, we constantly evaluate our revenue accounting based on the guidance set forth in accounting standards generally accepted in the United States. When applying this guidance in accordance with the FASB standard regarding revenue recognition for principal-agent considerations, we look at the following indicators: whether we are the primary obligor in the transaction; whether we have general inventory risk; whether we have latitude in establishing price; whether the customer holds us responsible for the acceptability of the product; whether the product returns are handled by us; and whether an obligation exists between the other parties and our customer. Each of our customer relationships is independently evaluated based on the above guidance and revenues are recorded on the appropriate basis. Based on a review of the factors above, in the majority of our sales relationships, we have concluded that we are the principal in the transaction, and we record revenues based upon the gross amounts earned and booked. However, we do have certain relationships where we are not the principal and we record revenues on a net fee basis, regardless of amounts billed (less than 1% of our total revenues for fiscal year 2020).
Allowance for Doubtful Accounts. We use estimates to determine the amount of the allowance for doubtful accounts necessary to reduce accounts receivable and unbilled receivables to their expected net realizable value. We estimate the amount of the required allowance by reviewing the status of past-due receivables and analyzing historical bad debt trends. Actual collection experience has not varied significantly from estimates, due primarily to credit policies, collection experience and our stability as it relates to our current customer base. Typical payments from commercial customers are due 30 days from the date of the invoice. We write-off receivables deemed to be uncollectible to the allowance for doubtful accounts. Accounts receivable balances are not collateralized.
Inventory Reserves. We establish inventory reserves for excess and obsolete inventory. We regularly review inventory to evaluate continued demand and identify any obsolete or excess quantities of inventory. We record a provision for the difference between excess and obsolete inventory and its estimated realizable value. Estimated realizable value is based on anticipated future product demand, market conditions and liquidation values. Actual results differing from these projections could have a material effect on our results of operations.
Impairment of Long-Lived and Indefinite-Lived Assets. Our Consolidated Balance Sheet as of March 29, 2020, includes indefinite lived intangible assets of $0.8 million. We perform annual impairment tests for goodwill and other
40
indefinite lived assets on the first day of our fourth quarter. We also periodically evaluate our long-lived assets for potential impairment indicators. The goodwill and intangible assets impairment test involves an initial qualitative analysis to determine if it is more likely than not that an intangible asset’s fair value is less than its carrying amount. If qualitative factors suggest a possible impairment the Company then performs a quantitative analysis. Our judgments regarding the existence of impairment indicators are based on estimated future cash flows, market conditions, operational performance and legal factors. The key assumptions used to determine the fair value of our goodwill reporting units include (a) a cash flow period; (b) a terminal value based on a growth rate; and (c) a discount rate, which is based on our weighted average cost of capital adjusted for risks associated with our operations.
Due to lower than expected results and a significant reduction in market capitalization, we performed a quantitative impairment test for goodwill during the third and fourth quarters of fiscal year 2020. Based on these quantitative tests, goodwill was fully impaired, and we recorded $11.7 million of non-cash goodwill impairment loss which resulted in a corresponding charge to operations during fiscal year 2020. Future events, such as significant changes in cash flow assumptions, could cause us to conclude that impairment indicators exist and that the net book value of long-lived assets or intangible assets are impaired. Had the determination been made that the indefinite lived intangible assets were impaired, the value of this asset would have been reduced by an amount up to $0.8 million, resulting in a corresponding charge to operations.
The methods of assessing fair value for reporting units with goodwill as well as for indefinite lived assets require significant judgments to be made by management, including future revenues, expenses, cash flows and discount rates. Changes in such estimates or the application of alternative assumptions could produce significantly different results.
Income Taxes. We recognize deferred tax assets and liabilities based on the differences between the financial statement carrying amounts and the tax bases of assets and liabilities. We regularly review our deferred tax assets for recoverability. This review is based on historical taxable income, projected future taxable income and the expected timing of the reversals of existing temporary differences. Based on this review, we have established a valuation allowance on the deferred tax assets that are not more likely than not realizable.
We account for income taxes under the FASB’s ASC No. 740 on accounting for uncertainty in income taxes recognized in an enterprise’s financial statements. This standard prescribes a recognition threshold and measurement attribute for the financial statement recognition and measurement of a tax position taken or expected to be taken in a tax return. It also provides guidance on de-recognition, measurement, classification, interest and penalties, accounting in interim periods, disclosure and transition.
Stock-Based Compensation. We record stock-based compensation in accordance with the FASB standard regarding stock compensation and share-based payments. We account for forfeitures as they occur rather than estimate expected forfeitures. The standard also requires stock awards granted or modified after the adoption of the standard that include both performance conditions and graded vesting to be amortized by an accelerated method rather than the straight-line method.
Off-Balance Sheet Arrangements
We have no material off-balance sheet arrangements.
Recent Accounting Pronouncements
A description of recently issued and adopted accounting pronouncements is contained in Note 2 to our Consolidated Financial Statements.
Forward‑Looking Statements
This Report may contain forward-looking statements within the meaning of Section 27A of the Securities Act of 1933, as amended, and Section 21E of the Securities Exchange Act of 1934, as amended. All statements other than statements of historical facts contained herein, including statements regarding our future results of operations and financial
41
position, strategy and plans, and our expectations for future operations, are forward-looking statements. These forward-looking statements may generally be identified by the use of the words “may,” “will,” “expects,” “anticipates,” “believes,” “estimates,” and similar expressions, but the absence of these words or phrases does not necessarily mean that a statement is not forward looking.
We have based these forward-looking statements on our current expectations and projections about future events and trends that we believe may affect our financial condition, results of operations, strategy, short- and long-term business operations and objectives, and financial needs. Forward looking statements involve a number of risks and uncertainties. Our actual results may differ materially from those described in or contemplated by any such forward-looking statement for a variety of reasons, including those described in Part I, Item IA “Risk Factors.” In light of these risks, uncertainties and assumptions, the forward-looking events and circumstances included herein may not occur, and actual results could differ materially and adversely from those anticipated or implied in the forward-looking statements. Consequently, the reader is cautioned to consider all forward-looking statements in light of the risks to which they are subject. Forward-looking statements include, but are not limited to, statements about:
|
· |
our expectations regarding the potential impact of the COVID-19 pandemic on our business, operations, revenues, profits, customers or suppliers; |
|
· |
our ability to sustain or grow our customer base and market share; |
|
· |
our ability to sustain and grow our supplier relationships; |
|
· |
our expectations regarding the size and growth in markets; |
|
· |
the needs and demands of our customers and the production capacity of our suppliers; |
|
· |
trends in the wireless communications industry, our competitors and competing business models; |
|
· |
the execution of our business plans and strategies; |
|
· |
our liquidity and working capital requirements and ability to access capital; |
|
· |
our ability to secure, maintain and upgrade our information technology, telecommunications and e-commerce systems; |
|
· |
our ability to anticipate and navigate existing and changes in laws or regulations, including tariffs and trade restrictions, applicable to our business; |
|
· |
our ability to enter into and perform contracts and to realize anticipated revenues or anticipated savings; and |
|
· |
our expectations regarding future revenues, expenses and profitability, and financial results generally. |
Although we believe that the expectations reflected in the forward-looking statements are reasonable, we cannot guarantee future results, level of activity, performance or achievements. In addition, neither we nor any other person assumes responsibility for the accuracy and completeness of any of these forward-looking statements. Any forward-looking statement made by us in this Annual Report speaks only as of the date on which it is made. We disclaim any duty to update any of these forward-looking statements after the date of this Annual Report to confirm these statements to actual results or revised expectations.
The above list should not be construed as exhaustive and should be read in conjunction with our other disclosures, including but not limited to the risk factors described in Part I, Item 1A of this Annual Report. Other risks may be described from time to time in our filings made under the securities laws. New risks emerge from time to time. It is not possible for our management to predict all risks.
Available Information
Our internet web site address is: www.tessco.com. We make available free of charge through our website, our Annual Report on Form 10-K, quarterly reports on Form 10-Q, current reports on Form 8-K and amendments to those reports filed or furnished pursuant to Section 13 or 15(d) of the Exchange Act as soon as reasonably practicable after such documents are electronically filed with, or furnished to, the Securities and Exchange Commission. Also available on our website is our Code of Business Conduct and Ethics. We have not incorporated herein by reference the information on our website, and it should not be considered a part of this filing.
42
Item 7A. Quantitative and Qualitative Disclosures About Market Risk.
Interest Rate Risk:
We are exposed to an immaterial level of market risk from changes in interest rates. We have from time to time previously used interest rate swap agreements to modify variable rate obligations to fixed rate obligations, thereby reducing our exposure to interest rate fluctuations. Based on March 29, 2020 borrowing levels, a 1.0% increase or decrease in current market interest rates would not have material effect on our statement of income.
Foreign Currency Exchange Rate Risk:
We are exposed to an immaterial level of market risk from changes in foreign currency rates. Almost all of our sales are made in U.S. Dollars so we have an immaterial amount of foreign currency risk. Those sales not made in U.S. Dollars are made in Canadian Dollars.
43
Item 8. Financial Statements and Supplementary Data.
TESSCO TECHNOLOGIES INCORPORATED AND SUBSIDIARIES
Consolidated Balance Sheets
|
|
|
March 29, |
|
March 31, |
|
||
|
|
|
2020 |
|
2019 |
|
||
|
|
|
|
|
|
|
|
|
|
ASSETS |
|
|
|
|
|
|
|
|
Current assets: |
|
|
|
|
|
|
|
|
Cash and cash equivalents |
|
$ |
50,000 |
|
$ |
30,300 |
|
|
Trade accounts receivable, net |
|
|
82,868,400 |
|
|
93,966,200 |
|
|
Product inventory, net |
|
|
69,148,000 |
|
|
71,845,400 |
|
|
Prepaid expenses and other current assets |
|
|
11,707,500 |
|
|
5,562,800 |
|
|
Total current assets |
|
|
163,773,900 |
|
|
171,404,700 |
|
|
|
|
|
|
|
|
|
|
|
Property and equipment, net |
|
|
13,433,700 |
|
|
15,003,500 |
|
|
Goodwill |
|
|
— |
|
|
11,677,700 |
|
|
Intangible assets, net |
|
|
11,157,400 |
|
|
5,893,200 |
|
|
Deferred tax assets |
|
|
3,032,500 |
|
|
55,300 |
|
|
Lease asset - right of use |
|
|
13,949,800 |
|
|
— |
|
|
Other long-term assets |
|
|
3,361,400 |
|
|
2,461,400 |
|
|
Total assets |
|
$ |
208,708,700 |
|
$ |
206,495,800 |
|
|
|
|
|
|
|
|
|
|
|
LIABILITIES AND SHAREHOLDERS’ EQUITY |
|
|
|
|
|
|
|
|
Current liabilities: |
|
|
|
|
|
|
|
|
Trade accounts payable |
|
$ |
75,512,600 |
|
$ |
73,059,700 |
|
|
Payroll, benefits and taxes |
|
|
4,258,300 |
|
|
5,929,500 |
|
|
Income and sales tax liabilities |
|
|
450,800 |
|
|
749,000 |
|
|
Accrued expenses and other current liabilities |
|
|
4,244,400 |
|
|
2,652,400 |
|
|
Revolving line of credit |
|
|
25,563,900 |
|
|
14,378,100 |
|
|
Lease liability, current |
|
|
2,579,200 |
|
|
— |
|
|
Total current liabilities |
|
|
112,609,200 |
|
|
96,768,700 |
|
|
|
|
|
|
|
|
|
|
|
Non-current lease liability |
|
|
11,481,100 |
|
|
— |
|
|
Other non-current liabilities |
|
|
915,700 |
|
|
939,900 |
|
|
Total liabilities |
|
|
125,006,000 |
|
|
97,708,600 |
|
|
|
|
|
|
|
|
|
|
|
Shareholders’ equity: |
|
|
|
|
|
|
|
|
Preferred stock, $0.01 par value per share, 500,000 shares authorized and no shares issued and outstanding |
|
|
— |
|
|
— |
|
|
Common stock, $0.01 par value per share, 15,000,000 shares authorized, 14,354,368 shares issued and 8,577,549 shares outstanding as of March 29, 2020, and 14,190,027 shares issued and 8,468,529 shares outstanding as of March 31, 2019 |
|
|
101,400 |
|
|
99,800 |
|
|
Additional paid-in capital |
|
|
65,318,500 |
|
|
62,666,400 |
|
|
Treasury stock, at cost, 5,776,819 shares as of March 29, 2020 and 5,721,498 shares as of March 31, 2019 |
|
|
(58,496,200) |
|
|
(57,614,100) |
|
|
Retained earnings |
|
|
76,779,000 |
|
|
103,635,100 |
|
|
Total shareholders’ equity |
|
|
83,702,700 |
|
|
108,787,200 |
|
|
Total liabilities and shareholders’ equity |
|
$ |
208,708,700 |
|
$ |
206,495,800 |
|
The accompanying Notes to the Consolidated Financial Statements are an integral part of these consolidated statements.
44
TESSCO TECHNOLOGIES INCORPORATED AND SUBSIDIARIES
Consolidated Statements of (Loss) Income
|
|
|
Fiscal Years Ended |
|||||||
|
|
|
March 29, 2020 |
|
March 31, 2019 |
|
April 1, 2018 |
|||
|
|
|
|
|
|
|
|
|
|
|
|
Revenues |
|
$ |
540,298,300 |
|
$ |
606,813,800 |
|
$ |
580,274,700 |
|
Cost of goods sold |
|
|
448,475,300 |
|
|
485,455,100 |
|
|
460,046,300 |
|
Gross profit |
|
|
91,823,000 |
|
|
121,358,700 |
|
|
120,228,400 |
|
Selling, general and administrative expenses |
|
|
107,814,700 |
|
|
113,213,700 |
|
|
112,326,700 |
|
Goodwill impairment |
|
|
11,677,700 |
|
|
— |
|
|
— |
|
Restructuring charge |
|
|
488,000 |
|
|
— |
|
|
— |
|
(Loss) income from operations |
|
|
(28,157,400) |
|
|
8,145,000 |
|
|
7,901,700 |
|
Interest expense, net |
|
|
1,116,300 |
|
|
853,800 |
|
|
429,100 |
|
(Loss) income before provision for (benefit from) income taxes |
|
|
(29,273,700) |
|
|
7,291,200 |
|
|
7,472,600 |
|
(Benefit from) provision for income taxes |
|
|
(7,704,800) |
|
|
1,745,400 |
|
|
2,277,200 |
|
Net (loss) income |
|
$ |
(21,568,900) |
|
$ |
5,545,800 |
|
$ |
5,195,400 |
|
Basic (loss) earnings per share |
|
$ |
(2.53) |
|
$ |
0.66 |
|
$ |
0.62 |
|
Diluted (loss) earnings per share |
|
$ |
(2.53) |
|
$ |
0.65 |
|
$ |
0.61 |
|
Basic weighted-average common shares outstanding |
|
|
8,526,965 |
|
|
8,436,796 |
|
|
8,370,742 |
|
Effect of dilutive options and other equity instruments |
|
|
— |
|
|
130,163 |
|
|
100,263 |
|
Diluted weighted-average common shares outstanding |
|
|
8,526,965 |
|
|
8,566,959 |
|
|
8,471,005 |
|
Cash dividends declared per common share |
|
$ |
0.62 |
|
$ |
0.80 |
|
$ |
0.80 |
The accompanying Notes to these Consolidated Financial Statements are an integral part of these consolidated statements.
45
TESSCO TECHNOLOGIES INCORPORATED AND SUBSIDIARIES
Consolidated Statements of Changes in Shareholders' Equity
|
|
|
Common Stock |
|
Additional |
|
|
|
|
|
|
|
Total |
|
|||||
|
|
|
|
|
|
|
|
Paid-in |
|
Treasury |
|
Retained |
|
Shareholders’ |
|
||||
|
|
|
Shares |
|
Amount |
|
Capital |
|
Stock |
|
Earnings |
|
Equity |
|
|||||
|
Balance at March 26, 2017 |
|
8,337,669 |
|
|
98,400 |
|
|
59,006,000 |
|
|
(57,437,600) |
|
|
106,349,500 |
|
|
108,016,300 |
|
|
Proceeds from issuance of stock |
|
44,458 |
|
|
400 |
|
|
604,000 |
|
|
— |
|
|
— |
|
|
604,400 |
|
|
Treasury stock purchases |
|
(4,443) |
|
|
— |
|
|
|
|
|
(65,400) |
|
|
— |
|
|
(65,400) |
|
|
Non-cash stock compensation expense |
|
18,853 |
|
|
200 |
|
|
1,001,900 |
|
|
— |
|
|
— |
|
|
1,002,100 |
|
|
Cash dividends paid |
|
— |
|
|
— |
|
|
— |
|
|
— |
|
|
(6,701,200) |
|
|
(6,701,200) |
|
|
Net income |
|
— |
|
|
— |
|
|
— |
|
|
— |
|
|
5,195,400 |
|
|
5,195,400 |
|
|
Balance at April 1, 2018 |
|
8,396,537 |
|
|
99,000 |
|
|
60,611,900 |
|
|
(57,503,000) |
|
|
104,843,700 |
|
|
108,051,600 |
|
|
Proceeds from issuance of stock |
|
52,067 |
|
|
500 |
|
|
810,800 |
|
|
— |
|
|
|
|
|
811,300 |
|
|
Treasury stock purchases |
|
(6,332) |
|
|
— |
|
|
— |
|
|
(111,100) |
|
|
|
|
|
(111,100) |
|
|
Non-cash stock compensation expense |
|
26,257 |
|
|
300 |
|
|
1,243,700 |
|
|
— |
|
|
|
|
|
1,244,000 |
|
|
Cash dividends paid |
|
— |
|
|
— |
|
|
— |
|
|
— |
|
|
(6,754,400) |
|
|
(6,754,400) |
|
|
Net income |
|
— |
|
|
— |
|
|
— |
|
|
— |
|
|
5,545,800 |
|
|
5,545,800 |
|
|
Balance at March 31, 2019 |
|
8,468,529 |
|
|
99,800 |
|
|
62,666,400 |
|
|
(57,614,100) |
|
|
103,635,100 |
|
|
108,787,200 |
|
|
Proceeds from issuance of stock |
|
72,430 |
|
|
700 |
|
|
797,300 |
|
|
— |
|
|
— |
|
|
798,000 |
|
|
Treasury stock purchases |
|
(55,321) |
|
|
— |
|
|
— |
|
|
(882,100) |
|
|
— |
|
|
(882,100) |
|
|
Non-cash stock compensation expense |
|
43,786 |
|
|
400 |
|
|
1,174,200 |
|
|
— |
|
|
— |
|
|
1,174,600 |
|
|
Exercise of stock options |
|
48,125 |
|
|
500 |
|
|
680,600 |
|
|
— |
|
|
— |
|
|
681,100 |
|
|
Cash dividends paid |
|
— |
|
|
— |
|
|
— |
|
|
— |
|
|
(5,287,200) |
|
|
(5,287,200) |
|
|
Net loss |
|
— |
|
|
— |
|
|
— |
|
|
— |
|
|
(21,568,900) |
|
|
(21,568,900) |
|
|
Balance at March 29, 2020 |
|
8,577,549 |
|
$ |
101,400 |
|
$ |
65,318,500 |
|
$ |
(58,496,200) |
|
$ |
76,779,000 |
|
$ |
83,702,700 |
|
The accompanying Notes to these Consolidated Financial Statements are an integral part of these consolidated statements.
46
TESSCO TECHNOLOGIES INCORPORATED AND SUBSIDIARIES
Consolidated Statements of Cash Flows
|
|
|
Year Ended |
|||||||
|
|
|
March 29, 2020 |
|
March 31, 2019 |
|
April 1, 2018 |
|||
|
|
|
|
|
|
|
|
|
|
|
|
CASH FLOWS FROM OPERATING ACTIVITIES: |
|
|
|
|
|
|
|
|
|
|
Net (loss) income |
|
$ |
(21,568,900) |
|
$ |
5,545,800 |
|
$ |
5,195,400 |
|
Adjustments to reconcile net (loss) income to net cash provided by (used in) operating activities: |
|
|
|
|
|
|
|
|
|
|
Depreciation and amortization |
|
|
4,026,100 |
|
|
3,618,900 |
|
|
3,992,600 |
|
Goodwill impairment |
|
|
11,677,700 |
|
|
— |
|
|
— |
|
Non-cash stock-based compensation expense |
|
|
1,174,600 |
|
|
1,244,000 |
|
|
1,002,100 |
|
Deferred income taxes and other |
|
|
(2,977,200) |
|
|
665,200 |
|
|
(710,500) |
|
Change in trade accounts receivable |
|
|
11,097,800 |
|
|
(6,103,900) |
|
|
(23,158,400) |
|
Change in product inventory |
|
|
2,697,400 |
|
|
477,600 |
|
|
(8,338,700) |
|
Change in prepaid expenses and other current assets |
|
|
(6,144,700) |
|
|
(1,073,700) |
|
|
(625,000) |
|
Change in other assets and other liabilities |
|
|
(251,400) |
|
|
938,900 |
|
|
(2,155,600) |
|
Change in trade accounts payable |
|
|
905,300 |
|
|
5,073,600 |
|
|
13,459,700 |
|
Change in payroll, benefits and taxes |
|
|
(1,671,200) |
|
|
(2,361,600) |
|
|
1,519,000 |
|
Change in income and sales tax liabilities |
|
|
(298,200) |
|
|
(1,590,200) |
|
|
974,500 |
|
Change in accrued expenses and other current liabilities |
|
|
2,240,900 |
|
|
1,812,100 |
|
|
(402,200) |
|
Net cash provided by (used in) operating activities |
|
|
908,200 |
|
|
8,246,700 |
|
|
(9,247,100) |
|
|
|
|
|
|
|
|
|
|
|
|
CASH FLOWS FROM INVESTING ACTIVITIES |
|
|
|
|
|
|
|
|
|
|
Acquisition of property and equipment |
|
|
(288,000) |
|
|
(2,855,200) |
|
|
(1,646,600) |
|
Purchases of internal use software |
|
|
(6,557,700) |
|
|
(2,309,500) |
|
|
(1,892,800) |
|
Net cash used in investing activities |
|
|
(6,845,700) |
|
|
(5,164,700) |
|
|
(3,539,400) |
|
|
|
|
|
|
|
|
|
|
|
|
CASH FLOWS FROM FINANCING ACTIVITIES |
|
|
|
|
|
|
|
|
|
|
Net borrowings from revolving line of credit |
|
|
11,185,800 |
|
|
3,542,700 |
|
|
10,835,400 |
|
Proceeds from note receivable |
|
|
— |
|
|
— |
|
|
75,000 |
|
Payments on debt |
|
|
(2,300) |
|
|
(27,300) |
|
|
(26,700) |
|
Proceeds from issuance of common stock |
|
|
262,400 |
|
|
279,000 |
|
|
148,700 |
|
Cash dividends paid |
|
|
(5,287,200) |
|
|
(6,754,400) |
|
|
(6,701,200) |
|
Proceeds from exercise of stock options |
|
|
680,600 |
|
|
— |
|
|
— |
|
Purchases of treasury stock and repurchases of stock from employees |
|
|
(882,100) |
|
|
(111,100) |
|
|
(65,400) |
|
Net cash provided by (used in) financing activities |
|
|
5,957,200 |
|
|
(3,071,100) |
|
|
4,265,800 |
|
|
|
|
|
|
|
|
|
|
|
|
Net increase (decrease in) cash and cash equivalents |
|
|
19,700 |
|
|
10,900 |
|
|
(8,520,700) |
|
|
|
|
|
|
|
|
|
|
|
|
CASH AND CASH EQUIVALENTS, beginning of period |
|
|
30,300 |
|
|
19,400 |
|
|
8,540,100 |
|
|
|
|
|
|
|
|
|
|
|
|
CASH AND CASH EQUIVALENTS, end of period |
|
$ |
50,000 |
|
$ |
30,300 |
|
$ |
19,400 |
The accompanying Notes to the Consolidated Financial Statements are an integral part of these consolidated statements.
47
Note 1. Organization
TESSCO Technologies Incorporated, a Delaware corporation (“Tessco”, “we”, “our”, or the “Company”), architects and delivers innovative product and value chain solutions to support wireless systems. The Company provides marketing and sales services, knowledge and supply chain management, product-solution delivery and control systems utilizing extensive internet and information technology. Approximately 96% of the Company’s sales are made to customers in the United States. The Company takes orders in several ways, including phone, fax, online and through electronic data interchange. Almost all of the Company’s sales are made in United States Dollars.
Note 2. Summary of Significant Accounting Policies
Principles of Consolidation
The consolidated financial statements include the accounts of the Company and its wholly-owned subsidiaries. Intercompany accounts and transactions have been eliminated in consolidation.
Fiscal Year
The Company's fiscal year is the 52 or 53 weeks ending on the Sunday falling on or between March 26 and April 1 to allow the financial year to better reflect the Company's natural weekly accounting and business cycle. The fiscal years ended March 29, 2020 and March 31, 2019 contained 52 weeks and the fiscal year ended April 1, 2018 contained 53 weeks.
Cash and Cash Equivalents
Cash and cash equivalents include cash and highly liquid investments with an original maturity of 90 days or less.
Allowance for Doubtful Accounts
The Company uses estimates to determine the amount of the allowance for doubtful accounts necessary to reduce accounts receivable to their expected net realizable value. The Company estimates the amount of the required allowance by reviewing the status of past-due receivables and analyzing historical bad debt trends and current economic conditions. Actual collection experience has not varied significantly from estimates, due primarily to consistent credit policies, collection experience, as well as the Company’s stability as it relates to its current customer base. Typical payments from a large majority of commercial customers are due 30 days from the date of the invoice. The Company charges-off receivables deemed to be uncollectible to the allowance for doubtful accounts. Accounts receivable balances are not collateralized. At March 29, 2020 and March 31, 2019, the Company had a reserve for the allowance for doubtful accounts of $3,288,800 and $2,137,900, respectively. The reserve as of March 29, 2020 included $1,500,000 for potential doubtful accounts predicated on the COVID-19 pandemic.
Product Inventory
Product inventory, consisting primarily of finished goods, is stated at the lower of cost or net realizable value, cost being determined on the first-in, first-out (“FIFO”) method and includes certain charges directly and indirectly incurred in bringing product inventories to the point of sale. Inventory is written down for estimated obsolescence equal to the difference between the cost of inventory and the estimated net realizable value, based upon specifically known inventory-related risks (such as technological obsolescence and the nature of supplier terms surrounding price protection and product returns), and assumptions about future demand. At March 29, 2020 and March 31, 2019, the Company had a reserve for excess and obsolete inventory of $9,666,100 and $5,870,600, respectively. The reserve as of March 29, 2020 included $3,900,000 for potential inventory excess and obsolescence predicated on the COVID-19 pandemic.
48
Property and Equipment
Property and equipment is stated at cost. Depreciation is recorded using the straight-line method over the estimated useful lives of the assets as follows:
|
|
|
Useful lives |
|||
|
|
|
|
|
|
|
|
Information technology equipment |
|
1 |
- |
3 |
years |
|
Furniture, telephone system, equipment and tooling |
|
3 |
- |
10 |
years |
|
Building, building improvements and leasehold improvements |
|
2 |
- |
40 |
years |
Leasehold improvements are amortized over the shorter of their useful lives or the remaining lease term.
Intangibles and Other Long-Term Assets
The Company capitalizes computer software costs incurred in connection with developing or obtaining computer software for internal use when both the preliminary project stage is completed and when management authorizes and commits to funding the project and it is probable that the project will be completed. Development and acquisition costs are capitalized when the focus of the software project is either to develop new software, to increase the life of existing software or to add significantly to the functionality of existing software. Capitalization ceases when the software project is substantially complete and ready for its intended use. Depreciation is recorded using the straight-line method over the estimated useful life which ranges from one to three years.
Impairment of Long-Lived Assets
Long-lived assets, including amortizable intangible assets, are reviewed for impairment whenever events or changes in circumstances indicate that the carrying amount of an asset or group of assets may not be fully recoverable. These events or changes in circumstances may include a significant deterioration of operating results, changes in business plans, or changes in anticipated future cash flows. If an impairment indicator is present, the Company evaluates recoverability by a comparison of the carrying amount of the assets to future undiscounted net cash flows expected to be generated by the assets. Assets are grouped at the lowest level for which there are identifiable cash flows that are largely independent of the cash flows generated by other asset groups. If future undiscounted cash flows are less than the carrying value of the asset group, the Company calculates the fair value of the asset group. If the assets are impaired, the impairment recognized is measured by the amount by which the carrying amount exceeds the fair value of the assets. Fair value is generally determined by estimates of discounted cash flows. The discount rate used in any estimate of discounted cash flows would be the rate required for a similar investment of like risk. There were no impairment charges of long-live assets other than goodwill, in fiscal years 2020, 2019, or 2018.
Assets to be disposed of are reported at the lower of carrying value or fair value, less estimated costs of disposal.
Goodwill
Goodwill represents the future economic benefits arising from other assets acquired in a business combination that are not individually identified and separately recognized. Goodwill amounts and indefinite lived intangible assets are not amortized, but rather are tested for impairment at least annually or whenever an impairment indicator is identified. The Company performs its annual impairment test on the first day of its fourth quarter. Intangible assets other than goodwill are recorded within other long-term assets in the Company’s Consolidated Balance Sheets. The goodwill impairment test involves an initial qualitative analysis to determine if it is more likely than not that an intangible asset’s fair value is less than its carrying amount. If qualitative factors suggest a possible impairment, the Company then performs a quantitative analysis whereby the Company determines the fair value of each reporting unit to which goodwill has been assigned. The Company then compares the fair value of each reporting unit to its carrying value, including goodwill. The Company estimates the fair value of each reporting unit using a discounted cash flow or income approach and market approach. Under the income approach, the Company estimates the present value of the reporting unit’s future cash flows. Key assumptions used to determine the present value of a reporting unit’s future cash flows include (a) a cash flow period; (b)
49
a terminal value based on a growth rate; and (c) a discount rate, which is based on the Company’s weighted average cost of capital adjusted for risks associated with our operations. Under the market approach, the Company uses prices and other relevant information generated by market transactions involving comparable companies. Pursuant to ASU No. 2017-04, which the Company elected to adopt during fiscal year 2020, goodwill impairment is recorded if the carrying value exceeds the fair value of the reporting unit, limited to the amount of goodwill at that reporting unit.
The indefinite lived intangible asset impairment test involves an initial qualitative analysis to determine if it is more likely than not that an intangible asset’s fair value is less than its carrying amount. If qualitative factors suggest a possible impairment, the Company then determines the fair value of the intangible asset. If the fair value of the intangible asset is less than its carrying value, an impairment loss is recognized for an amount equal to the difference. The intangible asset is then carried at its new fair value. We measure the fair value of our indefinite-lived intangible asset using the “relief from royalty” method. Significant estimates in this approach include projected revenues and royalty and discount rates. The estimates of discounted cash flows will likely change over time as impairment tests are performed.
Based on the Company’s qualitative and/or quantitative impairment tests performed, the Company recognized a $11.7 million impairment loss on goodwill in fiscal year 2020. The Company did not recognize an impairment loss on goodwill or other indefinite lived intangible assets in fiscal years 2019 or 2018.
The methods of assessing fair value for our reporting units with goodwill as well as for indefinite lived assets require significant judgments to be made by management, including future revenues, expenses, cash flows and discount rates. Changes in such estimates or the application of alternative assumptions could produce significantly different results.
Revenue Recognition
We account for revenue in accordance with ASC No. 606, Revenue from Contracts with Customers, which we adopted on April 2, 2018, using the modified retrospective method. We recognize revenue when control of promised goods is transferred to the customer. The amount of revenue recognized reflects the consideration to which the Company expects to be entitled in exchange for transferring the goods.
During fiscal 2018, we complied with ASC No. 605, Revenue Recognition. We recorded revenues when 1) persuasive evidence of an arrangement exists, 2) delivery has occurred or services have been rendered, 3) price to the buyer is fixed or determinable, and 4) collectability is reasonably assured.
In most cases, shipments are made using FOB shipping terms. FOB destination terms are used for a portion of sales, and revenue for these sales is recorded when the product is received by the customer. Prices are always fixed at the time of sale. Historically, there have not been any material concessions provided to or by customers, future discounts provided by the Company, or other incentives subsequent to a sale. The Company sells under normal commercial terms and, therefore, only records sales on transactions at the estimated transaction price. The Company recognized revenues net of sales tax.
We recognize revenues from sales transactions containing sales returns provisions at the time of the sale. The potential for customer returns are considered a component of variable consideration under ASC No. 606 and it is therefore considered when estimating the transaction price for a sale. We use the most likely amount method to determine the amount of expected returns. The amount of expected returns is recognized as a refund liability, representing the obligation to return the customer’s consideration. The return asset is measured at the former carrying amount of the inventory, less any expected costs to recover the goods, which is included in prepaid expenses and other current assets on the accompanying Consolidated Balance Sheets.
Our current and potential customers are continuing to look for ways to reduce their inventories and lower their total costs, including distribution, order taking and fulfillment costs, while still providing their customers excellent service. Some of these companies have turned to us to implement supply chain solutions, including purchasing inventory, assisting in demand forecasting, configuring, packaging, kitting and delivering products and managing customer and supplier relations, from order taking through cash collections. In performing these solutions, we assume varying levels of involvement in the transactions and varying levels of credit and inventory risk. As our offerings continually evolve to meet
50
the needs of our customers, the Company constantly evaluates its revenue accounting based on the guidance set forth in accounting standards generally accepted in the United States. When applying this guidance in accordance with the ASC No. 606, the Company looks at the following indicators: whether we are the primary obligor in the transaction; whether we have general inventory risk; whether we have latitude in establishing price; whether the customer holds us responsible for the acceptability of the product; whether the product returns are handled by us; and whether obligation exists between the other parties and our customer. Each of the Company’s customer relationships is independently evaluated based on the above guidance and revenues are recorded on the appropriate basis. Based on a review of the factors above, in the majority of the Company’s sales relationships, the Company has concluded that it is the principal in the transaction and records revenues based upon the gross amounts earned and booked. However, the Company does have relationships where it is not the principal and records revenues on a net fee basis, regardless of amounts billed (less than 1% of total revenues for fiscal year 2020).
Service revenues have represented less than 1% of total revenues for fiscal years 2020, 2019 and 2018.
Other than sales relating to the Company’s private brands, we offer no product warranties in excess of original equipment manufacturers’ warranties. The Company’s warranty expense is estimated and accrued at the time of sale. Warranty expense was immaterial for fiscal years 2020, 2019, and 2018.
Supplier Programs
Funds received from suppliers for price protection, product rebates and marketing/promotion are recorded as a reduction in cost of goods sold in accordance with ASC No. 705-20: Cost of Sales and Services - Accounting for Consideration Received from a Vendor.
Shipping and Handling Costs
Shipping costs incurred to ship products from our distribution centers to our customers’ sites are included in selling, general and administrative expenses in the Consolidated Statements of Income and totaled $13,869,500, $16,534,200, and $14,875,100 for fiscal years 2020, 2019, and 2018, respectively.
Stock Compensation Awards Granted to Team Members
The Company records stock compensation expense for awards in accordance with ASC No. 718. The Company accounts for forfeitures as they occur rather than estimate expected forfeitures. The standard also requires stock awards granted or modified after the adoption of the standard that include both performance conditions and graded vesting based on service to the Company to be amortized by an accelerated method rather than the straight-line method.
Income Taxes
The Company accounts for income taxes under the asset and liability method in accordance with ASC No. 740. Under this method, deferred income tax assets and liabilities arise from differences between the tax basis of assets or liabilities and their reported amounts in the financial statements. Deferred tax balances are determined by using the enacted tax rate to be in effect when the taxes are paid or refunds received. A valuation allowance related to deferred tax assets is recorded when it is more likely than not that some portion or all of the deferred tax assets will not be realized.
In accordance with ASC No. 740, the Company recognizes a provision for tax uncertainties in its financial statements for the year ended April 1, 2018. No provision for tax uncertainties was determined to be necessary as of March 29, 2020 and March 31, 2019. See Note 12 for further discussion of the standard and its impact on the Company’s consolidated financial statements.
Use of Estimates
The preparation of financial statements in conformity with U.S. generally accepted accounting principles (GAAP) requires management to make estimates and assumptions that affect the reported amounts of assets and liabilities and
51
disclosure of contingent assets and liabilities as of the date of the financial statements and the reported amounts of revenues and expenses during the reporting period. On an ongoing basis, the Company reviews and evaluates its estimates and assumptions, including but not limited to, those that relate to tax reserves, stock-based compensation, accounts receivable reserves, inventory reserves and future cash flows associated with impairment testing for goodwill and other long-lived assets. Actual results could significantly differ from those estimates.
Recently issued accounting pronouncements not yet adopted:
In June 2016, the Financial Accounting Standards Board (FASB) issued Accounting Standards Update (ASU) No. 2016-13, Financial Instruments – Credit Losses (Topic 326): Measurement of Credit Losses on Financial Instruments which amends the impairment model by requiring entities to use a forward-looking approach based on expected losses rather than incurred losses to estimate credit losses on certain types of financial instruments, including trade receivables. This may result in the earlier recognition of allowances for losses. This ASU is effective for periods beginning after December 15, 2022. The Company is currently evaluating the impact the adoption of this new standard will have on its Consolidated Financial Statements and will adopt the standard on the first day of the Company’s 2024 fiscal year.
Recently issued accounting pronouncements adopted:
Effective September 30, 2019, the Company adopted the FASB issued ASU No. 2018-15, Intangibles-Goodwill and Other–Internal-Use Software (Subtopic 350-40): Customer’s Accounting for Implementation Costs Incurred in a Cloud Computing Arrangement That Is a Service Contract. This ASU aligns the requirements for capitalizing implementation costs incurred in a hosting arrangement that is a service contract with the requirements for capitalizing implementation costs incurred to develop or obtain internal-use software. The adoption of this standard resulted in the Company capitalizing certain implementation costs related to cloud computing arrangements that are service contracts during fiscal 2020.
Effective September 30, 2019, the FASB issued ASU No. 2017-04, “Intangibles-Goodwill and Other (Topic 350)”. The ASU modifies the measurement of a goodwill impairment loss from the portion of the carrying amount of goodwill that exceeds its implied fair value to the excess of the carrying amount of a reporting unit that exceeds its fair value. This eliminates step two of the goodwill impairment test under current guidance. The Company elected to early adopt ASU No. 2017-04 for the fiscal year 2020 impairment tests performed as of December 29, 2019 and March 29, 2020.
Effective April 1, 2019, the Company adopted the FASB issued ASU No. 2016-02, Leases. This ASU requires lessees to recognize most leases on their balance sheets related to the rights and obligations created by those leases. The ASU also requires additional qualitative and quantitative disclosures related to the nature, timing and uncertainty of cash flows arising from leases. The Company adopted this standard on the first day of the 2020 fiscal year, using a modified retrospective approach. The Company elected the package of practical expedients permitted under the transition guidance within the standard, which among other things, allowed historical lease classification to be carried forward. Additionally, the Company elected the practical expedient approach to consolidate less significant non-lease components into the lease component. The Company made an accounting policy election, as permitted by the standard, to only record a right-of-use asset and lease liability for leases with an initial term in excess of twelve months. This standard resulted in the Company recording a right-of-use asset and lease liability for all leases, but otherwise the standard did not have a material impact on the financial statements. Prior periods were not adjusted to reflect this change.
Effective April 1, 2019, the Company adopted the FASB issued ASU No. 2016-15, Classification of Certain Cash Receipts and Cash Payments. The new standard changes the classification of certain cash payments and receipts within the cash flow statement. Specifically, payments for debt prepayment or debt extinguishment costs, including third-party costs, premiums paid, and other fees paid to lenders that are directly related to the debt prepayment or debt extinguishment, excluding accrued interest, are now classified as financing activities. Previously, these payments were classified as operating expenses. Adoption of this standard did not have an impact on the Consolidated Financial Statements of the Company, included herein.
52
Note 3. Property and Equipment
All of the Company’s property and equipment is located in the United States and is summarized as follows:
|
|
|
2020 |
|
2019 |
|
||
|
|
|
|
|
|
|
|
|
|
Land |
|
$ |
4,740,800 |
|
$ |
4,740,800 |
|
|
Building, building improvements and leasehold improvements |
|
|
20,921,800 |
|
|
20,926,500 |
|
|
Information technology equipment |
|
|
5,255,000 |
|
|
6,026,300 |
|
|
Furniture, telephone system, equipment and tooling |
|
|
9,039,000 |
|
|
8,582,800 |
|
|
|
|
|
39,956,600 |
|
|
40,276,400 |
|
|
Less accumulated depreciation |
|
|
(26,522,900) |
|
|
(25,272,900) |
|
|
Property and equipment, net |
|
$ |
13,433,700 |
|
$ |
15,003,500 |
|
Depreciation of property and equipment was $1,683,000, $1,507,300, and $1,796,500 for fiscal years 2020, 2019 and 2018, respectively.
Note 4. Goodwill and Other Intangible Assets
Due to lower than expected results and a significant reduction in market capitalization (due to reduced stock price), we performed a quantitative impairment test for goodwill during the third and fourth quarters of fiscal year 2020. Based on these quantitative tests, goodwill was fully impaired, and we recorded $11.7 million of non-cash goodwill impairment loss during fiscal year 2020, which was included on the goodwill impairment line on the consolidated statements of (loss) income. Based on the quantitative tests we did in the third quarter, we recorded $2.6 million of non-cash goodwill impairment loss related to the retail segment. Based on the quantitative tests we did in the fourth quarter, we recorded $9.1 million of non-cash goodwill impairment loss related to the commercial segment. There was no change in the carrying amount of goodwill for the fiscal year ended March 31, 2019.
Intangibles, net on our Consolidated Balance Sheets as of March 29, 2020 and March 31, 2019, consists of capitalized internally development computer software and an indefinite lived intangible assets. Capitalized internally developed computer software, net of accumulated amortization, as of March 29, 2020 and March 31, 2019 was $10,362,100 and $5,097,800, respectively. Certain intangibles previously classified as other long-term assets as reported for the prior periods reflected in this Annual Report on Form 10-K have been reclassified accordingly. Amortization expense of capitalized internally developed computer software was $1,954,700, $1,620,800, and $1,721,000 for fiscal years 2020, 2019, and 2018. Indefinite lived intangible assets were $795,400 as of March 29, 2020 and March 31, 2019.
Note 5. Accrued expenses and other current liabilities
Accrued expenses and other current liabilities consisted of the following:
|
|
|
March 29, 2020 |
|
March 31, 2019 |
|
||
|
Returns Reserve |
|
$ |
3,440,100 |
|
$ |
1,985,700 |
|
|
Other Accrued Expenses |
|
|
804,300 |
|
|
666,700 |
|
|
Total Accrued Expenses |
|
$ |
4,244,400 |
|
$ |
2,652,400 |
|
The amount of expected returns are recognized as a refund liability within the Accrued Expenses line item of the balance sheet. This liability represents the obligation to return customer consideration. The value of the expected goods returned by customers is now recognized as a return asset within the Prepaid expense and other current assets line item of the balance sheet. The return asset value is initially measured at the former carrying amount in inventory, less any expected costs to recover the goods. The Company expects products returned by customers to be in new and salable condition, as required by our standard terms and conditions, and therefore impairment of the return asset is unlikely. Changes to the return liability are recorded as revenue adjustments and changes to the inventory asset are recorded as cost of goods sold.
53
As of March 29, 2020, the return asset and return liability amounts were $2.7 million and $3.4 million, respectively. As of March 31, 2019, the return asset and return liability amounts were $1.5 million and $2.0 million, respectively.
Note 6. Borrowings Under Revolving Credit Facility
Fiscal Year 2019 Revolving Credit Facility Activity
On June 24, 2016, the Company and its primary operating subsidiaries entered into a Credit Agreement (the “Credit Agreement”) with SunTrust Bank, as Administrative Agent and Lender, and Wells Fargo Bank, National Association, as a Lender, for a senior asset based secured revolving credit facility of up to $35 million (the “Revolving Credit Facility”). On October 19, 2017, the Company and its primary operating subsidiaries, as co-borrowers, entered into an Amended and Restated Credit Agreement with SunTrust Bank, as Administrative Agent and Lender, and Wells Fargo Bank, National Association, as a Lender (the “Amended and Restated Credit Agreement”). Pursuant to the Amended and Restated Credit Agreement, the Credit Agreement for the secured Revolving Credit Facility, as previously established in June 2016, was amended and restated in order to, among other things, increase the Company’s borrowing limit from up to $35 million to up to $75 million. Capitalized terms used but not otherwise defined in this Note 6 have the meanings ascribed to each in the Amended and Restated Credit Agreement.
On March 31, 2019, the interest rate applicable to borrowings under the Revolving Credit Facility was 3.99%. The weighted average interest rate on borrowings under the Company’s revolving credit facilities during fiscal year 2019 was 3.71%. Under certain circumstances, the Applicable Rate is subject to change at the Lenders’ option from the Eurodollar Rate plus the Applicable Margin to the Base Rate plus the Applicable Margin.
Interest expense on the Revolving Credit Facility for fiscal year 2019 totaled $836,300. Average borrowings under the Revolving Credit Facility totaled $22,360,200 and maximum borrowings totaled $33,639,500 for fiscal year 2019. In addition to the interest charged on borrowings, the Company is subject to a 0.25% fee on the unused portion of the Revolving Credit Facility.
Borrowings under the Revolving Credit Facility may be used for working capital and other general corporate purposes, and as further provided in, and subject to the applicable terms of, the Credit Agreement. As of March 31, 2019, borrowings under this Revolving Credit Facility totaled $14.4 million and, therefore, the Company had $60.6 million available for borrowing as of March 31, 2019, subject to the Borrowing Base limitation and compliance with the other applicable terms of the Amended and Restated Credit Agreement, including the applicable covenants. The line of credit has a lockbox arrangement associated with it and therefore the outstanding balance is classified as a current liability on our balance sheet.
There is a financial covenant that the Company needs to maintain at any time during which the borrowings under this Revolving Credit Facility exceed $65 million. The Company’s borrowings did not exceed $65 million during fiscal year 2019. The Company was in compliance with the terms and other covenants applicable to the revolving credit facility at the end of fiscal year 2019 and through the date that these financial statements were issued.
Fiscal Year 2020 Revolving Credit Facility Activity
On March 29, 2020, the interest rate applicable to borrowings under the Revolving Credit Facility was 3.09%. The weighted average interest rate on borrowings under the Company’s Revolving Credit Facility during fiscal year 2020 was 3.52%. Under certain circumstances, the Applicable Rate is subject to change at the Lenders’ option from the Eurodollar Rate plus the Applicable Margin to the Base Rate plus the Applicable Margin.
Interest expense on the Revolving Credit Facility for fiscal year 2020 totaled $1,114,900. Average borrowings under this Revolving Credit Facility totaled $33,755,700 and maximum borrowings totaled $56,069,900 for fiscal year 2020. In addition to the interest charged on borrowings, the Company is subject to a 0.25% fee on the unused portion of the Revolving Credit Facility.
54
Borrowings under the Revolving Credit Facility may be used for working capital and other general corporate purposes, and as further provided in, and subject to the applicable terms of, the Credit Agreement. As of March 29, 2020, borrowings under this Revolving Credit Facility totaled $25.6 million and, therefore, the Company had $49.4 million available for borrowing as of March 29, 2020, subject to the Borrowing Base limitation and compliance with the other applicable terms of the Amended and Restated Credit Agreement, including the applicable covenants. The line of credit has a lockbox arrangement associated with it and therefore the outstanding balance is classified as a current liability on our balance sheet.
There is a financial covenant that the Company needs to maintain at any time during which the borrowings under this Revolving Credit Facility exceed $65 million. The Company’s borrowings did not exceed $65 million during fiscal year 2020. The Company was in compliance with the terms and other covenants applicable to the revolving credit facility at the end of fiscal year 2020 and through the date that these financial statements were issued.
Note 7. Lease
The Company is committed to making rental payments under non-cancelable operating leases covering various facilities and equipment. Our leases have remaining lease terms of 1 to 6 years, some of which include options to extend the leases for up to 5 years. Rent expense for fiscal years 2020, 2019 and 2018 totaled $3,046,000, $3,001,800, and $3,041,700, respectively.
The Company leases office space in Timonium, Maryland, where the Company’s sales, marketing and administrative offices are located. This space is nearby to the Company’s Global Logistics Center in Hunt Valley, Maryland. The Agreement of Lease expires on December 31, 2025. Monthly rent payments now range from $179,700 to $203,800 through the remaining lease term.
The Company also leases office and warehouse space in Hunt Valley, Maryland, adjacent to the Company’s Global Logistics Center, expiring on July 31, 2023. The Company has an ongoing annual option to terminate the lease. The monthly rental fee ranges from $39,300 to $43,000 through the remaining lease term.
Additional sales and marketing offices are located in additional leased office space in San Antonio, Texas. This space is leased pursuant to a lease agreement expiring on October 31, 2021. Monthly rent payments range from $18,600 to $19,100 through the remaining lease term.
Quantitative information regarding the Company’s leases is as follows:
|
|
|
|
As of March 29, 2020 |
|
|
Maturities of lease liabilities by fiscal year are as follow: |
|
|
|
|
|
2021 |
|
$ |
3,125,500 |
|
|
2022 |
|
|
3,164,000 |
|
|
2023 |
|
|
3,018,300 |
|
|
2024 |
|
|
2,725,700 |
|
|
2025 |
|
|
2,609,900 |
|
|
Thereafter |
|
|
1,987,600 |
|
|
Total |
|
|
16,631,000 |
|
|
Less: present value discount |
|
|
(2,570,700) |
|
|
Present value of lease liabilities |
|
$ |
14,060,300 |
|
|
|
|
|
|
|
|
Weighted-average discount rate: |
|
|
3.8% |
|
|
Weighted-average remaining lease term |
|
|
5.4 years |
|
55
Note 8. Commitments and Contingencies
Lawsuits and claims are filed against the Company from time to time in the ordinary course of business. The Company does not believe that any lawsuits or claims pending against the Company, individually or in the aggregate, are material, or will have a material adverse effect on the Company’s financial condition or results of operations. In addition, from time to time, the Company is also subject to review from federal and state taxing authorities in order to validate the amounts of income, sales and/or use taxes which have been claimed and remitted. Currently, our California sales tax returns for the period January 1, 2016 through December 31, 2018 and Illinois sales tax returns for the period March 1, 2018 through July 31, 2018 are under examination by applicable taxing authorities.
As the Company is routinely audited by state taxing authorities, the Company has estimated exposure and established reserves for its estimated sales tax audit liability.
Note 9. Operating Segments
The Company evaluates its business within two segments: commercial and retail. The commercial segment consists of the following customer markets: (1) public carriers, that are generally responsible for building and maintaining the infrastructure system and provide airtime service to individual subscribers; and (2) value-added resellers and integrators, which includes value-added resellers, the government channel and private system operator markets.
The retail segment consists of the market which includes retailers, independent dealer agents and carriers.
The Company evaluates revenue, gross profit and net profit contribution, and income before provision for income taxes in the aggregate for both the commercial and retail segments. Net profit contribution is defined as gross profit less any expenses that can be directly attributed. This includes sales, product management, purchasing, credit and collections and distribution team expenses, plus freight out and internal and external marketing costs. Corporate support expenses include administrative costs – finance, human resources, information technology, operating facility occupancy expenses, depreciation, amortization and interest, plus the Company-wide pay on performance bonus expense.
Certain cost of sales and other applicable expenses have been allocated to each market based on a percentage of revenues and/or gross profit, where appropriate.
56
Segment activity for the fiscal years ended 2020, 2019 and 2018 is as follows (in thousands):
|
|
|
Year Ended |
|||||||
|
|
|
March 29, 2020 |
|||||||
|
|
|
Commercial |
|
Retail |
|
|
|
||
|
|
|
Segment |
|
Segment |
|
Total |
|||
|
Revenues |
|
|
|
|
|
|
|
|
|
|
Public Carrier |
|
$ |
156,396 |
|
$ |
— |
|
$ |
156,396 |
|
Value-added resellers and Integrators |
|
|
252,619 |
|
|
— |
|
|
252,619 |
|
Retail |
|
|
— |
|
|
131,283 |
|
|
131,283 |
|
Total revenues |
|
$ |
409,015 |
|
$ |
131,283 |
|
$ |
540,298 |
|
|
|
|
|
|
|
|
|
|
|
|
Gross Profit |
|
|
|
|
|
|
|
|
|
|
Public Carrier |
|
$ |
18,699 |
|
$ |
— |
|
$ |
18,699 |
|
Value-added resellers and Integrators |
|
|
60,943 |
|
|
— |
|
|
60,943 |
|
Retail |
|
|
— |
|
|
12,181 |
|
|
12,181 |
|
Total gross profit |
|
$ |
79,642 |
|
$ |
12,181 |
|
$ |
91,823 |
|
|
|
|
|
|
|
|
|
|
|
|
Directly allocable expenses |
|
|
32,773 |
|
|
12,035 |
|
|
44,808 |
|
Segment net profit contribution |
|
$ |
46,869 |
|
$ |
146 |
|
|
47,015 |
|
Corporate support expenses |
|
|
|
|
|
|
|
|
76,289 |
|
Loss before provision for income taxes |
|
|
|
|
|
|
|
$ |
(29,274) |
|
|
|
Year Ended |
|||||||
|
|
|
March 31, 2019 |
|||||||
|
|
|
Commercial |
|
Retail |
|
|
|
||
|
|
|
Segment |
|
Segment |
|
Total |
|||
|
Revenues |
|
|
|
|
|
|
|
|
|
|
Public Carrier |
|
$ |
156,983 |
|
$ |
— |
|
$ |
156,983 |
|
Value-added resellers and Integrators |
|
|
262,062 |
|
|
— |
|
|
262,062 |
|
Retail |
|
|
— |
|
|
187,769 |
|
|
187,769 |
|
Total revenues |
|
$ |
419,045 |
|
$ |
187,769 |
|
$ |
606,814 |
|
|
|
|
|
|
|
|
|
|
|
|
Gross Profit |
|
|
|
|
|
|
|
|
|
|
Public Carrier |
|
$ |
20,275 |
|
$ |
— |
|
$ |
20,275 |
|
Value-added resellers and Integrators |
|
|
64,130 |
|
|
— |
|
|
64,130 |
|
Retail |
|
|
— |
|
|
36,954 |
|
|
36,954 |
|
Total gross profit |
|
$ |
84,405 |
|
$ |
36,954 |
|
$ |
121,359 |
|
|
|
|
|
|
|
|
|
|
|
|
Directly allocable expenses |
|
|
33,475 |
|
|
16,152 |
|
|
49,627 |
|
Segment net profit contribution |
|
$ |
50,930 |
|
$ |
20,802 |
|
|
71,732 |
|
Corporate support expenses |
|
|
|
|
|
|
|
|
64,441 |
|
Income before provision for income taxes |
|
|
|
|
|
|
|
$ |
7,291 |
57
|
|
|
Year Ended |
|||||||
|
|
|
April 1, 2018 |
|||||||
|
|
|
Commercial |
|
Retail |
|
|
|
||
|
|
|
Segment |
|
Segment |
|
Total |
|||
|
Revenues |
|
|
|
|
|
|
|
|
|
|
Public Carrier |
|
$ |
115,061 |
|
$ |
— |
|
$ |
115,061 |
|
Value-added resellers and Integrators |
|
|
270,615 |
|
|
— |
|
|
270,615 |
|
Retail |
|
|
— |
|
|
194,599 |
|
|
194,599 |
|
Total revenues |
|
$ |
385,676 |
|
$ |
194,599 |
|
$ |
580,275 |
|
|
|
|
|
|
|
|
|
|
|
|
Gross Profit |
|
|
|
|
|
|
|
|
|
|
Public Carrier |
|
$ |
16,707 |
|
$ |
— |
|
$ |
16,707 |
|
Value-added resellers and Integrators |
|
|
64,620 |
|
|
— |
|
|
64,620 |
|
Retail |
|
|
— |
|
|
38,901 |
|
|
38,901 |
|
Total gross profit |
|
$ |
81,327 |
|
$ |
38,901 |
|
$ |
120,228 |
|
|
|
|
|
|
|
|
|
|
|
|
Directly allocable expenses |
|
|
32,592 |
|
|
15,535 |
|
|
48,127 |
|
Segment net profit contribution |
|
$ |
48,735 |
|
$ |
23,366 |
|
|
72,101 |
|
Corporate support expenses |
|
|
|
|
|
|
|
|
64,628 |
|
Income before provision for income taxes |
|
|
|
|
|
|
|
$ |
7,473 |
To provide investors with better visibility, the Company also discloses revenue and gross profit by its four product categories:
|
· |
Base station infrastructure products are used to build, repair and upgrade wireless telecommunications systems. Products include base station antennas, cable and transmission lines, small towers, lightning protection devices, connectors, power systems, miscellaneous hardware, and mobile antennas. Base station infrastructure service offerings include connector installation, custom jumper assembly, site kitting and logistics integration. |
|
· |
Network systems products are used to build and upgrade computing and internet networks. Products include fixed and mobile broadband equipment, distributed antenna systems (DAS), wireless networking, filtering systems, two-way radios and security and surveillance products. This product category also includes training classes, technical support and engineering design services. |
|
· |
Installation, test and maintenance products are used to install, tune, maintain and repair wireless communications equipment. Products include sophisticated analysis equipment and various frequency, voltage- and power-measuring devices, as well as an assortment of tools, hardware, GPS, safety and replacement and component parts and supplies required by service technicians. |
|
· |
Mobile device accessories products include cellular phone and data device accessories such as replacement batteries, cases, speakers, mobile amplifiers, power supplies, headsets, mounts, car antennas, music accessories and data and memory cards. Retail merchandising displays, promotional programs, customized order fulfillment services and affinity-marketing programs, including private label internet sites, complement our mobile devices and accessory product offering. |
58
Supplemental revenue and gross profit information by product category for the fiscal years 2020, 2019 and 2018 are as follows (in thousands):
|
|
|
|
|
|
|
|
|
|
|
|
|
|
March 29, 2020 |
|
March 31, 2019 |
|
April 1, 2018 |
|||
|
|
|
|
|
|
|
|
|
|
|
|
|
|
|
|
|
|
|
|
|
|
|
Revenues |
|
|
|
|
|
|
|
|
|
|
Base station infrastructure |
|
$ |
286,642 |
|
$ |
292,787 |
|
$ |
248,949 |
|
Network systems |
|
|
87,553 |
|
|
86,555 |
|
|
98,642 |
|
Installation, test and maintenance |
|
|
28,064 |
|
|
32,595 |
|
|
33,200 |
|
Mobile device accessories |
|
|
138,039 |
|
|
194,877 |
|
|
199,484 |
|
Total revenues |
|
$ |
540,298 |
|
$ |
606,814 |
|
$ |
580,275 |
|
|
|
|
|
|
|
|
|
|
|
|
Gross Profit |
|
|
|
|
|
|
|
|
|
|
Base station infrastructure |
|
|
59,033 |
|
|
61,458 |
|
|
58,015 |
|
Network systems |
|
|
13,742 |
|
|
13,604 |
|
|
14,649 |
|
Installation, test and maintenance |
|
|
5,092 |
|
|
6,433 |
|
|
6,266 |
|
Mobile device accessories |
|
|
13,956 |
|
|
39,864 |
|
|
41,298 |
|
Total gross profit |
|
$ |
91,823 |
|
$ |
121,359 |
|
$ |
120,228 |
Note 10. Restructuring Charge
In the first quarter of fiscal year 2020, in an effort to streamline the organization, the Company took actions to restructure its operations thereby reducing costs, resulting in a $0.5 million pre-tax charge, which is included in our Consolidated Statements of Income for fiscal year 2020. The restructuring charge primarily consisted of severance-related expenses associated with a reduction in headcount.
Note 11. Stock Buyback
The Company withholds shares of common stock from its employees and directors, at their request, equal to the minimum federal and state tax withholdings related to vested performance stock units, stock option exercises and restricted stock awards. For fiscal years 2020, 2019, and 2018 the total value of shares withheld for taxes was $201,000, $111,100, and $65,400, respectively.
Note 12. Income Taxes
A reconciliation of the difference between the provision for income taxes computed at statutory rates and the provision for income taxes provided in the consolidated statements of income is as follows:
|
|
|
2020 |
|
2019 |
|
2018 |
|
|
|
|
|
|
|
|
|
|
|
Statutory federal rate |
|
21.0 |
% |
21.0 |
% |
31.3 |
% |
|
State taxes, net of federal benefit |
|
2.0 |
|
3.5 |
|
4.0 |
|
|
Non-deductible expenses |
|
(0.5) |
|
2.1 |
|
4.4 |
|
|
Change in uncertain tax positions |
|
— |
|
(4.6) |
|
— |
|
|
Change in valuation allowance |
|
(6.5) |
|
1.9 |
|
— |
|
|
Change in deferred tax related to key man life insurance |
|
— |
|
— |
|
(7.3) |
|
|
Rate change for loss carrybacks |
|
9.9 |
|
— |
|
— |
|
|
Other |
|
0.4 |
|
— |
|
(1.9) |
|
|
Effective rate |
|
26.3 |
% |
23.9 |
% |
30.5 |
% |
59
The provision for income taxes was comprised of the following:
|
|
|
2020 |
|
2019 |
|
2018 |
|
|||
|
|
|
|
|
|
|
|
|
|
|
|
|
Federal: Current |
|
$ |
(4,308,900) |
|
$ |
1,037,600 |
|
$ |
3,073,400 |
|
|
Deferred |
|
|
(2,596,500) |
|
|
576,200 |
|
|
(1,081,600) |
|
|
State: Current |
|
|
(418,700) |
|
|
52,600 |
|
|
433,400 |
|
|
Deferred |
|
|
(380,700) |
|
|
79,000 |
|
|
(148,000) |
|
|
Provision for income taxes |
|
$ |
(7,704,800) |
|
$ |
1,745,400 |
|
$ |
2,277,200 |
|
Total net deferred tax assets (liabilities) as of March 29, 2020 and March 31, 2019, and the sources of the differences between financial accounting and tax basis of the Company's assets and liabilities which give rise to the deferred tax assets, are as follows:
|
|
|
2020 |
|
2019 |
|
||
|
Deferred tax assets : |
|
|
|
|
|
|
|
|
Deferred compensation |
|
$ |
264,300 |
|
$ |
267,300 |
|
|
Accrued vacation |
|
|
469,100 |
|
|
312,300 |
|
|
Deferred rent |
|
|
3,258,600 |
|
|
34,500 |
|
|
Allowance for doubtful accounts |
|
|
1,130,900 |
|
|
488,000 |
|
|
Inventory reserves |
|
|
2,794,200 |
|
|
1,406,100 |
|
|
Sales tax reserves |
|
|
122,900 |
|
|
192,900 |
|
|
Sales return assets |
|
|
1,200,400 |
|
|
478,600 |
|
|
Other liabilities |
|
|
— |
|
|
205,700 |
|
|
Net operating loss |
|
|
275,400 |
|
|
141,600 |
|
|
Business interest limitation carryforward |
|
|
259,300 |
|
|
— |
|
|
Other assets |
|
|
1,013,600 |
|
|
652,800 |
|
|
|
|
|
10,788,700 |
|
|
4,179,800 |
|
|
Valuation allowance |
|
|
(2,047,300) |
|
|
(141,600) |
|
|
Total deferred tax assets |
|
|
8,741,400 |
|
|
4,038,200 |
|
|
|
|
|
|
|
|
|
|
|
Deferred tax liabilities : |
|
|
|
|
|
|
|
|
Depreciation and amortization |
|
|
(419,200) |
|
|
(3,094,000) |
|
|
Sales return liabilities |
|
|
(950,600) |
|
|
(365,200) |
|
|
Lease right of use |
|
|
(3,232,900) |
|
|
— |
|
|
Prepaid expenses |
|
|
(1,106,200) |
|
|
(523,700) |
|
|
Total deferred tax liabilities |
|
|
(5,708,900) |
|
|
(3,982,900) |
|
|
Net Deferred Tax Assets |
|
$ |
3,032,500 |
|
$ |
55,300 |
|
The valuation allowance recorded by the Company as of March 29, 2020 resulted from the uncertainties of the future realization of federal and state deferred tax assets. The valuation allowance recorded by the Company as of March 31, 2019 resulted from the uncertainties of the future realization of state deferred tax assets mainly resulting from state net operating loss carryovers. The Company will continue to assess and evaluate strategies that will enable the deferred tax asset, or portion thereof, to be realized, and will reduce the valuation allowance appropriately as such time when it is determined that the “more likely than not” criteria is satisfied.
As of March 29, 2020, the Company had state net operating loss carryforwards of $38,066,068 which will generally begin to expire in fiscal year 2030 through fiscal year 2040. Certain state net operating loss carryovers do not expire.
As of March 29, 2020 and March 31, 2019, the Company had no unrecognized tax benefits.
The Company’s accounting policy with respect to interest and penalties related to tax uncertainties is to classify these amounts as part of the provision for income taxes. The total amount of interest and penalties related to tax
60
uncertainties recognized in the consolidated statement of income for fiscal year 2020 and 2019 was a benefit of $0 and $250,500 (net of federal detriment), respectively. The cumulative amount included in the consolidated balance sheet as of March 29, 2020 and March 31, 2019 was $0. The total amount of interest and penalties related to tax uncertainties recognized in the consolidated statement of income for fiscal year 2018 was a benefit of $38,100 (net of federal expense) and the cumulative amount included as a liability in the consolidated balance sheet as of April 1, 2018 was $250,500 (net of federal benefit).
A reconciliation of the changes in the gross balance of unrecognized tax benefit amounts, exclusive of interest, is as follows:
|
|
|
2020 |
|
2019 |
|
2018 |
|
|||
|
Beginning balance of unrecognized tax benefit |
|
$ |
— |
|
$ |
112,700 |
|
$ |
204,500 |
|
|
Increases related to current period tax positions |
|
|
— |
|
|
3,500 |
|
|
— |
|
|
Reductions as a result of a lapse in the applicable statute of limitations |
|
|
— |
|
|
(116,200) |
|
|
(91,800) |
|
|
Ending balance of unrecognized tax benefits |
|
$ |
— |
|
$ |
— |
|
$ |
112,700 |
|
On December 22, 2017, President Trump signed into law the Tax Cuts and Jobs Act, which we refer to herein as the 2017 Tax Act. While the changes from the Tax Act were generally effective for tax years beginning after December 31, 2017, ASC No. 740, Accounting for Income Taxes, requires companies to recognize the effect of tax law changes in the period of enactment. Given the significance of the legislation, the SEC staff issued Staff Accounting Bulletin No. 118 (SAB 118), which allowed registrants to record provisional amounts in earnings for the year ended April 1, 2018. The Company was required to complete its tax accounting for the 2017 Tax Act when it had obtained, prepared and analyzed the information to complete the income tax accounting but no later than December 22, 2018. Accordingly, during fiscal year 2019, the Company completed its accounting for the tax effects of the enactment of the 2017 Tax Act based on the Company’s interpretation on the new tax regulations and related guidance issued by the U.S. Department of the Treasury and the IRS. The Company did not record a material adjustment to the provided provisional amount of $0.2 million.
On March 27, 2020, the Coronavirus Aid, Relief, and Economic Security Act (CARES Act) was signed into law making several changes to the Internal Revenue Code. The changes include, but are not limited to: increasing the limitation on the amount of deductible business interest expense, allowing companies to carryback certain net operating losses to the preceding five years, and increasing the amount of net operating loss carryforwards that corporations can use to offset taxable income. Under the CARES Act, the Company is able to recognize the benefit of $4,800,000 by carrying back the current loss to prior periods.
The Company files income tax returns in U.S. federal, state and local jurisdictions. Certain income tax returns for fiscal years 2016 through 2019 remain open to examination by U.S. federal, state and local tax authorities. All state net operating losses generated to date are subject to adjustment for state income tax purposes. Currently, our New York income tax return for tax year 2016 is under examination. The potential outcome of the current examination could result in a change to unrecognized tax benefits within the next twelve months. However, we cannot reasonably estimate possible adjustments at this time.
Note 13. Retirement Plans
The Company has a 401(k) plan that covers all eligible employees. Contributions to the plan can be made by employees and the Company may make matching contributions at its discretion. Expense related to this matching contribution was $937,500, $957,100, and $928,100 during fiscal years 2020, 2019, and 2018, respectively. As of March 29, 2020, plan assets included 180,000 shares of common stock of the Company.
The Company maintains a Supplemental Executive Retirement Plan for Robert B. Barnhill, Jr., the Company’s Chairman of the Board. This plan is funded through life insurance policies for which the Company is the sole beneficiary. The cash surrender value of the life insurance policies and the net present value of the benefit obligation of approximately $2,523,500 and $915,700, respectively, as of March 29, 2020 and $2,326,800 and $853,400, respectively, as of March 31, 2019, are included in other long-term assets and other long-term liabilities, respectively, in the accompanying Consolidated Balance Sheets.
61
Note 14. Earnings Per Share
The Company presents the computation of earnings per share (“EPS”) on a basic and diluted basis. Basic EPS is computed by dividing net income by the weighted average number of shares outstanding during the reported period. Diluted earnings per share are computed similarly to basic earnings per share, except that the denominator is increased to include the number of additional common shares that would have been outstanding if the potential additional common shares that were dilutive had been issued. Shares of common stock are excluded from the calculation if they are determined to be anti-dilutive.
The following table presents the calculation of basic and diluted earnings per common share:
|
|
|
Amounts in thousands, except per share amounts |
|||||||
|
Amounts in thousands, except per share amounts |
|
2020 |
|
2019 |
|
2018 |
|||
|
Earnings per share – Basic: |
|
|
|
|
|
|
|
|
|
|
Net earnings |
|
$ |
(21,569) |
|
$ |
5,546 |
|
$ |
5,195 |
|
|
|
|
|
|
|
|
|
|
|
|
Weighted average common shares outstanding – Basic |
|
|
8,527 |
|
|
8,437 |
|
|
8,371 |
|
|
|
|
|
|
|
|
|
|
|
|
Earnings per common share – Basic |
|
$ |
(2.53) |
|
$ |
0.66 |
|
$ |
0.62 |
|
|
|
|
|
|
|
|
|
|
|
|
Earnings per share – Diluted: |
|
|
|
|
|
|
|
|
|
|
Net earnings |
|
$ |
(21,569) |
|
$ |
5,546 |
|
$ |
5,195 |
|
|
|
|
|
|
|
|
|
|
|
|
Weighted average common shares outstanding – Basic |
|
|
8,527 |
|
|
8,437 |
|
|
8,371 |
|
Effect of dilutive options |
|
|
— |
|
|
130 |
|
|
100 |
|
Weighted average common shares outstanding – Diluted |
|
|
8,527 |
|
|
8,567 |
|
|
8,471 |
|
|
|
|
|
|
|
|
|
|
|
|
Earnings per common share – Diluted |
|
$ |
(2.53) |
|
$ |
0.65 |
|
$ |
0.61 |
|
|
|
|
|
|
|
|
|
|
|
|
Anti-dilutive equity awards not included above |
|
|
852 |
|
|
94 |
|
|
40 |
At March 29, 2020, March 31, 2019, and April 1, 2018 stock options with respect to 862,000, 591,500 and 540,000 shares of common stock were outstanding, respectively. The anti-dilutive stock options outstanding at March 29, 2020, March 31, 2019, and April 1, 2018 total 852,000, 94,000 and 40,000, respectively. There were no anti-dilutive Performance Stock Units or Restricted Stock Units outstanding as of March 29, 2020, March 31, 2019, and April 1, 2018.
Note 15. Stock‑Based Compensation
The Company’s selling, general and administrative expenses for the fiscal years ended March 29, 2020, March 31, 2019, and April 1, 2018 includes $1,174,600, $1,244,000, and $1,002,100, respectively, of stock compensation expense. Provision for income taxes for the fiscal years ended March 29, 2020, March 31, 2019, and April 1, 2018 includes $308,900, $297,300, and $305,400, respectively, of income tax benefits related to our stock-based compensation arrangements. Stock compensation expense is primarily related to our Performance Stock Units (PSUs), Restricted Stock Units (RSUs) and Stock Options, granted or outstanding under the Company’s Third Amended and Restated Stock and Incentive Plan (the “1994 Plan”) and 2019 Stock and Incentive Plan (the “2019 Plan” and together with the 1994 Plan, the “Plans), which was approved at the Annual Meeting of Shareholders held on July 25, 2019. No additional awards may be granted under the 1994 Plan, although awards outstanding under the 1994 Plan remain outstanding and governed by its terms.
As of March 29, 2020, 685,927 shares were available for issue in respect of future awards under the 2019 Plan. Subsequent to the Company’s 2020 fiscal year end, on April 30, 2020 and May 15, 2020, the Compensation Committee of the Board of Directors with concurrence of the full Board of Directors, granted stock options to select key employees to purchase an aggregate of 225,000 shares of the Company’s common stock. Also on May 15, 2020, based on fiscal year
62
2020 results, all 33,116 shares related to PSUs issued for the fiscal 2020 performance year were canceled, and as a result, these shares were made available for future grants under the 2019 Plan. In addition, RSU awards for 21,000 shares and restricted stock awards for 65,821 shares were made on May 15, 2020, entitling the recipients to receive up to 86,821 shares of common stock in the aggregate, depending upon vesting. Accordingly, as of May 15, 2020, an aggregate of 407,222 shares were available for future awards under the 2019 Plan.
Performance Stock Units: Under a program established by the Board of Directors, PSUs have been granted under the Plans to selected employees. Each PSU entitles the participant to earn TESSCO common stock, but only after earnings per share and, for non-director employee participants, individual performance targets are met over a defined performance cycle. Performance cycles, which are fixed for each grant at the date of grant, are one year. Once earned, shares vest and are issued over a specified period of time determined at the time of the grant, provided that the participant remains employed by or associated with the Company at the time of share issuance. Earnings per share targets, which take into account the earnings impact of this program, are set by the Board of Directors in advance for the complete performance cycle at levels designed to grow shareholder value. If actual performance does not reach the minimum annual or threshold targets, no shares are issued. In accordance with ASC No. 718, the Company records compensation expense on its PSUs over the service period, based on the number of shares management estimates will ultimately be issued. Accordingly, the Company determines the periodic financial statement compensation expense based upon the stock price at the PSU grant date, net of the present value of dividends expected to be paid on TESSCO common stock before the PSU vests, management’s projections of future EPS performance over the performance period, and the resulting amount of estimated share issuances. As discussed in Note 2 above, the Company accounts for forfeitures as they occur rather than estimate expected forfeitures. To the extent that forfeitures occur, stock-based compensation related to the restricted awards may be different from the Company’s expectations.
The following table summarizes the activity under the Company’s PSU program for fiscal years 2020, 2019 and 2018:
|
|
|
2020 |
|
2019 |
|
2018 |
|
|||||||||
|
|
|
|
|
Weighted |
|
|
|
Weighted |
|
|
|
Weighted |
|
|||
|
|
|
|
|
Average Fair |
|
|
|
Average Fair |
|
|
|
Average Fair |
|
|||
|
|
|
Shares |
|
Value at Grant |
|
Shares |
|
Value at Grant |
|
Shares |
|
Value at Grant |
|
|||
|
Unvested shares available for issue under outstanding PSUs, beginning of period |
|
98,306 |
|
$ |
14.55 |
|
67,000 |
|
$ |
12.65 |
|
170,100 |
|
$ |
11.17 |
|
|
PSUs Granted |
|
51,616 |
|
|
15.93 |
|
71,000 |
|
|
15.58 |
|
86,000 |
|
|
12.67 |
|
|
PSUs Vested |
|
(29,036) |
|
|
14.09 |
|
(14,257) |
|
|
12.66 |
|
(7,600) |
|
|
19.58 |
|
|
PSUs Forfeited/Cancelled |
|
(52,532) |
|
|
9.82 |
|
(25,437) |
|
|
13.46 |
|
(181,500) |
|
|
10.99 |
|
|
Unvested shares available for issue under outstanding PSUs, end of period |
|
68,355 |
|
$ |
19.42 |
|
98,306 |
|
$ |
14.55 |
|
67,000 |
|
$ |
12.65 |
|
As of March 29, 2020, there was $0.3 million unrecognized compensation cost, related to PSUs earned. Total fair value of shares vested during fiscal years 2020, 2019 and 2018 was $780,400, $460,800 and $277,600, respectively.
The PSUs canceled during fiscal year 2020 primarily related to the fiscal year 2019 grant of PSUs which had a one-year measurement period (fiscal 2019) and employee departures. The PSUs were canceled because the minimum applicable fiscal 2019 performance targets were not fully satisfied. Per the provisions of the 2019 Plan, the shares related to these forfeited and canceled PSUs were added back to the 2019 Plan and became available for future issuance under the 2019 Plan.
Of the PSUs outstanding at the end of fiscal year 2020 covering 68,355 non-vested shares, PSUs covering 33,116 shares were subsequently canceled in May 2020, based on fiscal year 2020 performance. These PSUs were canceled because fiscal year 2020 earnings per share did not reach the target performance set forth in the PSU award agreements. The remaining 35,239 shares covered by PSUs outstanding at the end of fiscal year 2020 were earned based on fiscal year
63
2019 and 2018 performance, but were not yet vested as of March 29, 2020. Assuming the respective participants remain employed by, or affiliated with the Company, these shares will vest on or about May 1 of 2020, 2021, and 2022 as follows:
|
|
|
Number of Shares |
|
|
2020 |
|
19,191 |
|
|
2021 |
|
10,739 |
|
|
2022 |
|
5,309 |
|
|
|
|
35,239 |
|
Restricted Stock/Restricted Stock Units: On May 10, 2017, the Compensation Committee, with the concurrence of the full Board of Directors, granted an aggregate of 18,000 RSU awards to non-employee directors of the Company and to the then Executive Chairman. These awards provide for the issuance of shares of the Company’s common stock in accordance with a vesting schedule. These awards have vested or will vest, and shares have been or will be issued, 25% on or about each of May 1 of 2018, 2019, 2020 and 2021, provided that the participant remains associated with the Company (or meets other criteria as prescribed in the agreement) on each such date. As of March 29, 2020, there was less than $0.1 million of total unrecognized compensation costs related to these awards. Unrecognized compensation costs are expected to be recognized ratably over a weighted average period of approximately one year.
On August 8, 2017, the Compensation Committee, with the concurrence of the full Board of Directors, awarded an aggregate of up to 56,000 RSUs to several senior executives. The number of shares earned by a recipient will be determined by multiplying the number of RSUs covered by the award by a fraction, the numerator of which is the cumulative amount of dividends (regular, ordinary and special) declared and paid, per share, on the common stock, over an earnings period of up to four years, and the denominator of which is $3.20. Subject to earlier issuance upon the occurrence of certain events (as described in the applicable award agreement), any earned shares are issued and distributed to the recipient upon the fourth anniversary of the award date. As of March 29, 2020, 15,000 of these 56,000 RSUs have been canceled due to employee departures, leaving 41,000 of these RSUs outstanding. An additional 2,000 RSU’s with similar terms (but with a shorter earnings period) were awarded in fiscal 2019, and in connection with his hiring as our new President and Chief Executive Officer, the Company issued an additional RSU grant to Mr. Mukerjee under the 2019 Plan for 19,000 shares and with similar terms (a four-year earning period and a denominator of $3.20). As a result, an aggregate of 62,000 dividend-based RSUs currently remain outstanding. As of March 29, 2020, there was less than $0.1 million of total unrecognized compensation cost related to all outstanding RSUs noted above, assuming all shares are earned. Unrecognized compensation costs are expected to be recognized ratably over a weighted average period of approximately one year.
On May 10, 2018 and June 6, 2018, the Compensation Committee, with the concurrence of the full Board of Directors, granted an aggregate of 21,000 RSU awards to non-employee directors of the Company and to the then Executive Chairman. These awards provide for the issuance of shares of the Company’s common stock in accordance with a vesting schedule. These awards have vested or will vest, and shares have been or will be issued, 25% on or about each of May 1 of 2019, 2020, 2021 and 2022, provided that the participant remains associated with the Company (or meets other criteria as prescribed in the agreement) on each such date. As of March 29, 2020, there was approximately $0.2 million of total unrecognized compensation costs related to these awards. Unrecognized compensation costs related to these awards are expected to be recognized ratably over a period of approximately two years.
On May 10, 2019, the Compensation Committee, with the concurrence of the full Board of Directors, granted an aggregate of 21,000 RSU, ratably to the six non-employee directors, including the Chairman of the Board of the Company. These RSU awards provide for the issuance of shares of the Company’s common stock in four equal installments beginning on May 10, 2020 and continuing on the same date in 2021, 2022 and 2023, provided that the director remains associated with the Company on each such date (or meets other criteria as prescribed in the applicable award agreement). As of March 29, 2020, there was approximately $0.3 million of total unrecognized compensation costs related to these awards. Unrecognized compensation costs related to these awards are expected to be recognized ratably over a period of approximately three years.
Subsequent to the Company’s 2020 fiscal year end, on May 15, 2020, the Compensation Committee, with the concurrence of the full Board of Directors, granted an aggregate of 21,000 RSU awards to non-employee directors of the
64
Company. These awards provide for the issuance of shares of the Company’s common stock in accordance with a vesting schedule. These awards will vest and shares will be issued 25% on or about each of May 1 of 2021, 2022, 2023 and 2024, provided that the participant remains associated with the Company (or meets other criteria as prescribed in the agreement) on each such date.
In addition, and also on May 15, 2020, the Compensation Committee, with the concurrence of the full Board of Directors, granted an aggregate of 65,821 shares of restricted stock to non-employee directors of the Company in lieu of their annual cash retainer for fiscal 2021. The amount of shares issued was the cash equivalent of the required retainers on the approval date. These awards provide for the issuance of shares of the Company’s common stock subject to a risk of forfeiture that will lapse in whole or in part on July 1, 2021, generally depending on the length of continued service of the recipient on the Board for fiscal 2021. Dividends accruing in respect of the shares of restricted stock, if any, will accrue but will not be paid until July 1, 2021 and only in respect of those shares for which the risk of forfeiture has then lapsed.
PSUs, RSUs and restricted stock awards are expensed based on the grant date fair value, calculated as the closing price of TESSCO common stock as reported by Nasdaq on the date of grant minus, in the case of PSUs and RSUs, the present value of dividends expected to be paid on the common stock before the award vests, because dividends or dividend-equivalent amounts do not accrue and are not paid on unvested PSUs and RSUs.
The Company accounts for forfeitures as they occur rather than estimate expected forfeitures. To the extent that forfeitures occur, stock-based compensation related to the restricted awards may be different from the Company’s expectations.
Stock Options: The grant date value of the Company’s stock options has been determined using the Black-Scholes-Merton pricing model, based upon facts and assumptions existing at the date of grant. Stock options granted have exercise prices equal to the market price of the Company’s stock on the grant date. The stock options vest 25% after one year and then 1/36 per month for the following three years. During fiscal 2020, stock options for 86,375 shares were forfeited due to employee departures. The weighted-average remaining contractual term of options exercisable as of March 29, 2020 was 2.5 years.
The value of each option at the date of grant is amortized as compensation expense over the service period. This occurs without regard to subsequent changes in stock price, volatility or interest rates over time, provided the option remains outstanding. The following tables summarize the pertinent information for outstanding options.
|
|
|
2020 |
|
2019 |
||||||
|
|
|
|
|
Weighted |
|
|
|
Weighted |
||
|
|
|
|
|
Average Fair |
|
|
|
Average Fair |
||
|
|
|
Shares |
|
Value at Grant |
|
Shares |
|
Value at Grant |
||
|
Unvested options, beginning of period |
|
281,292 |
|
$ |
2.39 |
|
392,500 |
|
|
2.21 |
|
Options Granted |
|
405,000 |
|
|
2.53 |
|
66,500 |
|
|
3.38 |
|
Options Forfeited/Cancelled |
|
(81,376) |
|
|
3.23 |
|
(15,000) |
|
|
4.26 |
|
Options Vested |
|
(139,542) |
|
|
2.32 |
|
(162,708) |
|
|
2.20 |
|
Unvested options, end of period |
|
465,374 |
|
|
2.38 |
|
281,292 |
|
|
2.39 |
|
|
|
|
|
|
|
|
March 29, 2020 |
||
|
Grant Fiscal Year |
|
Options Granted |
|
|
Option Exercise Price |
|
Options Outstanding |
|
Options Exercisable |
| 2020 |
|
405,000 |
|
$ |
13.54 |
|
368,000 |
|
- |
| 2019 |
|
66,500 |
|
$ |
16.31 |
|
44,000 |
|
19,125 |
| 2018 |
|
230,000 |
|
$ |
15.12 |
|
110,000 |
|
76,044 |
| 2017 |
|
410,000 |
|
$ |
12.57 |
|
300,000 |
|
261,457 |
| 2016 |
|
100,000 |
|
$ |
22.42 |
|
40,000 |
|
40,000 |
|
Total |
|
|
|
|
|
|
862,000 |
|
396,626 |
65
|
Grant Fiscal Year |
|
Expected Stock Price Volatility |
|
Risk-Free Interest Rate |
|
Expected Dividend Yield |
|
Average Expected Term |
|
Resulting Black Scholes Value |
||||
|
2020 |
|
35.88 |
% |
|
2.00 |
% |
|
5.82 |
% |
|
4.0 |
|
$ |
2.53 |
|
2019 |
|
35.59 |
% |
|
3.11 |
% |
|
4.99 |
% |
|
4.0 |
|
$ |
3.38 |
|
2018 |
|
32.63 |
% |
|
1.96 |
% |
|
5.34 |
% |
|
4.0 |
|
$ |
2.57 |
As of March 29, 2020, there was approximately $0.9 million of total unrecognized compensation costs related to these awards. Unrecognized compensation costs related to these awards are expected to be recognized ratably over a period of approximately three years. Total value of options exercised during fiscal 2020 was $681,100. 48,125 shares were exercised, and the weighted average exercise price of these shares was $14.15. No options were exercised during fiscal 2019 or 2018.
Subsequent to the Company’s 2020 fiscal year end, on April 30, 2020 and May 15, 2020, the Compensation Committee, with the concurrence of the full Board of Directors, granted an aggregate of 160,000 stock options to select key employees. The grant date value of these stock options has been determined using the Black-Scholes-Merton pricing model, based upon facts and assumptions existing at the date of grant. Stock options granted have exercise prices equal to the market price of the Company’s stock on the grant date. The stock options vest 25% after one year and then 1/36 per month for the following three years.
Subsequent to the Company’s 2020 fiscal year end, on May 15, 2020, the Compensation Committee, with the concurrence of the full Board of Directors, granted an aggregate of 65,000 performance-based stock options to select key employees. The grant date value of these stock options has been determined using the Black-Scholes-Merton pricing model, based upon facts and assumptions existing at the date of grant. Stock options granted have exercise prices equal to the market price of the Company’s stock on the grant date. If certain performance-based milestones are met and the employee remains employed by the Company, the stock options vest 25% after one year and then 1/36 per month for the following three years.
Team Member Stock Purchase Plan: The Company has a Team Member Stock Purchase Plan that permits eligible employees to purchase up to an aggregate of 450,000 shares of the Company's common stock at 85% of the lower of the market price on the first day of a six-month period or the market price on the last day of that same six-month period. Expenses incurred for the Team Member Stock Purchase Plan during the fiscal years ended March 29, 2020, March 31, 2019, and April 1, 2018 were $78,400, $82,600, and $49,700, respectively. During the fiscal years ended March 29, 2020, March 31, 2019, and April 1, 2018, 34,829, 19,183, and 13,423 shares were sold to employees under this plan, having a weighted average market value of $7.51, $14.54, and $11.08, respectively.
Note 16. Fair Value Disclosure
Assets and liabilities carried at fair value are classified and disclosed in one of the following three categories:
|
· |
Level 1: Quoted prices (unadjusted) in active markets for identical assets or liabilities. |
|
· |
Level 2: Inputs other than quoted prices included within Level 1 that are observable for the asset or liability, either directly or indirectly. These include quoted prices for similar assets or liabilities in active markets, and quoted prices for identical or similar assets or liabilities in markets that are not active. |
|
· |
Level 3: Unobservable inputs for the asset or liability that reflect the reporting entity’s own assumptions about the inputs used in pricing the asset or liability. |
As of March 29, 2020 and March 31, 2019, the Company has no assets or liabilities recorded at fair value.
The carrying amounts of cash and cash equivalents, trade accounts receivable, product inventory, trade accounts payable, accrued expenses, our term loan, life insurance policies and other current liabilities approximate their fair values as of March 29, 2020 and March 31, 2019 due to their short-term nature.
66
Note 17. Supplemental Cash Flow Information
Cash paid for income taxes net of refunds, for fiscal years 2020, 2019, and 2018 totaled $1,515,300, $1,835,400, and $2,440,000, respectively. Cash paid for interest during fiscal years 2020, 2019, and 2018 totaled $1,106,300, $809,000, and $406,200, respectively. Interest capitalized during fiscal year 2020 was $87,700. No interest was capitalized during fiscal years 2019 and 2018.
Note 18. Concentration of Risk
Sales to customers and purchases from suppliers are largely governed by individual sales or purchase orders, so there is no guarantee of future business. In some cases, the Company has more formal agreements with significant customers or suppliers, but they are largely administrative in nature and are terminable by either party upon several months or otherwise short notice and they typically contain no obligation to make purchases from TESSCO. In the event a significant customer decides to make its purchases from another source, experiences a significant change in demand internally or from its own customer base, becomes financially unstable, or is acquired by another company, the Company’s ability to generate revenues from these customers may be significantly affected, resulting in an adverse effect on its financial position and results of operations.
The Company is dependent on third-party equipment manufacturers, distributors and dealers for all of its supply of wireless communications equipment. For fiscal years 2020, 2019, and 2018, sales of products purchased from the Company's top ten suppliers accounted for 50%, 48%, and 43% of total revenues, respectively. Products purchased from the Company’s largest commercial supplier accounted for approximately 23%, 16%, and 11% of total revenues in fiscal years 2020, 2019, and 2018, respectively. Products purchased from the Company’s largest retail supplier accounted for approximately 7%, 8%, and 10% of total revenues in fiscal years 2020, 2019, and 2018, respectively. The Company is dependent on the ability of its suppliers to provide products on a timely basis and on favorable pricing terms. The Company believes that alternative sources of supply are available for many of the product types it carries, but not for all products offered by the Company. The loss of certain principal suppliers, including the suppliers referenced above, or of other suppliers whose products may be difficult to source on comparable terms elsewhere, would have a material adverse effect on the Company.
As noted, the Company's future results could also be negatively impacted by the loss of certain customers, and/or supplier relationships. For fiscal years 2020, 2019, and 2018, sales of products to the Company's top ten customer relationships accounted for 31%, 32%, and 28% of total revenues, respectively. There was one customer that accounted for 11% of total revenues in fiscal year 2020. No customer accounted for more than 10% of total revenues in fiscal year 2019 and 2018.
67
Note 19. Quarterly Results of Operations (Unaudited)
Summarized quarterly financial data for the fiscal years ended March 29, 2020 and March 31, 2019 is presented in the table below.
|
|
|
Fiscal Year 2020 Quarters Ended |
|
Fiscal Year 2019 Quarters Ended |
|
||||||||||||||||||||
|
|
|
March 29, |
|
December 29, |
|
September 29, |
|
June 30, |
|
March 31, |
|
December 30, |
|
September 30, |
|
July 1, |
|
||||||||
|
|
|
2020 |
|
2019 |
|
2019 |
|
2019 |
|
2019 |
|
2018 |
|
2018 |
|
2018 |
|
||||||||
|
Revenues |
|
$ |
128,179,900 |
|
$ |
139,578,200 |
|
$ |
141,810,900 |
|
$ |
130,729,300 |
|
$ |
144,963,800 |
|
$ |
152,294,500 |
|
$ |
158,636,100 |
|
$ |
150,919,400 |
|
|
Cost of goods sold |
|
|
111,014,000 |
|
|
116,503,900 |
|
|
115,491,600 |
|
|
105,465,800 |
|
|
116,696,600 |
|
|
121,295,800 |
|
|
127,241,400 |
|
|
120,221,300 |
|
|
Gross profit |
|
|
17,165,900 |
|
|
23,074,300 |
|
|
26,319,300 |
|
|
25,263,500 |
|
|
28,267,200 |
|
|
30,998,700 |
|
|
31,394,700 |
|
|
30,698,100 |
|
|
Selling, general and administrative expenses |
|
|
27,493,900 |
|
|
26,479,100 |
|
|
25,745,200 |
|
|
28,096,500 |
|
|
27,280,300 |
|
|
27,494,800 |
|
|
29,477,300 |
|
|
28,961,300 |
|
|
Goodwill impairment |
|
|
9,108,600 |
|
|
2,569,100 |
|
|
— |
|
|
— |
|
|
— |
|
|
— |
|
|
— |
|
|
— |
|
|
Restructuring charges |
|
|
— |
|
|
— |
|
|
— |
|
|
488,000 |
|
|
— |
|
|
— |
|
|
— |
|
|
— |
|
|
Operating expenses |
|
|
36,602,500 |
|
|
29,048,200 |
|
|
25,745,200 |
|
|
28,584,500 |
|
|
27,280,300 |
|
|
27,494,800 |
|
|
29,477,300 |
|
|
28,961,300 |
|
|
(Loss) income from operations |
|
|
(19,436,600) |
|
|
(5,973,900) |
|
|
574,100 |
|
|
(3,321,000) |
|
|
986,900 |
|
|
3,503,900 |
|
|
1,917,400 |
|
|
1,736,800 |
|
|
Interest, net |
|
|
204,600 |
|
|
367,900 |
|
|
335,100 |
|
|
208,700 |
|
|
186,700 |
|
|
247,900 |
|
|
244,800 |
|
|
174,400 |
|
|
(Loss) income before (benefit from) provision for income taxes |
|
|
(19,641,200) |
|
|
(6,341,800) |
|
|
239,000 |
|
|
(3,529,700) |
|
|
800,200 |
|
|
3,256,000 |
|
|
1,672,600 |
|
|
1,562,400 |
|
|
(Benefit from ) provision for income taxes |
|
|
(5,564,500) |
|
|
(1,320,400) |
|
|
217,000 |
|
|
(1,036,900) |
|
|
308,200 |
|
|
551,400 |
|
|
481,800 |
|
|
404,000 |
|
|
Net (loss) income |
|
$ |
(14,076,700) |
|
$ |
(5,021,400) |
|
$ |
22,000 |
|
$ |
(2,492,800) |
|
$ |
492,000 |
|
$ |
2,704,600 |
|
$ |
1,190,800 |
|
$ |
1,158,400 |
|
|
Diluted (loss) earnings per share |
|
$ |
(1.65) |
|
$ |
(0.59) |
|
$ |
— |
|
$ |
(0.29) |
|
$ |
0.06 |
|
$ |
0.32 |
|
$ |
0.14 |
|
$ |
0.13 |
|
|
Cash dividends declared per common share |
|
$ |
0.02 |
|
$ |
0.20 |
|
$ |
0.20 |
|
$ |
0.20 |
|
$ |
0.20 |
|
$ |
0.20 |
|
$ |
0.20 |
|
$ |
0.20 |
|
68
Report of Independent Registered Public Accounting Firm
To the Shareholders and the Board of Directors of TESSCO Technologies Incorporated
Opinion on the Financial Statements
We have audited the accompanying consolidated balance sheets of TESSCO Technologies Incorporated and subsidiaries (the Company) as of March 29, 2020 and March 31, 2019, the related consolidated statements of (loss) income, shareholders' equity and cash flows for each of the three fiscal years in the period ended March 29, 2020, and the related notes and financial statement schedule listed in the Index at Item 15(a)2 (collectively referred to as the “consolidated financial statements”). In our opinion, the consolidated financial statements present fairly, in all material respects, the financial position of the Company at March 29, 2020 and March 31, 2019, and the results of its operations and its cash flows for each of the three years in the period ended March 29, 2020, in conformity with U.S generally accepted accounting principles.
We also have audited, in accordance with the standards of the Public Company Accounting Oversight Board (United States) (PCAOB), the Company's internal control over financial reporting as of March 29, 2020, based on criteria established in Internal Control-Integrated Framework issued by the Committee of Sponsoring Organizations of the Treadway Commission (2013 framework) and our report dated June 5, 2020 expressed an unqualified opinion thereon.
Basis for Opinion
These financial statements are the responsibility of the Company's management. Our responsibility is to express an opinion on the Company’s financial statements based on our audits. We are a public accounting firm registered with the PCAOB and are required to be independent with respect to the Company in accordance with the U.S. federal securities laws and the applicable rules and regulations of the Securities and Exchange Commission and the PCAOB.
We conducted our audits in accordance with the standards of the PCAOB. Those standards require that we plan and perform the audit to obtain reasonable assurance about whether the financial statements are free of material misstatement, whether due to error or fraud. Our audits included performing procedures to assess the risks of material misstatement of the financial statements, whether due to error or fraud, and performing procedures that respond to those risks. Such procedures included examining, on a test basis, evidence regarding the amounts and disclosures in the financial statements. Our audits also included evaluating the accounting principles used and significant estimates made by management, as well as evaluating the overall presentation of the financial statements. We believe that our audits provide a reasonable basis for our opinion.
/s/ Ernst & Young LLP
We have served as the Company’s auditor since 2002.
Baltimore, Maryland
June 5, 2020
69
Item 9. Changes in and Disagreements with Accountants on Accounting and Financial Disclosure.
None.
Item 9A. Controls and Procedures.
Disclosure Controls and Procedures
We maintain a system of disclosure controls and procedures that is designed to provide reasonable assurance that information, which is required to be disclosed by the Company in the reports that it files or submits under the Securities and Exchange Act of 1934, as amended, is recorded, processed, summarized and reported within the time periods specified in the rules and forms of the Securities and Exchange Commission, and is accumulated and communicated to management in a timely manner. Our Chief Executive Officer and Chief Financial Officer have evaluated our disclosure controls and procedures as of the end of the period covered by this Annual Report on Form 10-K, and have concluded that our disclosure controls and procedures are effective at the reasonable assurance level.
Internal Control over Financial Reporting
Management’s Annual Report on Internal Control over Financial Reporting
Our management is responsible for establishing and maintaining adequate internal control over financial reporting as defined in Rule 13(a)-15(f) and 15d-15(f) under the Securities Exchange Act of 1934, as amended. Our system of internal control is designed to provide reasonable assurance to management and the Board of Directors regarding the reliability of financial reporting and the preparation of financial statements for external purposes in accordance with generally accepted accounting principles.
Any system of internal control over financial reporting, no matter how well designed, has inherent limitations and may not prevent or detect misstatements. Therefore, internal control systems determined to be effective can only provide reasonable assurance with respect to financial statement preparation and presentation. Also, projections of any evaluation of effectiveness to future periods are subject to the risk that controls may be inadequate because of changes in conditions, or the degree of compliance with the policies or procedures may deteriorate.
Under the supervision and with the participation of our management, including our President and Chief Executive Officer, we conducted an evaluation of the effectiveness of our internal control over financial reporting based on the framework in Internal Control-Integrated Framework (2013) issued by the Committee of Sponsoring Organizations of the Treadway Commission. This evaluation included review of the documentation of controls, evaluation of the design effectiveness of controls, testing of the operating effectiveness of controls, and the conclusion of this evaluation. Based on this evaluation, management concluded that our internal control over financial reporting was effective as of March 29, 2020.
The effectiveness of our internal control over financial reporting as of March 29, 2020 has been audited by Ernst & Young LLP, an independent registered public accounting firm, as stated in their report which is included within this Item 9A of Part II of this Annual Report on Form 10-K.
Changes in Internal Control over Financial Reporting
There has not been any change in our internal control over financial reporting during the fourth quarter of fiscal year 2020 that has materially affected, or is reasonably likely to materially affect, our internal control over financial reporting.
70
Report of Independent Registered Public Accounting Firm
To the Shareholders and the Board of Directors of TESSCO Technologies Incorporated
Opinion on Internal Control over Financial Reporting
We have audited TESSCO Technologies Incorporated and subsidiaries’ internal control over financial reporting as of March 29, 2020, based on criteria established in Internal Control-Integrated Framework issued by the Committee of Sponsoring Organizations of the Treadway Commission (2013 framework), (the COSO criteria). In our opinion, TESSCO Technologies Incorporated and subsidiaries (the Company) maintained, in all material respects, effective internal control over financial reporting as of March 29, 2020, based on the COSO criteria.
We also have audited, in accordance with the standards of the Public Company Accounting Oversight Board (United States) (PCAOB), the consolidated balance sheets of TESSCO Technologies Incorporated and subsidiaries as of March 29, 2020 and March 31, 2019, the related consolidated statements of (loss) income, shareholders’ equity and cash flows for each of the three years in the period ended March 29, 2020, and the related notes and financial statement schedule listed in the Index at Item 15(a)2 and our report dated June 5, 2020 expressed an unqualified opinion thereon.
Basis for Opinion
The Company’s management is responsible for maintaining effective internal control over financial reporting and for its assessment of the effectiveness of internal control over financial reporting included in Management’s Annual Report on Internal Control Over Financial Reporting, appearing in Item 9A. Our responsibility is to express an opinion on the Company’s internal control over financial reporting based on our audit. We are a public accounting firm registered with the PCAOB and are required to be independent with respect to the Company in accordance with the U.S. federal securities laws and the applicable rules and regulations of the Securities and Exchange Commission and the PCAOB.
We conducted our audit in accordance with the standards of the PCAOB. Those standards require that we plan and perform the audit to obtain reasonable assurance about whether effective internal control over financial reporting was maintained in all material respects.
Our audit included obtaining an understanding of internal control over financial reporting, assessing the risk that a material weakness exists, testing and evaluating the design and operating effectiveness of internal control based on the assessed risk, and performing such other procedures as we considered necessary in the circumstances. We believe that our audit provides a reasonable basis for our opinion.
Definition and Limitations of Internal Control Over Financial Reporting
A company’s internal control over financial reporting is a process designed to provide reasonable assurance regarding the reliability of financial reporting and the preparation of financial statements for external purposes in accordance with generally accepted accounting principles. A company’s internal control over financial reporting includes those policies and procedures that (1) pertain to the maintenance of records that, in reasonable detail, accurately and fairly reflect the transactions and dispositions of the assets of the company; (2) provide reasonable assurance that transactions are recorded as necessary to permit preparation of financial statements in accordance with generally accepted accounting principles, and that receipts and expenditures of the company are being made only in accordance with authorizations of management and directors of the company; and (3) provide reasonable assurance regarding prevention or timely detection of unauthorized acquisition, use, or disposition of the company’s assets that could have a material effect on the financial statements.
Because of its inherent limitations, internal control over financial reporting may not prevent or detect misstatements. Also, projections of any evaluation of effectiveness to future periods are subject to the risk that controls may become inadequate because of changes in conditions, or that the degree of compliance with the policies or procedures may deteriorate.
/s/ Ernst & Young LLP
Baltimore, Maryland
June 5, 2020
71
None.
The information with respect to the identity and business experience of executive officers of the Company as required to be included in Item 10 to this Form 10-K is set forth in Part I of this Form 10-K. The information otherwise required by Items 10 through 14 will be contained in a definitive proxy statement for our Annual Meeting of Shareholders, which we anticipate will be filed no later than 120 days after the end of our fiscal year pursuant to Regulation 14A, and accordingly, these items have been omitted in accordance with General Instruction G (3) to Form 10-K.
Item 15. Exhibits and Financial Statement Schedules.
|
(a) |
The following documents are filed as part of this report: |
|
1. |
The following consolidated financial statements are included in Item 8 of this report: |
Consolidated Balance Sheets as of March 29, 2020 and March 31, 2019
Consolidated Statements of Income for the fiscal years ended March 29, 2020, March 31, 2019 and April 1, 2018
Consolidated Statements of Changes in Shareholders' Equity for the fiscal years ended March 29, 2020, March 31, 2019 and April 1, 2018
Consolidated Statements of Cash Flows for the fiscal years ended March 29, 2020, March 31, 2019 and April 1, 2018
Notes to Consolidated Financial Statements
Report of Independent Registered Public Accounting Firm
|
2. |
The following financial statement schedules are required to be filed by Item 8 and paragraph (b) of this Item 15 included herewith: |
Schedule IIValuation and Qualifying Accounts
Schedules not listed above have been omitted because the information required to be set forth therein is not applicable.
72
|
3. |
Exhibits |
|
3.1.1 |
Amended and Restated Certificate of Incorporation of the Company filed with the Secretary of State of Delaware on September 29, 1993 (incorporated by reference to Exhibit 3.1.1 to the Company's Registration Statement on Form S‑1 (No. 33‑81834)). |
|
3.1.2 |
Certificate of Retirement of the Company filed with the Secretary of State of Delaware on January 13, 1994 (incorporated by reference to Exhibit 3.1.2 to the Company's Registration Statement on Form S‑1 (No. 33‑81834)). |
|
3.1.3 |
Certificate of Amendment to Certificate of Incorporation of the Company filed with the Secretary of State of Delaware on July 20, 1994 (incorporated by reference to Exhibit 3.1.3 to the Company's Registration Statement on Form S‑1 (No. 33‑81834)). |
|
3.1.4 |
|
|
3.1.5 |
|
|
3.2.1 |
|
|
3.2.2 |
|
|
3.2.3 |
|
|
4.1.1* |
|
|
10.1.1 |
|
|
10.2.1 |
|
|
10.2.2 |
|
|
10.2.3 |
|
|
10.2.4 |
|
|
10.2.5 |
|
|
10.2.6 |
|
|
10.2.7 |
|
|
10.2.8 |
|
|
10.3.1 |
73
|
10.3.2* |
|
|
10.3.3* |
|
|
10.3.4* |
Form of Stock Option under the Tessco Technologies Incorporated 2019 Stock and Incentive Plan. |
|
10.3.5* |
|
|
10.3.6* |
|
|
10.4.1 |
|
|
10.4.2 |
|
|
10.4.3 |
|
|
10.5.1 |
|
|
10.5.2 |
|
|
10.5.3 |
|
|
10.5.4 |
|
|
10.5.5 |
|
|
10.6.1 |
|
|
10.6.2 |
|
|
10.6.3 |
|
|
10.7.1 |
|
|
10.7.2 |
74
|
10.7.3 |
|
|
10.7.4* |
|
|
10.8.1 |
|
|
10.8.2 |
|
|
10.8.3 |
|
|
10.9.1 |
|
|
10.9.2 |
|
|
|
|
|
21.1.1* |
|
|
23.1.1* |
Consent of Ernst & Young LLP, Independent Registered Public Accounting Firm. |
|
31.1.1* |
Rule 15d-14(a) Certification of Sandip Mukerjee, Chief Executive Officer. |
|
31.2.1* |
Rule 15d-14(a) Certification of Aric Spitulnik, Chief Financial Officer. |
|
32.1.1* |
Section 1350 Certification of Sandip Mukerjee, Chief Executive Officer. |
|
32.2.1* |
Section 1350 Certification of Aric Spitulnik, Chief Financial Officer. |
|
101.1* |
The following financial information from TESSCO Technologies Incorporated’s Annual Report on Form 10-K for the year ended March 29, 2020 formatted in XBRL: (i) Consolidated Statement of Income for the years ended March 29, 2020, March 31, 2019 and April 1, 2018; (ii) Consolidated Balance Sheet at March 29, 2020 and March 31, 2019; (iii) Consolidated Statement of Cash Flows for the years March 29, 2020 and March 31, 2019; and (iv) Notes to Consolidated Financial Statements. |
|
|
|
|
* |
Filed herewith |
75
Schedule II: Valuation and Qualifying Accounts
For the fiscal years ended:
|
|
|
2020 |
|
2019 |
|
2018 |
|
|||
|
Allowance for doubtful accounts: |
|
|
|
|
|
|
|
|
|
|
|
Balance, beginning of period |
|
$ |
2,137,900 |
|
$ |
1,094,900 |
|
$ |
782,200 |
|
|
Provision for bad debts |
|
|
2,100,400 |
|
|
1,721,200 |
|
|
797,100 |
|
|
Write-offs and other adjustments |
|
|
(949,500) |
|
|
(678,200) |
|
|
(484,400) |
|
|
Balance, end of period |
|
$ |
3,288,800 |
|
$ |
2,137,900 |
|
$ |
1,094,900 |
|
|
|
|
2020 |
|
2019 |
|
2018 |
|
|||
|
Inventory Reserve: |
|
|
|
|
|
|
|
|
|
|
|
Balance, beginning of period |
|
$ |
5,870,600 |
|
$ |
5,739,700 |
|
$ |
6,360,600 |
|
|
Inventory reserve expense |
|
|
11,801,500 |
|
|
4,863,100 |
|
|
4,361,400 |
|
|
Write-offs and other adjustments |
|
|
(8,006,000) |
|
|
(4,732,200) |
|
|
(4,982,300) |
|
|
Balance, end of period |
|
$ |
9,666,100 |
|
$ |
5,870,600 |
|
$ |
5,739,700 |
|
|
|
|
2020 |
|
2019 |
|
2018 |
|
|||
|
Allowance for deferred tax asset: |
|
|
|
|
|
|
|
|
|
|
|
Balance, beginning of period |
|
$ |
141,600 |
|
$ |
— |
|
$ |
— |
|
|
Income tax expense |
|
|
1,905,700 |
|
|
141,600 |
|
|
— |
|
|
Write-offs and other adjustments |
|
|
— |
|
|
— |
|
|
— |
|
|
Balance, end of period |
|
$ |
2,047,300 |
|
$ |
141,600 |
|
$ |
— |
|
76
Pursuant to the requirements of Section 13 or 15(d) of the Securities Exchange Act of 1934, the registrant has duly caused this report to be signed on its behalf by the undersigned, thereunto duly authorized.
|
|
|
|
|
|
TESSCO Technologies Incorporated |
|
|
|
By: |
/s/ Sandip Mukerjee |
|
|
|
Sandip Mukerjee, President and Chief Executive Officer |
|
|
|
June 5, 2020 |
Pursuant to the requirements of the Securities Exchange Act of 1934, this report has been signed below by the following persons on behalf of the registrant and in the capacities and on the dates indicated.
|
/s/ Sandip Mukerjee |
|
President and Chief Executive Officer (principal executive officer) |
|
June 5, 2020 |
|
Sandip Mukerjee |
|
|
|
|
|
|
|
|
|
|
|
/s/ Aric Spitulnik |
|
Senior Vice President, Chief Financial Officer, and Corporate Secretary (principal financial and accounting officer) |
|
June 5, 2020 |
|
Aric Spitulnik |
|
|
|
|
|
|
|
|
|
|
|
/s/ Robert B. Barnhill, Jr. |
|
Chairman of the Board |
|
June 5, 2020 |
|
Robert B. Barnhill, Jr. |
|
|
|
|
|
|
|
|
|
|
|
/s/ Jay G. Baitler |
|
Director |
|
June 5, 2020 |
|
Jay G. Baitler |
|
|
|
|
|
|
|
|
|
|
|
/s/ John D. Beletic |
|
Director |
|
June 5, 2020 |
|
John D. Beletic |
|
|
|
|
|
|
|
|
|
|
|
/s/ Paul J. Gaffney |
|
Director |
|
June 5, 2020 |
|
Paul J. Gaffney |
|
|
|
|
|
|
|
|
|
|
|
/s/ Benn R. Konsynski |
|
Director |
|
June 5, 2020 |
|
Benn R. Konsynski |
|
|
|
|
|
|
|
|
|
|
|
/s/ Dennis J. Shaughnessy |
|
Director |
|
June 5, 2020 |
|
Dennis J. Shaughnessy |
|
|
|
|
|
|
|
|
|
|
|
/s/ Morton F. Zifferer |
|
Director |
|
June 5, 2020 |
|
Morton F. Zifferer |
|
|
|
|
|
|
|
|
|
|
|
|
|
|
|
|
|
|
|
|
|
|
|
|
|
|
|
|
77