Attached files
| file | filename |
|---|---|
| 8-K - 8-K - RH | rh-20200604x8k.htm |
| EX-99.1 - EX-99.1 - RH | rh-20200604xex99d1.htm |
Exhibit 99.2
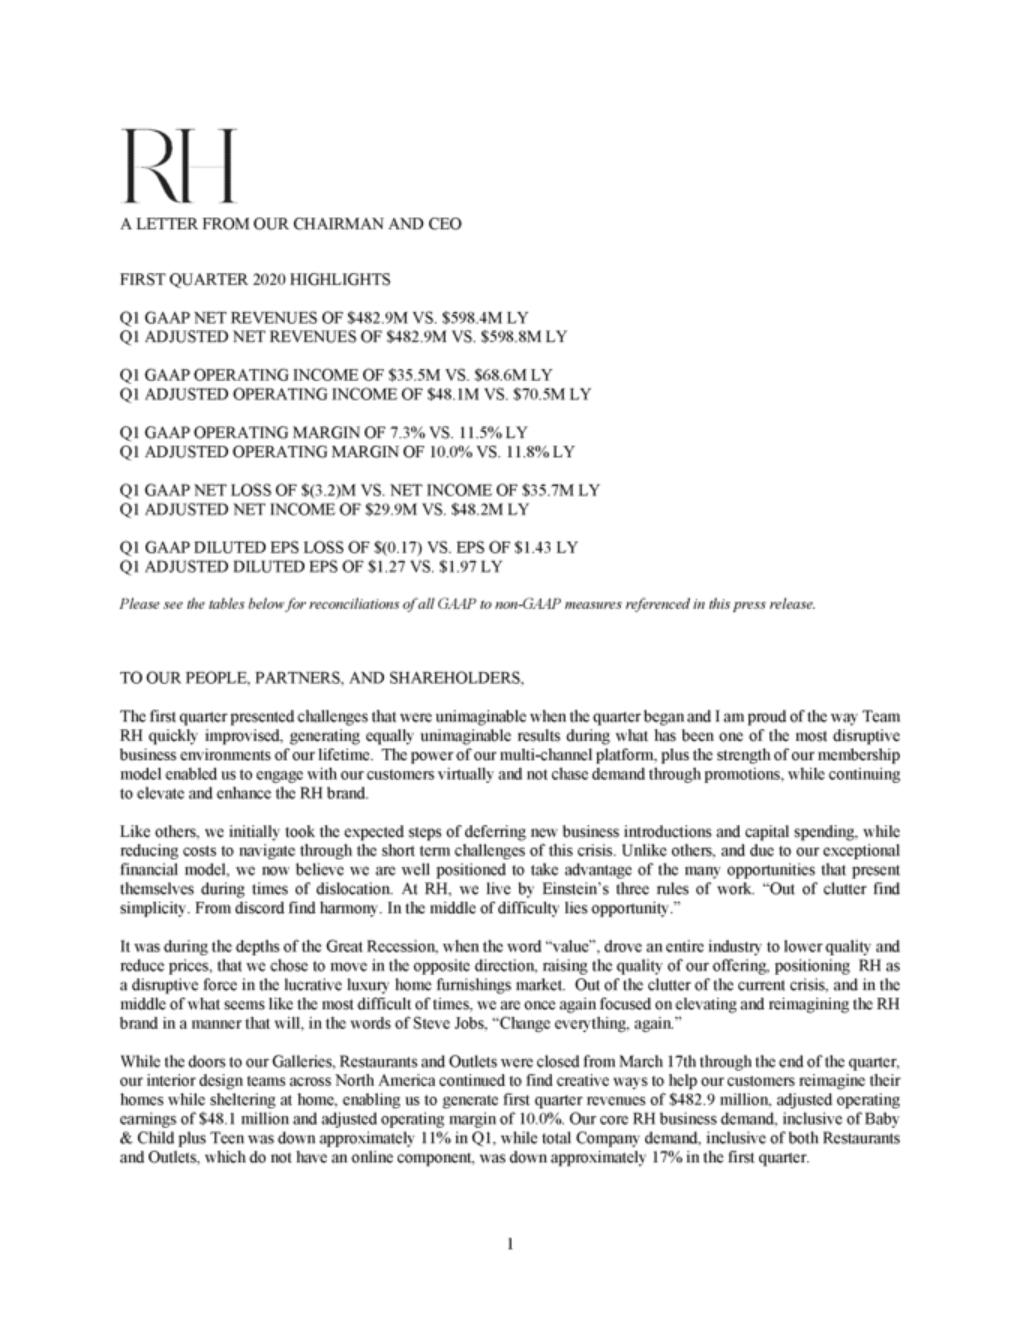
| A LETTER FROM OUR CHAIRMAN AND CEO FIRST QUARTER 2020 HIGHLIGHTS Q1 GAAP NET REVENUES OF $482.9M VS. $598.4M LY Q1 ADJUSTED NET REVENUES OF $482.9M VS. $598.8M LY Q1 GAAP OPERATING INCOME OF $35.5M VS. $68.6M LY Q1 ADJUSTED OPERATING INCOME OF $48.1M VS. $70.5M LY Q1 GAAP OPERATING MARGIN OF 7.3% VS. 11.5% LY Q1 ADJUSTED OPERATING MARGIN OF 10.0% VS. 11.8% LY Q1 GAAP NET LOSS OF $(3.2)M VS. NET INCOME OF $35.7M LY Q1 ADJUSTED NET INCOME OF $29.9M VS. $48.2M LY Q1 GAAP DILUTED EPS LOSS OF $(0.17) VS. EPS OF $1.43 LY Q1 ADJUSTED DILUTED EPS OF $1.27 VS. $1.97 LY Please see the tables below for reconciliations of all GAAP to non-GAAP measures referenced in this press release. TO OUR PEOPLE, PARTNERS, AND SHAREHOLDERS, The first quarter presented challenges that were unimaginable when the quarter began and I am proud of the way Team RH quickly improvised, generating equally unimaginable results during what has been one of the most disruptive business environments of our lifetime. The power of our multi-channel platform, plus the strength of our membership model enabled us to engage with our customers virtually and not chase demand through promotions, while continuing to elevate and enhance the RH brand. Like others, we initially took the expected steps of deferring new business introductions and capital spending, while reducing costs to navigate through the short term challenges of this crisis. Unlike others, and due to our exceptional financial model, we now believe we are well positioned to take advantage of the many opportunities that present themselves during times of dislocation. At RH, we live by Einstein’s three rules of work. “Out of clutter find simplicity. From discord find harmony. In the middle of difficulty lies opportunity.” It was during the depths of the Great Recession, when the word “value”, drove an entire industry to lower quality and reduce prices, that we chose to move in the opposite direction, raising the quality of our offering, positioning RH as a disruptive force in the lucrative luxury home furnishings market. Out of the clutter of the current crisis, and in the middle of what seems like the most difficult of times, we are once again focused on elevating and reimagining the RH brand in a manner that will, in the words of Steve Jobs, “Change everything, again.” While the doors to our Galleries, Restaurants and Outlets were closed from March 17th through the end of the quarter, our interior design teams across North America continued to find creative ways to help our customers reimagine their homes while sheltering at home, enabling us to generate first quarter revenues of $482.9 million, adjusted operating earnings of $48.1 million and adjusted operating margin of 10.0%. Our core RH business demand, inclusive of Baby & Child plus Teen was down approximately 11% in Q1, while total Company demand, inclusive of both Restaurants and Outlets, which do not have an online component, was down approximately 17% in the first quarter. 1 |
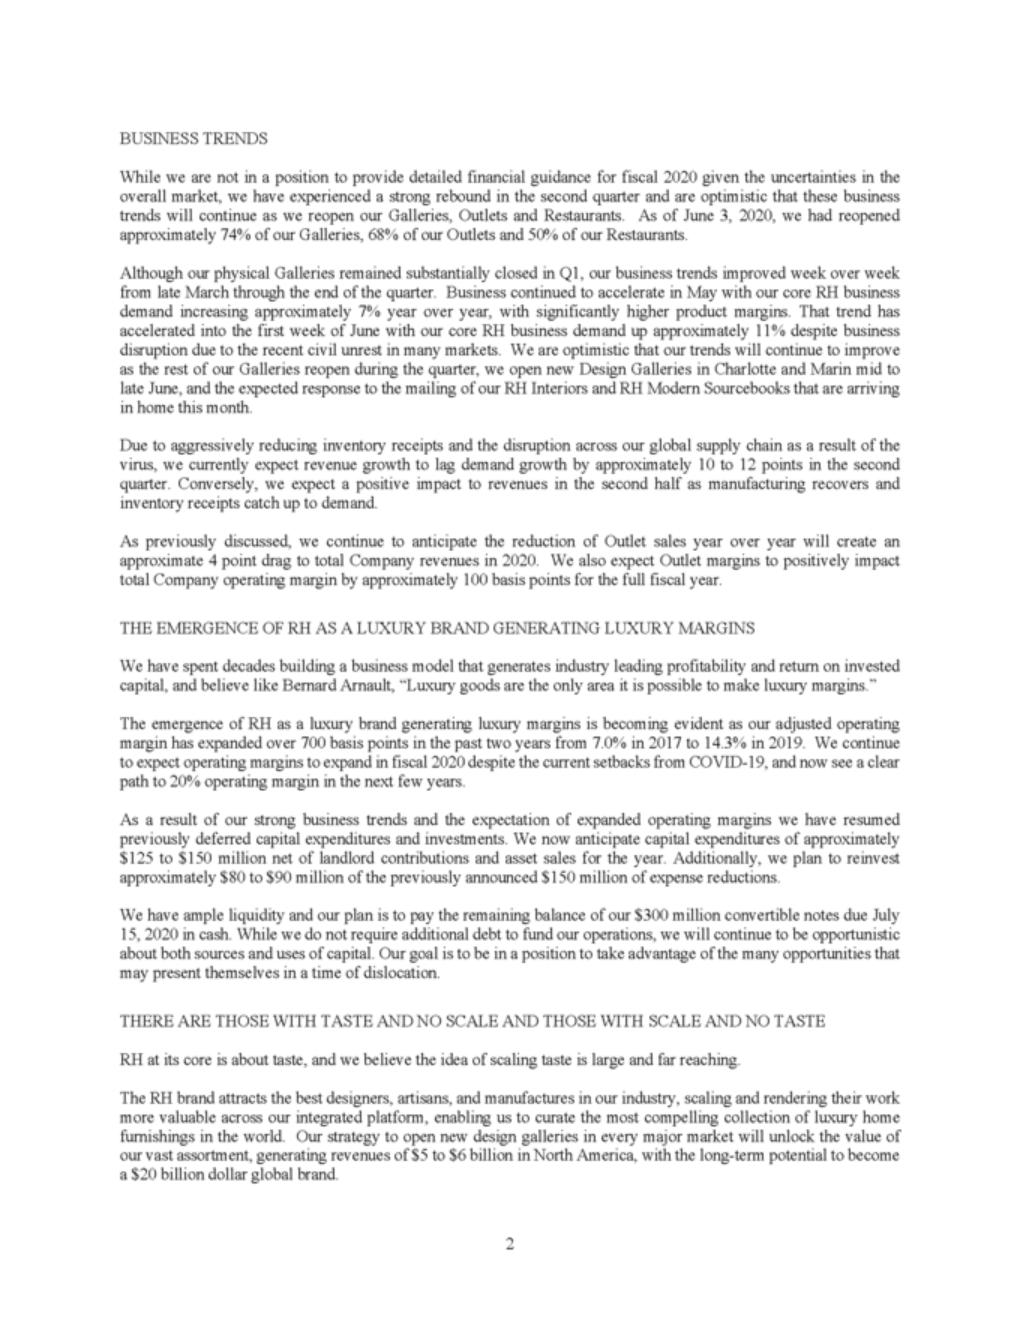
| BUSINESS TRENDS While we are not in a position to provide detailed financial guidance for fiscal 2020 given the uncertainties in the overall market, we have experienced a strong rebound in the second quarter and are optimistic that these business trends will continue as we reopen our Galleries, Outlets and Restaurants. As of June 3, 2020, we had reopened approximately 74% of our Galleries, 68% of our Outlets and 50% of our Restaurants. Although our physical Galleries remained substantially closed in Q1, our business trends improved week over week from late March through the end of the quarter. Business continued to accelerate in May with our core RH business demand increasing approximately 7% year over year, with significantly higher product margins. That trend has accelerated into the first week of June with our core RH business demand up approximately 11% despite business disruption due to the recent civil unrest in many markets. We are optimistic that our trends will continue to improve as the rest of our Galleries reopen during the quarter, we open new Design Galleries in Charlotte and Marin mid to late June, and the expected response to the mailing of our RH Interiors and RH Modern Sourcebooks that are arriving in home this month. Due to aggressively reducing inventory receipts and the disruption across our global supply chain as a result of the virus, we currently expect revenue growth to lag demand growth by approximately 10 to 12 points in the second quarter. Conversely, we expect a positive impact to revenues in the second half as manufacturing recovers and inventory receipts catch up to demand. As previously discussed, we continue to anticipate the reduction of Outlet sales year over year will create an approximate 4 point drag to total Company revenues in 2020. We also expect Outlet margins to positively impact total Company operating margin by approximately 100 basis points for the full fiscal year. THE EMERGENCE OF RH AS A LUXURY BRAND GENERATING LUXURY MARGINS We have spent decades building a business model that generates industry leading profitability and return on invested capital, and believe like Bernard Arnault, “Luxury goods are the only area it is possible to make luxury margins.” The emergence of RH as a luxury brand generating luxury margins is becoming evident as our adjusted operating margin has expanded over 700 basis points in the past two years from 7.0% in 2017 to 14.3% in 2019. We continue to expect operating margins to expand in fiscal 2020 despite the current setbacks from COVID-19, and now see a clear path to 20% operating margin in the next few years. As a result of our strong business trends and the expectation of expanded operating margins we have resumed previously deferred capital expenditures and investments. We now anticipate capital expenditures of approximately $125 to $150 million net of landlord contributions and asset sales for the year. Additionally, we plan to reinvest approximately $80 to $90 million of the previously announced $150 million of expense reductions. We have ample liquidity and our plan is to pay the remaining balance of our $300 million convertible notes due July 15, 2020 in cash. While we do not require additional debt to fund our operations, we will continue to be opportunistic about both sources and uses of capital. Our goal is to be in a position to take advantage of the many opportunities that may present themselves in a time of dislocation. THERE ARE THOSE WITH TASTE AND NO SCALE AND THOSE WITH SCALE AND NO TASTE RH at its core is about taste, and we believe the idea of scaling taste is large and far reaching. The RH brand attracts the best designers, artisans, and manufactures in our industry, scaling and rendering their work more valuable across our integrated platform, enabling us to curate the most compelling collection of luxury home furnishings in the world. Our strategy to open new design galleries in every major market will unlock the value of our vast assortment, generating revenues of $5 to $6 billion in North America, with the long-term potential to become a $20 billion dollar global brand. 2 |
| Our vision is to move the brand beyond curating and selling product to conceptualizing and selling spaces by building an ecosystem of products, places, services and spaces that elevate and establish the RH brand as a global thought leader, taste, and place maker. As an example, our product is elevated and rendered more valuable by our architecturally inspiring Galleries, which are further elevated and rendered more valuable by our seamlessly integrated hospitality experience. Our Hospitality efforts will continue to elevate the RH brand as we move beyond the four walls of our Galleries into RH Guesthouses where our goal is to create a new market for travelers seeking privacy and luxury in the $200 billion hotel industry. Additionally, we are creating bespoke hospitality experiences like RH Yountville, an integration of Food, Wine, Art & Design in the Napa Valley, and RH3, our luxury yacht that is available for charter in the Caribbean and Mediterranean where the wealthy and affluent visit and vacation. These immersive experiences expose existing and new customers to our evolving authority in interior design, architecture, landscape architecture and hospitality. This leads to our strategy of building the world’s first consumer facing Interior Design, Architecture, and Landscape Architecture services platform inside our Galleries, again elevating the RH brand and amplifying our core business by adding new revenue streams while disrupting and redefining multiple industries. Our ecosystem will come full circle as we begin to conceptualize and sell spaces, moving the brand beyond the $200 billion home furnishings market into the $1.7 trillion North American housing market by offering beautifully designed and furnished turnkey homes and condominiums with the introduction of RH Residences. The entire ecosystem will come to life digitally as we transform our website into The World of RH, a portal presenting our Products, Places, Services, and Spaces. We believe the ecosystem can be expanded globally, multiplying the market opportunity to approximately $7 to $10 trillion, quite possibly one of the largest and most lucrative addressed by any brand in the world today. A one percent share of the global market represents a $70 to $100 billion opportunity. Taste can be elusive, and we believe no one is better positioned than RH to create an ecosystem that makes taste inclusive, and by doing so, elevating and rendering our way of life more valuable. THIS IS A TIME TO BE DEFINED BY OUR VISION, NOT BY A VIRUS As we move forward past the dark days of the pandemic, let this be a pivot point where we once again rise up. It is not a time to shelter and shrink, it is a time to expand and shine. It is not a time to revert back to old ways and former days, it is a time to reimagine new ways and brighter days. It is not a time to do less, it is a time to do more with less. It is not a time to be victims of our current reality, it is a time to be visionaries, destroying today’s reality to create tomorrow’s future. Let this be a time we look back upon and remember our resurrection. A time we reimagined and reinvented ourselves once again. A time Team RH unleashed the greatest display of innovation our industry has ever seen. A time we once again become, unimaginable. This is a time to be defined by our vision, not by a virus. Carpe Diem, 3 |
| NON-GAAP FINANCIAL MEASURES To supplement its condensed consolidated financial statements, which are prepared and presented in accordance with Generally Accepted Accounting Principles (“GAAP”), the Company uses the following non-GAAP financial measures: adjusted net revenue, adjusted operating income, adjusted net income or adjusted net earnings, adjusted net income margin, adjusted diluted earnings per share, normalized adjusted net income, normalized adjusted diluted net income per share, ROIC or return on invested capital, free cash flow, adjusted operating margin, adjusted gross margin, adjusted SG&A, EBITDA and adjusted EBITDA (collectively, “non-GAAP financial measures”). We compute these measures by adjusting the applicable GAAP measures to remove the impact of certain recurring and non-recurring charges and gains and the tax effect of these adjustments. The presentation of this financial information is not intended to be considered in isolation or as a substitute for, or superior to, the financial information prepared and presented in accordance with GAAP. The Company uses these non-GAAP financial measures for financial and operational decision making and as a means to evaluate period-to-period comparisons. The Company believes that they provide useful information about operating results, enhance the overall understanding of past financial performance and future prospects, and allow for greater transparency with respect to key metrics used by management in its financial and operational decision making. The non-GAAP financial measures used by the Company in this press release may be different from the non-GAAP financial measures, including similarly titled measures, used by other companies. For more information on the non-GAAP financial measures, please see the Reconciliation of GAAP to non-GAAP Financial Measures tables in this press release. These accompanying tables include details on the GAAP financial measures that are most directly comparable to non-GAAP financial measures and the related reconciliations between these financial measures. FORWARD-LOOKING STATEMENTS This release contains forward-looking statements within the meaning of the federal securities laws, including without limitation, statements regarding the way Team RH quickly improvised, generating equally unimaginable results during what has been one of the most disruptive business environments of our lifetime; the power of our multi-channel platform, plus the strength of our membership model enabling us to engage with our customers virtually, and not chase demand through promotions, while continuing to elevate and enhance the RH brand; our exceptional financial model and belief that we are well positioned to take advantage of the many opportunities that present themselves during times of dislocation; RH being a disruptive force in the lucrative luxury home furnishings market; our focus on elevating and reimagining the RH brand; the strong rebound we have experienced in the second quarter and our optimism that these business trends will continue as we reopen our Galleries, Outlets and Restaurants; our business trends improvement week over week from late March through the end of the quarter; statements that business continued to accelerate in May with our core RH business demand increasing approximately 7% year over year, with significantly higher product margins; our optimism that our trends will continue to improve as the rest of our Galleries reopen during the quarter, we open new Design Galleries in Charlotte and Marin mid to late June, and the expected response to the mailing of our RH Interiors and RH Modern Sourcebooks that are arriving in home this month; statements that we currently expect revenue growth to lag demand growth by approximately 10 to 12 points in the second quarter, and we expect a positive impact to revenues in the second half as manufacturing recovers and inventory receipts catch up to demand; our anticipation that the reduction of Outlet sales year over year will create a drag to total Company revenues in 2020; our expectation that Outlet margins will positively impact total Company operating margin by approximately 100 basis points for the full fiscal year; the emergence of RH as a luxury brand generating luxury margins as we continue to expect operating margins to expand in fiscal 2020 despite the current setbacks from COVID-19; statements that we see a clear path to 20% operating margin in the next few years; statements that as a result of our strong business trends and the expectation of expanded operating margins we have resumed previously deferred capital expenditures and investments; our anticipation of capital expenditures of approximately $125 to $150 million net of landlord contributions and asset sales for the year; our plan to reinvest approximately $80 to $90 million of the previously announced $150 million of expense reductions; our ample liquidity and plan to pay the remaining balance of our $300 million convertible notes due July 15, 2020 in cash; our statement that we will continue to be opportunistic about both sources and uses of capital, and our goal to be in a position to take advantage of the many opportunities that may present themselves in a time of dislocation; our belief that the idea of scaling taste is large and far reaching; the RH brand attracts the best designers, artisans, and manufactures in our industry, scaling and rendering their work more valuable across our integrated platform, enabling us to curate the most compelling collection of luxury 4 |
| home furnishings in the world; our strategy to open new design galleries in every major market will unlock the value of our vast assortment, generating revenues of $5 to $6 billion in North America, with the long term potential to become a $20 billion dollar global brand; our vision to move the brand beyond curating and selling product to conceptualizing and selling spaces by building an ecosystem of products, places, services and spaces that elevate and establish the RH brand as a global thought leader, taste, and place maker; statements that our product is elevated and rendered more valuable by our architecturally inspiring Galleries, which are further elevated and rendered more valuable by our seamlessly integrated hospitality experience; statements that our Hospitality efforts will continue to elevate the RH brand as we move beyond the four walls of our Galleries into RH Guesthouses where our goal is to create a new market for travelers seeking privacy and luxury in the $200 billion hotel industry; our creation of bespoke hospitality experiences like RH Yountville, an integration of Food, Wine, Art & Design in the Napa Valley, and RH3, our luxury yacht that is available for charter in the Caribbean and Mediterranean where the wealthy and affluent visit and vacation; our strategy of building the world’s first consumer facing Interior Design, Architecture, and Landscape Architecture services platform inside our Galleries, again elevating the RH brand and amplifying our core business by adding new revenue streams while disrupting and redefining multiple industries; statements that our ecosystem will come full circle as we begin to conceptualize and sell spaces, moving the brand beyond the $200 billion home furnishings market into the $1.7 trillion North American housing market by offering beautifully designed and furnished turnkey homes and condominiums with the introduction of RH Residences; statements that the entire ecosystem will come to life digitally as we transform our website into The World of RH, a portal presenting our Products, Places, Services, and Spaces; our belief that the ecosystem can be expanded globally, multiplying the market opportunity to approximately $7 to $10 trillion, quite possibly one of the largest and most lucrative addressed by any brand in the world today; statements regarding the global market opportunity; our belief that no one is better positioned than RH to create an ecosystem that makes taste inclusive, and by doing so, elevating and rendering our way of life more valuable; the impact to our business of the COVID-19 pandemic; and any statements or assumptions underlying any of the foregoing. You can identify forward-looking statements by the fact that they do not relate strictly to historical or current facts. These statements may include words such as “anticipate,” “estimate,” “expect,” “project,” “plan,” “intend,” “believe,” “may,” “will,” “should,” “likely” and other words and terms of similar meaning in connection with any discussion of the timing or nature of future events. We cannot assure you that future developments affecting us will be those that we have anticipated. Important risks and uncertainties that could cause actual results to differ materially from our expectations include, among others: risks related to the global outbreak of the COVID-19 virus and its impact on our business; risks related to civil unrest; risks related to our dependence on key personnel and any changes in our ability to retain key personnel; successful implementation of our growth strategy; risks related to the number of new business initiatives we are undertaking; successful implementation of our growth strategy including our real estate transformation and the number of new Gallery locations that we seek to open and the timing of openings; uncertainties in the current performance of our business including a range of risks related to our operations as well as external economic factors; general economic conditions and the housing market as well as the impact of economic conditions on consumer confidence and spending; changes in customer demand for our products; our ability to anticipate consumer preferences and buying trends, and maintaining our brand promise to customers; decisions concerning the allocation of capital; factors affecting our outstanding convertible senior notes or other forms of our indebtedness; our ability to anticipate consumer preferences and buying trends, and maintain our brand promise to customers; changes in consumer spending based on weather and other conditions beyond our control; strikes and work stoppages affecting port workers and other industries involved in the transportation of our products; our ability to obtain our products in a timely fashion or in the quantities required; our ability to employ reasonable and appropriate security measures to protect personal information that we collect; our ability to support our growth with appropriate information technology systems; risks related to our sourcing and supply chain including our dependence on imported products produced by foreign manufacturers and risks related to importation of such products including risks related to tariffs and other similar issues, as well as those risks and uncertainties disclosed under the sections entitled “Risk Factors” and “Management’s Discussion and Analysis of Financial Condition and Results of Operations” in RH’s most recent Form 10-K and Form 10-Q filed with the Securities and Exchange Commission, and similar disclosures in subsequent reports filed with the SEC, which are available on our investor relations website at ir.rh.com and on the SEC website at www.sec.gov. Any forward-looking statement made by us in this release speaks only as of the date on which we make it. We undertake no obligation to publicly update any forward-looking statement, whether as a result of new information, future developments or otherwise, except as may be required by any applicable securities laws. 5 |
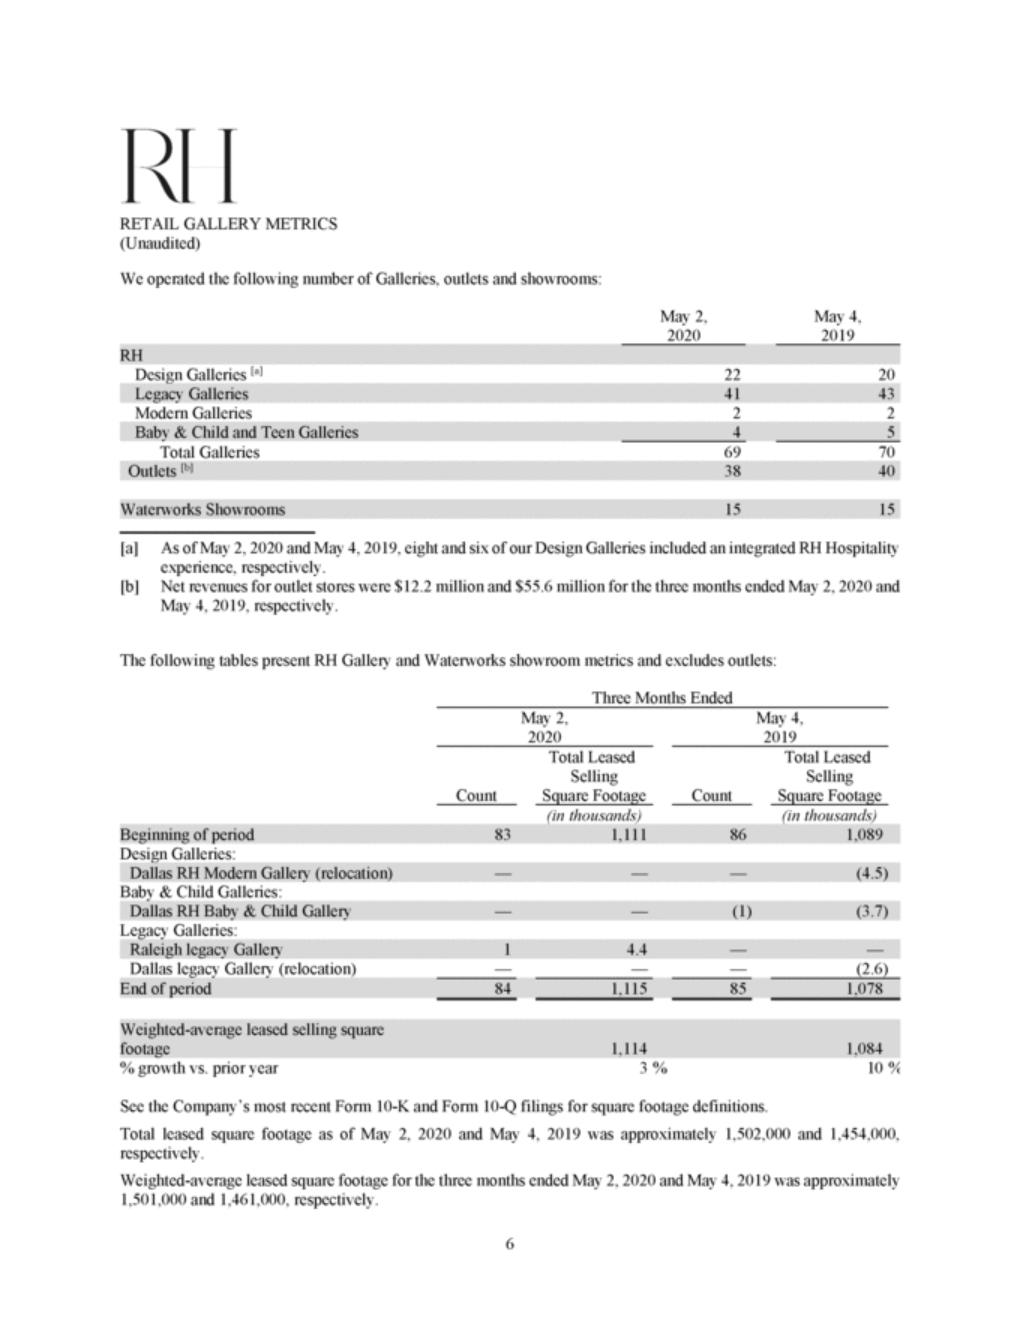
| RETAIL GALLERY METRICS (Unaudited) We operated the following number of Galleries, outlets and showrooms: May 2, 2020 May 4, 2019 Design Galleries [a] 22 20 Modern Galleries 2 2 Total Galleries 69 70 [a] As of May 2, 2020 and May 4, 2019, eight and six of our Design Galleries included an integrated RH Hospitality experience, respectively. Net revenues for outlet stores were $12.2 million and $55.6 million for the three months ended May 2, 2020 and May 4, 2019, respectively. [b] The following tables present RH Gallery and Waterworks showroom metrics and excludes outlets: Three Months Ended May 2, 2020 May 4, 2019 Total Leased Selling Square Footage Total Leased Selling Square Footage Count Count (in thousands) (in thousands) Design Galleries: Baby & Child Galleries: Legacy Galleries: Dallas legacy Gallery (relocation) — — — (2.6) % growth vs. prior year 3 % 10 % See the Company’s most recent Form 10-K and Form 10-Q filings for square footage definitions. Total leased square footage as of May 2, 2020 and May 4, 2019 was approximately 1,502,000 and 1,454,000, respectively. Weighted-average leased square footage for the three months ended May 2, 2020 and May 4, 2019 was approximately 1,501,000 and 1,461,000, respectively. 6 Weighted-average leased selling square footage1,1141,084 End of period841,115851,078 Raleigh legacy Gallery14.4—— Dallas RH Baby & Child Gallery——(1)(3.7) Dallas RH Modern Gallery (relocation)———(4.5) Beginning of period831,111861,089 Waterworks Showrooms1515 Outlets [b]3840 Baby & Child and Teen Galleries45 Legacy Galleries4143 RH |
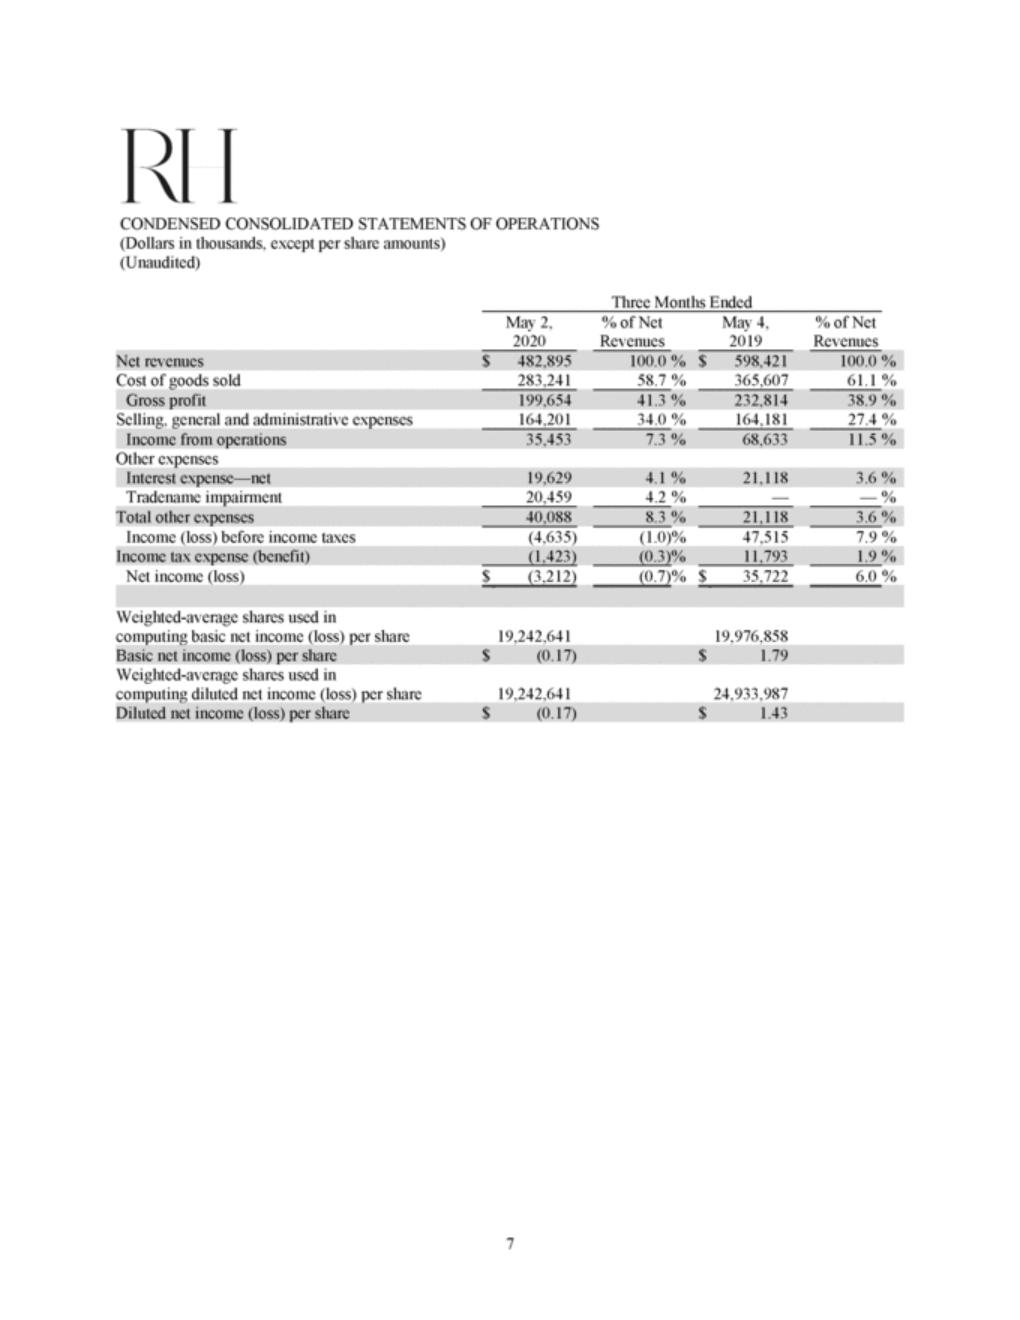
| CONDENSED CONSOLIDATED STATEMENTS OF OPERATIONS (Dollars in thousands, except per share amounts) (Unaudited) Three Months Ended May 2, 2020 % of Net Revenues May 4, 2019 % of Net Revenues Cost of goods sold 283,241 58.7 % 365,607 61.1 % Selling, general and administrative expenses 164,201 34.0 % 164,181 27.4 % Other expenses Tradename impairment 20,459 4.2 % — — % Income (loss) before income taxes (4,635) (1.0)% 47,515 7.9 % Net income (loss) $ (3,212) (0.7)% $ 35,722 6.0 % Weighted-average shares used in computing basic net income (loss) per share 19,242,641 19,976,858 Weighted-average shares used in computing diluted net income (loss) per share 19,242,641 24,933,987 7 Diluted net income (loss) per share$(0.17)$1.43 Basic net income (loss) per share$(0.17)$1.79 Income tax expense (benefit)(1,423)(0.3)%11,7931.9 % Total other expenses40,0888.3 %21,1183.6 % Interest expense—net19,6294.1 %21,1183.6 % Income from operations35,4537.3 %68,63311.5 % Gross profit199,65441.3 %232,81438.9 % Net revenues$482,895100.0 % $598,421100.0 % |
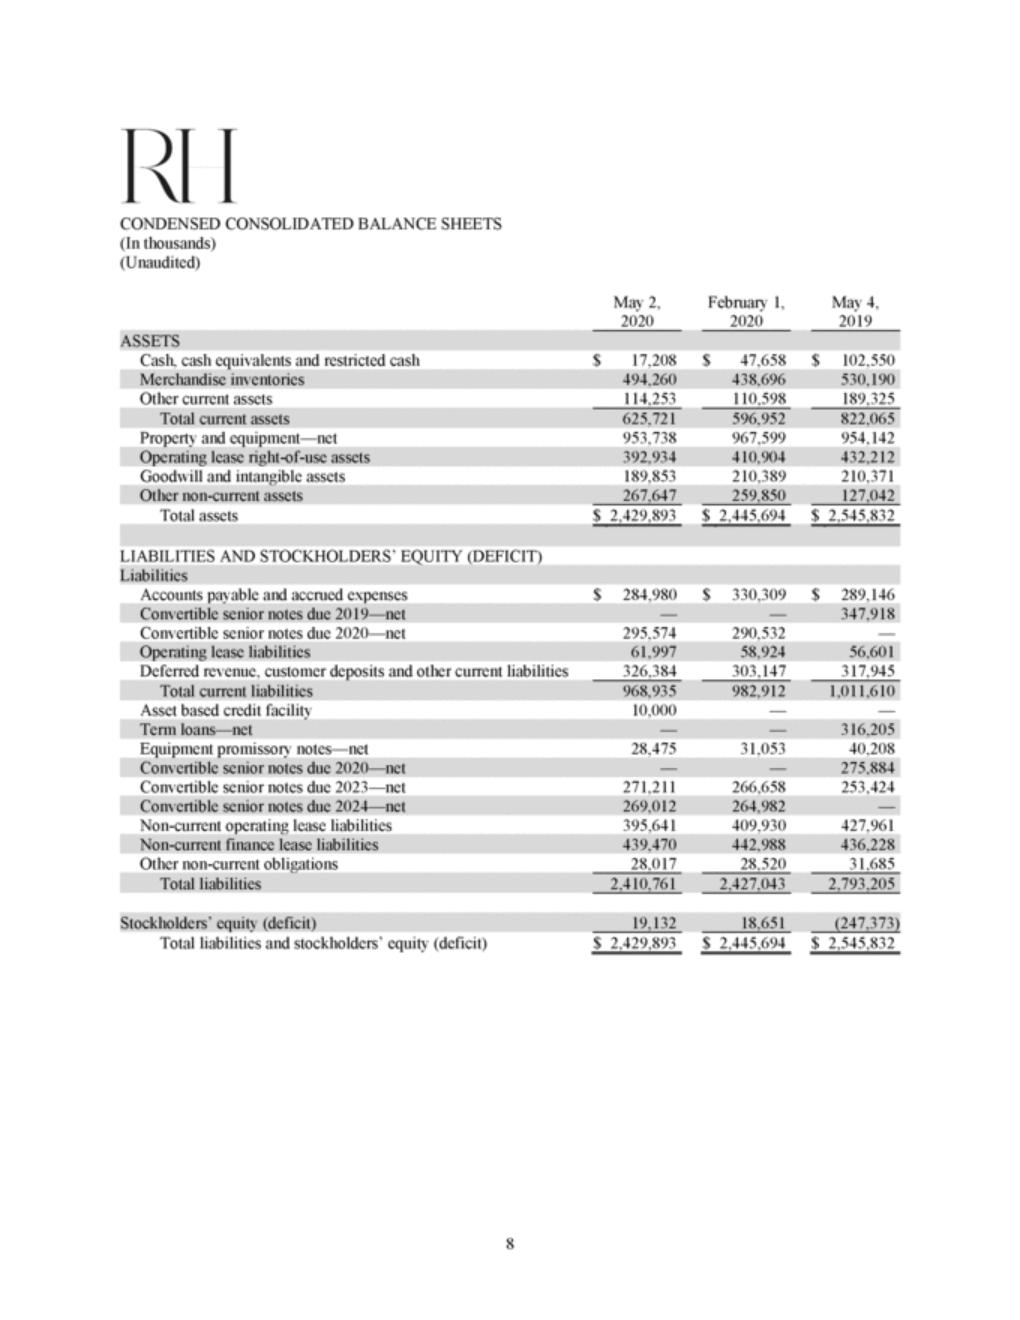
| CONDENSED CONSOLIDATED BALANCE SHEETS (In thousands) (Unaudited) May 2, 2020 February 1, 2020 May 4, 2019 Cash, cash equivalents and restricted cash $ 17,208 $ 47,658 $ 102,550 Other current assets 114,253 110,598 189,325 Property and equipment—net 953,738 967,599 954,142 Goodwill and intangible assets 189,853 210,389 210,371 Total assets $ 2,429,893 $ 2,445,694 $ 2,545,832 LIABILITIES AND STOCKHOLDERS’ EQUITY (DEFICIT) Accounts payable and accrued expenses $ 284,980 $ 330,309 $ 289,146 Convertible senior notes due 2020—net 295,574 290,532 — Deferred revenue, customer deposits and other current liabilities 326,384 303,147 317,945 Asset based credit facility 10,000 — — Equipment promissory notes—net 28,475 31,053 40,208 Convertible senior notes due 2023—net 271,211 266,658 253,424 Non-current operating lease liabilities 395,641 409,930 427,961 Other non-current obligations 28,017 28,520 31,685 Total liabilities and stockholders’ equity (deficit) $ 2,429,893 $ 2,445,694 $ 2,545,832 8 Stockholders’ equity (deficit)19,13218,651(247,373) Total liabilities2,410,7612,427,0432,793,205 Non-current finance lease liabilities439,470442,988436,228 Convertible senior notes due 2024—net269,012264,982— Convertible senior notes due 2020—net——275,884 Term loans—net——316,205 Total current liabilities968,935982,9121,011,610 Operating lease liabilities61,99758,92456,601 Convertible senior notes due 2019—net——347,918 Liabilities Other non-current assets267,647259,850127,042 Operating lease right-of-use assets392,934410,904432,212 Total current assets625,721596,952822,065 Merchandise inventories494,260438,696530,190 ASSETS |
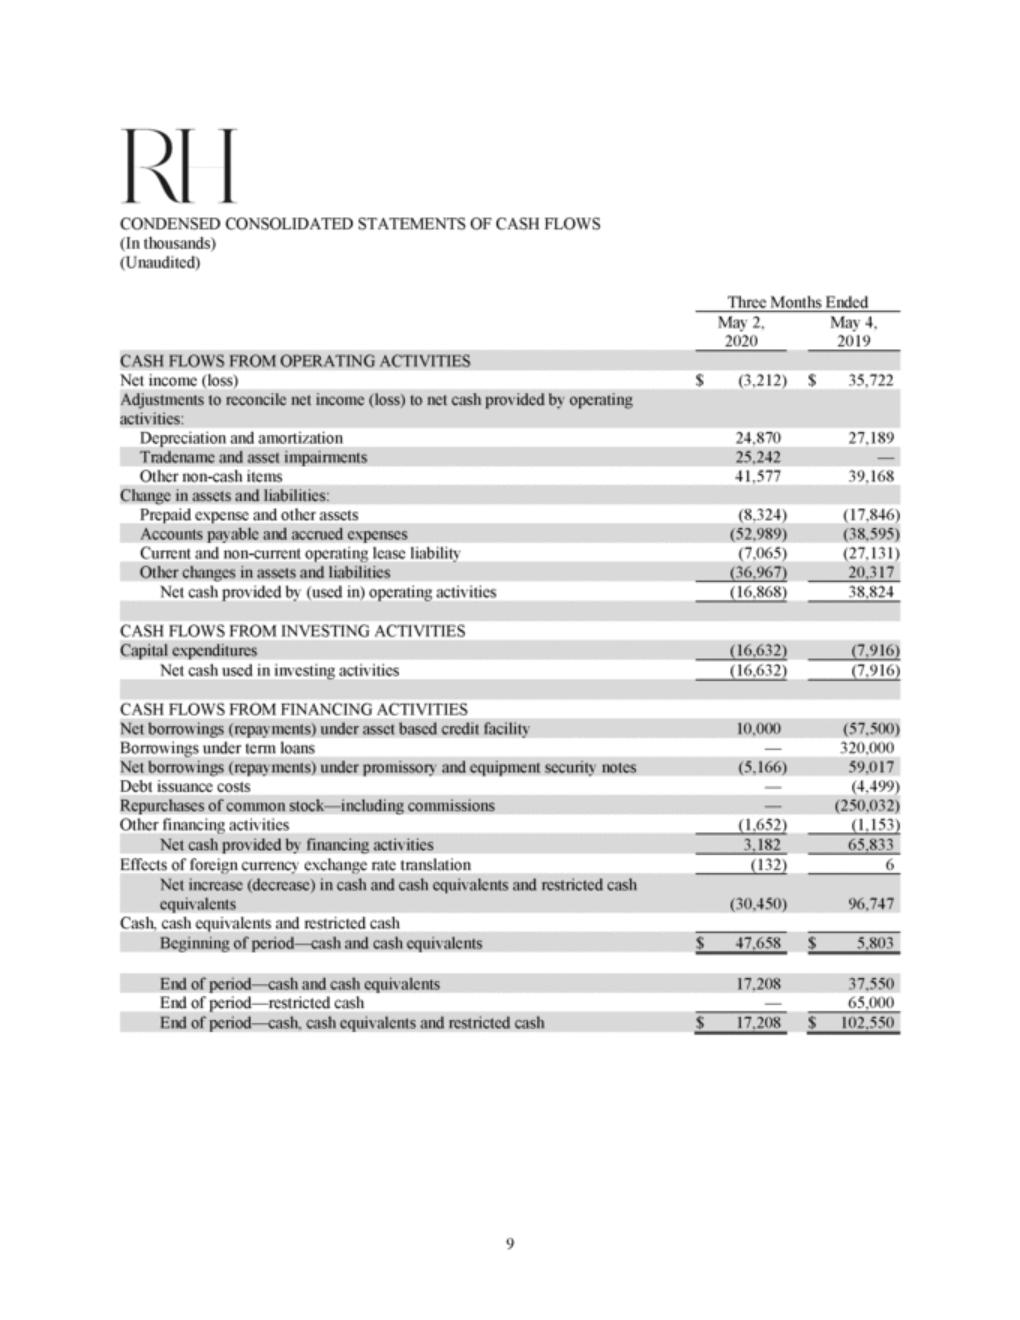
| CONDENSED CONSOLIDATED STATEMENTS OF CASH FLOWS (In thousands) (Unaudited) Three Months Ended May 2, 2020 May 4, 2019 Net income (loss) $ (3,212) $ 35,722 Depreciation and amortization 24,870 27,189 Other non-cash items 41,577 39,168 Prepaid expense and other assets (8,324) (17,846) Current and non-current operating lease liability (7,065) (27,131) Net cash provided by (used in) operating activities (16,868) 38,824 CASH FLOWS FROM INVESTING ACTIVITIES Net cash used in investing activities (16,632) (7,916) CASH FLOWS FROM FINANCING ACTIVITIES Borrowings under term loans — 320,000 Debt issuance costs — (4,499) Other financing activities (1,652) (1,153) Effects of foreign currency exchange rate translation (132) 6 Cash, cash equivalents and restricted cash End of period—restricted cash — 65,000 9 End of period—cash, cash equivalents and restricted cash$17,208$102,550 End of period—cash and cash equivalents17,20837,550 Beginning of period—cash and cash equivalents$47,658$5,803 Net increase (decrease) in cash and cash equivalents and restricted cash equivalents(30,450)96,747 Net cash provided by financing activities3,18265,833 Repurchases of common stock—including commissions—(250,032) Net borrowings (repayments) under promissory and equipment security notes(5,166)59,017 Net borrowings (repayments) under asset based credit facility10,000(57,500) Capital expenditures(16,632)(7,916) Other changes in assets and liabilities(36,967)20,317 Accounts payable and accrued expenses(52,989)(38,595) Change in assets and liabilities: Tradename and asset impairments25,242— Adjustments to reconcile net income (loss) to net cash provided by operating activities: CASH FLOWS FROM OPERATING ACTIVITIES |
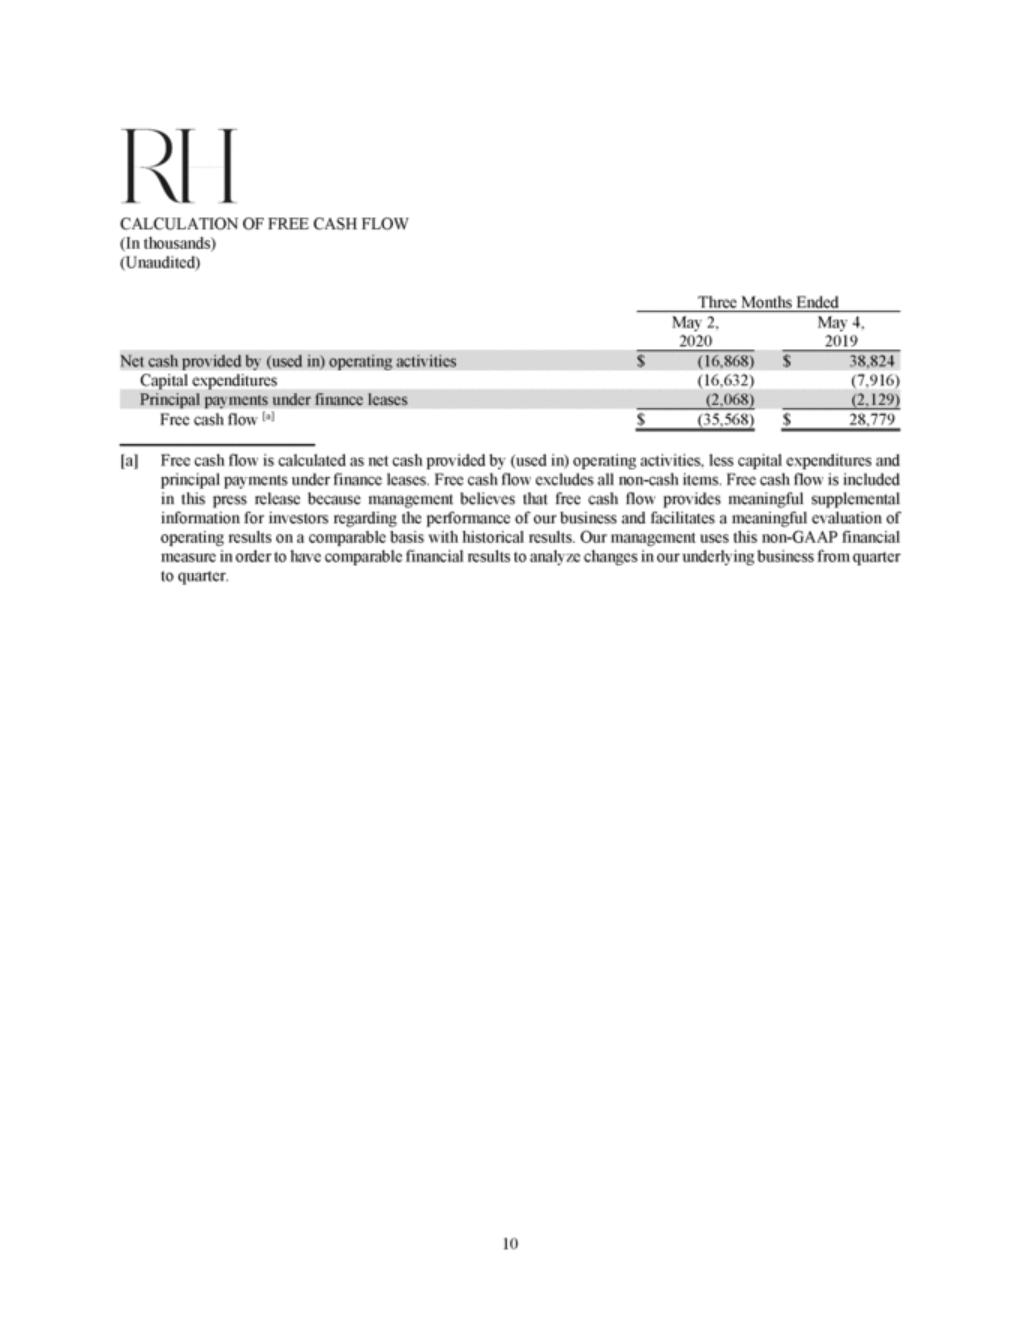
| CALCULATION OF FREE CASH FLOW (In thousands) (Unaudited) Three Months Ended May 2, 2020 May 4, 2019 Capital expenditures (16,632) (7,916) Free cash flow [a] $ (35,568) $ 28,779 [a] Free cash flow is calculated as net cash provided by (used in) operating activities, less capital expenditures and principal payments under finance leases. Free cash flow excludes all non-cash items. Free cash flow is included in this press release because management believes that free cash flow provides meaningful supplemental information for investors regarding the performance of our business and facilitates a meaningful evaluation of operating results on a comparable basis with historical results. Our management uses this non-GAAP financial measure in order to have comparable financial results to analyze changes in our underlying business from quarter to quarter. 10 Principal payments under finance leases(2,068)(2,129) Net cash provided by (used in) operating activities$(16,868)$38,824 |
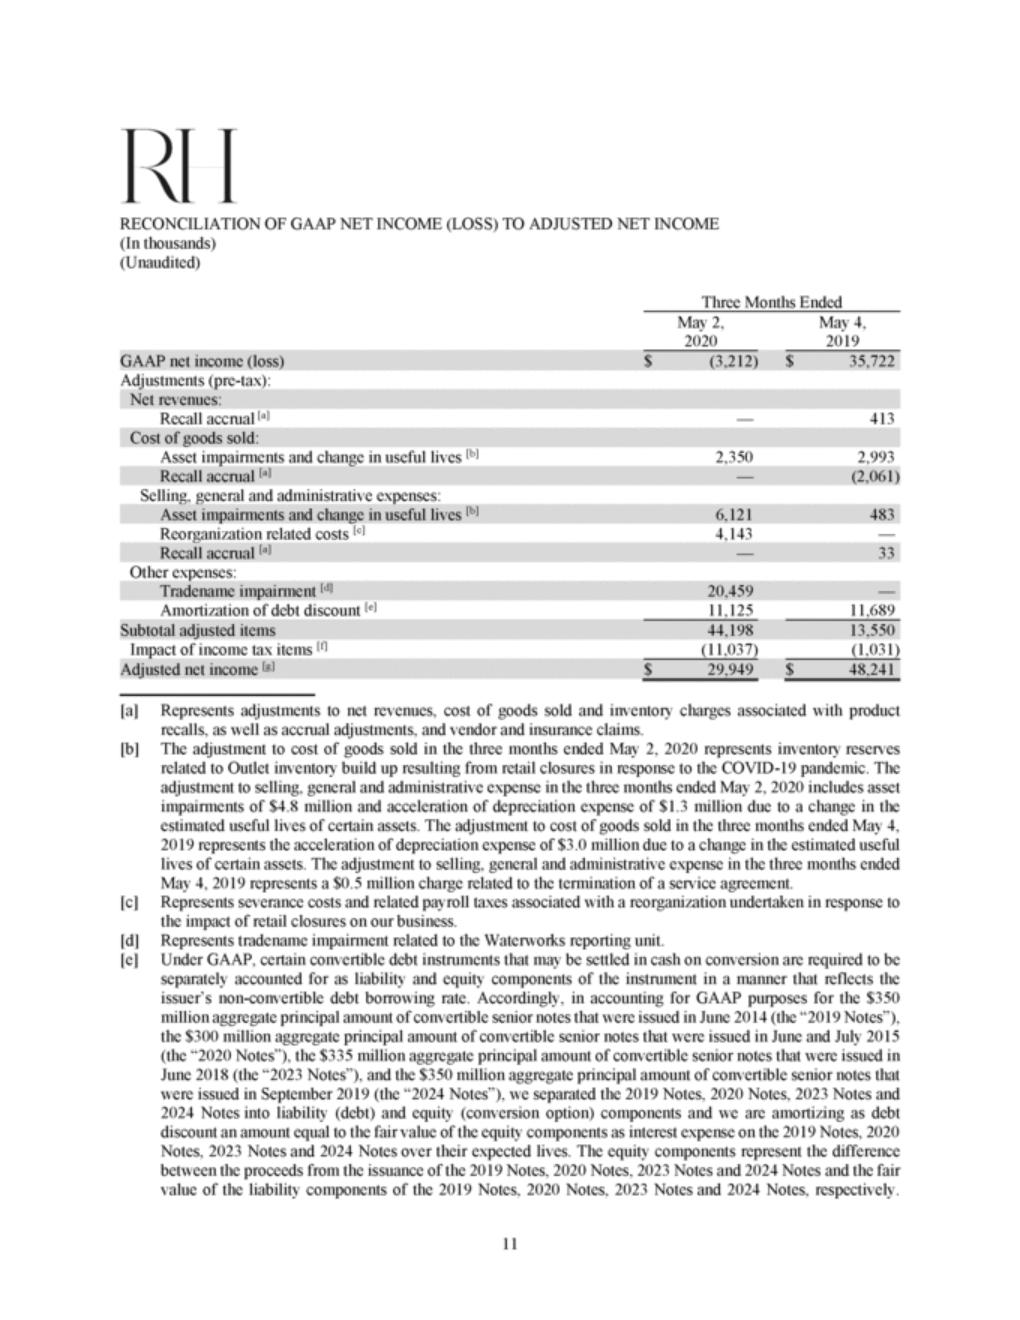
| RECONCILIATION OF GAAP NET INCOME (LOSS) TO ADJUSTED NET INCOME (In thousands) (Unaudited) Three Months Ended May 2, 2020 May 4, 2019 Adjustments (pre-tax): Recall accrual [a] — 413 Asset impairments and change in useful lives [b] 2,350 2,993 Selling, general and administrative expenses: Reorganization related costs [c] 4,143 — Other expenses: Amortization of debt discount [e] 11,125 11,689 Impact of income tax items [f] (11,037) (1,031) [a] Represents adjustments to net revenues, cost of goods sold and inventory charges associated with product recalls, as well as accrual adjustments, and vendor and insurance claims. The adjustment to cost of goods sold in the three months ended May 2, 2020 represents inventory reserves related to Outlet inventory build up resulting from retail closures in response to the COVID-19 pandemic. The adjustment to selling, general and administrative expense in the three months ended May 2, 2020 includes asset impairments of $4.8 million and acceleration of depreciation expense of $1.3 million due to a change in the estimated useful lives of certain assets. The adjustment to cost of goods sold in the three months ended May 4, 2019 represents the acceleration of depreciation expense of $3.0 million due to a change in the estimated useful lives of certain assets. The adjustment to selling, general and administrative expense in the three months ended May 4, 2019 represents a $0.5 million charge related to the termination of a service agreement. Represents severance costs and related payroll taxes associated with a reorganization undertaken in response to the impact of retail closures on our business. Represents tradename impairment related to the Waterworks reporting unit. Under GAAP, certain convertible debt instruments that may be settled in cash on conversion are required to be separately accounted for as liability and equity components of the instrument in a manner that reflects the issuer’s non-convertible debt borrowing rate. Accordingly, in accounting for GAAP purposes for the $350 million aggregate principal amount of convertible senior notes that were issued in June 2014 (the “2019 Notes”), the $300 million aggregate principal amount of convertible senior notes that were issued in June and July 2015 (the “2020 Notes”), the $335 million aggregate principal amount of convertible senior notes that were issued in June 2018 (the “2023 Notes”), and the $350 million aggregate principal amount of convertible senior notes that were issued in September 2019 (the “2024 Notes”), we separated the 2019 Notes, 2020 Notes, 2023 Notes and 2024 Notes into liability (debt) and equity (conversion option) components and we are amortizing as debt discount an amount equal to the fair value of the equity components as interest expense on the 2019 Notes, 2020 Notes, 2023 Notes and 2024 Notes over their expected lives. The equity components represent the difference between the proceeds from the issuance of the 2019 Notes, 2020 Notes, 2023 Notes and 2024 Notes and the fair value of the liability components of the 2019 Notes, 2020 Notes, 2023 Notes and 2024 Notes, respectively. [b] [c] [d] [e] 11 Adjusted net income [g]$29,949$48,241 Subtotal adjusted items44,19813,550 Tradename impairment [d]20,459— Recall accrual [a]—33 Asset impairments and change in useful lives [b]6,121483 Recall accrual [a]—(2,061) Cost of goods sold: Net revenues: GAAP net income (loss)$(3,212)$35,722 |
| Amounts are presented net of interest capitalized for capital projects of $1.8 million and $0.7 million during the three months ended May 2, 2020 and May 4, 2019, respectively. The 2019 Notes matured on June 15, 2019 and did not impact amortization of debt discount post-maturity. The adjustment for the three months ended May 2, 2020 is based on an adjusted tax rate of 24.3% which excludes the tax impact associated with the Waterworks reporting unit tradename impairment. The adjustment for the three months ended May 4, 2019 assumes a normalized tax rate of 21%. Adjusted net income is a supplemental measure of financial performance that is not required by, or presented in accordance with, GAAP. We define adjusted net income as consolidated net income (loss), adjusted for the impact of certain non-recurring and other items that we do not consider representative of our underlying operating performance. Adjusted net income is included in this press release because management believes that adjusted net income provides meaningful supplemental information for investors regarding the performance of our business and facilitates a meaningful evaluation of operating results on a comparable basis with historical results. Our management uses this non-GAAP financial measure in order to have comparable financial results to analyze changes in our underlying business from quarter to quarter. [f] [g] 12 |
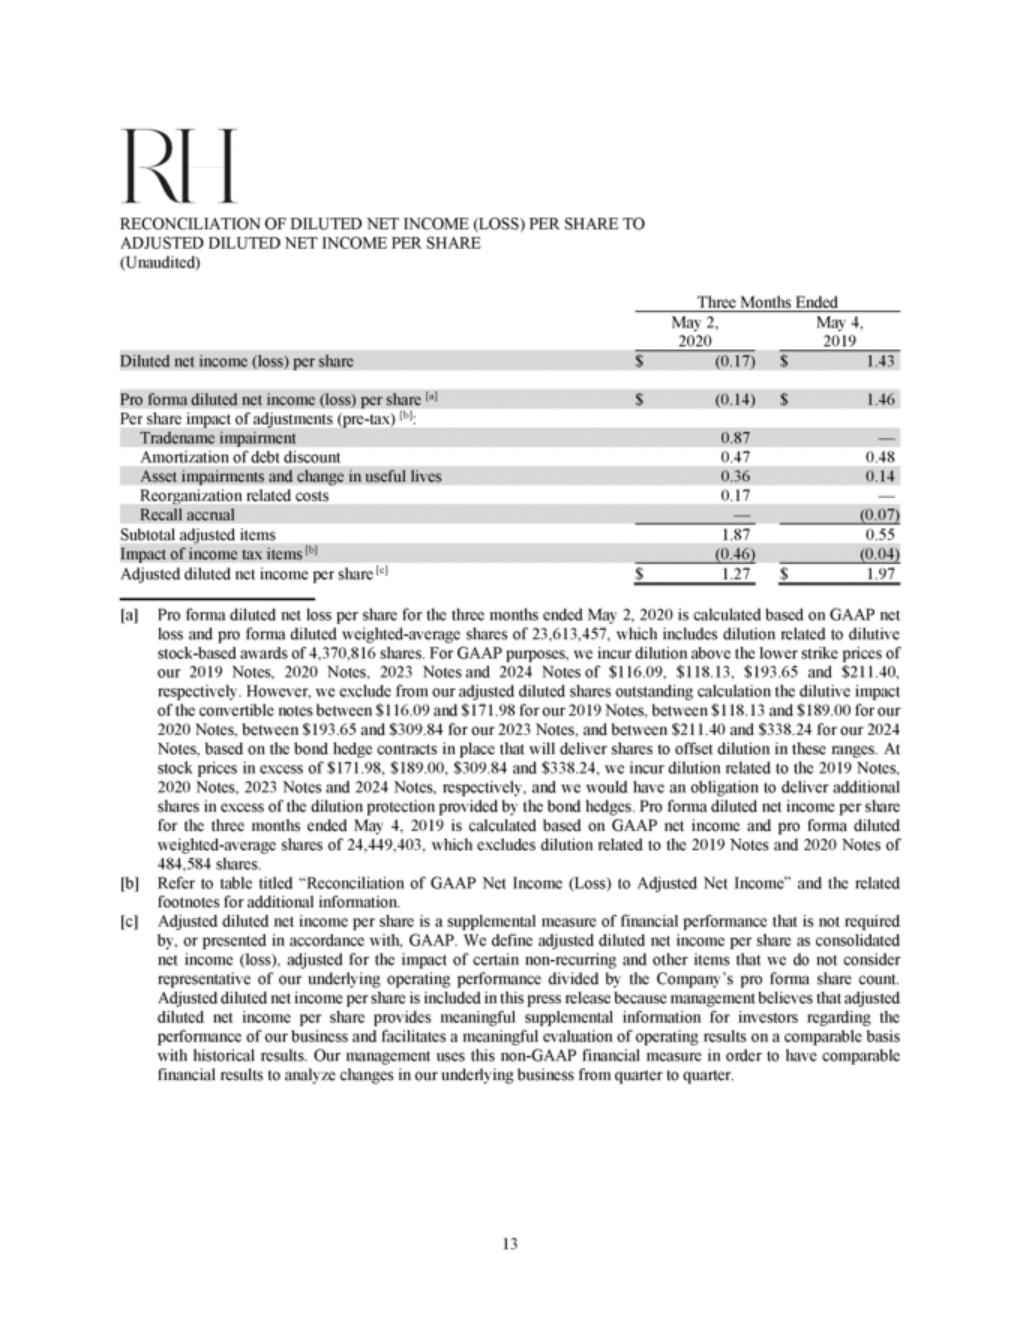
| RECONCILIATION OF DILUTED NET INCOME (LOSS) PER SHARE TO ADJUSTED DILUTED NET INCOME PER SHARE (Unaudited) Three Months Ended May 2, 2020 May 4, 2019 Per share impact of adjustments (pre-tax) [b]: Amortization of debt discount 0.47 0.48 Reorganization related costs 0.17 — Subtotal adjusted items 1.87 0.55 Adjusted diluted net income per share [c] $ 1.27 $ 1.97 [a] Pro forma diluted net loss per share for the three months ended May 2, 2020 is calculated based on GAAP net loss and pro forma diluted weighted-average shares of 23,613,457, which includes dilution related to dilutive stock-based awards of 4,370,816 shares. For GAAP purposes, we incur dilution above the lower strike prices of our 2019 Notes, 2020 Notes, 2023 Notes and 2024 Notes of $116.09, $118.13, $193.65 and $211.40, respectively. However, we exclude from our adjusted diluted shares outstanding calculation the dilutive impact of the convertible notes between $116.09 and $171.98 for our 2019 Notes, between $118.13 and $189.00 for our 2020 Notes, between $193.65 and $309.84 for our 2023 Notes, and between $211.40 and $338.24 for our 2024 Notes, based on the bond hedge contracts in place that will deliver shares to offset dilution in these ranges. At stock prices in excess of $171.98, $189.00, $309.84 and $338.24, we incur dilution related to the 2019 Notes, 2020 Notes, 2023 Notes and 2024 Notes, respectively, and we would have an obligation to deliver additional shares in excess of the dilution protection provided by the bond hedges. Pro forma diluted net income per share for the three months ended May 4, 2019 is calculated based on GAAP net income and pro forma diluted weighted-average shares of 24,449,403, which excludes dilution related to the 2019 Notes and 2020 Notes of 484,584 shares. Refer to table titled “Reconciliation of GAAP Net Income (Loss) to Adjusted Net Income” and the related footnotes for additional information. Adjusted diluted net income per share is a supplemental measure of financial performance that is not required by, or presented in accordance with, GAAP. We define adjusted diluted net income per share as consolidated net income (loss), adjusted for the impact of certain non-recurring and other items that we do not consider representative of our underlying operating performance divided by the Company’s pro forma share count. Adjusted diluted net income per share is included in this press release because management believes that adjusted diluted net income per share provides meaningful supplemental information for investors regarding the performance of our business and facilitates a meaningful evaluation of operating results on a comparable basis with historical results. Our management uses this non-GAAP financial measure in order to have comparable financial results to analyze changes in our underlying business from quarter to quarter. [b] [c] 13 Impact of income tax items [b](0.46)(0.04) Recall accrual—(0.07) Asset impairments and change in useful lives0.360.14 Tradename impairment0.87— Pro forma diluted net income (loss) per share [a]$(0.14)$1.46 Diluted net income (loss) per share$(0.17)$1.43 |
| RECONCILIATION OF NET REVENUES TO ADJUSTED NET REVENUES AND GROSS PROFIT TO ADJUSTED GROSS PROFIT (Dollars in thousands) (Unaudited) Three Months Ended May 2, 2020 May 4, 2019 Recall accrual [a] — 413 Asset impairments and change in useful lives [a] 2,350 2,993 Adjusted gross profit [b] $ 202,004 $ 234,159 Gross margin [c] 41.3 % 38.9 % [a] Refer to table titled “Reconciliation of GAAP Net Income (Loss) to Adjusted Net Income” and the related footnotes for additional information. Adjusted net revenues and adjusted gross profit are supplemental measures of financial performance that are not required by, or presented in accordance with, GAAP. We define adjusted net revenues as consolidated net revenues, adjusted for the impact of certain non-recurring and other items that we do not consider representative of our underlying operating performance. We define adjusted gross profit as consolidated gross profit, adjusted for the impact of certain non-recurring and other items that we do not consider representative of our underlying operating performance. Adjusted net revenues and adjusted gross profit are included in this press release because management believes that adjusted net revenues and adjusted gross profit provide meaningful supplemental information for investors regarding the performance of our business and facilitate a meaningful evaluation of operating results on a comparable basis with historical results. Our management uses these non-GAAP financial measures in order to have comparable financial results to analyze changes in our underlying business from quarter to quarter. Gross margin is defined as gross profit divided by net revenues. Adjusted gross margin is defined as adjusted gross profit divided by adjusted net revenues. [b] [c] 14 Adjusted gross margin [c]41.8 %39.1 % Recall accrual [a]—(1,648) Gross profit$199,654$232,814 Adjusted net revenues [b]$482,895$598,834 Net revenues$482,895$598,421 |

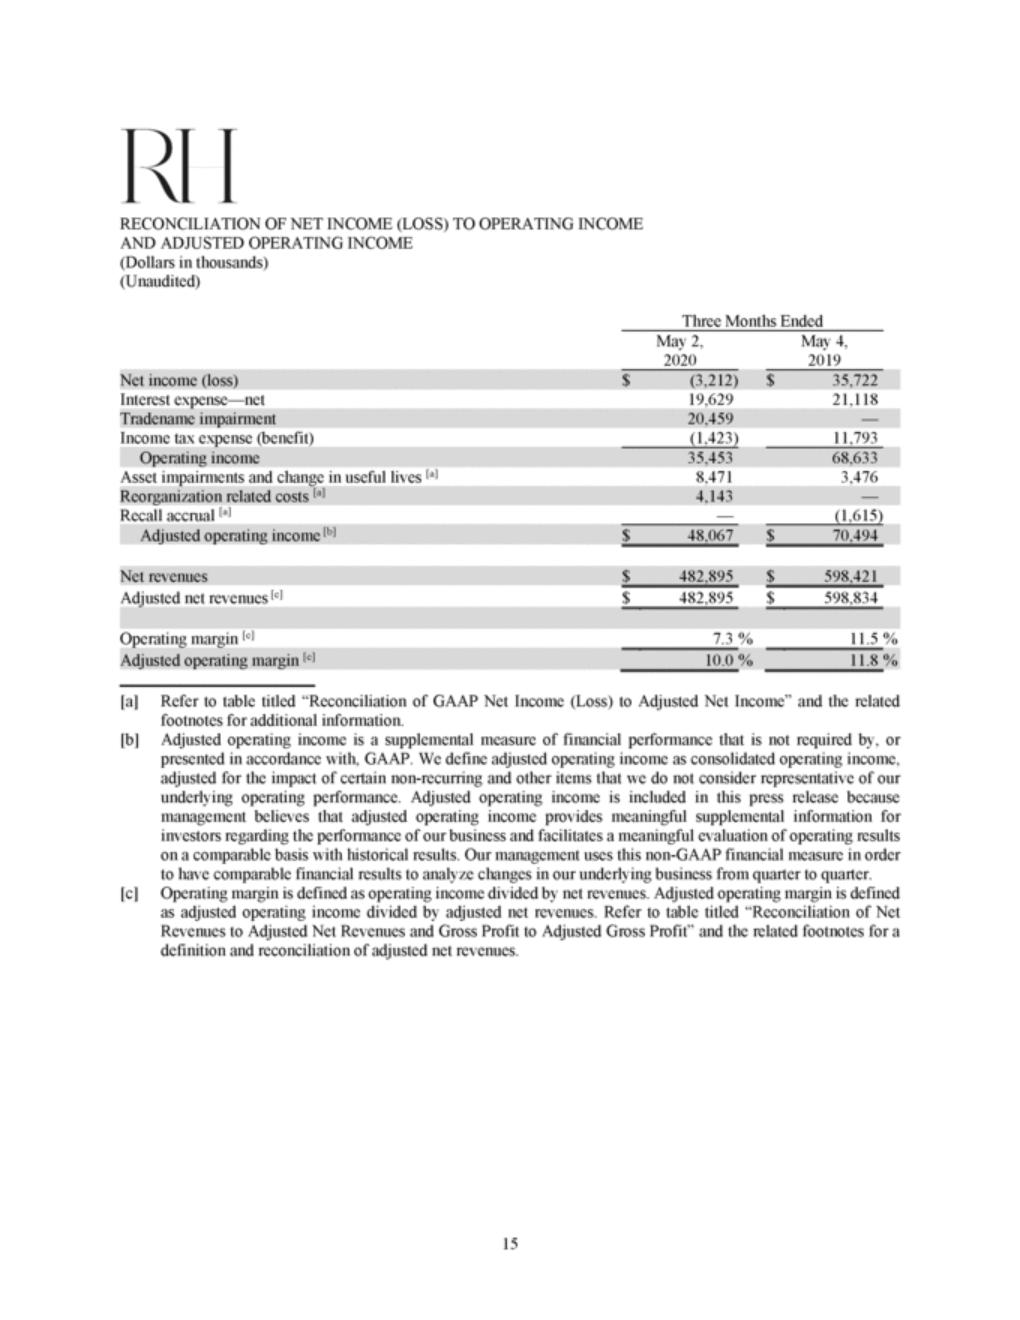
| RECONCILIATION OF NET INCOME (LOSS) TO OPERATING INCOME AND ADJUSTED OPERATING INCOME (Dollars in thousands) (Unaudited) Three Months Ended May 2, 2020 May 4, 2019 Interest expense—net 19,629 21,118 Income tax expense (benefit) (1,423) 11,793 Asset impairments and change in useful lives [a] 8,471 3,476 Recall accrual [a] — (1,615) Adjusted net revenues [c] $ 482,895 $ 598,834 Operating margin [c] 7.3 % 11.5 % [a] Refer to table titled “Reconciliation of GAAP Net Income (Loss) to Adjusted Net Income” and the related footnotes for additional information. Adjusted operating income is a supplemental measure of financial performance that is not required by, or presented in accordance with, GAAP. We define adjusted operating income as consolidated operating income, adjusted for the impact of certain non-recurring and other items that we do not consider representative of our underlying operating performance. Adjusted operating income is included in this press release because management believes that adjusted operating income provides meaningful supplemental information for investors regarding the performance of our business and facilitates a meaningful evaluation of operating results on a comparable basis with historical results. Our management uses this non-GAAP financial measure in order to have comparable financial results to analyze changes in our underlying business from quarter to quarter. Operating margin is defined as operating income divided by net revenues. Adjusted operating margin is defined as adjusted operating income divided by adjusted net revenues. Refer to table titled “Reconciliation of Net Revenues to Adjusted Net Revenues and Gross Profit to Adjusted Gross Profit” and the related footnotes for a definition and reconciliation of adjusted net revenues. [b] [c] 15 Adjusted operating margin [c]10.0 %11.8 % Net revenues$482,895$598,421 Adjusted operating income [b]$48,067$70,494 Reorganization related costs [a]4,143— Operating income35,45368,633 Tradename impairment20,459— Net income (loss)$(3,212)$35,722 |
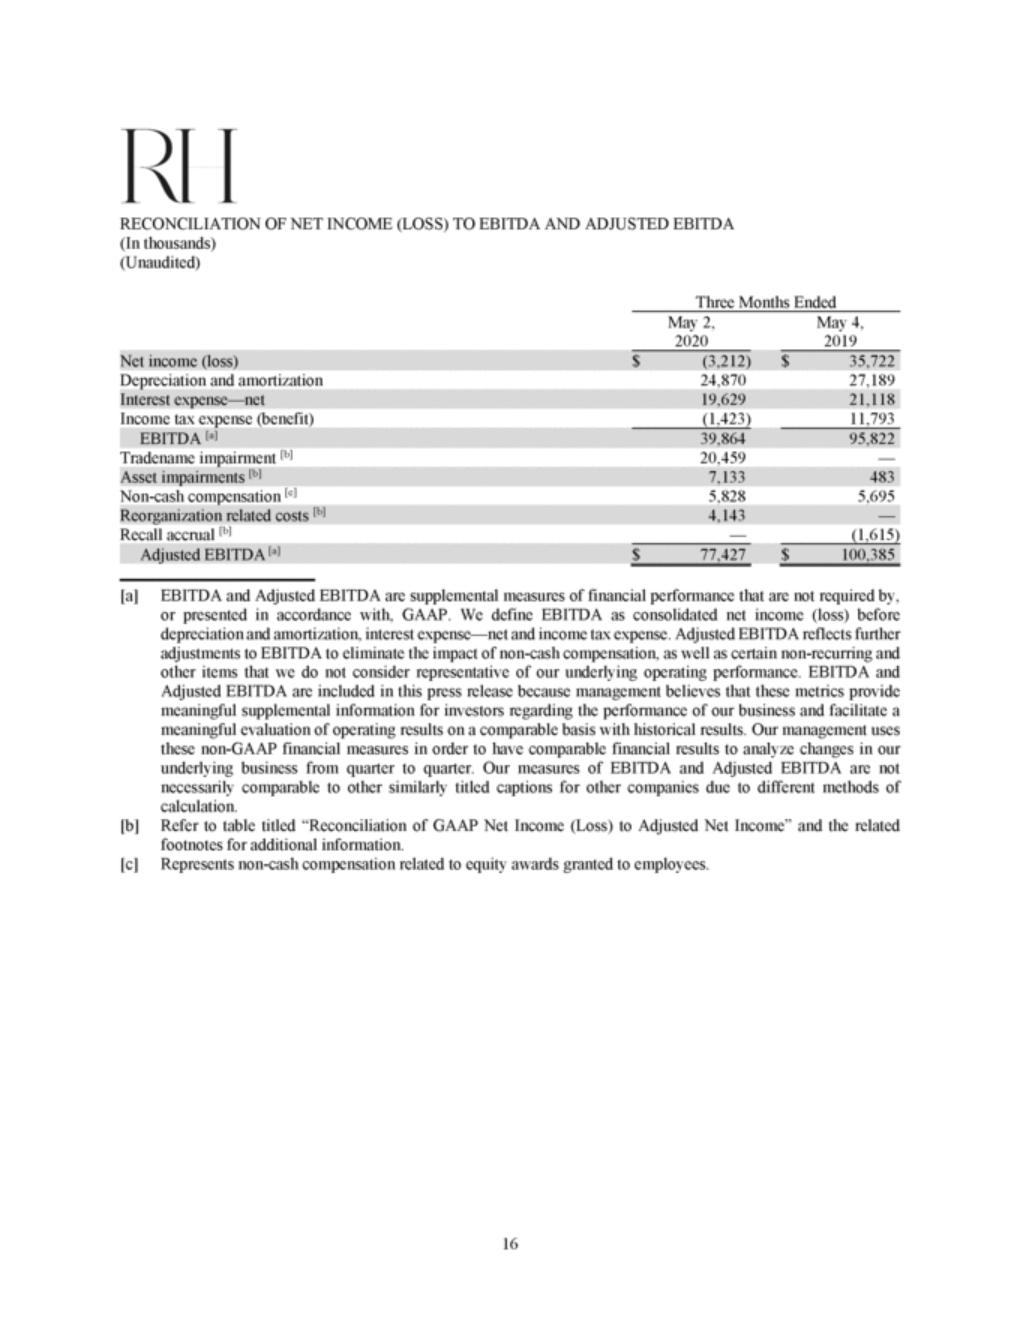
| RECONCILIATION OF NET INCOME (LOSS) TO EBITDA AND ADJUSTED EBITDA (In thousands) (Unaudited) Three Months Ended May 2, 2020 May 4, 2019 Depreciation and amortization 24,870 27,189 Income tax expense (benefit) (1,423) 11,793 Tradename impairment [b] 20,459 — Non-cash compensation [c] 5,828 5,695 Recall accrual [b] — (1,615) [a] EBITDA and Adjusted EBITDA are supplemental measures of financial performance that are not required by, or presented in accordance with, GAAP. We define EBITDA as consolidated net income (loss) before depreciation and amortization, interest expense—net and income tax expense. Adjusted EBITDA reflects further adjustments to EBITDA to eliminate the impact of non-cash compensation, as well as certain non-recurring and other items that we do not consider representative of our underlying operating performance. EBITDA and Adjusted EBITDA are included in this press release because management believes that these metrics provide meaningful supplemental information for investors regarding the performance of our business and facilitate a meaningful evaluation of operating results on a comparable basis with historical results. Our management uses these non-GAAP financial measures in order to have comparable financial results to analyze changes in our underlying business from quarter to quarter. Our measures of EBITDA and Adjusted EBITDA are not necessarily comparable to other similarly titled captions for other companies due to different methods of calculation. Refer to table titled “Reconciliation of GAAP Net Income (Loss) to Adjusted Net Income” and the related footnotes for additional information. Represents non-cash compensation related to equity awards granted to employees. [b] [c] 16 Adjusted EBITDA [a]$77,427$100,385 Reorganization related costs [b]4,143— Asset impairments [b]7,133483 EBITDA [a]39,86495,822 Interest expense—net19,62921,118 Net income (loss)$(3,212)$35,722 |
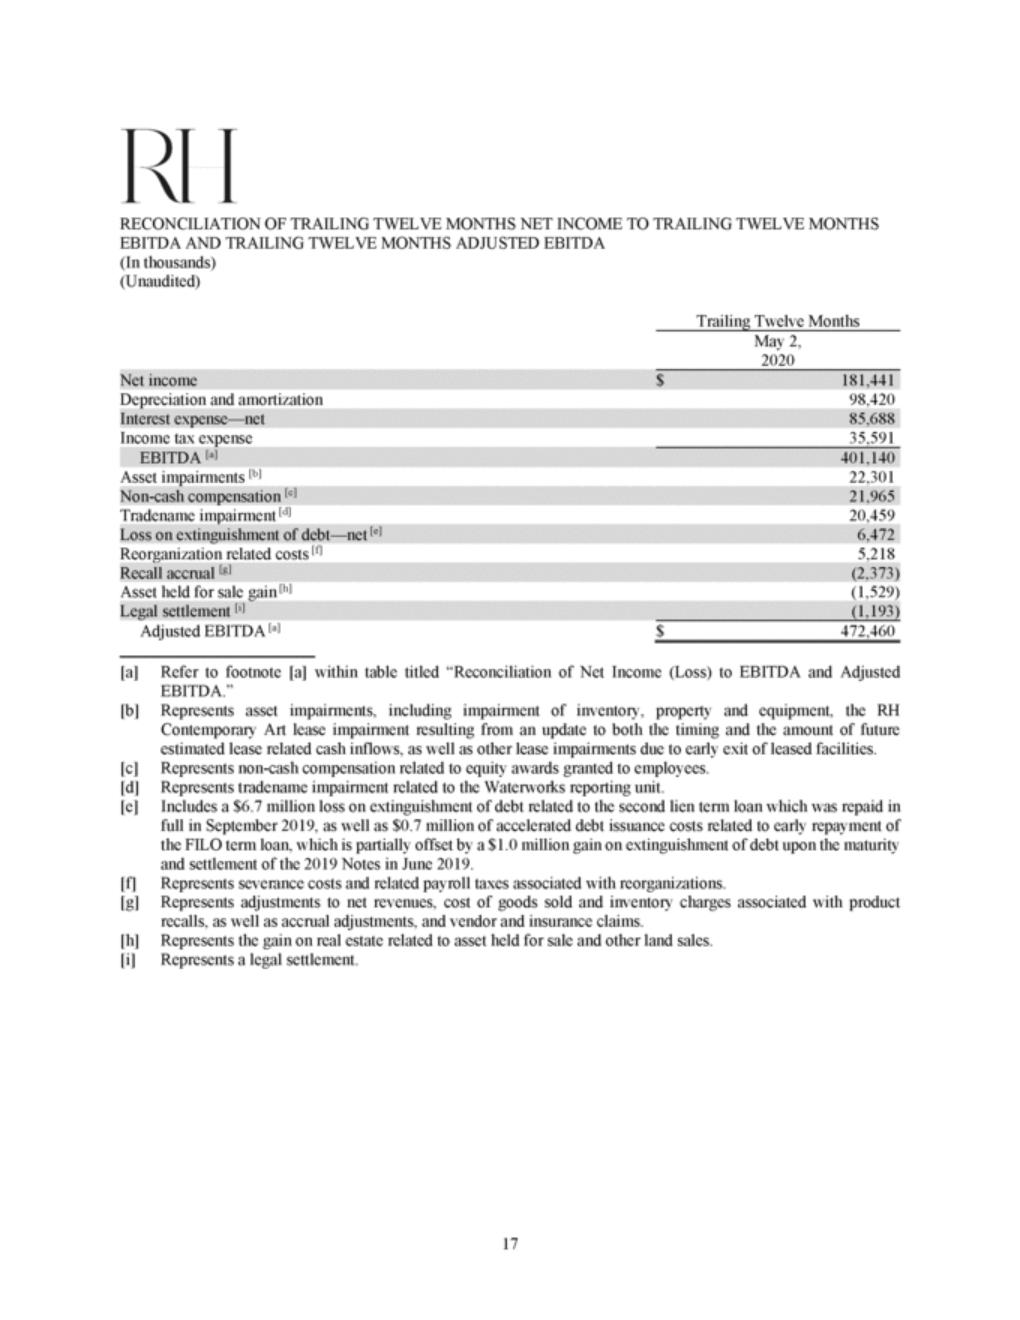
| RECONCILIATION OF TRAILING TWELVE MONTHS NET INCOME TO TRAILING TWELVE MONTHS EBITDA AND TRAILING TWELVE MONTHS ADJUSTED EBITDA (In thousands) (Unaudited) Trailing Twelve Months May 2, 2020 Depreciation and amortization 98,420 Income tax expense 35,591 Asset impairments [b] 22,301 Tradename impairment [d] 20,459 Reorganization related costs [f] 5,218 Asset held for sale gain [h] (1,529) Adjusted EBITDA [a] $ 472,460 [a] Refer to footnote [a] within table titled “Reconciliation of Net Income (Loss) to EBITDA and Adjusted EBITDA.” Represents asset impairments, including impairment of inventory, property and equipment, the RH Contemporary Art lease impairment resulting from an update to both the timing and the amount of future estimated lease related cash inflows, as well as other lease impairments due to early exit of leased facilities. Represents non-cash compensation related to equity awards granted to employees. Represents tradename impairment related to the Waterworks reporting unit. Includes a $6.7 million loss on extinguishment of debt related to the second lien term loan which was repaid in full in September 2019, as well as $0.7 million of accelerated debt issuance costs related to early repayment of the FILO term loan, which is partially offset by a $1.0 million gain on extinguishment of debt upon the maturity and settlement of the 2019 Notes in June 2019. Represents severance costs and related payroll taxes associated with reorganizations. Represents adjustments to net revenues, cost of goods sold and inventory charges associated with product recalls, as well as accrual adjustments, and vendor and insurance claims. Represents the gain on real estate related to asset held for sale and other land sales. Represents a legal settlement. [b] [c] [d] [e] [f] [g] [h] [i] 17 Legal settlement [i](1,193) Recall accrual [g](2,373) Loss on extinguishment of debt—net [e]6,472 Non-cash compensation [c]21,965 EBITDA [a]401,140 Interest expense—net85,688 Net income$181,441 |
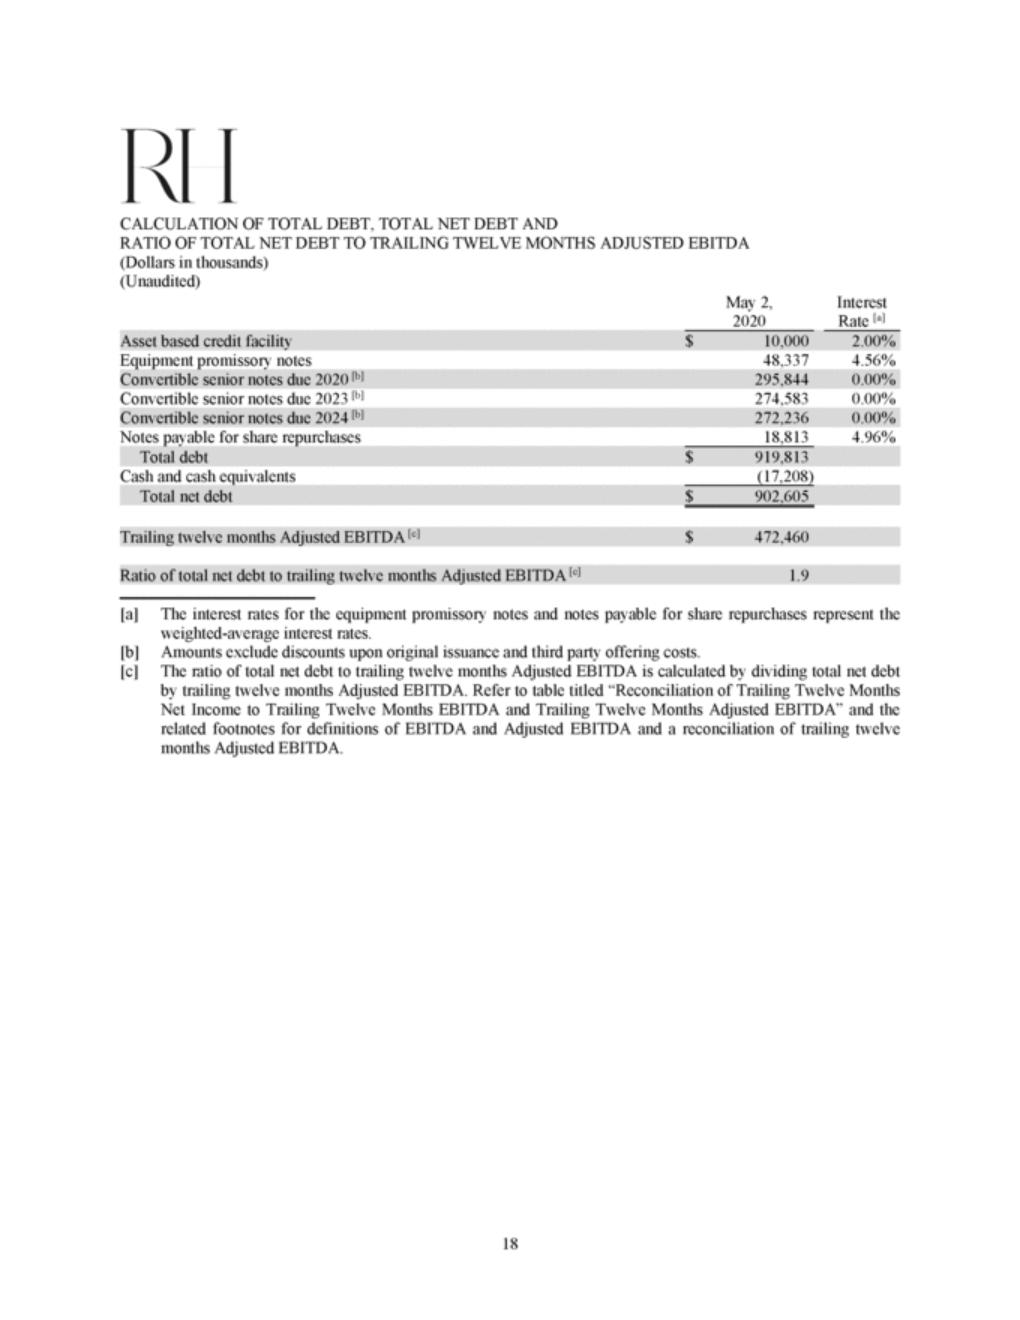
| CALCULATION OF TOTAL DEBT, TOTAL NET DEBT AND RATIO OF TOTAL NET DEBT TO TRAILING TWELVE MONTHS ADJUSTED EBITDA (Dollars in thousands) (Unaudited) May 2, 2020 Interest Rate [a] Equipment promissory notes 48,337 4.56% Convertible senior notes due 2023 [b] 274,583 0.00% Notes payable for share repurchases 18,813 4.96% Cash and cash equivalents (17,208) [a] The interest rates for the equipment promissory notes and notes payable for share repurchases represent the weighted-average interest rates. Amounts exclude discounts upon original issuance and third party offering costs. The ratio of total net debt to trailing twelve months Adjusted EBITDA is calculated by dividing total net debt by trailing twelve months Adjusted EBITDA. Refer to table titled “Reconciliation of Trailing Twelve Months Net Income to Trailing Twelve Months EBITDA and Trailing Twelve Months Adjusted EBITDA” and the related footnotes for definitions of EBITDA and Adjusted EBITDA and a reconciliation of trailing twelve months Adjusted EBITDA. [b] [c] 18 Ratio of total net debt to trailing twelve months Adjusted EBITDA [c]1.9 Trailing twelve months Adjusted EBITDA [c]$472,460 Total net debt$902,605 Total debt$919,813 Convertible senior notes due 2024 [b]272,2360.00% Convertible senior notes due 2020 [b]295,8440.00% Asset based credit facility$10,0002.00% |
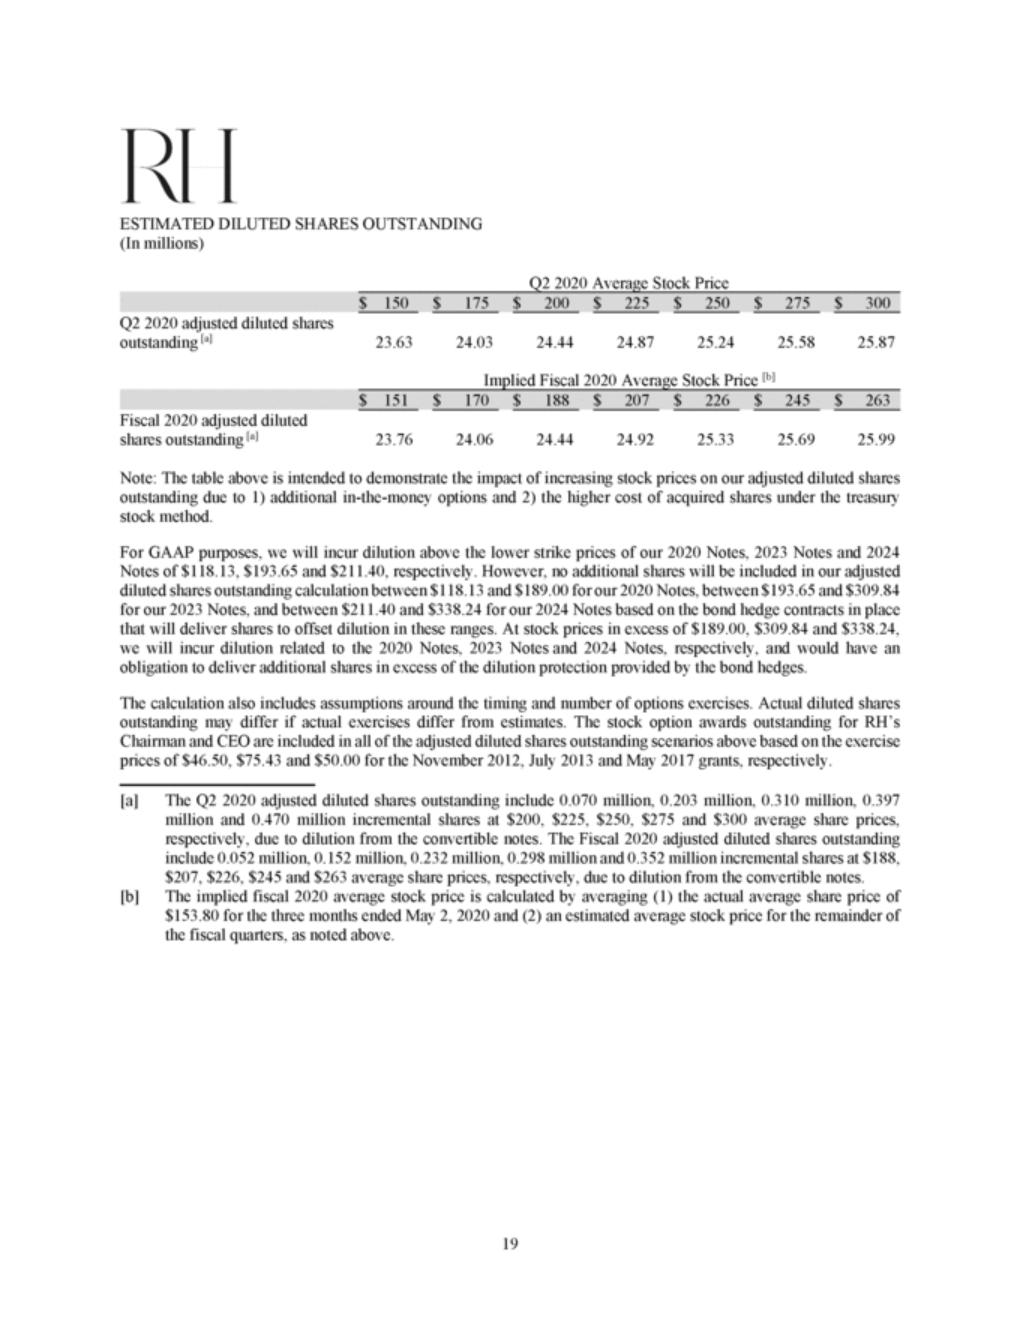
| ESTIMATED DILUTED SHARES OUTSTANDING (In millions) Q2 2020 Average Stock Price Q2 2020 adjusted diluted shares outstanding [a] 23.63 24.03 24.44 24.87 25.24 25.58 25.87 Implied Fiscal 2020 Average Stock Price [b] Fiscal 2020 adjusted diluted shares outstanding [a] 23.76 24.06 24.44 24.92 25.33 25.69 25.99 Note: The table above is intended to demonstrate the impact of increasing stock prices on our adjusted diluted shares outstanding due to 1) additional in-the-money options and 2) the higher cost of acquired shares under the treasury stock method. For GAAP purposes, we will incur dilution above the lower strike prices of our 2020 Notes, 2023 Notes and 2024 Notes of $118.13, $193.65 and $211.40, respectively. However, no additional shares will be included in our adjusted diluted shares outstanding calculation between $118.13 and $189.00 for our 2020 Notes, between $193.65 and $309.84 for our 2023 Notes, and between $211.40 and $338.24 for our 2024 Notes based on the bond hedge contracts in place that will deliver shares to offset dilution in these ranges. At stock prices in excess of $189.00, $309.84 and $338.24, we will incur dilution related to the 2020 Notes, 2023 Notes and 2024 Notes, respectively, and would have an obligation to deliver additional shares in excess of the dilution protection provided by the bond hedges. The calculation also includes assumptions around the timing and number of options exercises. Actual diluted shares outstanding may differ if actual exercises differ from estimates. The stock option awards outstanding for RH’s Chairman and CEO are included in all of the adjusted diluted shares outstanding scenarios above based on the exercise prices of $46.50, $75.43 and $50.00 for the November 2012, July 2013 and May 2017 grants, respectively. [a] The Q2 2020 adjusted diluted shares outstanding include 0.070 million, 0.203 million, 0.310 million, 0.397 million and 0.470 million incremental shares at $200, $225, $250, $275 and $300 average share prices, respectively, due to dilution from the convertible notes. The Fiscal 2020 adjusted diluted shares outstanding include 0.052 million, 0.152 million, 0.232 million, 0.298 million and 0.352 million incremental shares at $188, $207, $226, $245 and $263 average share prices, respectively, due to dilution from the convertible notes. The implied fiscal 2020 average stock price is calculated by averaging (1) the actual average share price of $153.80 for the three months ended May 2, 2020 and (2) an estimated average stock price for the remainder of the fiscal quarters, as noted above. [b] 19 $ 151$170$188$207$226$245$263 $ 150$175$200$225$250$275$300 |