Attached files
| file | filename |
|---|---|
| 8-K - CURRENT REPORT - FS KKR Capital Corp. II | fskii-8k_060320.htm |
Exhibit 99.1
FS KKR Capital Corp. II (“FSKR”) Presentation JUNE 2020 1
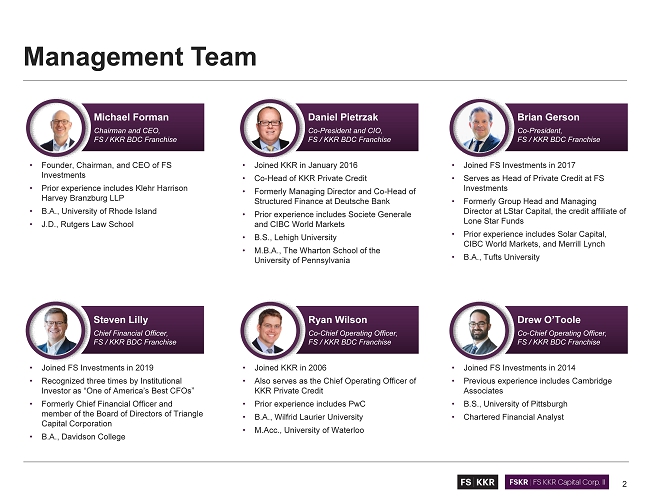
2 Management Team Michael Forman Chairman and CEO, FS / KKR BDC Franchise • Founder, Chairman, and CEO of FS Investments • Prior experience includes Klehr Harrison Harvey Branzburg LLP • B.A., University of Rhode Island • J.D., Rutgers Law School Brian Gerson Co - President, FS / KKR BDC Franchise • Joined FS Investments in 2017 • Serves as Head of Private Credit at FS Investments • Formerly Group Head and Managing Director at LStar Capital, the credit affiliate of Lone Star Funds • Prior experience includes Solar Capital, CIBC World Markets, and Merrill Lynch • B.A., Tufts University Ryan Wilson Co - Chief Operating Officer, FS / KKR BDC Franchise • Joined KKR in 2006 • Also serves as the Chief Operating Officer of KKR Private Credit • Prior experience includes PwC • B.A., Wilfrid Laurier University • M.Acc., University of Waterloo • Joined FS Investments in 2014 • Previous experience includes Cambridge Associates • B.S., University of Pittsburgh • Chartered Financial Analyst • Joined FS Investments in 2019 • Recognized three times by Institutional Investor as “One of America’s Best CFOs” • Formerly Chief Financial Officer and member of the Board of Directors of Triangle Capital Corporation • B.A., Davidson College Steven Lilly Chief Financial Officer, FS / KKR BDC Franchise Drew O’Toole Co - Chief Operating Officer, FS / KKR BDC Franchise Daniel Pietrzak Co - President and CIO, FS / KKR BDC Franchise • Joined KKR in January 2016 • Co - Head of KKR Private Credit • Formerly Managing Director and Co - Head of Structured Finance at Deutsche Bank • Prior experience includes Societe Generale and CIBC World Markets • B.S., Lehigh University • M.B.A., The Wharton School of the University of Pennsylvania
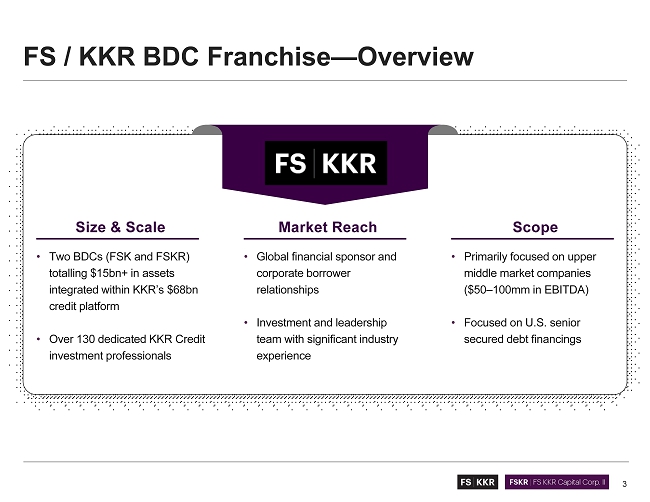
Size & Scale Market Reach Scope • Two BDCs (FSK and FSKR) totalling $15bn+ in assets integrated within KKR’s $68bn credit platform • Over 130 dedicated KKR Credit investment professionals • Global financial sponsor and corporate borrower relationships • Investment and leadership team with significant industry experience • Primarily focused on upper middle market companies ($50 – 100mm in EBITDA) • Focused on U.S. senior secured debt financings 3 FS / KKR BDC Franchise — Overview

4 Second Largest BDC Franchise in the U.S. Note : As of March 31 , 2020 . $7.4 $1.4 $1.8 $1.5 $8.2 $1.2 $0.5 $0.6 $15.8 $15.6 $9.4 $5.2 $4.3 $3.1 $2.9 $2.6 $2.6 $2.5 $2.4 $2.3 $2.1 $2.1 $2.1 $1.7 $1.5 ARCC ORCC PSEC GBDC NMFC AINV PNNT & PFLT BCSF MAIN HTGC SLRC & SUNS CGBD OCSL & OCSI TSLX TCPC GSBD FSKR FSK Total Assets Under Management Ranked by BDC Advisor/Manager ($ bn )

5 Overview of FSKR and FS / KKR Advisor

6 FSKR is Core to the FS / KKR BDC Franchise FSKR is a business development company (BDC) focused on providing customized credit solutions to private middle market companies Externally managed by FS / KKR Advisor, LLC • FS / KKR Advisor, a partnership between KKR and FS Investments, leverages the full platform of both firms • SEC co - investment exemptive relief with KKR Credit • Leading BDC manager Access to middle market direct lending opportunities • Historically stable, recurring income generation • Long - term target dividend yield of 9.0% of NAV 1 • Established and diversified portfolio of 179 borrowers • 80% of portfolio in senior secured investments 2 Sizable scale with $8.2bn of assets • Focused on upper middle market companies ($50 – 100mm of EBITDA) • Typically sole or lead lender • Scale can create cost of capital advantages • KKR Credit platform has ability to commit up to $1bn in a single transaction Note: Please refer to “Legal Disclosures” at the end of this presentation for additional detail on the calculation of AUM and fo r further information on KKR’s inside information barrier policies and procedures, which may limit the involvement of personnel in certain investment processes and discussions. All figures as of M arc h 31, 2020, unless otherwise noted. 1. Excluding special dividends. 2. Figure excludes the impact of the investment in Credit Opportunities Partners, LLC (“COP”). COP is a joint venture between FS KR and South Carolina Retirement Systems Group Trust.
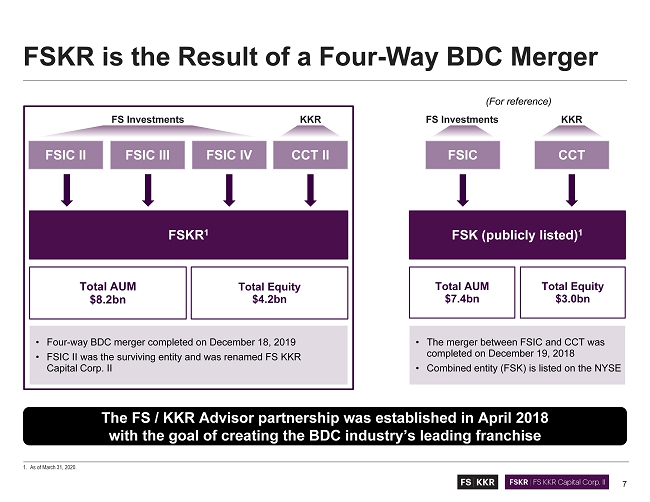
FSKR is the Result of a Four - Way BDC Merger 1. As of March 31, 2020. The FS / KKR Advisor partnership was established in April 2018 with the goal of creating the BDC industry’s leading franchise • Four - way BDC merger completed on December 18, 2019 • FSIC II was the surviving entity and was renamed FS KKR Capital Corp. II FSKR 1 FSIC IV CCT II FSIC III FSIC II Total AUM $8.2bn Total Equity $4.2bn FS Investments KKR • The merger between FSIC and CCT was completed on December 19, 2018 • Combined entity (FSK) is listed on the NYSE FSIC FSK (publicly listed) 1 CCT Total AUM $7.4bn Total Equity $3.0bn KKR FS Investments (For reference) 7

8 FSKR Corporate Development Update A multi - stage plan designed to maximize shareholder value and create opportunities for long - term value creation Non - traded BDCs merger • Create significant scale for public markets • Ensure equal treatment of shareholders with NAV - for - NAV merger • Enable overall portfolio diversification while maintaining focus on core strategies • Reduce operating costs by eliminating redundant corporate expenses Listing • Provide a tradeable security to FSKR shareholders • Enable blue - chip following of FSKR and across the FS / KKR BDC franchise • Establish broad - based institutional research coverage network Key Corporate Milestones Status x 1 2 (Post listing) (December 2019) Increase leverage capacity • Enhance long - term FSKR dividend yield and ROE • Increased investment capacity will provide a strong liquidity position and will enable opportunistic investments in current market dislocation • Shareholder approval expected shortly after listing 3 (In process)

($ 207 bn AUM) ($23bn AUM) FS / KKR Advisor Overview 1. As of March 31, 2020. 2. As of March 31, 2020. Includes legacy investments in KKR Financial Holdings LLC, a specialty finance vehicle listed on the Ne w Y ork Stock Exchange and various collateralized loan obligation vehicles. x Ability to commit in scale (up to $1bn in a single transaction) x 1,000+ issuers on the KKR Credit platform x ~130 dedicated investment professionals x ~$2.1bn of KKR balance sheet invested across KKR credit strategies 2 x Ability to evaluate and commit across capital structures x Deep team with BDC industry operational experience since 2006 x Differentiated capital raising and fund management capabilities x Industry leading corporate affairs / BDC industry lobbying efforts x Industry leader in corporate governance and shareholder communications KKR ($68bn credit AUM) 1 FS Investments 1 9

Established in 1976, KKR is a Leading Investment Firm with over Four Decades of Investing Experience 20 Offices in 16 countries & 4 continents ~$20bn balance sheet invested in KKR strategies alongside our clients ~470 investment professionals (~130 KKR Credit) results - driven economic incentives with $2.1bn of KKR’s balance sheet committed across KKR credit strategies 1 Aligned Interests Total Assets Under Management $207bn Private Markets $114bn Public Markets $93bn Private Equity Private Credit Infrastructure Real Estate Energy Leveraged Credit Private Credit Special Situations Strategic Partnerships KKR Credit Assets Under Management $ 68 bn Private Credit $24bn Leveraged Credit $38bn Special Situations $ 5 bn Note : AUM figures as of March 31 , 2020 . Please see “Important Information” for important information regarding the calculation of AUM . 1. Includes legacy investments in KKR Financial Holdings LLC, a specialty finance vehicle listed on the New York Stock Exchange and various collateralized loan obligation vehicles . KKR is a Leading Alternative Asset Manager 10 KKR at a Glance

11 Large, Scalable Platform • $68bn of credit AUM • ~130 dedicated KKR investment professionals across 9 cities and 8 countries • 1,000+ issuers across the KKR credit platform Disciplined Investment Process • “PE - style” KKR - led due diligence standard • Fundamental credit investment philosophy based on rigorous financial analysis • Assets pass through multiple credit committee reviews prior to final approval Proven Track Record • $32bn+ originated over the last seven years across Direct Lending & Private Opportunistic Credit¹ • Strong credit performance evidenced by annualized default rate of 1.1% and total recovery of 76.5% 2,3,4 Exemptive Relief Across Other BDCs & Funds • Credit exposure is shared ratably across KKR Credit, including BDCs, private funds and SMAs • Scale allows the KKR credit platform to speak for significant capital commitments without compromising the benefits of diversification Team Structure • Meaningful focus over last several years to build out and institutionalize the private credit platform • Ability to capitalize on full KKR credit origination platform Benefits of KKR • KKR Credit actively utilizes KKR resources including Private Equity, KCM, KKR Macro Team, and KKR Capstone • Size and scale of broader firm important to BDC franchise Key KKR Credit Platform Highlights 1. Gross dollars invested inclusive of new transactions, follow - ons, and delayed draws and represents the aggregate amount of capit al that has been invested by all of KKR Credit’s investment vehicles in private credit strategies and is used as a measure of in vestment activity for KKR Credit in a given period. 2. Stats from 2011 – Q1 2020, includes KKR origination activity & defaults for Corporate Capital Trust, Inc. (“CCT”), Corporate Capit al Trust II (“CCT II”), KKR Lending Partners (“KLP”), KKR Lending Partners II (“KLP II), KKR Lending Partners III (“KLP III”) since inception date and FSK, FSKR, Franklin Square Investment Corp. III ( “FS IC III”), Franklin Square Investment Corp. IV (“FSIC IV”) from 2Q’18 – 1Q’20. 3. KKR total recovery is calculated as local currency cash on cash for both 1) the life of the defaulted investment plus 2) any def ensive investments which were made after default. This number includes interest, fees, principal proceeds, and related expens es. 4. KKR default is calculated as the constant default rate for 2011 – Q1 2020.
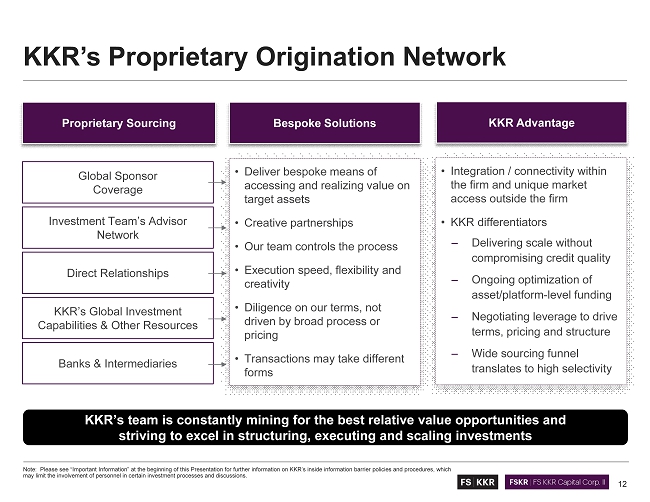
12 KKR’s Proprietary Origination Network Note : Please see “Important Information” at the beginning of this Presentation for further information on KKR’s inside information barrier policies and procedures, which may limit the involvement of personnel in certain investment processes and discussions . Direct Relationships Proprietary Sourcing KKR’s Global Investment Capabilities & Other Resources Global Sponsor Coverage Investment Team’s Advisor Network Banks & Intermediaries KKR’s team is constantly mining for the best relative value opportunities and striving to excel in structuring, executing and scaling investments Bespoke Solutions • Deliver bespoke means of accessing and realizing value on target assets • Creative partnerships • Our team controls the process • Execution speed, flexibility and creativity • Diligence on our terms, not driven by broad process or pricing • Transactions may take different forms KKR Advantage • Integration / connectivity within the firm and unique market access outside the firm • KKR differentiators – Delivering scale without compromising credit quality – Ongoing optimization of asset/platform - level funding – Negotiating leverage to drive terms, pricing and structure – Wide sourcing funnel translates to high selectivity

13 KKR Provides Speed of Execution and Total Capital Solutions …Which has Translated to Strong Growth in Our Sponsor Network …and Financial Intermediary Coverage Core Equity Holdings

14 Note: Figures above represent commitments across KKR platform. KKR Credit Platform: Tangible Results • Committed $363mm to an $800mm Second Lien Term Loan • Provided $182mm of a $600mm Preferred Equity Tranche • U.S. residential bridge loan purchasing company • Built de novo platform backing seasoned management team • Supported Sycamore’s carveout of the Canadian business • No direct competitor, Amazon penetration significantly lower, stable cash flow with ability to de - lever • Drove out - of - court restructuring with advantageous outcome and board representation • Exited through lender prewired sale / refi process with milestones and penalties • Sole Lender • Committed to a $415mm First Lien Term Loan with a $200mm Delayed Draw Term Loan • Short maturity and elevated amortization • Significant pricing premium to comps • Ability to lead large transactions • KKR uniquely positioned to analyze business; industry knowledge created structuring advantage • Leveraged KKR Partner General Petraeus and the KKR Global Institute Commit In Size Find Hidden Value Be Creative Navigate Challenging Situations
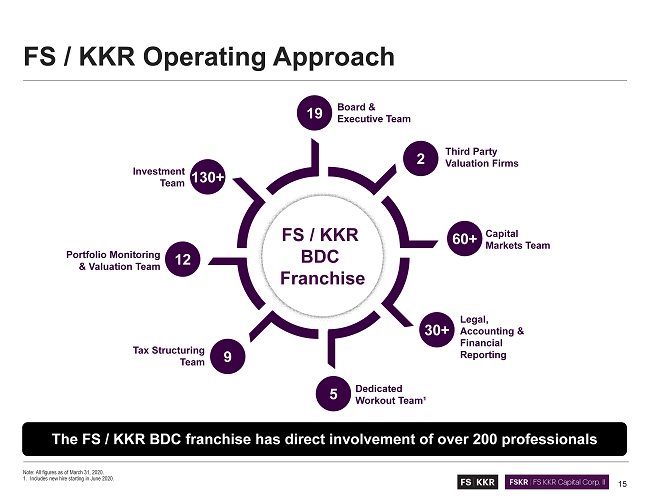
15 FS / KKR Operating Approach The FS / KKR BDC franchise has direct involvement of over 200 professionals FS / KKR BDC Franchise 19 Board & Executive Team 2 Third Party Valuation Firms 60+ Capital Markets Team 30+ Legal, Accounting & Financial Reporting 5 Dedicated Workout Team¹ 9 Tax Structuring Team 12 Portfolio Monitoring & Valuation Team 130+ Investment Team Note : All figures as of March 31 , 2020 . 1. Includes new hire starting in June 2020 .
16 FSKR Target Market and Investment Portfolio

17 Overview of U.S. Middle Market Lending $21.4 $14.1 $6.0 $3.9 $2.9 Leading World Economies ($ tn ) Opportunity U.S. MM x Private transactions allow for better structures than syndicated deals x Pricing 200 - 300 bps above syndicated market x The middle market provides attractive investment yields on an absolute and relative basis x Investor friendly structures include first lien collateral positions, call provisions, upfront fees, and financial covenants x Management teams and financial sponsors have “skin in the game” which helps align interests Leveraged Lending Market Share Private Equity Dry Powder ($ bn ) Note: Financial data as of December 31, 2019. Source: S&P Capital IQ; 1 Institutional investors and finance companies. 0% 20% 40% 60% 80% 100% 1995 1999 2003 2007 2011 2015 2019 Banks & Securities Firms Non-Banks¹ $671 $685 $750 $833 $1,094 $1,290 $1,464 $77 $72 $103 $117 $127 $121 $116 2013 2014 2015 2016 2017 2018 2019 Private Equity Dry Powder Private Debt Fundraising Note: Financial data as of December 31, 2019. Source: Preqin Pro Source: International Monetary Fund (IMF)

Current Lending Environment is Attractive Recent market events are rapidly shifting the pendulum toward a more lender - friendly environment 18 0.0x 0.5x 1.0x 1.5x 2.0x 2.5x 3.0x 3.5x 4.0x 4.5x 5.0x 5.5x 6.0x 2000 2010 2020 First Lien Second Lien Starting Leverage 0.00x 2.50 - 4.50x Total Leverage Up to ~5.00x 4.00 - 6.00x Interest Rate L + 6.5 – 8.5% L + 8.5 – 10.5% Upfront Fees 2.0 – 4.0% 2.0 – 4.0% Call Protection Elevated Elevated Covenants Typically maintenance Typically incurrence • Current recessionary environment was caused by the sudden, voluntary shutdown of the U.S. economy, and as a result may be shorter than previous recessions • Given U.S. economy was at full employment prior to COVID - 19 pandemic, significant investment opportunities are likely to exist • Wider spreads combined with lower leverage and tighter covenants are producing an attractive investing environment • KKR’s scale, market reach and structuring capabilities are key advantages to opportunistically originate new investments during the current market dislocation Source: S&P LCD. Debt/EBITDA of Middle - Market Transactions Current Market Dynamics (April) “Recessionary periods” are typically followed by a lender - friendly environment

19 Primary Focus: The Upper Middle Market Market Participants Competitive Dynamics Lower MM Middle MM Upper MM BSL Market $3 – 25mm EBITDA $25 – 50mm EBITDA $50 – 100mm EBITDA $100mm+ EBITDA • Limited balance sheets • Single scope product offerings • Extreme competition • Highly structured financings with specific covenants • Ability to finance across capital structures • Less competition given size and scale required • Commoditized financing structures and product offerings • Tradable, liquid credit • Hundreds of community banks and “local” banks • 40 - 45 smaller BDCs • Numerous small, private funds • Limited number of large BDCs • Non - BDC market participants on an ad hoc basis • Bulge bracket banks • CLO funds • Loan mutual funds • Insurance companies

20 Rigorous Investment Review Process KKR’s investment process combines multiple touchpoints within the firm Screening 1 – 2 Weeks Due Diligence 2 – 6 Weeks Structuring, Documentation & Approval 1 – 2 Weeks Structuring discussions with borrower, legal, accounting and tax Iterations with KKR and BDC Investment Committees 2 3 Investment Sourcing 1 4 Investment Decision Private equity team may have diligenced the company / industry KKR portfolio companies may have industry views Credit team may have invested in company / industry KKR Capstone may have insight into jurisdiction / industry
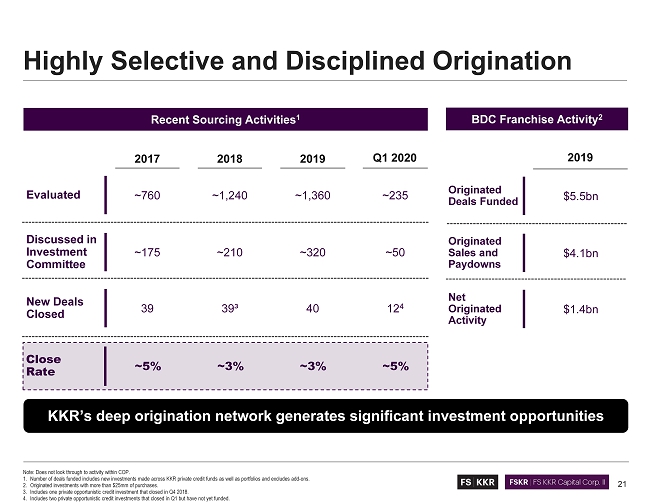
21 Highly Selective and Disciplined Origination Note : Does not look through to activity within COP . 1. Number of deals funded includes new investments made across KKR private credit funds as well as portfolios and excludes add - ons . 2. Originated investments with more than $ 25 mm of purchases . 3. Includes one private opportunistic credit investment that closed in Q 4 2018 . 4. Includes two private opportunistic credit investments that closed in Q 1 but have not yet funded . KKR’s deep origination network generates significant investment opportunities Close Rate Recent Sourcing Activities 1 BDC Franchise Activity 2 Evaluated Discussed in Investment Committee New Deals Closed 2017 39 ~175 ~760 ~5% 2018 39³ ~210 ~1,240 ~3% 2019 40 ~320 ~1,360 ~3% $5.5bn $4.1bn $1.4bn Originated Deals Funded Originated Sales and Paydowns Net Originated Activity 2019 12 4 ~50 ~ 235 ~5% Q1 2020

22 FSKR Investment Portfolio Composition Note: All stats as of March 31, 2020 unless otherwise noted. 1. Does not look through to FSKR’s portfolio companies held solely in COP or the TRS. 2. Figure excludes the impact of FSKR’s investment in COP and the TRS. 3. See FSKR’s Quarterly Report on Form 10 - Q for its definition of debt investments. 4. See FSKR’s Quarterly Report on Form 10 - Q for additional information on the calculation of weighted average annual yield on accru ing debt investments. 5. Figure based on count of Direct Origination investments only. 12.9% 11.7% 10.3% 9.7% 8.0% 5.8% 4.7% 4.7% 4.5% 4.1% 23.6% Capital Goods Software & Services Commercial & Professional Services Health Care Equipment & Services Diversified Financials Credit Opportunities Partners, LLC (COP) Consumer Durables & Apparel Retailing Media & Entertainment Consumer Services Other 68.5% 9.3% 2.0% 3.1% 7.9% 5.7% 3.5% Senior Secured Loans — First Lien Senior Secured Loans — Second Lien Other Senior Secured Debt Subordinated Debt Asset Based Finance Credit Opportunities Partners, LLC (COP) Equity/Other Security Exposure (by fair value) Sector Exposure (by fair value) Total Investments at Fair Value: $7,464mm 179 portfolio companies 26% FV in top - 10 portfolio companies 2 80% of investments in senior secured debt 2 $63 mm / 5.2 x Median portfolio company EBITDA & leverage 86% of debt investments are floating rate 3 8.9% Wtd. avg. annual yield on accruing debt investments 4 5.7% Non - accrual rate at FV 92% Lead, co - lead, or sole lender⁵

23 Note: Advisor formed in April 2018. FS / KKR Advisor Performance FS / KKR Advisor’s focused diligence and high - quality underwriting have resulted in significantly improved investment results $356 $300 $500 $490 $353 $538 $1,142 $807 Q2 2018 Q3 2018 Q4 2018 Q1 2019 Q2 2019 Q3 2019 Q4 2019 Q1 2020 FSKR New Investments by Quarter ($mm) Performance of new investments ($mm) 1 $3,696 ($17) $4,503 ($334) Cumulative app. / ( dep.) Cumulative investments • Cumulative depreciation totaled 0.47% as of December 31, 2019 • Cumulative depreciation totaled 7.4% on investments totaling $4.5bn as of March 31, 2020 • Average BDC industry portfolio depreciation totaled 8.4% during Q1 2020² 1. Includes the following quarters: Q2 2018, Q3 2018, Q4 2018, Q1 2019, Q2 2019, Q3 2019, Q4 2019. 2. Per Goldman Sachs BDC industry report of 47 public BDCs. Cumulative app. / (dep.) Cumulative investments Q2 2018 to Q4 2019 Q2 2018 to Q1 2020 Pre - COVID Including COVID

24 Note: All stats as of March 31, 2020 unless otherwise noted. Exemptive Relief Aligns Stakeholders’ Interests Asset Classes Uses of Capital • Senior Secured • First Lien • Second Lien • Asset Based Finance • Growth • M&A • LBOs • Carve - outs • Recapitalizations • SEC exemptive relief across KKR Credit platform ensures strong alignment of interest • FS / KKR Advisor is fully incentivized to deliver strong risk - adjusted returns across the Private Credit / BDC platform • Investment allocation across vehicles occurs on a formulaic basis depending on investment mandate and capital availability 26% 50% 72% 90% 100% 14% 32% 47% 59% 68% Top 10 Top 25 Top 50 Top 100 Total FSKR FSK FSKR Top Holdings (as % of Portfolio FMV) 22% 43% 66% 88% 100% 13% 33% 53% 72% 81% Top 10 Top 25 Top 50 Top 100 Total FSK FSKR FSK Top Holdings (as % of Portfolio FMV) Targeted Investments Portfolio Overlap between FSKR and FSK

25 Note: Statistics shown for directly originated investments only. 1. Based on publicly available information and company portfolio data at fair value where applicable. Comparable Portfolio Statistics Across Both FSK and FSKR Average metric FSKR FSK ¹ (for reference) 1 st lien 2 nd lien 1 st lien 2 nd lien Average Portfolio Company EBITDA $75mm $154mm $70mm $138mm Median Portfolio Company EBITDA $61mm $104mm $57mm $81mm Average Leverage 5.3x 5.3x 5.4x 5.8x Median Leverage 5.2x 5.7x 5.5x 5.9x

26 Note: All stats as of March 31, 2020. 1. Assumes 1.0x leverage ratio. FSKR Joint Venture Overview Benefits • Strategic partnership with South Carolina Retirement Systems Group Trust (“SCRS”) • Joint Venture creates additional opportunities for FSKR to leverage KKR’s investment platform • Allows for certain international investments and asset - based finance • Primarily senior secured assets • Efficient use of capital for FSKR shareholders Key Stats (Q1 2020) Total Equity Commitment (FSKR and SCRS): $1bn Ownership: FSKR: 87.5% / SCRS: 12.5% Fair Value of Investments: $1,086mm Equity Commitment: $575mm FSKR Equity Drawn: 57% / $503mm Voting: FSKR: 50% / SCRS: 50% Growth Potential: ~$1bn Strong Expected Growth Equity Commitment FV of Investments ¹ $575mm $1bn Actual Pro forma $1,086mm $2bn+ Actual Pro forma

27 Key Investment Highlights

28 Key Investment Highlights Platform Scale Provides Distinct Competitive Advantages 1 Access to Leading and Differentiated Origination Pipeline 2 Disciplined Portfolio Construction and Risk Management 3 Growth Opportunities Provide Attractive Return Upside 4

29 Sustainable Competitive Advantages $15bn+ of assets in the combined FS / KKR BDC franchise KKR Credit platform has ability to make individual investments up to $1bn Direct access to full KKR investment network Lead, Co - lead or Sole Lender in 92% of total deals¹ Cumulative KKR Credit commitments of over $32bn ² Below average default and above average total recovery rates of 1.1% and 76.5% ³ , ⁴ 1 Note: As of March 31, 2020 unless otherwise noted. 1. Figure based on count of Direct Origination investments only. 2. Gross dollars invested inclusive of new transactions, follow - ons, and delayed draws and represents the aggregate amount of capi tal that has been invested by all of KKR Credit’s investment vehicles in private credit strategies and is used as a measure of investment activity for KKR Credit in a given period. 3. Stats from 2011 – Q1 2020, includes KKR origination activity & defaults for CCT, CCT II, KLP, KLP II, KLP III since inception date and FSK, FSKR, FSIC III, FSIC IV from 2Q’18 – 1Q’20. 4. KKR total recovery calculated as local currency cash on cash for both 1) life of defaulted investment plus 2) any defensiv e i nvestments made after default; for 2011 – 1Q’20; number includes interest, fees, principal proceeds, and related expenses. Default is constant default rate for 2011 – 1Q’20.
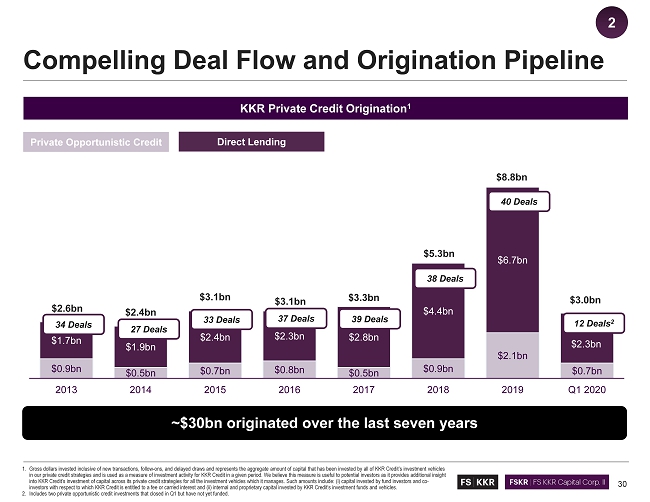
$2.6bn $2.4bn $3.1bn $3.1bn $3.3bn $5.3bn $8.8bn $3.0bn $0.9bn $0.5bn $0.7bn $0.8bn $0.5bn $0.9bn $2.1bn $0.7bn $1.7bn $1.9bn $2.4bn $2.3bn $2.8bn $4.4bn $6.7bn $2.3bn 2013 2014 2015 2016 2017 2018 2019 Q1 2020 30 Compelling Deal Flow and Origination Pipeline 2 Private Opportunistic Credit Direct Lending 37 Deals 33 Deals 27 Deals 34 Deals 39 Deals 38 Deals 40 Deals 1. Gross dollars invested inclusive of new transactions, follow - ons, and delayed draws and represents the aggregate amount of capit al that has been invested by all of KKR Credit’s investment vehicles in our private credit strategies and is used as a measure of investment activity for KKR Credit in a given period. We believe th is measure is useful to potential investors as it provides additional insight into KKR Credit’s investment of capital across its private credit strategies for all the investment vehicles which it manages . S uch amounts include: (i) capital invested by fund investors and co - investors with respect to which KKR Credit is entitled to a fee or carried interest and (ii) internal and proprietary capital in vested by KKR Credit’s investment funds and vehicles. 2. Includes two private opportunistic credit investments that closed in Q1 but have not yet funded. KKR Private Credit Origination 1 ~$30bn originated over the last seven years 12 Deals 2

31 Diverse and Differentiated Sourcing Channels • Access to KKR’s global relationship footprint • Investment Team has strong relationships with network of 150+ diversified sponsors • Relationships across 300+ portfolio companies • Work closely with sponsors to source investment opportunities and monitor company performance • Dislocated asset classes with higher risk - adjusted returns • Dedicated structuring team maximizes tax efficiency • Compelling use of 30% non - EPC bucket • Family office, private bank, and direct corporate relationships (750+ companies) enhance flow • Increased cross - sell opportunities across platform • Significant financial institutions relationships, leading KKR to receive the “first call” on many transactions Diverse Opportunity Set = + + Global Corporate and Non - Sponsor Coverage Global Asset - Based Finance Global Sponsor Coverage Attractive credit universe Enhanced portfolio quality Positive effect on risk - adjusted returns 2

32 Thoughtful Portfolio Construction and Proactive Risk Management 1 2 3 4 Visualize our portfolio composition and characteristics at all times Elevate our thinking from asset - level to portfolio - level Effectively model and isolate our macro risks Model different asset types and blend into one set of sensitivities and stress - tests Understand our current and projected performance Monitor performance drivers and course correct over fund’s horizon Model portfolio risk impact of potential new investments Rigorous assessment of new investment expected contribution to return and risk Fund Mar-19 Gross IRR Gross MoM Bridge to Contribution to Deployed Realized MV MoM Base Upside Downside Base Upside DownsideBase Case MoM MoM Base Case Upside Downside Deal A (189.6)$ -$ 214.7$ 1.1x 22.9% 36.4% 1.2% 2.0x 2.9x 1.0x 0.9x 7.6% 76 bps -89 bps Deal B (179.5)$ 19.8$ 212.1$ 1.3x 20.2% 24.3% 9.0% 2.2x 2.7x 1.4x 1.0x 8.5% 28 bps -55 bps Deal C (128.6)$ 8.0$ 202.2$ 1.6x 37.8% 71.4% 4.5% 2.6x 3.0x 1.2x 1.0x 7.9% 50 bps -98 bps Deal D (274.8)$ 127.6$ 178.8$ 1.1x 31.5% 43.9% 12.7% 2.3x 3.2x 1.4x 1.2x 13.3% 89 bps -93 bps Deal E (238.4)$ 80.2$ 176.1$ 1.1x 17.3% 22.7% -1.9% 1.4x 1.5x 1.0x 0.3x 3.5% 15 bps -41 bps Deal F (115.1)$ (0.5)$ 149.2$ 1.3x 7.6% 11.3% 5.3% 1.4x 1.6x 1.3x 0.1x 2.5% 15 bps -8 bps Deal G (132.8)$ 24.6$ 145.2$ 1.3x 15.2% 18.0% 11.9% 1.7x 1.6x 1.6x 0.4x 3.3% 6 bps -10 bps Deal H (100.1)$ 2.9$ 142.9$ 1.5x 16.9% 26.7% 10.6% 1.9x 2.6x 1.5x 0.4x 3.2% 33 bps -18 bps Other Open Positions (958.6)$ 207.5$ 659.3$ 0.9x 5.1% 11.2% -6.8% 1.2x 1.5x 0.8x 0.3x 0.2% 126 bps -133 bps Uncalled Capital 0.0$ -$ -$ 0.0x 15.0% 15.0% 15.0% 1.5x 1.5x 1.5x 1.5x 15.5% 0 bps 0 bps Total Open Positions (2,836.9)$ 523.2$ 2,601.3$ 1.1x Total Closed Positions (1,053.9)$ 1,098.9$ 2.1$ 1.0x FUND (3,890.9)$ 1,622.0$ 2,603.4$ 1.1x 13.8% 18.5% 5.2% 1.5x 1.8x 1.2x 0.4x 100.0% 502 bps -765 bps Impact to Fund IRR if metCurrent Note : Screenshots are for illustrative purposes only . Leverage dedicated portfolio construction and risk management team 3
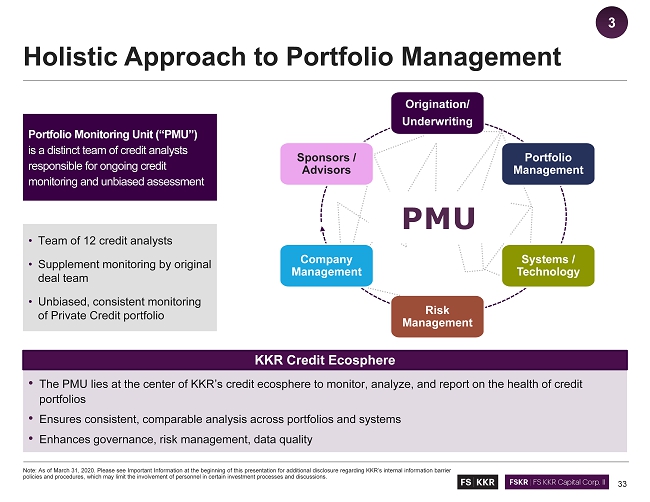
33 Holistic Approach to Portfolio Management Note : As of March 31 , 2020 . Please see Important Information at the beginning of this presentation for additional disclosure regarding KKR’s internal information barrier policies and procedures, which may limit the involvement of personnel in certain investment processes and discussions . Portfolio Monitoring Unit (“PMU”) is a distinct team of credit analysts responsible for ongoing credit monitoring and unbiased assessment • Team of 12 credit analysts • Supplement monitoring by original deal team • Unbiased, consistent monitoring of Private Credit portfolio KKR Credit Ecosphere • The PMU lies at the center of KKR’s credit ecosphere to monitor, analyze, and report on the health of credit portfolios • Ensures consistent, comparable analysis across portfolios and systems • Enhances governance, risk management, data quality Risk Management PMU Origination/ Underwriting Portfolio Management Systems / Technology Company Management Sponsors / Advisors 3
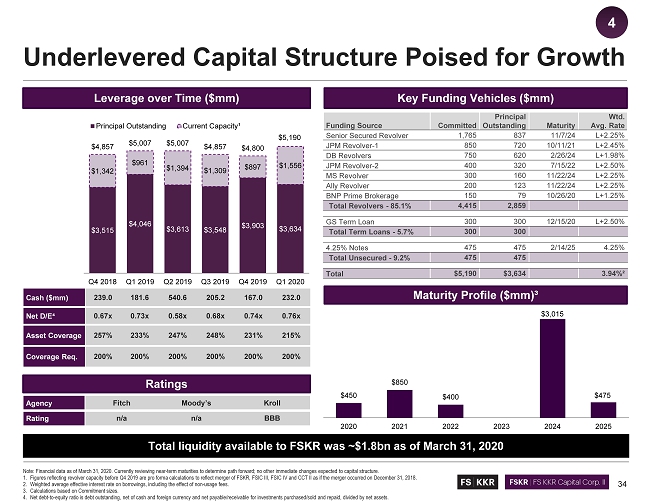
34 Note: Financial data as of March 31, 2020. Currently reviewing near - term maturities to determine path forward; no other immediat e changes expected to capital structure. 1. Figures reflecting revolver capacity before Q4 2019 are pro forma calculations to reflect merger of FSKR, FSIC III, FSIC IV a nd CCT II as if the merger occurred on December 31, 2018. 2. Weighted average effective interest rate on borrowings, including the effect of non - usage fees. 3. Calculations based on Commitment sizes. 4. Net debt - to - equity ratio is debt outstanding, net of cash and foreign currency and net payable/receivable for investments purcha sed/sold and repaid, divided by net assets. Underlevered Capital Structure Poised for Growth Cash ($mm) 239.0 181.6 540.6 205.2 167.0 232.0 Net D/E ⁴ 0.67x 0.73x 0.58x 0.68x 0.74x 0.76x Asset Coverage 257% 233% 247% 248% 231% 215% Coverage Req. 200% 200% 200% 200% 200% 200% $450 $850 $400 $3,015 $475 2020 2021 2022 2023 2024 2025 $3,515 $4,046 $3,613 $3,548 $3,903 $3,634 $1,342 $961 $1,394 $1,309 $897 $1,556 $4,857 $5,007 $5,007 $4,857 $4,800 $5,190 Q4 2018 Q1 2019 Q2 2019 Q3 2019 Q4 2019 Q1 2020 Principal Outstanding Current Capacity¹ Funding Source Committed Principal Outstanding Maturity Wtd. Avg. Rate Senior Secured Revolver 1,765 837 11/7/24 L+2.25% JPM Revolver - 1 850 720 10/11/21 L+2.45% DB Revolvers 750 620 2/26/24 L+1.98% JPM Revolver - 2 400 320 7/15/22 L+2.50% MS Revolver 300 160 11/22/24 L+2.25% Ally Revolver 200 123 11/22/24 L+2.25% BNP Prime Brokerage 150 79 10/26/20 L+1.25% Total Revolvers - 85.1% 4,415 2,859 GS Term Loan 300 300 12/15/20 L+2.50% Total Term Loans - 5.7% 300 300 4.25% Notes 475 475 2/14/25 4.25% Total Unsecured - 9.2% 475 475 Total $5,190 $3,634 3.94%² Agency Fitch Moody’s Kroll Rating n/a n/a BBB Leverage over Time ($mm ) Key Funding Vehicles ($mm ) Maturity Profile ($mm)³ Ratings Total liquidity available to FSKR was ~$1.8bn as of March 31, 2020 4

Potential Growth Opportunities 35 • Assuming approval of 150% asset coverage ratio, FSKR will unlock between $1.0bn and $2.0bn of portfolio growth potential • At a weighted average investment yield of 10.0%, this potential equates to additional investment income of ~$100mm to $200mm • Additional cost savings opportunities may equate to $5mm to $10mm per year 0.76x 1.00 – 1.25x Current Target $7.5bn $7.5bn $7.5bn $7.5bn $7.5bn Target (1.00x D/E) Target (1.25x D/E) The upper end of FSKR’s target leverage ratio implies growth capital equal to 27% of our existing investment portfolio Incremental Growth Potential Net Debt / Equity 1 (March 31, 2020) 1. Net debt - to - equity ratio is debt outstanding, net of cash and foreign currency and net payable/receivable for investments purcha sed/sold and repaid, divided by net assets. 2. Based on maximum current committed leverage capacity. 4 Portfolio FV Growth Potential Current (0.76x D/E) Covenant Cushion $1.0bn Maximum² (1.00x D/E) Maximum² (2.00x D/E) $1.0bn $2.0bn $2.0bn $3.2bn 200% ACR 150% ACR

36 Potential for Meaningful Return Upside 4 12.2% 11.5% 11.1% 10.8% 10.5% 10.4% 10.3% 9.9% 9.7% 9.6% 9.5% 8.5% 7.9% 7.5% 6.9% 6.2% Peer 1 Peer 2 Peer 3 Peer 4 Peer 5 Peer 6 Peer 7 Peer 8 FSKR Peer 9 Peer 10 Peer 11 Peer 12 Peer 13 Peer 14 Peer 15 Annualized Dividend Yield as of Q2 2020 (as a % of NAV) Committed capital available for growth up to 1.25x regulatory leverage ceiling ($ bn )¹ $0.0 $0.0 $2.0 $0.0 $0.3 $0.0 $0.4 $0.0 $2.0² $0.0 $0.0 $0.6 $0.4 $0.3 $0.0 $0.0 Regulatory net leverage as of March 31, 2020 1.22x 1.72x 0.59x 1.51x 0.95x 1.50x 1.19x 1.28x 0.76x 1.74x 1.78x 0.56x 1.07x 0.82x 1.20x 1.59x 1. Lesser of additional debt that can be taken on up to an implied 1.25x net leverage, or total undrawn commitments under existi ng facilities plus cash on balance sheet. 2. Includes net payable/receivable for investments purchased/sold and repaid.

37 In Summary Disciplined Portfolio Construction and Risk Management Diversified, secured, directly - originated portfolio constructed with a late cycle mentality 3 Growth Opportunities Provide Attractive Return Upside Material return upside potential from achieving target leverage and cost synergies 4 Platform Scale Provides Distinct Competitive Advantages Leading BDC franchise with $15bn+ of combined assets 1 Access to Leading and Differentiated Origination Pipeline Originated ~$9bn in loans across KKR’s Private Credit platform in 2019 2

38 Appendix

39 FS / KKR BDC Franchise Sits Alongside Broader KKR Credit Accounts BDC franchise has access to the same KKR Credit investment opportunities as other client accounts • Through SEC exemptive relief, the BDC franchise receives a pro rata allocation of deals that fit each BDC’s mandates • Legal and compliance must review and approve the allocation methodology anytime an opportunity is not distributed pro rata to the BDC franchise Investment Approval and Allocation Process Note: Fee terms between funds may vary. Pro rata allocation decisions are based on a variety of factors, including but not li mit ed to, available capital, demand size, investment suitability, deal - specific considerations, and portfolio management. KKR’s investment mandate includes participation in the dire ct lending and private opportunistic credit strategies as well as liquid credit investments when appropriate. FS / KKR BDC Franchise KKR SMAs Pro rata allocation between BDC Franchise and KKR Credit Private Funds Investment Committee screening Deal Team diligence Structure iterations / feedback Investment Committee approval KKR Flagship Funds
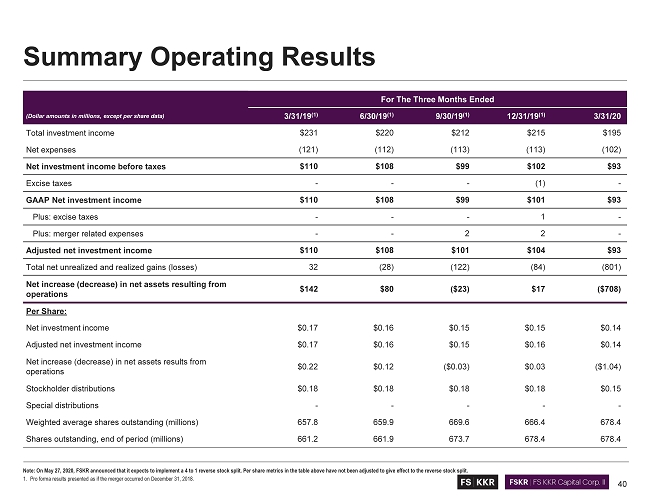
40 Note: On May 27, 2020, FSKR announced that it expects to implement a 4 to 1 reverse stock split. Per share metrics in the tab le above have not been adjusted to give effect to the reverse stock split. 1. Pro forma results presented as if the merger occurred on December 31, 2018. Summary Operating Results For The Three Months Ended (Dollar amounts in millions, except per share data) 3/31/19 (1) 6/30/19 (1) 9/30/19 (1) 12/31/19 (1) 3/31/20 Total investment income $231 $220 $212 $215 $195 Net expenses (121) (112) (113) (113) (102) Net investment income before taxes $110 $108 $99 $102 $93 Excise taxes - - - (1) - GAAP Net investment income $110 $108 $99 $101 $93 Plus: excise taxes - - - 1 - Plus: merger related expenses - - 2 2 - Adjusted net investment income $110 $108 $101 $104 $93 Total net unrealized and realized gains (losses) 32 (28) (122) (84) (801) Net increase (decrease) in net assets resulting from operations $142 $80 ($23) $17 ($708) Per Share: Net investment income $0.17 $0.16 $0.15 $0.15 $0.14 Adjusted net investment income $0.17 $0.16 $0.15 $0.16 $0.14 Net increase (decrease) in net assets results from operations $0.22 $0.12 ($0.03) $0.03 ($1.04) Stockholder distributions $0.18 $0.18 $0.18 $0.18 $0.15 Special distributions - - - - - Weighted average shares outstanding (millions) 657.8 659.9 669.6 666.4 678.4 Shares outstanding, end of period (millions) 661.2 661.9 673.7 678.4 678.4

41 Summary Balance Sheet As of (Dollar amounts in millions, except per share data) 3/31/20 Assets Total investments, at fair value $7,464 Cash 225 Foreign currency, at fair value 7 Collateral held at broker for interest rate swaps 59 Due from counterparty 4 Receivable for investments sold and repaid 321 Income receivable 88 Deferred financing costs 11 Unrealized appreciation on foreign currency forward contracts 1 Prepaid expenses and other assets 4 Total Assets $8,184 Liabilities Payable for investments purchased $114 Debt 3,629 Unrealized depreciation on derivative instruments 60 Shareholders’ distributions payable 102 Interest Payable 25 Other liabilities (1) 68 Total Liabilities $3,998 Total Net Assets $4,186 Net Asset Value per Share $6.17 1. Includes accrued performance - based incentive fees, accrued investment advisory fees, accrued directors’ fees, administrative expenses payable and deferred tax liabilities.

42 Note on Forward - Looking Statements This presentation may contain certain forward - looking statements, including statements with regard to future events or the future performance or operations of FSKR. Words such as “believes,” “expects,” “projects,” “future” and “pro forma” or similar expressions are intended to identify forward - looking statements. These forward - looking statements are subject to the inherent uncertainties in predicting future results and conditions. Certain factors could cause actual results to differ materially from those projected in these forward - looking statements. Some factors that could cause actual results to differ materially include changes in the economy, risks associated with possible disruption in FSKR’s operations or the economy generally due to terrorism, natural disasters or pandemics, future changes in laws or regulations and conditions in FSKR’s operating area, the lower asset coverage ratio not being approved by FSKR’s stockholders, FSKR not being able to utilize the additional leverage capacity, FSKR’s investment yield being less than 10%, and cost saving opportunities not materializing in the amounts expected or at all. Other factors are enumerated in the filings FSKR makes with the U.S. Securities and Exchange Commission FSKR undertakes no obligation to update or revise any forward looking statements, whether as a result of new information, future events or otherwise.