Attached files
| file | filename |
|---|---|
| 8-K - 8-K - Jernigan Capital, Inc. | tmb-20200601x8k.htm |
Exhibit 99.1
| June 2020 Investor Presentation INVESTOR PRESENTATION June 2020 JERNIGAN CAPITAL 6410 Poplar Ave, Suite 650 Memphis, TN 38119 |
| June 2020 Investor Presentation SAFE HARBOR DISCLOSURE REGARDING FORWARD-LOOKING STATEMENTS This presentation includes “forward-looking statements” within the meaning of the Private Securities Litigation Reform Act of 1995, including statements relating to the future performance, future book value, rates of return, exit capitalization rates, the timing of our investment cycle, future deliveries of new self-storage facilities in United States markets, the expected timing of completion of projects we finance, future profits from investments, our future stock price, our dividends to our common stockholders and the holders of our Series A and Series B Preferred Stock, our investment pipeline, our anticipated investment closings, future funding of existing investment commitments, the duration, severity and impact of the COVID-19 pandemic and resulting economic downturn, fair value measurements, our ability to acquire our developers’ interests in additional properties, our management team’s views of the self-storage market generally, our ability to successfully source, structure, negotiate and close investments in and acquisitions of self-storage facilities, the market dynamics of the MSAs in which our investments are located, our ability to fund our outstanding future investment commitments, our ability to own and manage our real estate assets, the availability, and the terms and our rate of deployment of equity capital and our ability to increase the borrowing base and use the accordion feature of our credit facility. The ultimate occurrence of events and results referenced in these forward-looking statements is subject to known and unknown risks and uncertainties, many of which are beyond our control. Such risks include our ability to obtain additional liquidity to fund our investment pipeline, our ability to make distributions at expected levels, the potential impact of interest rate fluctuations, the potential impacts of the COVID-19 pandemic, the uncertainty as to the value of our investments, the lack of liquidity in our investments and whether we can realize expected gains from our equity participation interests. These forward-looking statements are based upon the Company's present intentions and expectations, but the events and results referenced in these statements are not guaranteed to occur. The Company undertakes no duty or responsibility to publicly update or revise any forward-looking statement to reflect future events or circumstances or to reflect the occurrence of unexpected events. Investors should not place undue reliance upon forward-looking statements. For a discussion of these and other risks facing our business, see the information under the heading “Risk Factors” in the Company’s Annual Report on Form 10-K, and those set forth in the Company’s other reports and information filed with the Securities and Exchange Commission (“SEC”), which are accessible on the SEC’s website at www.sec.gov. This presentation contains statistics and other data that has been obtained from or compiled from information made available by third parties. We have not independently verified such statistics or data. Unless otherwise indicated, all metrics presented herein are as of March 31, 2020. 2 |
| June 2020 Investor Presentation INTRODUCTION OUR MISSION OUR TICKER SYMBOL Jernigan Capital provides debt and equity capital to private developers, owners and operators of self- storage facilities with a view toward eventual outright ownership of facilities we finance. Our mission is to maximize shareholder value by accumulating a multi-billion dollar investment portfolio consisting of the newest, most attractive and best located self-storage facilities in the United States through a talented and experienced team demonstrating the highest levels of integrity, dedication, excellence and community. 3 |
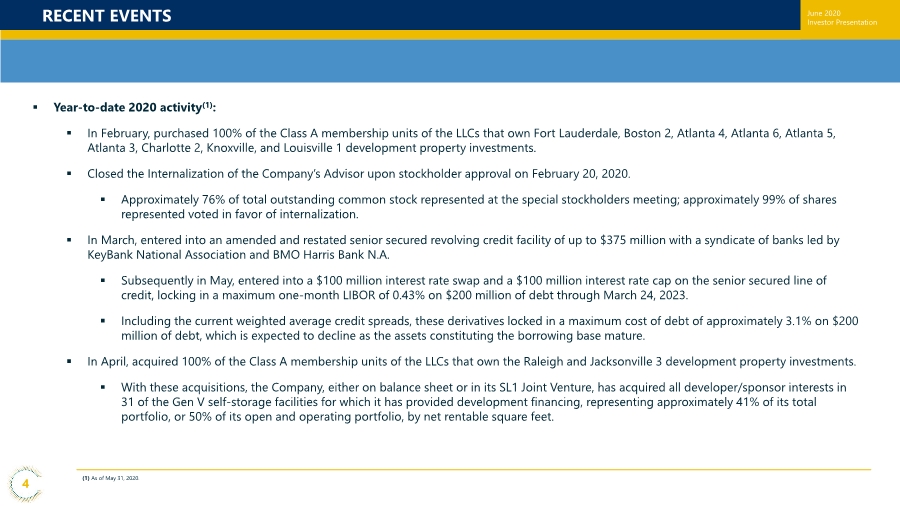
| June 2020 Investor Presentation RECENT EVENTS 4 (1) As of May 31, 2020. ▪ Year-to-date 2020 activity(1): ▪ In February, purchased 100% of the Class A membership units of the LLCs that own Fort Lauderdale, Boston 2, Atlanta 4, Atlanta 6, Atlanta 5, Atlanta 3, Charlotte 2, Knoxville, and Louisville 1 development property investments. ▪ Closed the Internalization of the Company’s Advisor upon stockholder approval on February 20, 2020. ▪ Approximately 76% of total outstanding common stock represented at the special stockholders meeting; approximately 99% of shares represented voted in favor of internalization. ▪ In March, entered into an amended and restated senior secured revolving credit facility of up to $375 million with a syndicate of banks led by KeyBank National Association and BMO Harris Bank N.A. ▪ Subsequently in May, entered into a $100 million interest rate swap and a $100 million interest rate cap on the senior secured line of credit, locking in a maximum one-month LIBOR of 0.43% on $200 million of debt through March 24, 2023. ▪ Including the current weighted average credit spreads, these derivatives locked in a maximum cost of debt of approximately 3.1% on $200 million of debt, which is expected to decline as the assets constituting the borrowing base mature. ▪ In April, acquired 100% of the Class A membership units of the LLCs that own the Raleigh and Jacksonville 3 development property investments. ▪ With these acquisitions, the Company, either on balance sheet or in its SL1 Joint Venture, has acquired all developer/sponsor interests in 31 of the Gen V self-storage facilities for which it has provided development financing, representing approximately 41% of its total portfolio, or 50% of its open and operating portfolio, by net rentable square feet. |
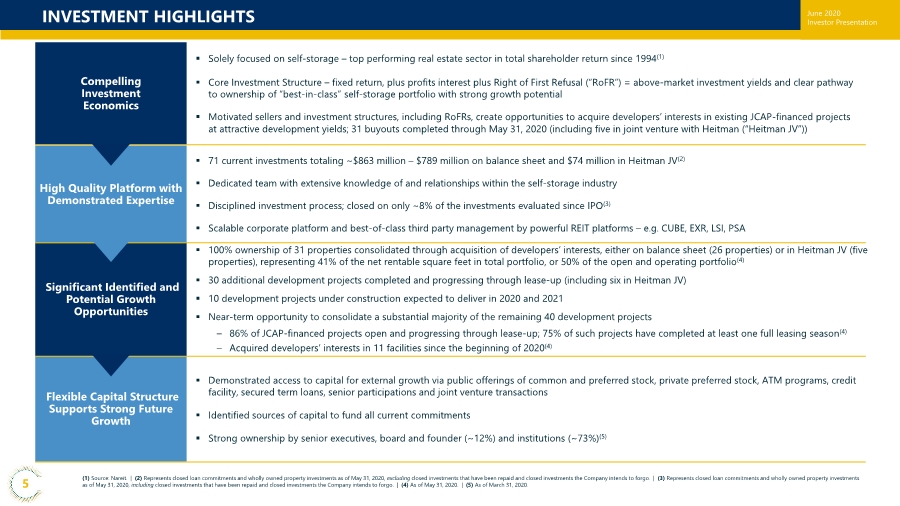
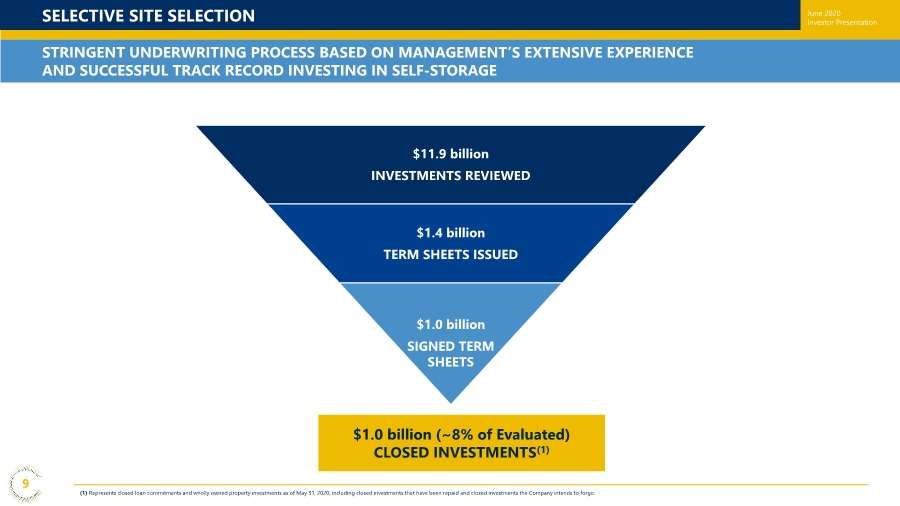
| June 2020 Investor Presentation ▪ 100% ownership of 31 properties consolidated through acquisition of developers’ interests, either on balance sheet (26 properties) or in Heitman JV (five properties), representing 41% of the net rentable square feet in total portfolio, or 50% of the open and operating portfolio(4) ▪ 30 additional development projects completed and progressing through lease-up (including six in Heitman JV) ▪ 10 development projects under construction expected to deliver in 2020 and 2021 ▪ Near-term opportunity to consolidate a substantial majority of the remaining 40 development projects – 86% of JCAP-financed projects open and progressing through lease-up; 75% of such projects have completed at least one full leasing season(4) – Acquired developers’ interests in 11 facilities since the beginning of 2020(4) Significant Identified and Potential Growth Opportunities Compelling Investment Economics ▪ Solely focused on self-storage – top performing real estate sector in total shareholder return since 1994(1) ▪ Core Investment Structure – fixed return, plus profits interest plus Right of First Refusal (“RoFR”) = above-market investment yields and clear pathway to ownership of “best-in-class” self-storage portfolio with strong growth potential ▪ Motivated sellers and investment structures, including RoFRs, create opportunities to acquire developers’ interests in existing JCAP-financed projects at attractive development yields; 31 buyouts completed through May 31, 2020 (including five in joint venture with Heitman (“Heitman JV”)) Flexible Capital Structure Supports Strong Future Growth ▪ Demonstrated access to capital for external growth via public offerings of common and preferred stock, private preferred stock, ATM programs, credit facility, secured term loans, senior participations and joint venture transactions ▪ Identified sources of capital to fund all current commitments ▪ Strong ownership by senior executives, board and founder (~12%) and institutions (~73%)(5) High Quality Platform with Demonstrated Expertise ▪ 71 current investments totaling ~$863 million – $789 million on balance sheet and $74 million in Heitman JV(2) ▪ Dedicated team with extensive knowledge of and relationships within the self-storage industry ▪ Disciplined investment process; closed on only ~8% of the investments evaluated since IPO(3) ▪ Scalable corporate platform and best-of-class third party management by powerful REIT platforms – e.g. CUBE, EXR, LSI, PSA INVESTMENT HIGHLIGHTS (1) Source: Nareit. | (2) Represents closed loan commitments and wholly owned property investments as of May 31, 2020, excluding closed investments that have been repaid and closed investments the Company intends to forgo. | (3) Represents closed loan commitments and wholly owned property investments as of May 31, 2020, including closed investments that have been repaid and closed investments the Company intends to forgo. | (4) As of May 31, 2020. | (5) As of March 31, 2020. 5 |
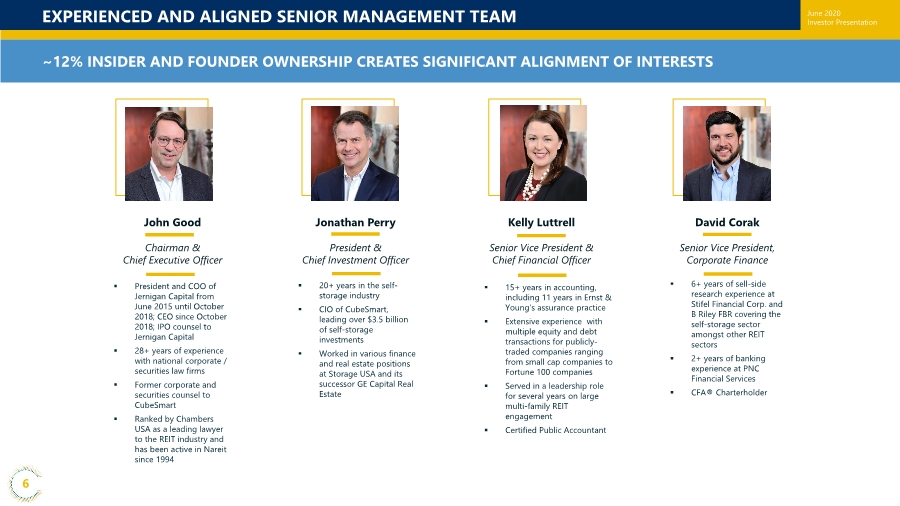
| June 2020 Investor Presentation EXPERIENCED AND ALIGNED SENIOR MANAGEMENT TEAM 6 Jonathan Perry President & Chief Investment Officer ▪ 20+ years in the self- storage industry ▪ CIO of CubeSmart, leading over $3.5 billion of self-storage investments ▪ Worked in various finance and real estate positions at Storage USA and its successor GE Capital Real Estate John Good Chairman & Chief Executive Officer ▪ President and COO of Jernigan Capital from June 2015 until October 2018; CEO since October 2018; IPO counsel to Jernigan Capital ▪ 28+ years of experience with national corporate / securities law firms ▪ Former corporate and securities counsel to CubeSmart ▪ Ranked by Chambers USA as a leading lawyer to the REIT industry and has been active in Nareit since 1994 David Corak Senior Vice President, Corporate Finance ▪ 6+ years of sell-side research experience at Stifel Financial Corp. and B Riley FBR covering the self-storage sector amongst other REIT sectors ▪ 2+ years of banking experience at PNC Financial Services ▪ CFA® Charterholder Kelly Luttrell Senior Vice President & Chief Financial Officer ▪ 15+ years in accounting, including 11 years in Ernst & Young’s assurance practice ▪ Extensive experience with multiple equity and debt transactions for publicly- traded companies ranging from small cap companies to Fortune 100 companies ▪ Served in a leadership role for several years on large multi-family REIT engagement ▪ Certified Public Accountant ~12% INSIDER AND FOUNDER OWNERSHIP CREATES SIGNIFICANT ALIGNMENT OF INTERESTS |
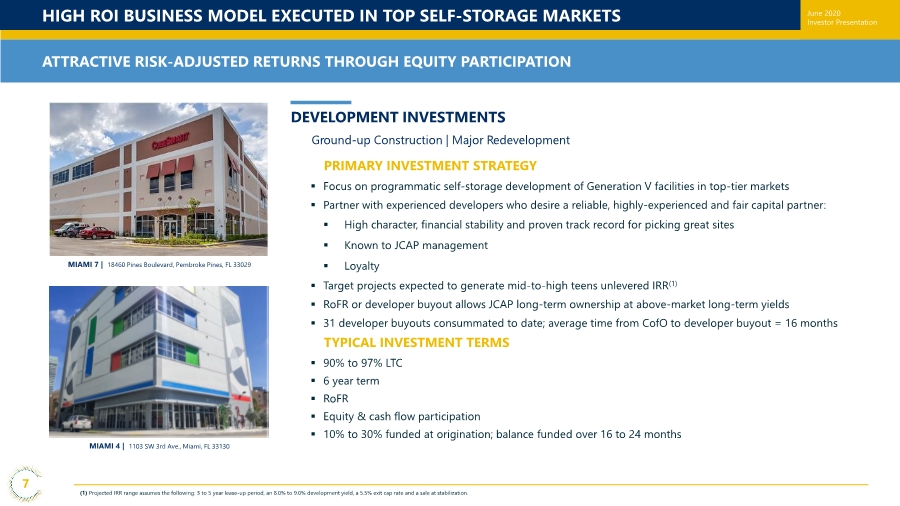
| June 2020 Investor Presentation HIGH ROI BUSINESS MODEL EXECUTED IN TOP SELF-STORAGE MARKETS ATTRACTIVE RISK-ADJUSTED RETURNS THROUGH EQUITY PARTICIPATION (1) Projected IRR range assumes the following: 3 to 5 year lease-up period, an 8.0% to 9.0% development yield, a 5.5% exit cap rate and a sale at stabilization. 7 DEVELOPMENT INVESTMENTS Ground-up Construction | Major Redevelopment ▪ Focus on programmatic self-storage development of Generation V facilities in top-tier markets ▪ Partner with experienced developers who desire a reliable, highly-experienced and fair capital partner: ▪ High character, financial stability and proven track record for picking great sites ▪ Known to JCAP management ▪ Loyalty ▪ Target projects expected to generate mid-to-high teens unlevered IRR(1) ▪ RoFR or developer buyout allows JCAP long-term ownership at above-market long-term yields ▪ 31 developer buyouts consummated to date; average time from CofO to developer buyout = 16 months PRIMARY INVESTMENT STRATEGY TYPICAL INVESTMENT TERMS ▪ 90% to 97% LTC ▪ 6 year term ▪ RoFR ▪ Equity & cash flow participation ▪ 10% to 30% funded at origination; balance funded over 16 to 24 months MIAMI 7 | 18460 Pines Boulevard, Pembroke Pines, FL 33029 MIAMI 4 | 1103 SW 3rd Ave., Miami, FL 33130 |
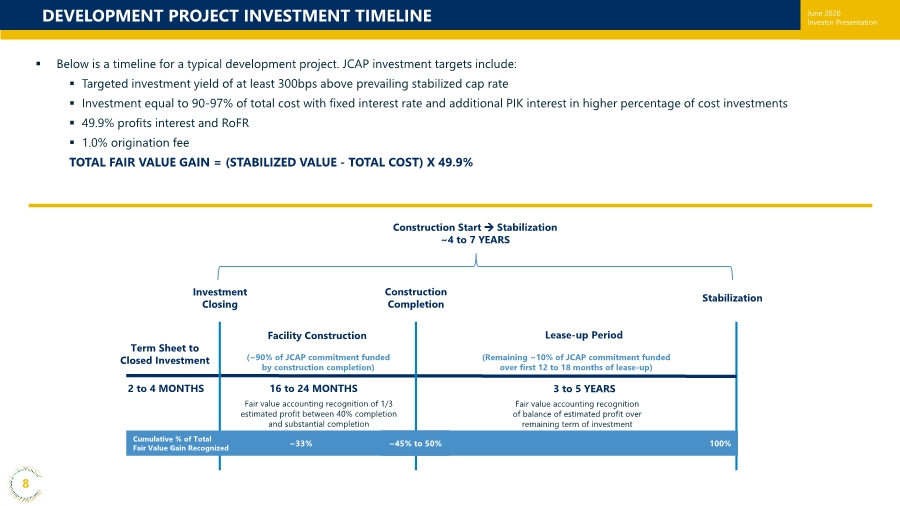
| June 2020 Investor Presentation DEVELOPMENT PROJECT INVESTMENT TIMELINE ▪ Below is a timeline for a typical development project. JCAP investment targets include: ▪ Targeted investment yield of at least 300bps above prevailing stabilized cap rate ▪ Investment equal to 90-97% of total cost with fixed interest rate and additional PIK interest in higher percentage of cost investments ▪ 49.9% profits interest and RoFR ▪ 1.0% origination fee TOTAL FAIR VALUE GAIN = (STABILIZED VALUE - TOTAL COST) X 49.9% Term Sheet to Closed Investment 2 to 4 MONTHS Fair value accounting recognition of 1/3 estimated profit between 40% completion and substantial completion Fair value accounting recognition of balance of estimated profit over remaining term of investment Facility Construction Lease-up Period Construction Completion Investment Closing Stabilization Construction Start → Stabilization ~4 to 7 YEARS (~90% of JCAP commitment funded by construction completion) 16 to 24 MONTHS 3 to 5 YEARS (Remaining ~10% of JCAP commitment funded over first 12 to 18 months of lease-up) Cumulative % of Total Fair Value Gain Recognized ~33% ~45% to 50% 100% 8 |
| June 2020 Investor Presentation SELECTIVE SITE SELECTION (1) Represents closed loan commitments and wholly owned property investments as of May 31, 2020, including closed investments that have been repaid and closed investments the Company intends to forgo. $11.9 billion INVESTMENTS REVIEWED $1.4 billion TERM SHEETS ISSUED $1.0 billion SIGNED TERM SHEETS $1.0 billion (~8% of Evaluated) CLOSED INVESTMENTS(1) 9 STRINGENT UNDERWRITING PROCESS BASED ON MANAGEMENT’S EXTENSIVE EXPERIENCE AND SUCCESSFUL TRACK RECORD INVESTING IN SELF-STORAGE |
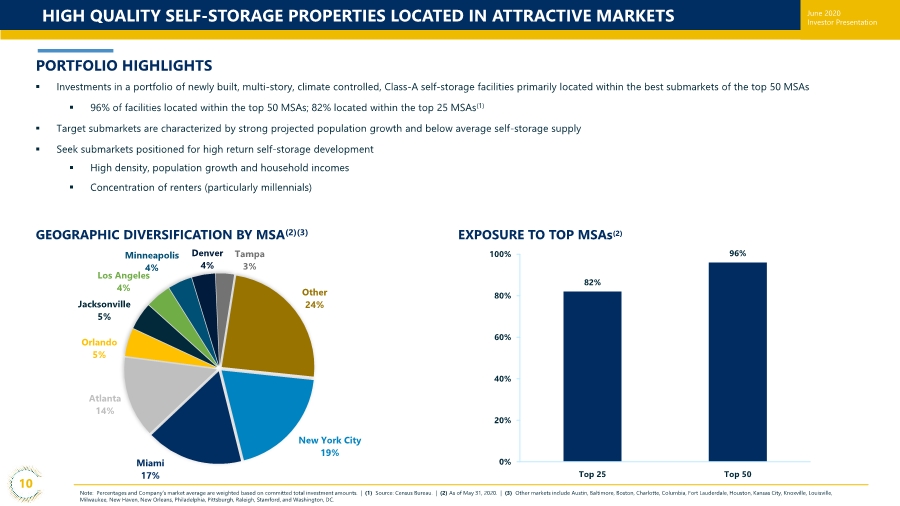
| June 2020 Investor Presentation HIGH QUALITY SELF-STORAGE PROPERTIES LOCATED IN ATTRACTIVE MARKETS Note: Percentages and Company’s market average are weighted based on committed total investment amounts. | (1) Source: Census Bureau. | (2) As of May 31, 2020. | (3) Other markets include Austin, Baltimore, Boston, Charlotte, Columbia, Fort Lauderdale, Houston, Kansas City, Knoxville, Louisville, Milwaukee, New Haven, New Orleans, Philadelphia, Pittsburgh, Raleigh, Stamford, and Washington, DC. PORTFOLIO HIGHLIGHTS ▪ Investments in a portfolio of newly built, multi-story, climate controlled, Class-A self-storage facilities primarily located within the best submarkets of the top 50 MSAs ▪ 96% of facilities located within the top 50 MSAs; 82% located within the top 25 MSAs(1) ▪ Target submarkets are characterized by strong projected population growth and below average self-storage supply ▪ Seek submarkets positioned for high return self-storage development ▪ High density, population growth and household incomes ▪ Concentration of renters (particularly millennials) 10 GEOGRAPHIC DIVERSIFICATION BY MSA(2)(3) New York City 19% Miami 17% Atlanta 14% Orlando 5% Jacksonville 5% Los Angeles 4% Minneapolis 4% Denver 4% Tampa 3% Other 24% EXPOSURE TO TOP MSAs(2) 82% 96% 0% 20% 40% 60% 80% 100% Top 25 Top 50 |
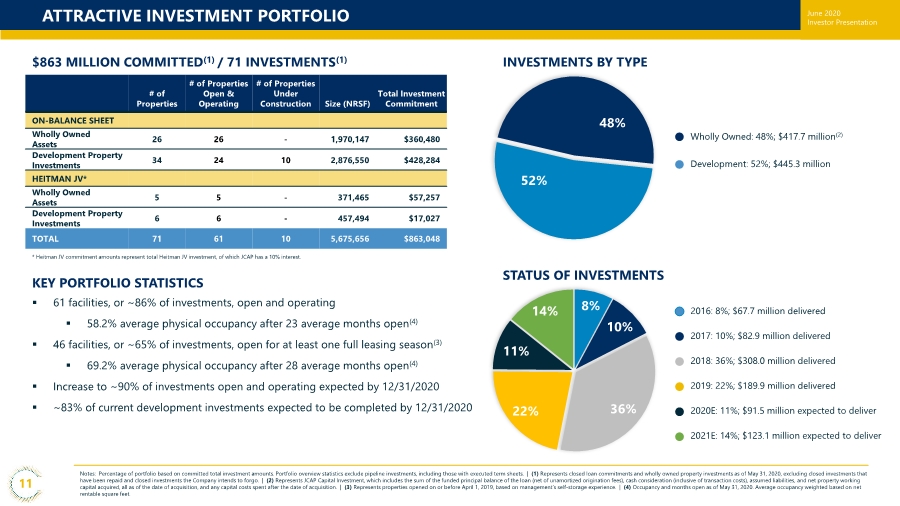
| June 2020 Investor Presentation 8% 10% 36% 22% 11% 14% Notes: Percentage of portfolio based on committed total investment amounts. Portfolio overview statistics exclude pipeline investments, including those with executed term sheets. | (1) Represents closed loan commitments and wholly owned property investments as of May 31, 2020, excluding closed investments that have been repaid and closed investments the Company intends to forgo. | (2) Represents JCAP Capital Investment, which includes the sum of the funded principal balance of the loan (net of unamortized origination fees), cash consideration (inclusive of transaction costs), assumed liabilities, and net property working capital acquired, all as of the date of acquisition, and any capital costs spent after the date of acquisition. | (3) Represents properties opened on or before April 1, 2019, based on management’s self-storage experience. | (4) Occupancy and months open as of May 31, 2020. Average occupancy weighted based on net rentable square feet. ATTRACTIVE INVESTMENT PORTFOLIO $863 MILLION COMMITTED(1) / 71 INVESTMENTS(1) INVESTMENTS BY TYPE STATUS OF INVESTMENTS 2016: 8%; $67.7 million delivered 2017: 10%; $82.9 million delivered 11 KEY PORTFOLIO STATISTICS ▪ 61 facilities, or ~86% of investments, open and operating ▪ 58.2% average physical occupancy after 23 average months open(4) ▪ 46 facilities, or ~65% of investments, open for at least one full leasing season(3) ▪ 69.2% average physical occupancy after 28 average months open(4) ▪ Increase to ~90% of investments open and operating expected by 12/31/2020 ▪ ~83% of current development investments expected to be completed by 12/31/2020 52% 2018: 36%; $308.0 million delivered 2019: 22%; $189.9 million delivered 2020E: 11%; $91.5 million expected to deliver Development: 52%; $445.3 million Wholly Owned: 48%; $417.7 million(2) 2021E: 14%; $123.1 million expected to deliver # of Properties # of Properties Open & Operating # of Properties Under Construction Size (NRSF) Total Investment Commitment ON-BALANCE SHEET Wholly Owned Assets 26 26 - 1,970,147 $360,480 Development Property Investments 34 24 10 2,876,550 $428,284 HEITMAN JV* Wholly Owned Assets 5 5 - 371,465 $57,257 Development Property Investments 6 6 - 457,494 $17,027 TOTAL 71 61 10 5,675,656 $863,048 * Heitman JV commitment amounts represent total Heitman JV investment, of which JCAP has a 10% interest. 48% |
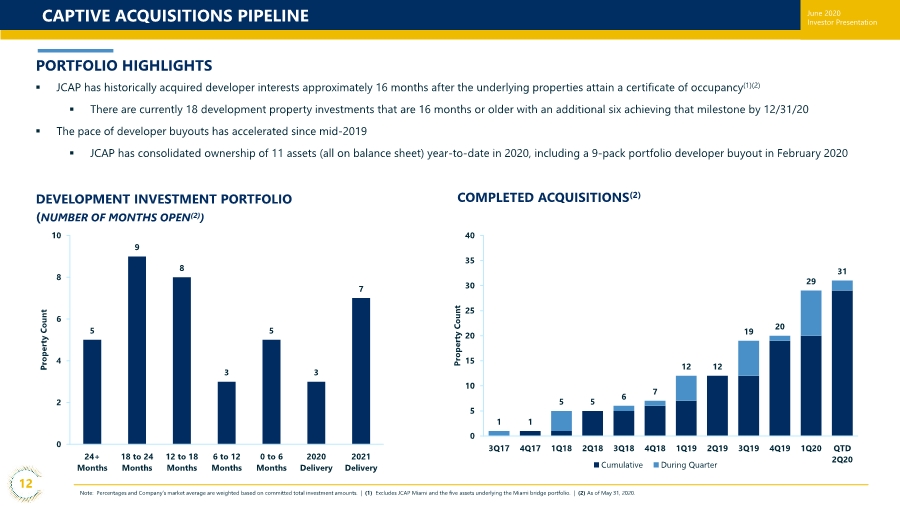
| June 2020 Investor Presentation CAPTIVE ACQUISITIONS PIPELINE Note: Percentages and Company’s market average are weighted based on committed total investment amounts. | (1) Excludes JCAP Miami and the five assets underlying the Miami bridge portfolio. | (2) As of May 31, 2020. PORTFOLIO HIGHLIGHTS ▪ JCAP has historically acquired developer interests approximately 16 months after the underlying properties attain a certificate of occupancy(1)(2) ▪ There are currently 18 development property investments that are 16 months or older with an additional six achieving that milestone by 12/31/20 ▪ The pace of developer buyouts has accelerated since mid-2019 ▪ JCAP has consolidated ownership of 11 assets (all on balance sheet) year-to-date in 2020, including a 9-pack portfolio developer buyout in February 2020 12 DEVELOPMENT INVESTMENT PORTFOLIO (NUMBER OF MONTHS OPEN(2)) COMPLETED ACQUISITIONS(2) 5 9 8 3 5 3 7 0 2 4 6 8 10 24+ Months 18 to 24 Months 12 to 18 Months 6 to 12 Months 0 to 6 Months 2020 Delivery 2021 Delivery Property Count 1 1 5 5 6 7 12 12 19 20 29 31 0 5 10 15 20 25 30 35 40 3Q17 4Q17 1Q18 2Q18 3Q18 4Q18 1Q19 2Q19 3Q19 4Q19 1Q20 QTD 2Q20 Property Count Cumulative During Quarter |
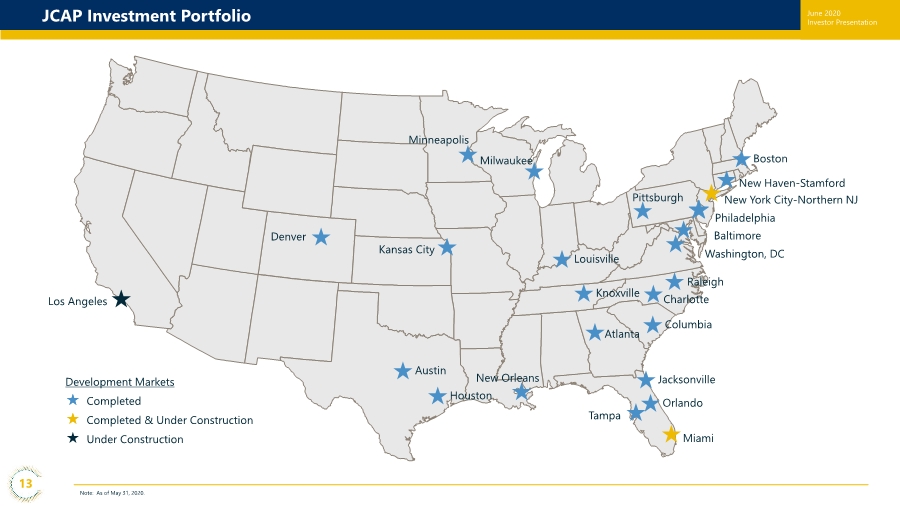
| June 2020 Investor Presentation 13 JCAP Investment Portfolio Note: As of May 31, 2020. Boston Washington, DC Kansas City New Haven-Stamford New York City-Northern NJ Philadelphia Tampa Los Angeles Baltimore Miami Atlanta Orlando Minneapolis Jacksonville Houston Austin New Orleans Knoxville Louisville Charlotte Columbia Milwaukee Pittsburgh Raleigh Denver Development Markets Completed Completed & Under Construction Under Construction |
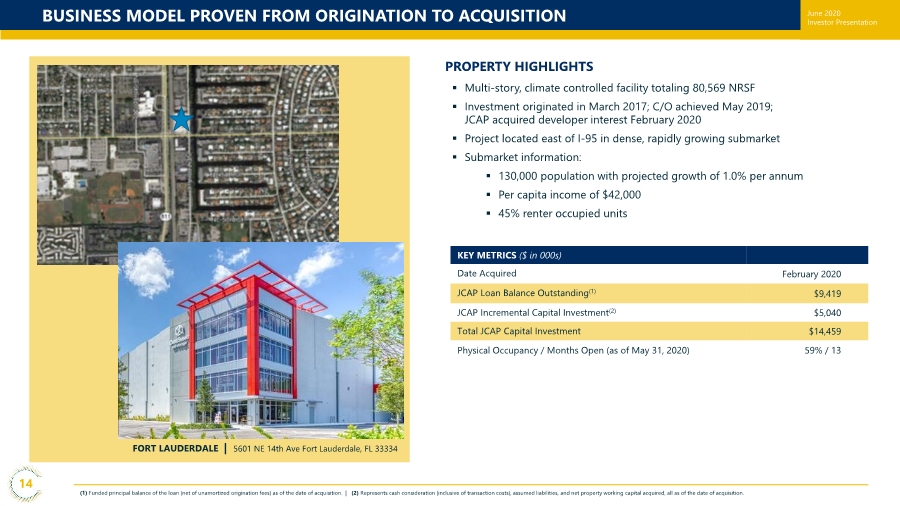
| June 2020 Investor Presentation BUSINESS MODEL PROVEN FROM ORIGINATION TO ACQUISITION (1) Funded principal balance of the loan (net of unamortized origination fees) as of the date of acquisition. | (2) Represents cash consideration (inclusive of transaction costs), assumed liabilities, and net property working capital acquired, all as of the date of acquisition. PROPERTY HIGHLIGHTS ▪ Multi-story, climate controlled facility totaling 80,569 NRSF ▪ Investment originated in March 2017; C/O achieved May 2019; JCAP acquired developer interest February 2020 ▪ Project located east of I-95 in dense, rapidly growing submarket ▪ Submarket information: ▪ 130,000 population with projected growth of 1.0% per annum ▪ Per capita income of $42,000 ▪ 45% renter occupied units KEY METRICS ($ in 000s) Date Acquired February 2020 JCAP Loan Balance Outstanding(1) $9,419 JCAP Incremental Capital Investment(2) $5,040 Total JCAP Capital Investment $14,459 Physical Occupancy / Months Open (as of May 31, 2020) 59% / 13 FORT LAUDERDALE | 5601 NE 14th Ave Fort Lauderdale, FL 33334 14 |
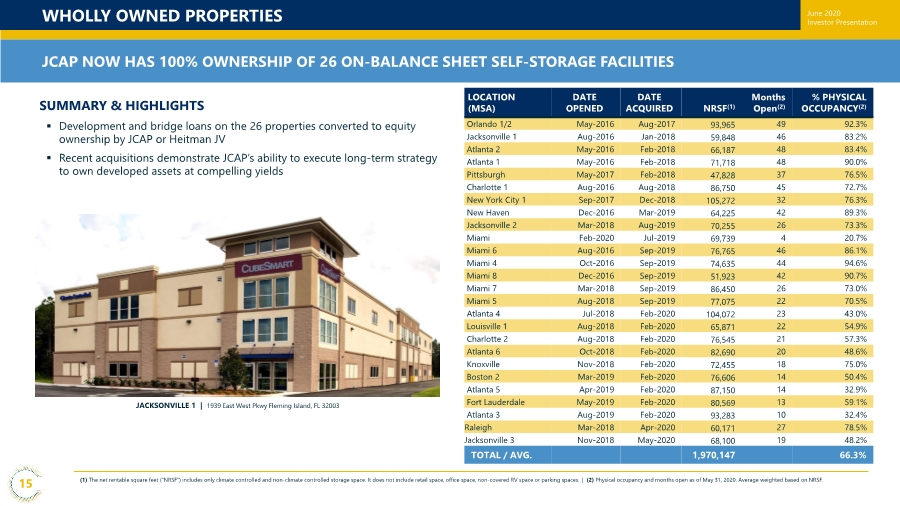
| June 2020 Investor Presentation SUMMARY & HIGHLIGHTS WHOLLY OWNED PROPERTIES (1) The net rentable square feet (“NRSF”) includes only climate controlled and non-climate controlled storage space. It does not include retail space, office space, non-covered RV space or parking spaces. | (2) Physical occupancy and months open as of May 31, 2020. Average weighted based on NRSF. ▪ Development and bridge loans on the 26 properties converted to equity ownership by JCAP or Heitman JV ▪ Recent acquisitions demonstrate JCAP’s ability to execute long-term strategy to own developed assets at compelling yields LOCATION (MSA) DATE OPENED DATE ACQUIRED NRSF(1) Months Open(2) % PHYSICAL OCCUPANCY(2) Orlando 1/2 May-2016 Aug-2017 93,965 49 92.3% Jacksonville 1 Aug-2016 Jan-2018 59,848 46 83.2% Atlanta 2 May-2016 Feb-2018 66,187 48 83.4% Atlanta 1 May-2016 Feb-2018 71,718 48 90.0% Pittsburgh May-2017 Feb-2018 47,828 37 76.5% Charlotte 1 Aug-2016 Aug-2018 86,750 45 72.7% New York City 1 Sep-2017 Dec-2018 105,272 32 76.3% New Haven Dec-2016 Mar-2019 64,225 42 89.3% Jacksonville 2 Mar-2018 Aug-2019 70,255 26 73.3% Miami Feb-2020 Jul-2019 69,739 4 20.7% Miami 6 Aug-2016 Sep-2019 76,765 46 86.1% Miami 4 Oct-2016 Sep-2019 74,635 44 94.6% Miami 8 Dec-2016 Sep-2019 51,923 42 90.7% Miami 7 Mar-2018 Sep-2019 86,450 26 73.0% Miami 5 Aug-2018 Sep-2019 77,075 22 70.5% Atlanta 4 Jul-2018 Feb-2020 104,072 23 43.0% Louisville 1 Aug-2018 Feb-2020 65,871 22 54.9% Charlotte 2 Aug-2018 Feb-2020 76,545 21 57.3% Atlanta 6 Oct-2018 Feb-2020 82,690 20 48.6% Knoxville Nov-2018 Feb-2020 72,455 18 75.0% Boston 2 Mar-2019 Feb-2020 76,606 14 50.4% Atlanta 5 Apr-2019 Feb-2020 87,150 14 32.9% Fort Lauderdale May-2019 Feb-2020 80,569 13 59.1% Atlanta 3 Aug-2019 Feb-2020 93,283 10 32.4% Raleigh Mar-2018 Apr-2020 60,171 27 78.5% Jacksonville 3 Nov-2018 May-2020 68,100 19 48.2% TOTAL / AVG. 1,970,147 66.3% 15 JCAP NOW HAS 100% OWNERSHIP OF 26 ON-BALANCE SHEET SELF-STORAGE FACILITIES JACKSONVILLE 1 | 1939 East West Pkwy Fleming Island, FL 32003 |
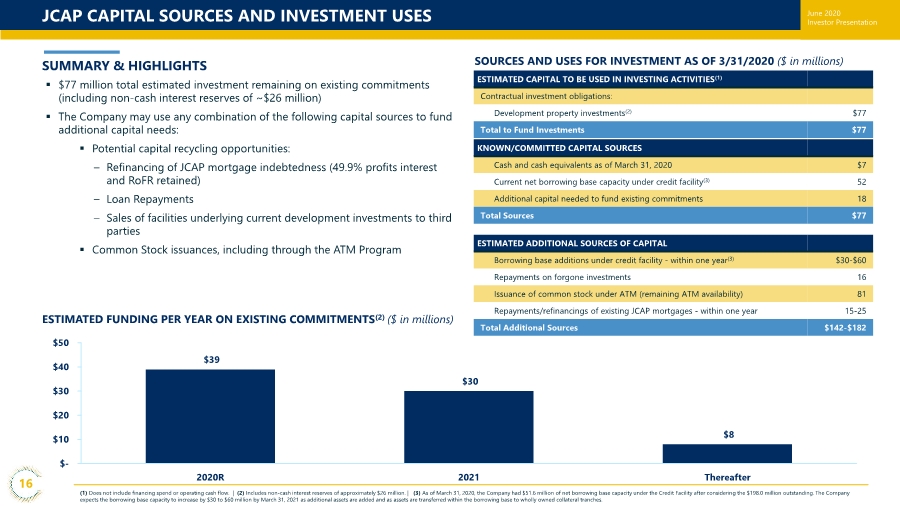
| June 2020 Investor Presentation JCAP CAPITAL SOURCES AND INVESTMENT USES (1) Does not include financing spend or operating cash flow. | (2) Includes non-cash interest reserves of approximately $26 million. | (3) As of March 31, 2020, the Company had $51.6 million of net borrowing base capacity under the Credit Facility after considering the $198.0 million outstanding. The Company expects the borrowing base capacity to increase by $30 to $60 million by March 31, 2021 as additional assets are added and as assets are transferred within the borrowing base to wholly owned collateral tranches. ▪ $77 million total estimated investment remaining on existing commitments (including non-cash interest reserves of ~$26 million) ▪ The Company may use any combination of the following capital sources to fund additional capital needs: ▪ Potential capital recycling opportunities: – Refinancing of JCAP mortgage indebtedness (49.9% profits interest and RoFR retained) – Loan Repayments – Sales of facilities underlying current development investments to third parties ▪ Common Stock issuances, including through the ATM Program SOURCES AND USES FOR INVESTMENT AS OF 3/31/2020 ($ in millions) ESTIMATED CAPITAL TO BE USED IN INVESTING ACTIVITIES(1) Contractual investment obligations: Development property investments(2) $77 Total to Fund Investments $77 KNOWN/COMMITTED CAPITAL SOURCES Cash and cash equivalents as of March 31, 2020 $7 Current net borrowing base capacity under credit facility(3) 52 Additional capital needed to fund existing commitments 18 Total Sources $77 16 ESTIMATED FUNDING PER YEAR ON EXISTING COMMITMENTS(2) ($ in millions) $39 $30 $8 $- $10 $20 $30 $40 $50 2020R 2021 Thereafter SUMMARY & HIGHLIGHTS ESTIMATED ADDITIONAL SOURCES OF CAPITAL Borrowing base additions under credit facility - within one year(3) $30-$60 Repayments on forgone investments 16 Issuance of common stock under ATM (remaining ATM availability) 81 Repayments/refinancings of existing JCAP mortgages - within one year 15-25 Total Additional Sources $142-$182 |
| June 2020 Investor Presentation CONTACT JERNIGAN CAPITAL JERNIGAN CAPITAL, INC investorrelations@jernigancapital.com 6410 Poplar Ave, Suite 650 Memphis, TN 38119 www.jernigancapital.com 17 |
| June 2020 Investor Presentation APPENDIX |
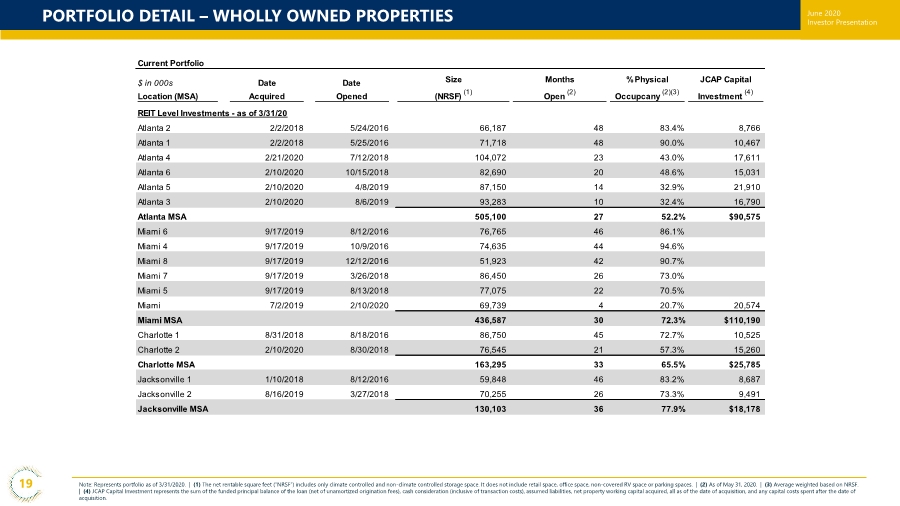
| June 2020 Investor Presentation PORTFOLIO DETAIL – WHOLLY OWNED PROPERTIES Note: Represents portfolio as of 3/31/2020. | (1) The net rentable square feet (“NRSF”) includes only climate controlled and non-climate controlled storage space. It does not include retail space, office space, non-covered RV space or parking spaces. | (2) As of May 31, 2020. | (3) Average weighted based on NRSF. | (4) JCAP Capital Investment represents the sum of the funded principal balance of the loan (net of unamortized origination fees), cash consideration (inclusive of transaction costs), assumed liabilities, net property working capital acquired, all as of the date of acquisition, and any capital costs spent after the date of acquisition. 19 Current Portfolio $ in 000s Location (MSA) Date Acquired Date Opened Size (NRSF) (1) Months Open (2) % Physical Occupcany (2)(3) JCAP Capital Investment (4) REIT Level Investments - as of 3/31/20 Atlanta 2 2/2/2018 5/24/2016 66,187 48 83.4% 8,766 Atlanta 1 2/2/2018 5/25/2016 71,718 48 90.0% 10,467 Atlanta 4 2/21/2020 7/12/2018 104,072 23 43.0% 17,611 Atlanta 6 2/10/2020 10/15/2018 82,690 20 48.6% 15,031 Atlanta 5 2/10/2020 4/8/2019 87,150 14 32.9% 21,910 Atlanta 3 2/10/2020 8/6/2019 93,283 10 32.4% 16,790 Atlanta MSA 505,100 27 52.2% $90,575 Miami 6 9/17/2019 8/12/2016 76,765 46 86.1% Miami 4 9/17/2019 10/9/2016 74,635 44 94.6% Miami 8 9/17/2019 12/12/2016 51,923 42 90.7% Miami 7 9/17/2019 3/26/2018 86,450 26 73.0% Miami 5 9/17/2019 8/13/2018 77,075 22 70.5% Miami 7/2/2019 2/10/2020 69,739 4 20.7% 20,574 Miami MSA 436,587 30 72.3% $110,190 Charlotte 1 8/31/2018 8/18/2016 86,750 45 72.7% 10,525 Charlotte 2 2/10/2020 8/30/2018 76,545 21 57.3% 15,260 Charlotte MSA 163,295 33 65.5% $25,785 Jacksonville 1 1/10/2018 8/12/2016 59,848 46 83.2% 8,687 Jacksonville 2 8/16/2019 3/27/2018 70,255 26 73.3% 9,491 Jacksonville MSA 130,103 36 77.9% $18,178 |
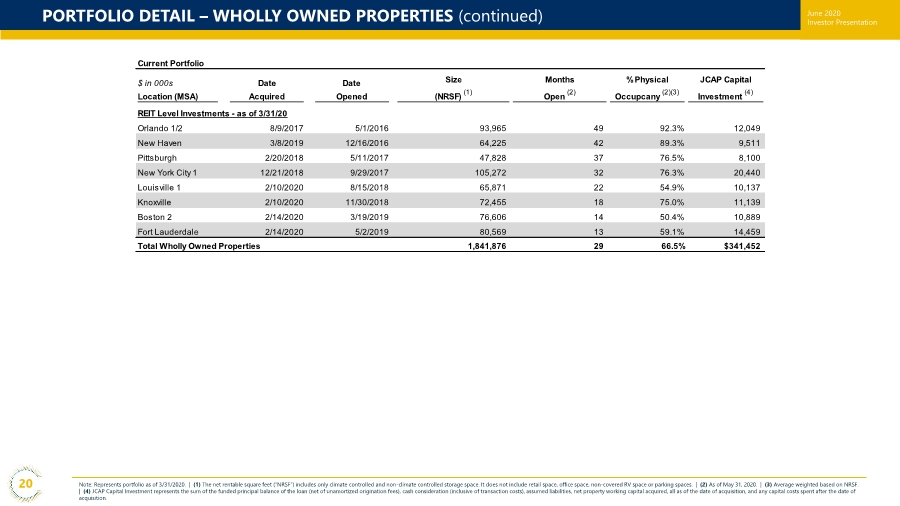
| June 2020 Investor Presentation PORTFOLIO DETAIL – WHOLLY OWNED PROPERTIES (continued) 20 Note: Represents portfolio as of 3/31/2020. | (1) The net rentable square feet (“NRSF”) includes only climate controlled and non-climate controlled storage space. It does not include retail space, office space, non-covered RV space or parking spaces. | (2) As of May 31, 2020. | (3) Average weighted based on NRSF. | (4) JCAP Capital Investment represents the sum of the funded principal balance of the loan (net of unamortized origination fees), cash consideration (inclusive of transaction costs), assumed liabilities, net property working capital acquired, all as of the date of acquisition, and any capital costs spent after the date of acquisition. Current Portfolio $ in 000s Location (MSA) Date Acquired Date Opened Size (NRSF) (1) Months Open (2) % Physical Occupcany (2)(3) JCAP Capital Investment (4) REIT Level Investments - as of 3/31/20 Orlando 1/2 8/9/2017 5/1/2016 93,965 49 92.3% 12,049 New Haven 3/8/2019 12/16/2016 64,225 42 89.3% 9,511 Pittsburgh 2/20/2018 5/11/2017 47,828 37 76.5% 8,100 New York City 1 12/21/2018 9/29/2017 105,272 32 76.3% 20,440 Louisville 1 2/10/2020 8/15/2018 65,871 22 54.9% 10,137 Knoxville 2/10/2020 11/30/2018 72,455 18 75.0% 11,139 Boston 2 2/14/2020 3/19/2019 76,606 14 50.4% 10,889 Fort Lauderdale 2/14/2020 5/2/2019 80,569 13 59.1% 14,459 Total Wholly Owned Properties 1,841,876 29 66.5% $341,452 |
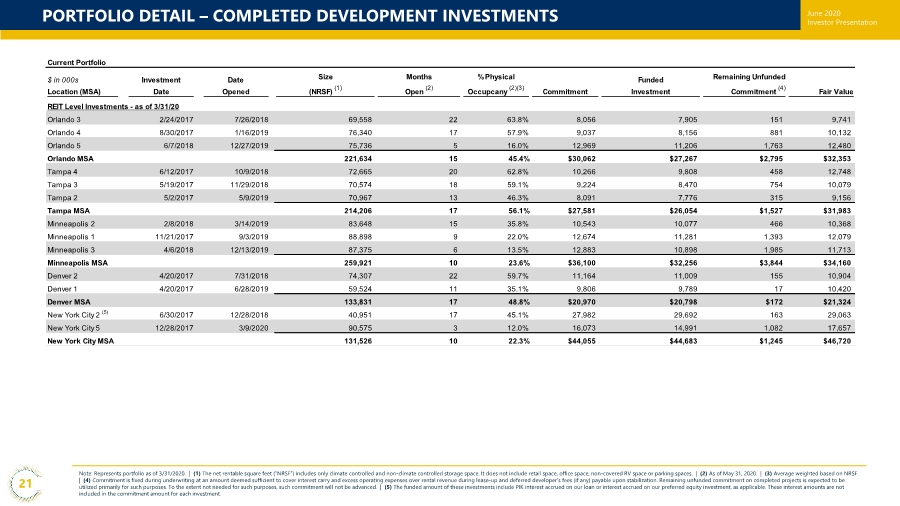
| June 2020 Investor Presentation PORTFOLIO DETAIL – COMPLETED DEVELOPMENT INVESTMENTS 21 Note: Represents portfolio as of 3/31/2020. | (1) The net rentable square feet (“NRSF”) includes only climate controlled and non-climate controlled storage space. It does not include retail space, office space, non-covered RV space or parking spaces. | (2) As of May 31, 2020. | (3) Average weighted based on NRSF. | (4) Commitment is fixed during underwriting at an amount deemed sufficient to cover interest carry and excess operating expenses over rental revenue during lease-up and deferred developer’s fees (if any) payable upon stabilization. Remaining unfunded commitment on completed projects is expected to be utilized primarily for such purposes. To the extent not needed for such purposes, such commitment will not be advanced. | (5) The funded amount of these investments include PIK interest accrued on our loan or interest accrued on our preferred equity investment, as applicable. These interest amounts are not included in the commitment amount for each investment. Current Portfolio $ in 000s Location (MSA) Investment Date Date Opened Size (NRSF) (1) Months Open (2) % Physical Occupcany (2)(3) Commitment Funded Investment Remaining Unfunded Commitment (4) Fair Value REIT Level Investments - as of 3/31/20 Orlando 3 2/24/2017 7/26/2018 69,558 22 63.8% 8,056 7,905 151 9,741 Orlando 4 8/30/2017 1/16/2019 76,340 17 57.9% 9,037 8,156 881 10,132 Orlando 5 6/7/2018 12/27/2019 75,736 5 16.0% 12,969 11,206 1,763 12,480 Orlando MSA 221,634 15 45.4% $30,062 $27,267 $2,795 $32,353 Tampa 4 6/12/2017 10/9/2018 72,665 20 62.8% 10,266 9,808 458 12,748 Tampa 3 5/19/2017 11/29/2018 70,574 18 59.1% 9,224 8,470 754 10,079 Tampa 2 5/2/2017 5/9/2019 70,967 13 46.3% 8,091 7,776 315 9,156 Tampa MSA 214,206 17 56.1% $27,581 $26,054 $1,527 $31,983 Minneapolis 2 2/8/2018 3/14/2019 83,648 15 35.8% 10,543 10,077 466 10,368 Minneapolis 1 11/21/2017 9/3/2019 88,898 9 22.0% 12,674 11,281 1,393 12,079 Minneapolis 3 4/6/2018 12/13/2019 87,375 6 13.5% 12,883 10,898 1,985 11,713 Minneapolis MSA 259,921 10 23.6% $36,100 $32,256 $3,844 $34,160 Denver 2 4/20/2017 7/31/2018 74,307 22 59.7% 11,164 11,009 155 10,904 Denver 1 4/20/2017 6/28/2019 59,524 11 35.1% 9,806 9,789 17 10,420 Denver MSA 133,831 17 48.8% $20,970 $20,798 $172 $21,324 New York City 2 (5) 6/30/2017 12/28/2018 40,951 17 45.1% 27,982 29,692 163 29,063 New York City 5 12/28/2017 3/9/2020 90,575 3 12.0% 16,073 14,991 1,082 17,657 New York City MSA 131,526 10 22.3% $44,055 $44,683 $1,245 $46,720 |
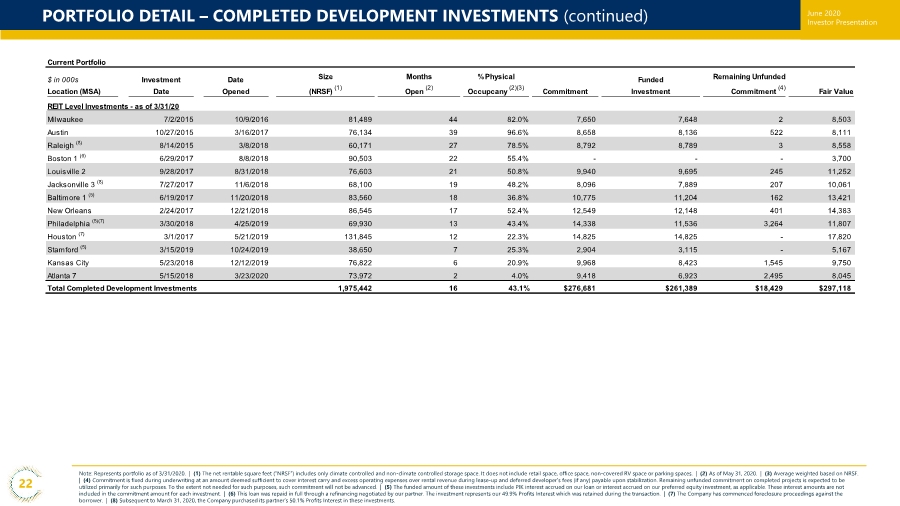
| June 2020 Investor Presentation PORTFOLIO DETAIL – COMPLETED DEVELOPMENT INVESTMENTS (continued) 22 Note: Represents portfolio as of 3/31/2020. | (1) The net rentable square feet (“NRSF”) includes only climate controlled and non-climate controlled storage space. It does not include retail space, office space, non-covered RV space or parking spaces. | (2) As of May 31, 2020. | (3) Average weighted based on NRSF. | (4) Commitment is fixed during underwriting at an amount deemed sufficient to cover interest carry and excess operating expenses over rental revenue during lease-up and deferred developer’s fees (if any) payable upon stabilization. Remaining unfunded commitment on completed projects is expected to be utilized primarily for such purposes. To the extent not needed for such purposes, such commitment will not be advanced. | (5) The funded amount of these investments include PIK interest accrued on our loan or interest accrued on our preferred equity investment, as applicable. These interest amounts are not included in the commitment amount for each investment. | (6) This loan was repaid in full through a refinancing negotiated by our partner. The investment represents our 49.9% Profits Interest which was retained during the transaction. | (7) The Company has commenced foreclosure proceedings against the borrower. | (8) Subsequent to March 31, 2020, the Company purchased its partner’s 50.1% Profits Interest in these investments. Current Portfolio $ in 000s Location (MSA) Investment Date Date Opened Size (NRSF) (1) Months Open (2) % Physical Occupcany (2)(3) Commitment Funded Investment Remaining Unfunded Commitment (4) Fair Value REIT Level Investments - as of 3/31/20 Milwaukee 7/2/2015 10/9/2016 81,489 44 82.0% 7,650 7,648 2 8,503 Austin 10/27/2015 3/16/2017 76,134 39 96.6% 8,658 8,136 522 8,111 Raleigh (8) 8/14/2015 3/8/2018 60,171 27 78.5% 8,792 8,789 3 8,558 Boston 1 (6) 6/29/2017 8/8/2018 90,503 22 55.4% - - - 3,700 Louisville 2 9/28/2017 8/31/2018 76,603 21 50.8% 9,940 9,695 245 11,252 Jacksonville 3 (8) 7/27/2017 11/6/2018 68,100 19 48.2% 8,096 7,889 207 10,061 Baltimore 1 (5) 6/19/2017 11/20/2018 83,560 18 36.8% 10,775 11,204 162 13,421 New Orleans 2/24/2017 12/21/2018 86,545 17 52.4% 12,549 12,148 401 14,383 Philadelphia (5)(7) 3/30/2018 4/25/2019 69,930 13 43.4% 14,338 11,536 3,264 11,807 Houston (7) 3/1/2017 5/21/2019 131,845 12 22.3% 14,825 14,825 - 17,820 Stamford (5) 3/15/2019 10/24/2019 38,650 7 25.3% 2,904 3,115 - 5,167 Kansas City 5/23/2018 12/12/2019 76,822 6 20.9% 9,968 8,423 1,545 9,750 Atlanta 7 5/15/2018 3/23/2020 73,972 2 4.0% 9,418 6,923 2,495 8,045 Total Completed Development Investments 1,975,442 16 43.1% $276,681 $261,389 $18,429 $297,118 |
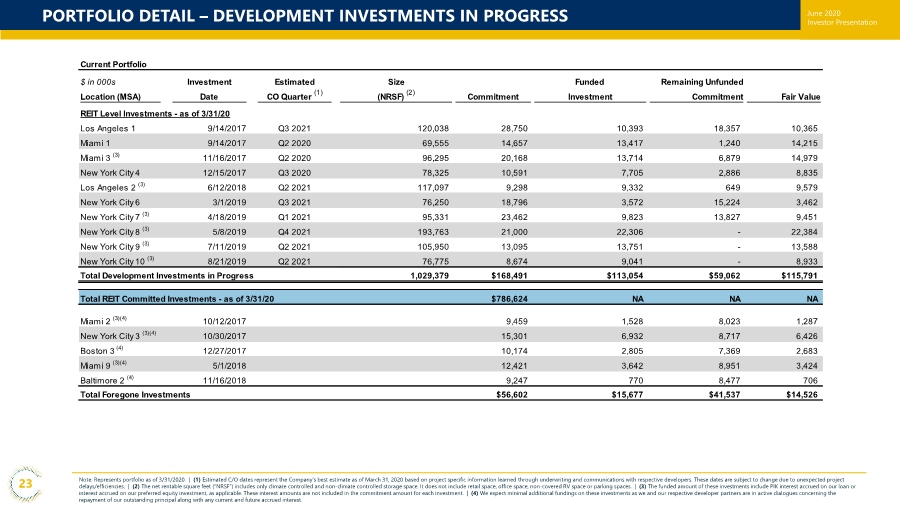
| June 2020 Investor Presentation PORTFOLIO DETAIL – DEVELOPMENT INVESTMENTS IN PROGRESS 23 Note: Represents portfolio as of 3/31/2020. | (1) Estimated C/O dates represent the Company’s best estimate as of March 31, 2020 based on project specific information learned through underwriting and communications with respective developers. These dates are subject to change due to unexpected project delays/efficiencies. | (2) The net rentable square feet (“NRSF”) includes only climate controlled and non-climate controlled storage space. It does not include retail space, office space, non-covered RV space or parking spaces. | (3) The funded amount of these investments include PIK interest accrued on our loan or interest accrued on our preferred equity investment, as applicable. These interest amounts are not included in the commitment amount for each investment. | (4) We expect minimal additional fundings on these investments as we and our respective developer partners are in active dialogues concerning the repayment of our outstanding principal along with any current and future accrued interest. Current Portfolio $ in 000s Investment Estimated Size Funded Remaining Unfunded Location (MSA) Date CO Quarter (1) (NRSF) (2) Commitment Investment Commitment Fair Value REIT Level Investments - as of 3/31/20 Los Angeles 1 9/14/2017 Q3 2021 120,038 28,750 10,393 18,357 10,365 Miami 1 9/14/2017 Q2 2020 69,555 14,657 13,417 1,240 14,215 Miami 3 (3) 11/16/2017 Q2 2020 96,295 20,168 13,714 6,879 14,979 New York City 4 12/15/2017 Q3 2020 78,325 10,591 7,705 2,886 8,835 Los Angeles 2 (3) 6/12/2018 Q2 2021 117,097 9,298 9,332 649 9,579 New York City 6 3/1/2019 Q3 2021 76,250 18,796 3,572 15,224 3,462 New York City 7 (3) 4/18/2019 Q1 2021 95,331 23,462 9,823 13,827 9,451 New York City 8 (3) 5/8/2019 Q4 2021 193,763 21,000 22,306 - 22,384 New York City 9 (3) 7/11/2019 Q2 2021 105,950 13,095 13,751 - 13,588 New York City 10 (3) 8/21/2019 Q2 2021 76,775 8,674 9,041 - 8,933 Total Development Investments in Progress 1,029,379 $168,491 $113,054 $59,062 $115,791 Total REIT Committed Investments - as of 3/31/20 $786,624 NA NA NA Miami 2 (3)(4) 10/12/2017 9,459 1,528 8,023 1,287 New York City 3 (3)(4) 10/30/2017 15,301 6,932 8,717 6,426 Boston 3 (4) 12/27/2017 10,174 2,805 7,369 2,683 Miami 9 (3)(4) 5/1/2018 12,421 3,642 8,951 3,424 Baltimore 2 (4) 11/16/2018 9,247 770 8,477 706 Total Foregone Investments $56,602 $15,677 $41,537 $14,526 |
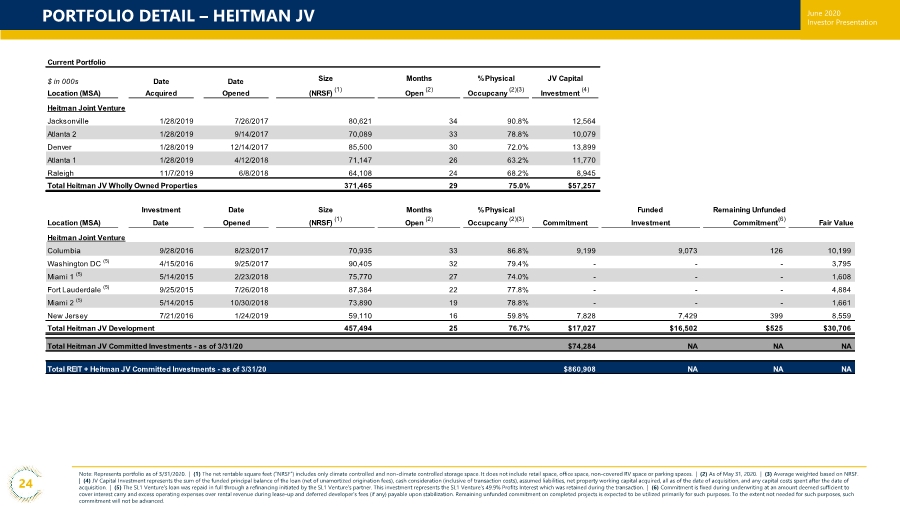
| June 2020 Investor Presentation PORTFOLIO DETAIL – HEITMAN JV 24 Note: Represents portfolio as of 3/31/2020. | (1) The net rentable square feet (“NRSF”) includes only climate controlled and non-climate controlled storage space. It does not include retail space, office space, non-covered RV space or parking spaces. | (2) As of May 31, 2020. | (3) Average weighted based on NRSF. | (4) JV Capital Investment represents the sum of the funded principal balance of the loan (net of unamortized origination fees), cash consideration (inclusive of transaction costs), assumed liabilities, net property working capital acquired, all as of the date of acquisition, and any capital costs spent after the date of acquisition. | (5) The SL1 Venture’s loan was repaid in full through a refinancing initiated by the SL1 Venture’s partner. This investment represents the SL1 Venture’s 49.9% Profits Interest which was retained during the transaction. | (6) Commitment is fixed during underwriting at an amount deemed sufficient to cover interest carry and excess operating expenses over rental revenue during lease-up and deferred developer’s fees (if any) payable upon stabilization. Remaining unfunded commitment on completed projects is expected to be utilized primarily for such purposes. To the extent not needed for such purposes, such commitment will not be advanced. Current Portfolio $ in 000s Location (MSA) Date Acquired Date Opened Size (NRSF) (1) Months Open (2) % Physical Occupcany (2)(3) JV Capital Investment (4) Heitman Joint Venture Jacksonville 1/28/2019 7/26/2017 80,621 34 90.8% 12,564 Atlanta 2 1/28/2019 9/14/2017 70,089 33 78.8% 10,079 Denver 1/28/2019 12/14/2017 85,500 30 72.0% 13,899 Atlanta 1 1/28/2019 4/12/2018 71,147 26 63.2% 11,770 Raleigh 11/7/2019 6/8/2018 64,108 24 68.2% 8,945 Total Heitman JV Wholly Owned Properties 371,465 29 75.0% $57,257 Investment Date Size Months % Physical Funded Remaining Unfunded Location (MSA) Date Opened (NRSF) (1) Open (2) Occupcany (2)(3) Commitment Investment Commitment(6) Fair Value Heitman Joint Venture Columbia 9/28/2016 8/23/2017 70,935 33 86.8% 9,199 9,073 126 10,199 Washington DC (5) 4/15/2016 9/25/2017 90,405 32 79.4% - - - 3,795 Miami 1 (5) 5/14/2015 2/23/2018 75,770 27 74.0% - - - 1,608 Fort Lauderdale (5) 9/25/2015 7/26/2018 87,384 22 77.8% - - - 4,884 Miami 2 (5) 5/14/2015 10/30/2018 73,890 19 78.8% - - - 1,661 New Jersey 7/21/2016 1/24/2019 59,110 16 59.8% 7,828 7,429 399 8,559 Total Heitman JV Development 457,494 25 76.7% $17,027 $16,502 $525 $30,706 Total Heitman JV Committed Investments - as of 3/31/20 $74,284 NA NA NA Total REIT + Heitman JV Committed Investments - as of 3/31/20 $860,908 NA NA NA |
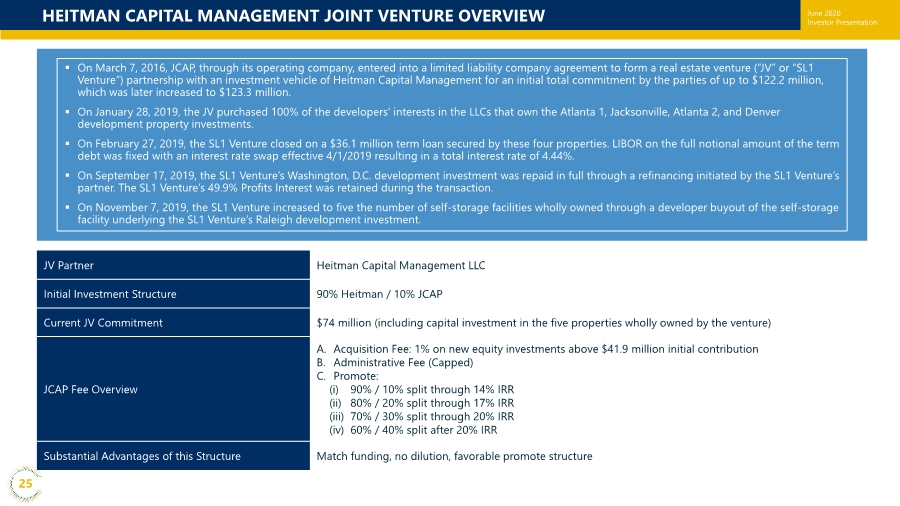
| June 2020 Investor Presentation HEITMAN CAPITAL MANAGEMENT JOINT VENTURE OVERVIEW JV Partner Heitman Capital Management LLC Initial Investment Structure 90% Heitman / 10% JCAP Current JV Commitment $74 million (including capital investment in the five properties wholly owned by the venture) JCAP Fee Overview A. Acquisition Fee: 1% on new equity investments above $41.9 million initial contribution B. Administrative Fee (Capped) C. Promote: (i) 90% / 10% split through 14% IRR (ii) 80% / 20% split through 17% IRR (iii) 70% / 30% split through 20% IRR (iv) 60% / 40% split after 20% IRR Substantial Advantages of this Structure Match funding, no dilution, favorable promote structure ▪ On March 7, 2016, JCAP, through its operating company, entered into a limited liability company agreement to form a real estate venture (“JV” or “SL1 Venture”) partnership with an investment vehicle of Heitman Capital Management for an initial total commitment by the parties of up to $122.2 million, which was later increased to $123.3 million. ▪ On January 28, 2019, the JV purchased 100% of the developers' interests in the LLCs that own the Atlanta 1, Jacksonville, Atlanta 2, and Denver development property investments. ▪ On February 27, 2019, the SL1 Venture closed on a $36.1 million term loan secured by these four properties. LIBOR on the full notional amount of the term debt was fixed with an interest rate swap effective 4/1/2019 resulting in a total interest rate of 4.44%. ▪ On September 17, 2019, the SL1 Venture’s Washington, D.C. development investment was repaid in full through a refinancing initiated by the SL1 Venture’s partner. The SL1 Venture’s 49.9% Profits Interest was retained during the transaction. ▪ On November 7, 2019, the SL1 Venture increased to five the number of self-storage facilities wholly owned through a developer buyout of the self-storage facility underlying the SL1 Venture’s Raleigh development investment. 25 |
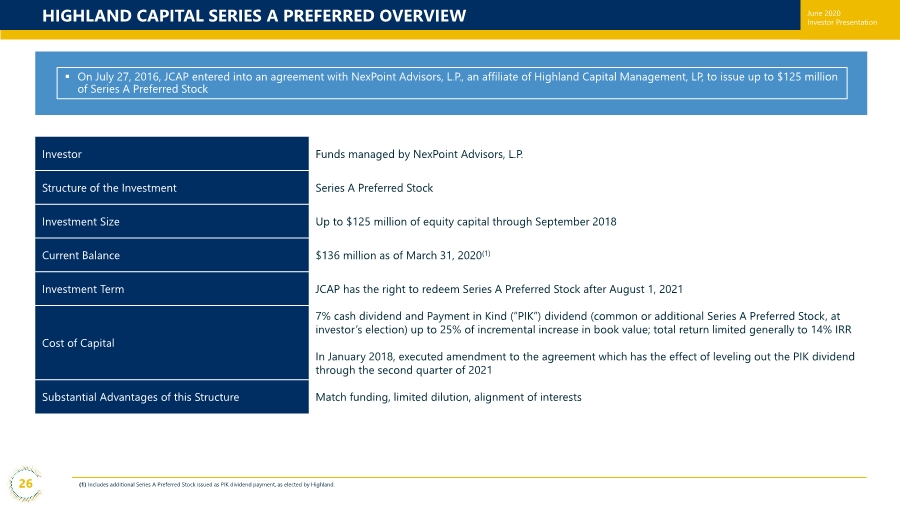
| June 2020 Investor Presentation HIGHLAND CAPITAL SERIES A PREFERRED OVERVIEW Investor Funds managed by NexPoint Advisors, L.P. Structure of the Investment Series A Preferred Stock Investment Size Up to $125 million of equity capital through September 2018 Current Balance $136 million as of March 31, 2020(1) Investment Term JCAP has the right to redeem Series A Preferred Stock after August 1, 2021 Cost of Capital 7% cash dividend and Payment in Kind (“PIK”) dividend (common or additional Series A Preferred Stock, at investor’s election) up to 25% of incremental increase in book value; total return limited generally to 14% IRR In January 2018, executed amendment to the agreement which has the effect of leveling out the PIK dividend through the second quarter of 2021 Substantial Advantages of this Structure Match funding, limited dilution, alignment of interests ▪ On July 27, 2016, JCAP entered into an agreement with NexPoint Advisors, L.P., an affiliate of Highland Capital Management, LP, to issue up to $125 million of Series A Preferred Stock 26 (1) Includes additional Series A Preferred Stock issued as PIK dividend payment, as elected by Highland. |
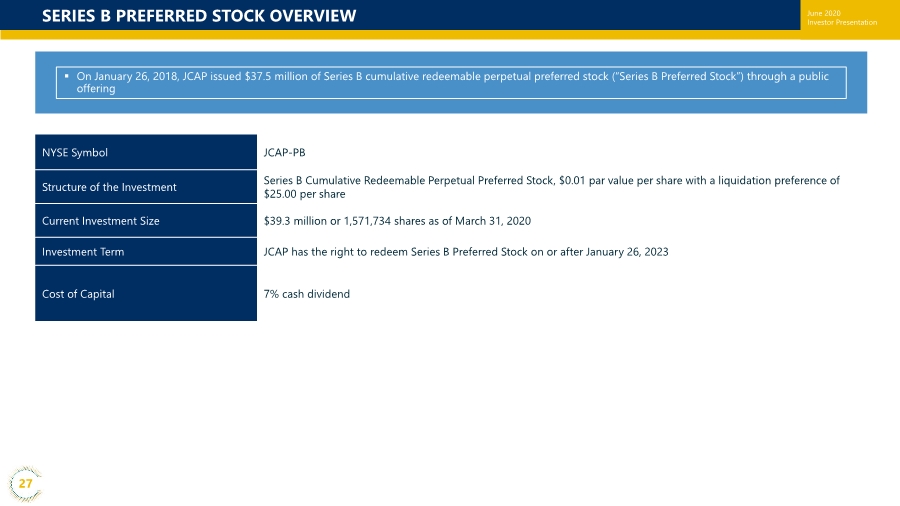
| June 2020 Investor Presentation SERIES B PREFERRED STOCK OVERVIEW NYSE Symbol JCAP-PB Structure of the Investment Series B Cumulative Redeemable Perpetual Preferred Stock, $0.01 par value per share with a liquidation preference of $25.00 per share Current Investment Size $39.3 million or 1,571,734 shares as of March 31, 2020 Investment Term JCAP has the right to redeem Series B Preferred Stock on or after January 26, 2023 Cost of Capital 7% cash dividend ▪ On January 26, 2018, JCAP issued $37.5 million of Series B cumulative redeemable perpetual preferred stock (“Series B Preferred Stock”) through a public offering 27 |
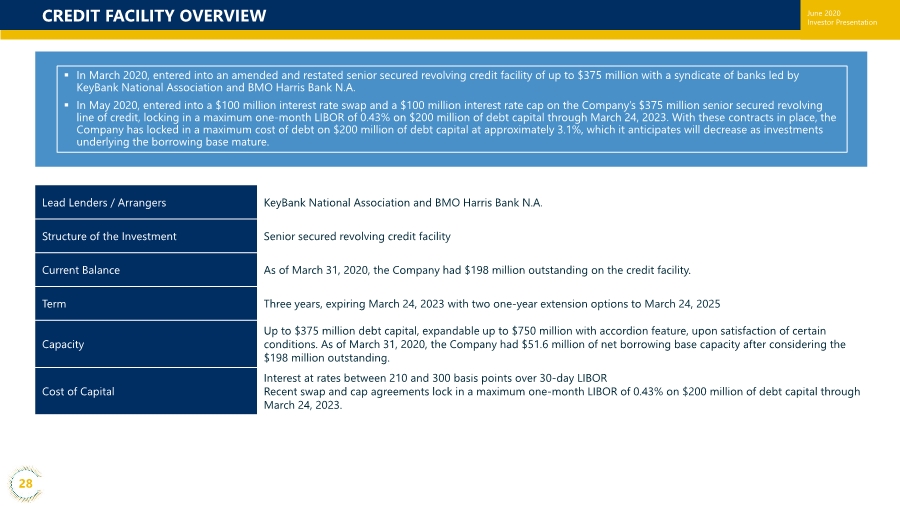
| June 2020 Investor Presentation CREDIT FACILITY OVERVIEW Lead Lenders / Arrangers KeyBank National Association and BMO Harris Bank N.A. Structure of the Investment Senior secured revolving credit facility Current Balance As of March 31, 2020, the Company had $198 million outstanding on the credit facility. Term Three years, expiring March 24, 2023 with two one-year extension options to March 24, 2025 Capacity Up to $375 million debt capital, expandable up to $750 million with accordion feature, upon satisfaction of certain conditions. As of March 31, 2020, the Company had $51.6 million of net borrowing base capacity after considering the $198 million outstanding. Cost of Capital Interest at rates between 210 and 300 basis points over 30-day LIBOR Recent swap and cap agreements lock in a maximum one-month LIBOR of 0.43% on $200 million of debt capital through March 24, 2023. ▪ In March 2020, entered into an amended and restated senior secured revolving credit facility of up to $375 million with a syndicate of banks led by KeyBank National Association and BMO Harris Bank N.A. ▪ In May 2020, entered into a $100 million interest rate swap and a $100 million interest rate cap on the Company’s $375 million senior secured revolving line of credit, locking in a maximum one-month LIBOR of 0.43% on $200 million of debt capital through March 24, 2023. With these contracts in place, the Company has locked in a maximum cost of debt on $200 million of debt capital at approximately 3.1%, which it anticipates will decrease as investments underlying the borrowing base mature. 28 |
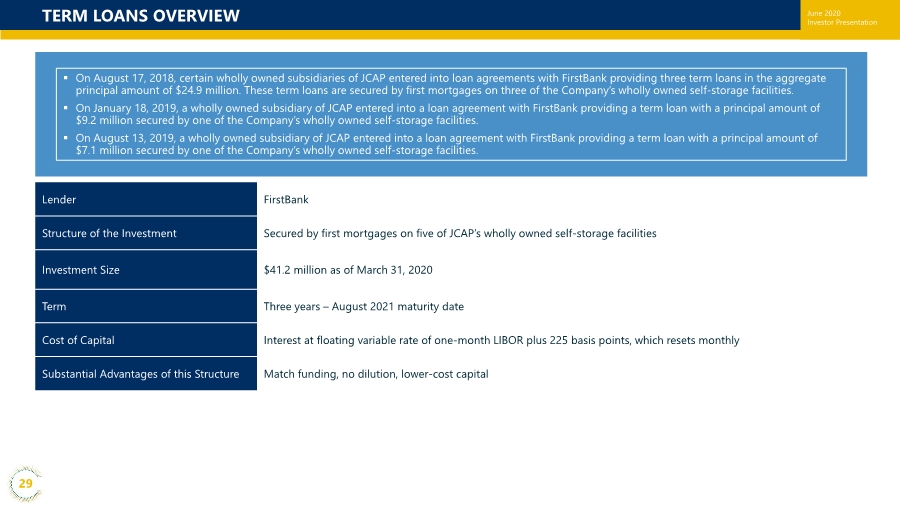
| June 2020 Investor Presentation TERM LOANS OVERVIEW Lender FirstBank Structure of the Investment Secured by first mortgages on five of JCAP’s wholly owned self-storage facilities Investment Size $41.2 million as of March 31, 2020 Term Three years – August 2021 maturity date Cost of Capital Interest at floating variable rate of one-month LIBOR plus 225 basis points, which resets monthly Substantial Advantages of this Structure Match funding, no dilution, lower-cost capital ▪ On August 17, 2018, certain wholly owned subsidiaries of JCAP entered into loan agreements with FirstBank providing three term loans in the aggregate principal amount of $24.9 million. These term loans are secured by first mortgages on three of the Company’s wholly owned self-storage facilities. ▪ On January 18, 2019, a wholly owned subsidiary of JCAP entered into a loan agreement with FirstBank providing a term loan with a principal amount of $9.2 million secured by one of the Company’s wholly owned self-storage facilities. ▪ On August 13, 2019, a wholly owned subsidiary of JCAP entered into a loan agreement with FirstBank providing a term loan with a principal amount of $7.1 million secured by one of the Company’s wholly owned self-storage facilities. 29 |

