Attached files
| file | filename |
|---|---|
| 8-K - FORM 8-K - Hillenbrand, Inc. | tm2021465-1_8k.htm |
Exhibit 99.1

INVESTOR PRESENTATION June 2020

INVESTOR PRESENTATION | \ 2 Hillenbrand Participants APRIL 2020 INVESTOR PRESENTATION | Joe Raver President & Chief Executive Officer Kristina Cerniglia Senior Vice President & Chief Financial Officer

INVESTOR PRESENTATION | 3 Cautionary Statements Throughout this presentation, we make a number of “forward - looking statements” within the meaning of Section 27A of the Securities Act of 1944, as amended (the “Securities Act”), Section 21E of the Securities Exchange Act of 1934, as amended and the Private Securities Litigation Reform Act of 1995 and that are intended to be covered by the safe harbor provided under these sections . As the words imply, these are statements about future sales, earnings, cash flow, results of operations, uses of cash, financings, share repurchases, ability to meet delevering goals, and other measures of financial performance or potential future plans or events , strategies, objectives, beliefs, prospects, assumptions, expectations and projected costs or savings or transactions of the Company that might or might not happen in the future, as contrasted with historical information. Forward - looking statements are based on assumptions that we believe are reasonable, but by their very na ture are subject to a wide range of risks. If our assumptions prove inaccurate or unknown risks and uncertainties materialize, actual results could vary materially from Hillenbrand’s (the “Company”) expectations and pr ojections. Words that could indicate that we are making forward - looking statements include the following and similar expressions in connection with any discussion of the timing or nature of future operating or financial performance : intend believe plan expect may goal would project become pursue estimate will forecast continue could anticipate target impact promise improve progress potential should encourage This is not an exhaustive list but is intended to give you an idea of how we try to identify forward - looking statements. The abs ence of any of these words, however, does not mean that the statement is not forward - looking. Here is the key point : Forward - looking statements are not guarantees of future performance or events, and our actual results or events could differ materially from those set forth in any forward - looking statements. Any number of factors, many of which are beyond our control, could cause our performance to differ significantly from what is des cri bed in the forward - looking statements. These factors include, but are not limited to: the impact of contagious diseases such as the COVID - 19 pandemic and the societal, governmental, and individual responses thereto, including supply chain disruptions, loss of contracts and/or customers, erosion of some customers’ credit quality, closure or temporary interruption of the Company’s or suppliers’ manufacturing facilities, travel, shipping a nd logistical disruptions, loss of human capital or personnel, and general economic calamities that could result in an extended shutdown or reduction of our operations, substantially reduced sales volumes, or supply constraints ; risks that the integration of Milacron or any other integration, acquisition, or disposition activity disrupts current operations or poses potential difficulties in employee retention or otherwise affects financial or operating re sults; the ability to recognize the benefits of the acquisition of Milacron or any other acquisition or disposition, including potential synergies and cost savings or the failure of the Company or any acquired company to achieve its plans and objectives generally; global market and economic conditions, including those related to the credit markets; volatility of our investment portfolio; adverse foreign currency fluctuations; involvement in claims, law suits and governmental proceedings related to operations; the outcome of any legal proceedings that may be instituted against the Company, or any companies we may acquire; our reliance upon employees, agents, and business partners to comply with laws in many countries and jurisdictions; labor disrupt ion s; the impact of the additional indebtedness that the Company has incurred in connection with the acquisition of Milacron and the ab ili ty of the Company to comply with financial or other covenants in its debt agreements or meet its de - leveraging goals; the dependence of our business units on relationships with several large providers; increased costs or unavailability of raw materials or certain outsourced services; continued fluctuations in mortality rates and increased cremations; competition in the industries in which we operate, including from nontraditional sources in t he death care industry; our level of international sales and operations; cyclical demand for industrial capital goods; impacts of decreases in demand or changes in technological advances, laws, or regulation on the revenues that we derive from the plastics industry; certain tax - related matters; and changes to legislation, regulation, treaties or government policy, including any resulting from the current political environment. Shareholders, potential investors and other readers are urged to consider these risks and uncertainties in evaluating forward - looking statements and are cautioned not to place undue reliance on the forward - looking statements. For a more in - depth discussion of these and other factors that could cause actual results to differ materially from those contained in forward - looking statements, see the discussions under the heading “Risk Factors” in Part I, Item 1A of Hillen brand’s Form 10 - K for the year ended September 30, 2019, filed with the Securities and Exchange Commission (“SEC”) on November 13, 2019, and in Part II, Item 1A of Hillenbrand’s Form 10 - Q for the quarter ended March 31, 2020, filed with the SEC on May 6, 2020, and other written statements made by the Company from time to time . The forward - looking information in this presentation speaks only as of the date hereof, and we assume no obligation to update or revise any forward - looking information.

INVESTOR PRESENTATION | 4 Cautionary Statements (Cont’d) Market and Industry Data This presentation also includes market and industry data that the Company has obtained from market research, publicly available information and industry publications. The accuracy and completeness of s uch information are not guaranteed. Such data is often based on industry surveys and preparers’ experience in the industry. Simil arl y, although the Company believes that the surveys and market research that others have performed are reliable, such surveys and market research are subject to assumptions, estimates and other uncertainties and the Company has not independently verified this information. No Offer or Solicitation This presentation is confidential and is for your information only and is not intended to be used by anyone other than you. T his presentation shall not constitute an offer to sell or the solicitation of an offer to buy any securities, nor shall there be any sale of securities in any jurisdiction in which such offer, solicitation or sale would be unl awful prior to registration or qualification under the securities laws of any such jurisdiction. No offering of securities shall be made except by means of a prospectus meeting the requirements of Section 10 of the Securities Ac t, or pursuant to another available exemption. Non - GAAP Financial Measures This presentation contains certain supplemental non - GAAP financial measures. While the Company believes that non - GAAP financial measures are helpful in evaluating its operating performance, the use of non - GAAP financial measures in this presentation should not be considered in isolation from, or as an alternative for, a measure of fi nan cial or operating performance as defined by GAAP. You are cautioned that there are inherent limitations associated with the use of each of these supplemental non - GAAP financial measures as an analytical tool. Additionall y, the Company’s computation of non - GAAP financial measures may not be comparable to those reported by other companies in its industry. You can find reconciliations of the non GAAP financial measures used in th is presentation to the most directly comparable GAAP financial measures, to the extent available without unreasonable efforts, in the appendix of this presentation. Pro Forma Financial Measures This presentation contains certain financial results that reflect M ilacron 's results of operations in a number of scenarios. Actual results include M ilacron from the date the a cquisition closed on November 21, 2019 . Pro forma results give effect to the acquisition as if it had been completed as of the earliest date of the period reported. The Com pany’s Cimcool business (“ Cimcool ”) , which represented approximately 4 % of Hillenbrand 's adjusted EBITDA for the quarter ended March 31, 2020, is not included. On March 30, 2020, the Company completed the sale of Cimcool. In certain instances, including slides 22 and 38, of this presentation, Milacron pro forma results are presented for periods ended December 31, for 2018 and 2017 fiscal year - end, while Milacron pro forma resul ts are presented for the period ended September 30, for 2019 fiscal year - end. As a result, in these instances the Milacron results for the fourth quarter of 2018 are reflected in both the 2018 and 2019 fiscal ye ar - end financial results. In calculating the pro forma figures included in this presentation, the Company completed calculations generally consistent with th e pro forma presentation previously incorporated by reference into their Current Report on Form 8 - K filed on November 21, 2019.

INVESTOR PRESENTATION | Key Takeaways - Milacron Hillenbrand Overview & Strategy - Process Equipment Group 1 6 - Batesville 5 4 16 2 8 3 12 Agenda 25 Financial Policy and Performance COVID - 19 Update Capitalization Overview 8 7 6 29 34 43 Key Takeaways & Closing Remarks 9 Appendix 10 45 47 5

INVESTOR PRESENTATION | KEY TAKEAWAYS 6

INVESTOR PRESENTATION | Key Takeaways 01 02 03 04 05 06 Significant Strides Transforming Hillenbrand into a Global Diversified Industrial Company Market Leadership Driven by Highly - Engineered Products with Core Technologies Differentiated by Applications Expertise The Hillenbrand Operating Model (HOM) is a Competitive Differentiator; Historically Focused on Margin Expansion and Now Adding Tools to Drive Profitable Growth Focused on Building Platforms to Develop Scale and Enhance Leadership Positions to Drive Profitable Growth; Integrating Milacron is a Key Priority Strong Free Cash Flow With Focus on Paying Down Debt Post - Milacron Acquisition; Temporarily Lowering Priority of M&A and Share Repurchases Passionate Leadership Team Driving Transformation with Runway for Significant Shareholder Value Creation 7

INVESTOR PRESENTATION | HILLENBRAND OVERVIEW & STRATEGY 8
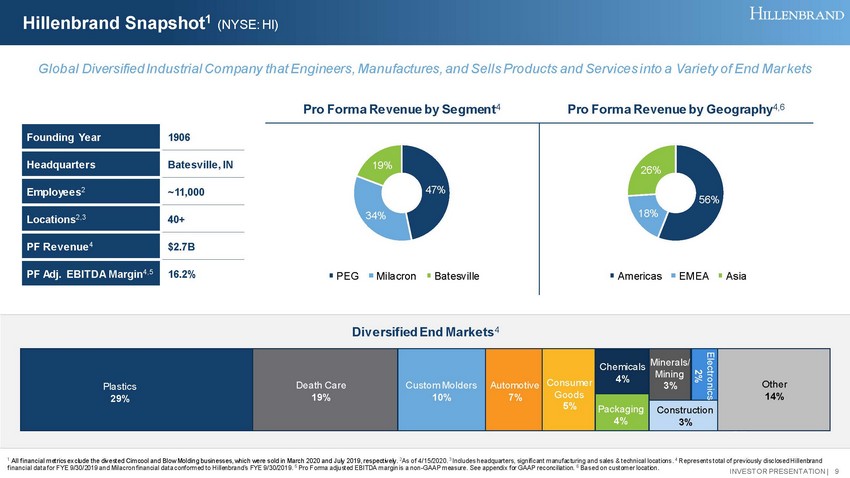
INVESTOR PRESENTATION | Hillenbrand Snapshot 1 (NYSE: HI) 1 All financial metrics exclude the divested Cimcool and Blow Molding businesses, which were sold in March 2020 and July 2019, respectively. 2 As of 4/15/2020. 3 Includes headquarters, significant manufacturing and sales & technical locations . 4 Represents total of previously disclosed Hillenbrand financial data for FYE 9/30/2019 and Milacron financial data conformed to Hillenbrand’s FYE 9/30/2019. 5 Pro Forma a djusted EBITDA margin is a non - GAAP measure. See appendix for GAAP reconciliation. 6 Based on customer location. Diversified End Markets 4 Plastics 26% Death Care 18% Custom Molders 12% Automotive 7% Consumer Goods 6% Chemicals 4% Minerals/ Mining 3% Global Diversified Industrial Company that Engineers, Manufactures, and Sells Products and Services into a Variety of End Mar ket s Founding Year 1906 Headquarters Batesville, IN Employees 2 ~11,000 Locations 2,3 40+ PF Revenue 4 $2.7B PF Adj . EBITDA Margin 4,5 16.2% Pro Forma Revenue by Geography 4 ,6 56% 18% 26% Americas EMEA Asia Pro Forma Revenue by Segment 4 47% 34% 19% PEG Milacron Batesville Plastics 29% Death Care 19% Other 14% Custom Molders 10% Automotive 7% Consumer Goods 5 % Chemicals 4% Minerals/ Mining 3 % Packaging 4% Electronics 2 % Construction 3% 9

INVESTOR PRESENTATION | Adapting Our Strategy for the Current Environment Seasoned Management Team Balancing Near - term Priorities with Unwavering Focus on Long - term Strengthen and Build Platforms Organically and through M&A Emerging capabilities in products and recycling Leverage Batesville for Cash Counterbalance to PEG and Milacron with stable cash flow Build Scalable Foundation Utilizing Hillenbrand Operating Model (HOM) Opportunity to roll out HOM across Milacron businesses Effectively Deploy Strong Free Cash Flow Selectively investing to capture market share when demand returns HIGHLIGHTS x Focus in niche markets, specifically plastics and chemicals, food and pharma, and separation x Expanded product offering via acquisition of Milacron x In the 2015 / 2016 Industrial Recession, PEG margin expanded ~250 basis points 1 1 Represents Adjusted EBITDA margin expansion from FY 2014 – FY 2016. 10

INVESTOR PRESENTATION | Hillenbrand Operating Model: A Competitive Advantage Have Realized Benefits but Significant Opportunity Ahead of Us UNDERSTAND THE BUSINESS FOCUS ON THE CRITICAL FEW GROW: GET BIGGER AND BETTER Consistent and Repeatable Framework Designed to Produce Efficient Processes and Drive Profitable Growth and Superior Value 11
INVESTOR PRESENTATION | PROCESS EQUIPMENT GROUP 12

INVESTOR PRESENTATION | Revenue by End - Market 1 Revenue by Geography 1,2 Aftermarket Exposure 1 Performance ($M) Order Backlog ($M) 4 $609 $618 16.7% 17.6% 0% 5% 10% 15% 20% 25% 30% 35% $0 $200 $400 $600 $800 $1,000 $1,200 YTD Mar'19 YTD Mar'20 Revenue Adj. EBITDA Margin $632 $815 $864 $982 $500 $700 $900 $1,100 $1,300 FY 17 FY 18 FY 19 Mar'20 Process Equipment Group at a Glance Hillenbrand Operating Model Drives Strong Profit Margin and Free Cash Flow 1 Based on FY 2019 sales. 2 Based on customer location. 3. Adjusted EBITDA Margin is a non - GAAP measure. See appendix for GAAP reconciliation . 4 See appendix for discussion of calculation of backlog. 39% 27% 34% Americas EMEA Asia 62% 9% 6% 6% 3% 14% Plastics Chemicals Minerals & Mining Food &Pharma Water & Wastewater Other $1,028 $1,220 $1,274 17.3% 17.7% 17.5% 0% 5% 10% 15% 20% 25% 30% 35% $0 $200 $400 $600 $800 $1,000 $1,200 FY 17 FY 18 FY 19 3 68% 32% Capital Equipment Aftermarket Parts & Services 13

INVESTOR PRESENTATION | Diverse Brands with Significant Scale in Plastics PRODUCT PORTFOLIO Products: • Compounders and extruders • Material handling equipment • Feeders, components, and system solutions • Parts & service Separation Products: • Screening equipment • Sizing equipment • Parts & service Flow Control Products: • Pumping solutions • Highly - engineered valves • Parts & service Size Reduction Products: • Crushers • Material handling equipment • Parts & service END MARKETS • Polyolefins • Engineered Plastics • Chemicals • Processed Food & Pharma • Minerals & Fertilizers • Food & Agriculture • Proppants • Municipal Water and Wastewater • Industrial Water and Wastewater • Coal Power & Mining • Forest Products • Steel PORTION OF PEG REVENUE 1 1 Based on FY 2019 sales. PORTION OF PEG REVENUE 1 END MARKETS PRODUCT PORTFOLIO SELECT PEG CUSTOMERS 14
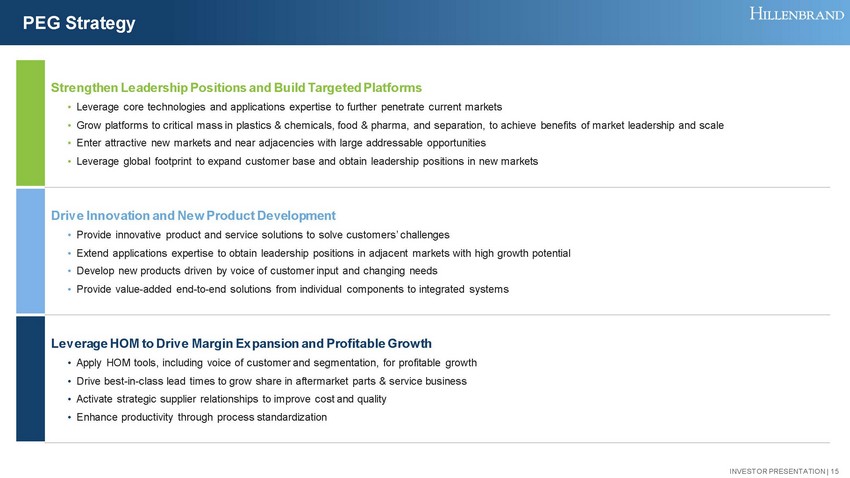
INVESTOR PRESENTATION | PEG Strategy Strengthen Leadership Positions and Build Targeted Platforms • Leverage core technologies and applications expertise to further penetrate current markets • Grow platforms to critical mass in plastics & chemicals, food & pharma, and separation, to achieve benefits of market leaders hip and scale • Enter attractive new markets and near adjacencies with large addressable opportunities • Leverage global footprint to expand customer base and obtain leadership positions in new markets Drive Innovation and New Product Development • Provide innovative product and service solutions to solve customers’ challenges • Extend applications expertise to obtain leadership positions in adjacent markets with high growth potential • Develop new products driven by voice of customer input and changing needs • Provide value - added end - to - end solutions from individual components to integrated systems Leverage HOM to Drive Margin Expansion and Profitable Growth • Apply HOM tools, including voice of customer and segmentation, for profitable growth • Drive best - in - class lead times to grow share in aftermarket parts & service business • Activate strategic supplier relationships to improve cost and quality • Enhance productivity through process standardization 15

INVESTOR PRESENTATION | MILACRON 16

INVESTOR PRESENTATION | Acquisition of Milacron Transaction Overview Milacron Segment Overview 1 • Leader in manufacturing, distribution and service of highly engineered and customized plastic and fluid technologies and processing systems • Strong market positions and industry - leading brands ‒ Melt Delivery & Control Systems : #2 in premium hot runners globally (#1 in Americas, #1 in Europe, #2 in Asia) ‒ Advanced Plastics Processing Technologies: • Equipment: Full line supplier of injection and extrusion equipment (#1 in North America, #1 in India) • Aftermarket: Top global supplier to installed machine base ‒ Fluids Technologies : Global manufacturer of products used in metalworking processes $940M $182M FY ’19 PF Revenue FY’19 PF Adj. EBITDA 2 ~19.4% ~ 5,000 FY’19 PF Adj . EBITDA Margin 2 Employees Timing • Transaction closed November 21, 2019 Terms • Deal valued at ~$1.9B, including repayment of Milacron's outstanding debt • Milacron stockholders received $11.80 in cash and 0.1612 Hillenbrand shares per Milacron share • Milacron stockholders owned ~16% of Hillenbrand's outstanding shares on an immediately post - close basis Financial Details • Targeting to achieve annualized, run - rate cost synergies of ~$50M within three years 3 • Targeting ~$20 - 25M of cost synergies within the first 12 months post - closing 3 • Completed the sale of the Cimcool business (legacy Fluids Technologies segment of Milacron) on March 30, 2020 in a transaction valued at ~$224M Sold in March 2020 1 2019 financial metrics exclude the divested Cimcool and Blow Molding businesses and corporate expenses, and is based on Milacron segment financial data for the twelve months ended September 30, 2019. 2 Adjusted EBITDA and adjusted EBITDA margin are non - GAAP measures. See appendix for GAAP reconciliation. 3 There can be no guarantee that we will achieve any target or consideration on a specific timeframe or at all. 17

INVESTOR PRESENTATION | Acquisition of Milacron Provides Compelling Strategic and Financial Benefits A Transformative Deal to Create Meaningful Shareholder Value A pivotal step in Hillenbrand's vision to become a world - class global diversified industrial company Enhances Growth Opportunities with Leading Brands and New Technologies Adds Complementary Businesses; Increases Scale and Diversification Creates and Drives Efficiencies with Significant Cost Synergies Delivers Strong Financial Benefits Including Potential for Significant Recurring Revenue, EPS and Margin Accretion 18

INVESTOR PRESENTATION | Macro Trends Support Long - Term Sustained Growth for Durable Plastics Electronics Consumer Goods Automotive Packaging Eco - friendly Medical Construction Superior quality, shorter product lifecycles, and design flexibility Shortened product lifecycles, innovation in multi - material products, design flexibility Vehicle light - weighting Increased freshness, extended shelf life, and product visibility Bio Resin and recycled materials Conversion to plastic for safety and disposability Shift to plastics for durability, light weight and low maintenance Diverse, Long - Term Drivers Secular Trends x Demand for products driven by strong secular trends, including a growing middle class x Automotive increased use of lightweight plastics to improve fuel efficiency x Packaging in emerging markets to improve food shelf life, freshness, and safety x Medical applications focus on safety, improved drug and therapy delivery, as well as durability x Construction ongoing shift to plastics that are more durable, lightweight and require little maintenance x Increased desire for eco - friendly innovations in the use of plastics and base materials 19
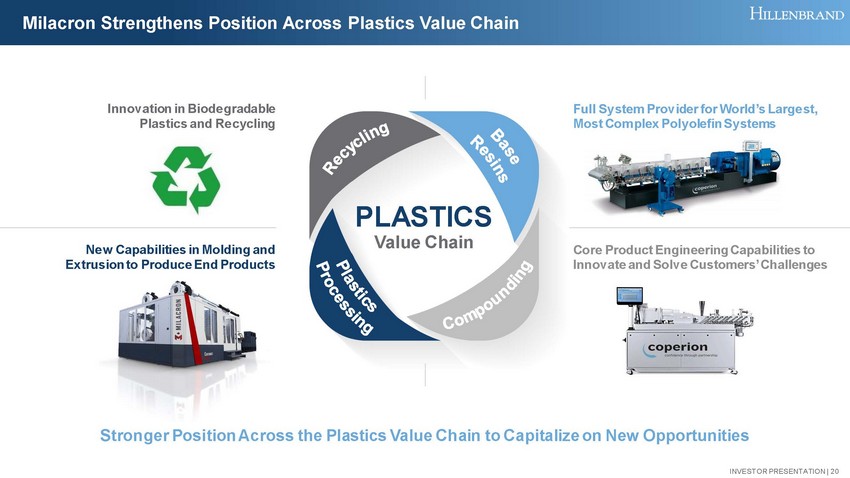
INVESTOR PRESENTATION | Milacron Strengthens Position Across Plastics Value Chain Stronger Position Across the Plastics Value Chain to Capitalize on New Opportunities Innovation in Biodegradable Plastics and Recycling New Capabilities in Molding and Extrusion to Produce End Products Full System Provider for World’s Largest, Most Complex Polyolefin Systems Core Product Engineering Capabilities to Innovate and Solve Customers’ Challenges PLASTICS Value Chain 20

INVESTOR PRESENTATION | Significant Catalysts and Opportunities of the Combined Company Installed Base & Aftermarket Diverse Portfolio; Underpenetrated Aftermarket Technology Acceleration Driven by Disruptive Technology and Innovation Scalable Foundations Continuously Improving Efficiency x Large installed base of machines globally x Close to the customer in every region x Using installed base analytics to focus efforts on specific growth markets x Driving life cycle approach; mix of reactive/proactive maintenance, targeted upgrade packages x Strong intellectual property portfolio x Highly engineered solutions x Industry leading service support to create the best customer experience through the life of the equipment x Specialized engineers per market segment x Application experts support sales with tech solutions x India Center of Excellence / Shared Services x Employee cost advantage x Engineering and Finance/IT service center currently segregated by business using common systems and tools x New facility with room to grow 21
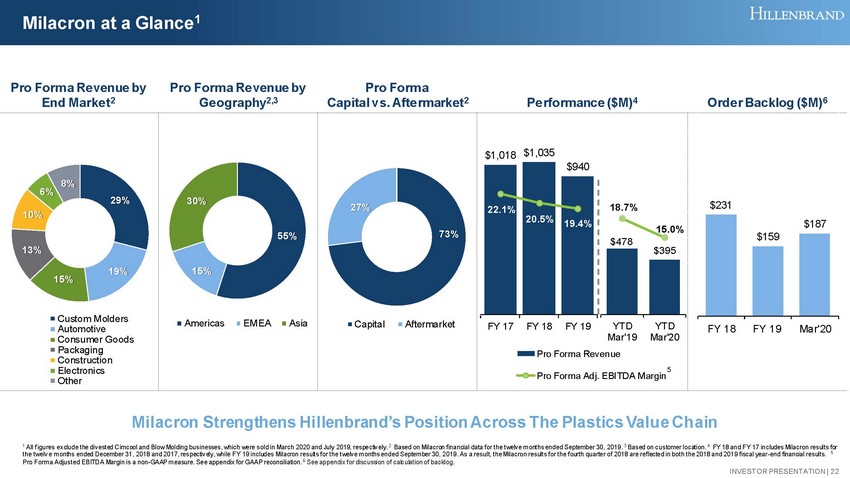
INVESTOR PRESENTATION | Pro Forma Revenue by End Market 2 Pro Forma Revenue by Geography 2,3 Pro Forma Capital vs. Aftermarket 2 Performance ($M) 4 O rder Backlog ($M) 6 Milacron at a Glance 1 Milacron Strengthens Hillenbrand’s Position Across The Plastics Value Chain 1 All figures exclude the divested Cimcool and Blow Molding businesses, which were sold in March 2020 and July 2019, respectively. 2 Based on Milacron financial data for the twelve months ended September 30, 2019 . 3 Based on customer location . 4 FY 18 and FY 17 includes Milacron results for the twelve months ended December 31, 2018 and 2017, respectively, while FY 19 includes Milacron results for the twelve months ended September 30, 2019 . As a result, the Milacron results for the fourth quarter of 2018 are reflected in both the 2018 and 2019 fiscal year - end finan cial results. 5 Pro Forma Adjusted EBITDA Margin is a non - GAAP measure. See appendix for GAAP reconciliation . 6 See appendix for discussion of calculation of backlog. 29% 19% 15% 13% 10% 6% 8% Custom Molders Automotive Consumer Goods Packaging Construction Electronics Other 55% 15% 30% Americas EMEA Asia 73% 27% Capital Aftermarket $231 $159 $187 0% 5% 10% 15% 20% 25% 30% 35% $0 $200 $400 FY 18 FY 19 Mar'20 $478 $395 18.7% 15.0% 0% 5% 10% 15% 20% 25% 30% 35% $0 $200 $400 $600 $800 $1,000 $1,200 YTD Mar'19 YTD Mar'20 $1,018 $1,035 $940 22.1% 20.5% 19.4% 0% 5% 10% 15% 20% 25% 30% 35% $0 $200 $400 $600 $800 $1,000 $1,200 FY 17 FY 18 FY 19 Pro Forma Revenue Pro Forma Adj. EBITDA Margin 5 22
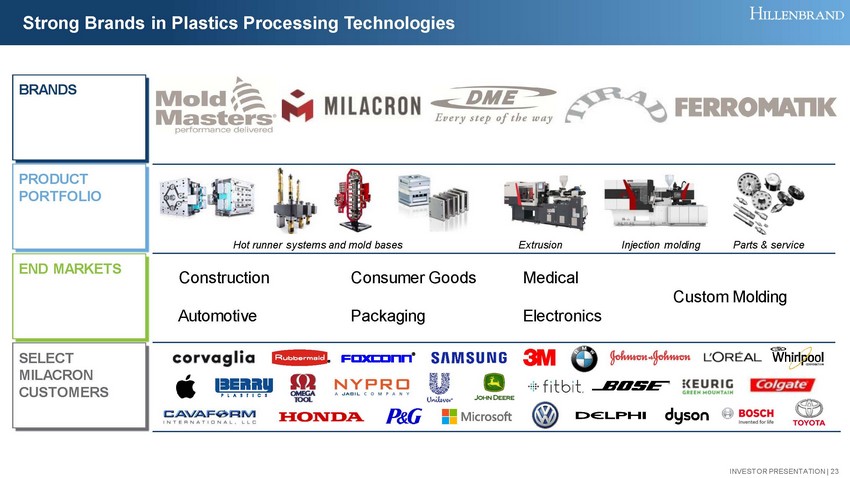
INVESTOR PRESENTATION | Construction Automotive Consumer Goods Packaging Medical Electronics Custom Molding Strong Brands in Plastics Processing Technologies END MARKETS PRODUCT PORTFOLIO BRANDS SELECT MILACRON CUSTOMERS Hot runner systems and mold bases Extrusion Injection molding Parts & service 23

INVESTOR PRESENTATION | Making Solid Progress on Integrating Milacron $50M Expected Run - rate Cost Synergies within 3 Years Post - close x Reducing public company costs x Realizing operating efficiencies x Capturing (in)direct spend opportunities x On track to realize synergies within fiscal 2020 $20 - 25M Year 1 Target Key Milestones Achieved this Quarter • Integration proceeding as planned, despite unexpected challenges associated with COVID - 19 • Completed sale of Cimcool business in a transaction valued at ~$224M on March 30, 2020 • Initiated restructuring activities resulting in a facility closure and reduction in fixed costs • Achieved $6M of cost synergies in Q2’20 primarily driven by reduction of duplicate public company cost Identifying and Capturing Strategic Benefits • Strong product and technology positions across plastics value chain; revenue synergy opportunities across portfolio • Enhancing position in new/current markets with broader offering sharing R&D and technology to serve evolving needs (e.g., recycling) • Achieving supply chain and operating efficiencies through leveraging our global footprint and spend • Building a scalable back office : working capital / global functions / business services • Leveraging HOM playbook to drive margins , especially in injection molding and extrusion product lines (formerly APPT) 24

INVESTOR PRESENTATION | BATESVILLE 25

INVESTOR PRESENTATION | $562 $551 $533 25.2% 21.9% 21.4% FY 17 FY 18 FY 19 Revenue Adj. EBITDA Margin $266 $266 21.9% 20.7% YTD Mar'19 YTD Mar'20 Batesville at a Glance Leadership Drives Strong Profit Margins and Free Cash Flow 91% 9% Caskets Other Customers Licensed funeral directors Geography U.S. & Canada Employees ~3,000 Sales Channel ~ 130 sales professionals selling direct to funeral homes Manufacturing Operations 4 world - class, award - winning operations Distribution Network Rapid, reliable delivery through ~90 service centers 1 1 Adjusted EBITDA Margin is a non - GAAP measure. See appendix for GAAP reconciliation. Performance ($M) 2019 Revenue by Product 26

INVESTOR PRESENTATION | 0 1,000 2,000 3,000 4,000 2010 2015 2020E 2025E 2030E Sizable Market Impacted by Changing Consumer Preferences ~$ 3B Death Care Products Industry in U.S. and Canada 49% 20% 19% 12% Caskets Markers Vaults Cremation & Other Burials vs. Cremations ( 000s ) 1 Deaths Cremations Burials • Demand for caskets driven by long - term, predictable demographics, and consumer trends • Consumer spending on caskets has not kept pace with inflation, resulting in annual mix decline • Addressing industry challenges using HOM to guide our investments in new products and solutions 1 1 Source: CDC, Cremation Association of North America, NFDA, and Company estimates. 27

INVESTOR PRESENTATION | Batesville Strategy Grow Leadership Position in Death Care • Leverage HOM to deliver value propositions that align with the needs of unique customer segments • Introduce new products and solutions in response to consumer trends • Create personalization options aligned with consumer preferences • Leverage technology to enhance consumer experience and create efficiencies for our customers Optimize Business Structure to Drive Profitability and Cash Flow • Drive supply chain and SG&A productivity through continued application of HOM • Continually improve processes to be more consistent and efficient and to yield industry leading quality products and services th at our customers value • Enhance logistics capabilities by further incorporating mobile technologies Continue to Strengthen and Develop Talent • Recruit and develop leaders skilled in HOM tools to drive breakthrough thinking • Develop next - generation sales leaders to drive performance and strengthen relationships • Expand digital marketing expertise and further develop strategic relationships 28

INVESTOR PRESENTATION | COVID - 19 UPDATE 29

INVESTOR PRESENTATION | Enhanced Safety Protocols Positive Operational Status • Established COVID - 19 Task Force and implemented a governance structure with a frequent cadence of reviews at operating company, enterprise, and Board levels • Work from home for non - essential onsite employees • Physical distancing procedures for employees who need to be onsite • Reinforced protocol around feeling ill • Documented response plan and protocols to help protect the safety of all associates • Hand - washing and hygiene practices across all sites • Additional personal protective equipment • All major global production locations open and operating at or near normal production levels and deemed essential • In close contact with suppliers to manage the supply chain and working with key suppliers on contingency plans • Leveraging global manufacturing and flexible supply chains to move production to different regions as needed Consulting regularly with key health authorities, regulatory organizations, and local governments; updating response plans as new information becomes available and observing governmental and health authorities’ guidelines COVID - 19 Preparedness and Response: Acting Compassionately and Decisively 30

INVESTOR PRESENTATION | COVID - 19 Business Response: Business Continuity Significant Production Site Capacity Status Major manufacturing facilities are operational Hillenbrand businesses deemed essential Office workers: Majority of functions working from home, including sales teams who are continuing to complete sales Manufacturing plants: Operational since they serve critical needs of customers in health and safety, food and agriculture, and energy. Management is maintaining contact with local government authorities to stay open to provide for critical needs India – Some facilities in India are closed or operating with a small crew due to Indian government regulations on COVID - 19 (less than 5% of HI Revenue) China – F acilities were closed for part of Q2. Due to global footprint, business was able to shift much of the work to other locations. China facility is now fully operational, working overtime to complete work, and receiving strong order flow Supply Chain: Majority of suppliers continue to perform since they serve critical industries. Some suppliers are delivering later than anticipated due to partial shutdowns, but no significant impact to the business as of now NORTH AMERICA B Batesville, IN B Chihuahua, Mexico B Manchester, TN M Batavia, OH M Mt. Orab, OH MM Georgetown, ON, Canada R Cincinnati, OH EUROPE DME Sasovice, Czech Republic C Niederlenz, Switzerland C Stuttgart, Germany C Weingarten, Germany MM Baden - Baden, Germany ASIA C Nanjing, China M Ahmedabad, India MM Suzhou, Jiangsu, China Company B Batesville C Coperion DME DME M Milacron Injection Molding & Extrusion MM Mold - Masters R Rotex Capacity 1 > 89% 50% - 89% 10% - 49% <10% Number of Employees 2 >225 151 - 225 1 Capacity estimates do not include intentional capacity reductions (ex. reductions in workforce due to lower demand). 2 Number of employees represents the total for that location. Sites with 150 or less employees are not shown. 31

INVESTOR PRESENTATION | Proactive Expense and Cash Management Flexibility To Adjust Upward / Downward Based on the Economic Situation Self - Adjusting Costs Operational Costs Investments x Incentive bonus x T&E x Hiring freeze for non - critical roles x CEO 30% salary reduction for remainder of FY20 x BoD scheduled cash compensation increase waiver for FY20 x Merit - based cancellations for FY20 (US and Canada) x Investment reprioritization x CapEx reduction x Temporary suspension of buybacks x Reduction in discretionary spend x Employee furloughs x Headcount reduction ~$ 50M Near - term savings including synergies And ~$40M of CapEx reduction while prioritizing key initiatives, safety , and maintenance projects 32
INVESTOR PRESENTATION | COVID - 19 Response: Liquidity Defensive position taken at March 31 to hold ~$375M+ of cash to address business continuity risks presented by COVID - 19 (e.g. primarily broad geographic shutdowns). We concluded that the forecast uncertainty brought about by COVID - 19 required additional steps to protect and enhance liquidity. Financing amendments to provide additional, temporary flexibility under the covenants were successfully completed on May 19. The financing amendments were developed to provide us added flexibility without creating excessive credit risk. ̶ Provide reasonable flexibility for economic uncertainty. ̶ Enable focus on optimizing the business through the impending recession and obtain additional flexibility for further cost actions , depending on extent of COVID - 19 recessionary impact. ̶ Re - establish a path back to the long - term capital structure targets. With the completion of the financing amendments, we have since resumed normal treasury operations (paid down the revolver with excess cash) as risk has lowered. 33

INVESTOR PRESENTATION | FINANCIAL POLICY & PERFORMANCE 34
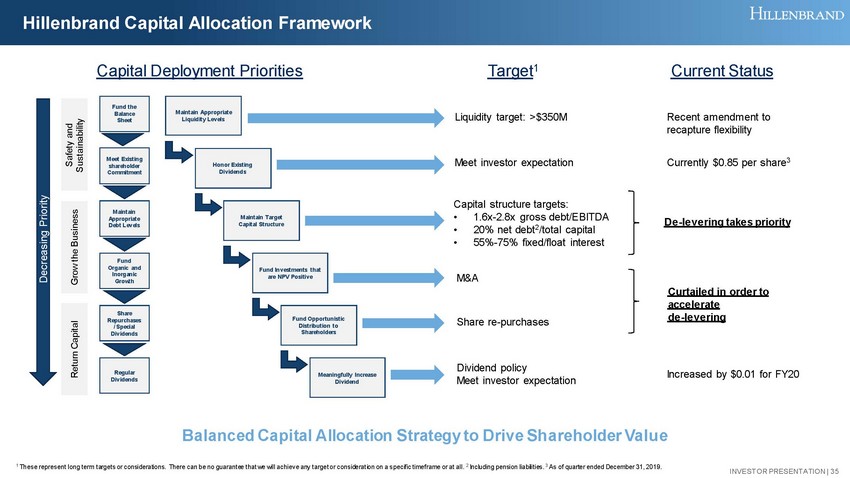
INVESTOR PRESENTATION | Hillenbrand Capital Allocation Framework Balanced Capital Allocation Strategy to Drive Shareholder Value Liquidity target: >$ 350M Capital structure targets: • 1.6x - 2.8x gross debt/EBITDA • 20% net debt 2 /total capital • 55% - 75% fixed/float interest Share re - purchases Dividend policy Meet investor expectation M&A Capital Deployment Priorities Target 1 Meet investor expectation Recent amendment to recapture flexibility De - levering takes priority Increased by $0.01 for FY20 Curtailed in order to accelerate de - levering Current Status Currently $ 0.85 per share 3 1 These represent long term targets or considerations. There can be no guarantee that we will achieve any target or considerat ion on a specific timeframe or at all . 2 Including pension liabilities. 3 As of quarter ended December 31, 2019. Decreasing Priority Safety and Sustainability Grow the Business Return Capital Fund the Balance Sheet Regular Dividends Meet Existing shareholder Commitment Maintain Appropriate Debt Levels Fund Organic and Inorganic Growth Share Repurchases / Special Dividends Maintain Appropriate Liquidity Levels Honor Existing Dividends Maintain Target Capital Structure Fund Investments that are NPV Positive Fund Opportunistic Distribution to Shareholders Meaningfully Increase Dividend 35

INVESTOR PRESENTATION | Financial Policy Near - term focus The Milacron acquisition resulted in a temporary deviation from well - established financial policies to complete a strategically compelling acquisition; COVID - 19 recessionary impact expected to extend timeline to return back to target leverage range (gross debt / EBITDA of 1.6x – 2.8x) 1 Capital deployment priority is to de - lever post close Short - dated , pre - payable debt in the capital structure is intended to facilitate de - levering Although COVID - 19 triggered our migration to sub - investment grade, we have publicly committed to de - levering Focus on successfully integrating Milacron and delivering on near - term financial targets/synergies Curtailment of M&A and share repurchases until leverage metrics return to targeted levels Dividend reduction/suspension would be considered if more challenging conditions develop Long - term financial policy Manage leverage back to within established target levels Continue to transform and optimize portfolio to minimize volatility and create value Maintain balance sheet flexibility to transact on strategic M&A 1 These represent long term targets or considerations. There can be no guarantee that we will achieve any target or considerat ion on a specific timeframe or at all . 36

INVESTOR PRESENTATION | 1.6x 0.4x 1.5x 1.2x 2.7x 1.7x 2.4x 2.0x 2.2x 0.7x 3.7x 3.5x 4Q10 1Q11 2Q11 3Q11 4Q11 1Q12 2Q12 3Q12 4Q12 1Q13 2Q13 3Q13 4Q13 1Q14 2Q14 3Q14 4Q14 1Q15 2Q15 3Q15 4Q15 1Q16 2Q16 3Q16 4Q16 1Q17 2Q17 3Q17 4Q17 1Q18 2Q18 3Q18 4Q18 1Q19 2Q19 3Q19 4Q19 1Q20 2Q20 Successful Track Record of Delevering Post - Transaction Proven Track Record of Paying Down Debt Source: Company filings and credit agreement compliance certificates 1 Defined as (“Total Debt – Cash”) / Consolidated EBITDA. Calculated using Consolidated EBITDA as defined in the credit agreement in effect during the relevant reporting period. Net Leverage 1 K - Tron & TerraSource Acquisition Rotex Acquisition Coperion Acquisition ABEL & Red Valve Acquisitions Strategic Pension Funding Milacron Acquisition 37

INVESTOR PRESENTATION | $178 $216 $223 $142 $121 $114 $225 $212 $182 $(72) $(78) $(75) FY17 FY18 FY19 PEG Batesville Milacron Corporate Combined 3 - Year Financial Performance Together Hillenbrand and Milacron to Gain Significant Size and Scale $1,028 $1,220 $1,274 $562 $551 $533 $1,018 $1,035 $940 FY17 FY18 FY19 PEG Batesville Milacron Pro Forma Revenue ($M) 1 $2,608 $2,806 $2,747 Pro Forma Adj. EBITDA ($M) 1,2 & Pro Forma Adj. EBITDA Margin (%) 1,2 1 FY 17 and FY 18 include PEG and Batesville results for the 12 months ended 9/30/17 and 9/30/18, respectively, and Milacron re sul ts for the 12 months ended 12/31/17 and 12/31/18, respectively. FY19 includes PEG, Batesville and Milacron results for the 12 mo nths ended 9/30/19 . As a result, the Milacron results for the fourth quarter of 2018 are reflected in both the 2018 and 2019 fiscal year - end financial re sults. 2 Pro Forma Adjusted EBITDA and Adjusted EBITDA Margin are Non - GAAP measures . See Appendix for reconciliation. 3 Milacron results exclude Cimcool and Blow Molding businesses, which were sold in March 2020 and July 2019, respectively. 4 Corporate includes Milacron and Hillenbrand corporate expenses 18.1% 16.8% 16.2% 3 3 4 38

INVESTOR PRESENTATION | 10 - Year Cash Performance Overview Working Capital Focus Driving FCF Generation and Fueling Investment for Future Growth Free Cash Flow ($M) 1 110% 158% 112% 149% 140% 65% 4 186% 175% 154% 2 122% 0% 50% 100% 150% 200% 250% FY10 FY11 FY12 FY13 FY14 FY15 FY16 FY17 FY18 FY19 $102 $168 $117 $97 $156 $74 4 $217 $224 $221 $153 FY10 FY11 FY12 FY13 FY14 FY15 FY16 FY17 FY18 FY19 6.1x 5.6x 5.4x 6.6x 7.8x 5.1x 4 6.2x 8.5x 9.4x 9.9x FY10 FY11 FY12 FY13 FY14 FY15 FY16 FY17 FY18 FY19 1 Free Cash Flow and Free Cash Flow Conversion are non - GAAP measures. See appendix for GAAP reconciliation . 2 FY18 FCF Conversion is adjusted for impairment. See appendix for GAAP reconciliation . 3 Based on company calculation of PWC / Annualized quarter Revenue. 4 2015 impacted by working capital timing Goal: > 100% Working Capital Turns ($M) 3 FCF Conversion 1 39

INVESTOR PRESENTATION | Pro Forma Revenue Pro Forma Backlog 2 Pro Forma Adjusted EBITDA 3 Operating Cash Flow $227 $187 $1,187 $1,169 Q2 2019 Q2 2020 Consolidated Performance – Q2 FY 2020 1 ($M) $11 $28 Q2 2019 Q2 2020 1 All financial metrics, except for operating cash flow, exclude the divested Cimcool and Blow Molding Businesses. 2 See appendix for discussion of calculation of backlog. 3 Adjusted EBITDA and adjusted EBITDA margin are non - GAAP measures. See appendix for GAAP reconciliation. Performance Highlights Business Update & FY 2020 Outlook • Pro Forma Adj . EBITDA 3 of $ 106M decreased by 2 % and Pro Forma Adj . EBITDA margin 3 of 17.0% increased 120 bps • Achieved record backlog in PEG of $982M and Milacron backlog of $187M, reflecting a sequential increase of 9% and 28%, respectively • Completed sale of Cimcool for ~$224M; positive outcome in current environment • Leadership mobilized to mitigate COVID - 19 impact; executing cost management program and strengthening liquidity • April trends were mixed, as Batesville saw strong volume while PEG and Milacron experienced softer demand for new orders - 1 % - 2 % +150% - 9% Milacron Milacron Milacron Milacron $219 $173 $684 $623 Q2 2019 Q2 2020 Milacron Milacron Milacron Milacron $42 $27 $108 $106 Q2 2019 Q2 2020 Milacron Milacron 40

INVESTOR PRESENTATION | Portfolio Characteristics & Implications of COVID - 19 Business % of Revenue 1 Near - term Recessionary Downside Risk Recent Order Trend (April 2020) Business Characteristics Equipment and Systems Long - cycle ~50% ● • Strong backlog, healthy orders pipeline and good cash profile Mid - cycle ● • Exposure to auto, which was experiencing softening demand pre - COVID • Contending with India closure and customer disruptions due to COVID - 19 pandemic Short - cycle ● • Exposure to auto, which was experiencing softening demand pre - COVID • Opportunity in medical, packaging and consumer products Aftermarket ~25% ● • Resilient, quick recovery • Higher margin business • Pressure from low machine utilization Batesville ~20% ● • Non - cyclical, recession resistant • Track record of productivity and lean • Stable cash flow 1 Q2 FY20; excludes 4% of revenue from Cimcool Lower Risk Higher Risk 41

INVESTOR PRESENTATION | Well - Positioned for Continued Cash Generation Backlog and Increased Aftermarket Sales Expected to Support More Stable Cash Generation Stability of Batesville Cash Flow Timing and Magnitude of Downturns Affect Businesses Differently • Backlog includes significant number of large, long - dated projects • Small to medium equipment enter / exit cycles more quickly • Aftermarket parts and service move in / out of cycles rapidly • Milacron’s businesses track differently EBITDA Enters cycle quickly; Rebounds quickly Enters cycle slowly; exits slowly Provides relatively stable trend Relatively immune to cyclical swings (Short & Mid - Cycle) (Long - Cycle) 42

INVESTOR PRESENTATION | CAPITALIZATION OVERVIEW 43

INVESTOR PRESENTATION | Capital Position and Liquidity ($M) As of 3/31/20 % of Total Cap . xLTM 3/31/20 PF Adj. EBITDA (ex. Cimcool ) Cash & Cash Equivalents $374 $ 900M Senior Unsecured Revolver due Aug. 2024 538 14.2% 1.3x 3 - Year Senior Unsecured Term Loan A due Nov. 2022 222 5.8% 0.5x 5 - Year Senior Unsecured Term Loan A due Nov. 2024 492 13.0% 1.2x 4.60% Series A Notes due Dec. 2024 100 2.6% 0.2x 5.50% Senior Unsecured Notes due July 2020 150 3.9% 0.4x 4.50% Senior Unsecured Notes due Sept. 2026 370 9.8% 0.9x Other Debt 2 - - Total Debt 1 $1,873 49.3% 4.4x Total Net Debt $1,499 39.5% 3.5x Market Value of Equity (As of 5/29/20 ) 1,923 50.7% Total Capitalization $3,797 8.9x Enterprise Value $3,423 8.0x LTM 3/31/20 Pro Forma Adj. EBITDA (ex. Cimcool) 2 $427 Cash on B/S 374 Revolver Availability 3 354 Total Liquidity $728 Note: Calendar year end 1 Amounts shown are net of debt issuance costs. 2 Pro Forma Adj. EBITDA is a non - GAAP measure. See Appendix for reconciliation. 3 Pro forma for recently completed amendment; defined as lesser of undrawn revolver (less outstanding LCs of c. $8M) and availa bil ity under the existing 4.75x net leverage covenant based on EBITDA as defined in the Credit Agreement (Cash Netting defined as 100% of unre str icted and unencumbered cash and cash equivalents in the United States plus 70% of unrestricted and unencumbered cash and cash eq uivalents outside of the United States, not to exceed $175M). 4 Debt balances are reflected gross rather than net of deferred financing fees. 5 Total revolver size of $900M ($354M of undrawn availability after giving effect to outstanding letters of credit). 6 Assumes amortization of 5.0% / 5.0% / 7.5% bullet. 7 Assumes amortization of 5.0% / 5.0% / 7.5% / 7.5% / 10.0% / bullet $150.0 $100.0 $25.0 $28.1 $37.5 $40.6 $362.5 $375.0 $11.3 $12.7 $198.3 $537.6 2020 2021 2022 2023 2024 2025 2026 Drawn Revolver 3-year Term Loan A-2 Bonds due 2026 5-year Term Loan A-1 Series A Notes Bonds due 2020 Debt Maturity Profile as of March 31, 2020 4 7 6 5 44

INVESTOR PRESENTATION | KEY TAKEAWAYS 45

INVESTOR PRESENTATION | Key Takeaways 01 02 03 04 05 06 Significant Strides Transforming Hillenbrand into a Global Diversified Industrial Company Market Leadership Driven by Highly - Engineered Products with Core Technologies Differentiated by Applications Expertise The Hillenbrand Operating Model (HOM) is a Competitive Differentiator; Historically Focused on Margin Expansion and Now Adding Tools to Drive Profitable Growth Focused on Building Platforms to Develop Scale and Enhance Leadership Positions to Drive Profitable Growth; Integrating Milacron is a Key Priority Strong Free Cash Flow With Focus on Paying Down Debt Post - Milacron Acquisition; Temporarily Lowering Priority of M&A and Share Repurchases Passionate Leadership Team Driving Transformation with Runway for Significant Shareholder Value Creation 46

INVESTOR PRESENTATION | APPENDIX 47

INVESTOR PRESENTATION | Disclosure Regarding Non - GAAP Measures While we report financial results in accordance with United States generally accepted accounting principles (GAAP), we also p rov ide certain non - GAAP operating performance measures. These non - GAAP measures are referred to as “adjusted” measures and exclude the following items: • business acquisition, disposition, and integration costs; • restructuring and restructuring related charges; • asset impairment charges; • inventory step - up charges; • backlog amortization; • debt financing activities related to the acquisition of Milacron; • net loss on divestiture of Cimcool; • the related income tax impact for all of these items; and • non - recurring tax benefits and expenses related to the interaction of certain provisions of the Tax Cuts and Jobs Act of 2017 (t he “Tax Act”) and certain tax items related to the acquisition of Milacron and divestiture of Cimcool. Non - GAAP information is provided as a supplement to, not as a substitute for, or as superior to, measures of financial performan ce prepared in accordance with GAAP. One important non - GAAP measure that we use is adjusted earnings before interest, income tax, depreciation, and amortization (“ad justed EBITDA”). A part of our strategy is to pursue acquisitions that strengthen or establish leadership positions in key markets. Given that strategy, it is a natural consequence to incur related expenses, such as amo rti zation from acquired intangible assets and additional interest expense from debt - funded acquisitions. Accordingly, we use adjusted EBITDA, among other measures, to monitor our business performance. Adjusted EBITDA is not a reco gni zed term under U.S. GAAP and therefore does not purport to be an alternative to net (loss) income. Further, Hillenbrand’s measure of adjusted EBITDA may not be comparable to similarly titled measures of other compani es . Free cash flow (FCF) is defined as cash flow from operations less capital expenditures. Hillenbrand use s a related term, free cash flow to net income conversion rate , to refer to free cash flow divided by GAAP net income. Hillenbrand considers FCF and free cash flow to net income conversion rate important indicators of Hillebrand ’ s liquidity, as well as its ability to fund future growth and to provide a return to shareholders. FCF does not include deductions for debt service (repayments of principal), other borrowing activity, dividends on Hillenbrand ’s common stock, repurchases of Hillenbrand ’s common stock, business acquisitions, and other items. Another important non - GAAP measure used is backlog. Backlog is not a term recognized under GAAP; however, it is a common measurement us ed in industries with extended lead times for order fulfillment (long - term contracts), like those in which our Process Equipment Group and Milacron businesses compete. Backlog represents the amount of consolidate d r evenue that we expect to realize on contracts awarded related to the Process Equipment Group and Milacron. For purposes of calculating backlog, 100% of estimated revenue attributable to consolidated subsidiaries is inc lud ed. Backlog includes expected revenue from large systems and equipment, as well as replacement parts, components, and service. Given that there is no GAAP financial measure comparable to backlog, a quantitative reconcil iat ion is not provided. We use this non - GAAP information internally to make operating decisions and believe it is helpful to investors because it allows more meaningful period - to - period comparisons of our ongoing operating results. The information can also be used to perform trend analysis and to better identify operating trends that may otherwise be masked or distorted by t hes e types of items. The Company believes this information provides a higher degree of transparency. 48

INVESTOR PRESENTATION | Segment Performance: Process Equipment Group ($M) Performance Highlights Business Update • Revenue of $ 311M decreased 5% compared to the prior year due to lower demand for capital equipment, including screening and separating equipment used for proppants, partially offset by favorable pricing and a 4% increase in aftermarket revenue; the decline also included an unfavorable foreign currency impact of 2% • Adjusted EBITDA margin of 18.5% increased 150 basis points due to pricing and productivity improvements, and cost controls, partially offset by inflation and the increased proportion of lower margin, large systems projects and the decline of higher margin separating equipment • Record backlog of $982M, up 2% over prior year and up 9% sequentially • We continue to see normal activity related to large polyolefin systems and existing projects remained on track • In April, order patterns slowed for aftermarket parts and service and for capital equipment for the remainder of the segment • Continued focus on discretionary cost controls 1 Adjusted EBITDA and adjusted EBITDA margin are non - GAAP measures. See appendix for GAAP reconciliation. $327 $311 Q2 2019 Q2 2020 Revenue $55 $58 Q2 2019 Q2 2020 Adj. EBITDA 1 17.0% 18.5% Q2 2019 Q2 2020 Adj. EBITDA Margin 1 - 5% +4% +150 bps 49

INVESTOR PRESENTATION | Segment Performance: Milacron ($M) Performance Highlights Business Update • Milacron pr o forma revenue of $ 173M decreased 21% compared to the prior year due to continued softness for injection molding equipment and hot runner systems in certain end markets, including automotive; demand pressure was further exacerbated by the impact of COVID - 19 • Pro Forma A dj. EBITDA margin of 15.6% decreased 330 basis points vs. the prior year primarily due to lower volume • Backlog of $187M decreased 17% year over year due to lower injection molding and extrusion equipment orders; however, backlog grew 28% sequentially for both hot runner systems and injection molding equipment • Injection molding and extrusion equipment saw a sequential increase in orders in the fiscal second quarter, but that momentum slowed in March and continued to decline in April • Order rates for hot runner systems, however, improved in March and April versus January and February, as government shutdowns in China were relaxed or lifted, and demand for medical and pharmaceutical projects increased due to the COVID - 19 pandemic • Continued focus on discretionary cost controls 1 All financial metrics exclude the divested Cimcool and Blow Molding businesses . 2 Pro Forma Adjusted EBITDA and pro forma adjusted EBITDA margin are non - GAAP measures. See appendix for GAAP reconciliation. $219 $173 Q2 2019 Q2 2020 Pro Forma Revenue 1 $42 $27 Q2 2019 Q2 2020 Pro Forma Adj . EBITDA 1,2 18.9% 15.6% Q2 2019 Q2 2020 Pro Forma Adj . EBITDA Margin 1,2 - 21% - 35% - 33 0 bps 50

INVESTOR PRESENTATION | Segment Performance: Batesville ($M) Performance Highlights Business Update • Revenue of $ 139M increased 1% over the prior year; the increase in revenue was primarily driven by higher volume, despite an estimated decrease in North American burials due to an increased rate at which families opted for cremation • Adj. EBITDA margin of 23.1% improved by 20 bps over the prior year driven primarily by productivity initiatives and higher volume, partially offset by inflation in wages and benefits • Batesville experienced increased demand late in the fiscal second quarter, which continued through April, in certain markets reporting increased mortality associated with the COVID - 19 pandemic • Continued focus on discretionary cost controls 1 Adjusted EBITDA and adjusted EBITDA margin are non - GAAP measures. See appendix for GAAP reconciliation. $138 $139 Q2 2019 Q2 2020 Revenue $32 $32 Q2 2019 Q2 2020 Adj. EBITDA 1 22.9% 23.1% Q2 2019 Q2 2020 Adj. EBITDA Margin 1 +1% +1% +20 bps 51
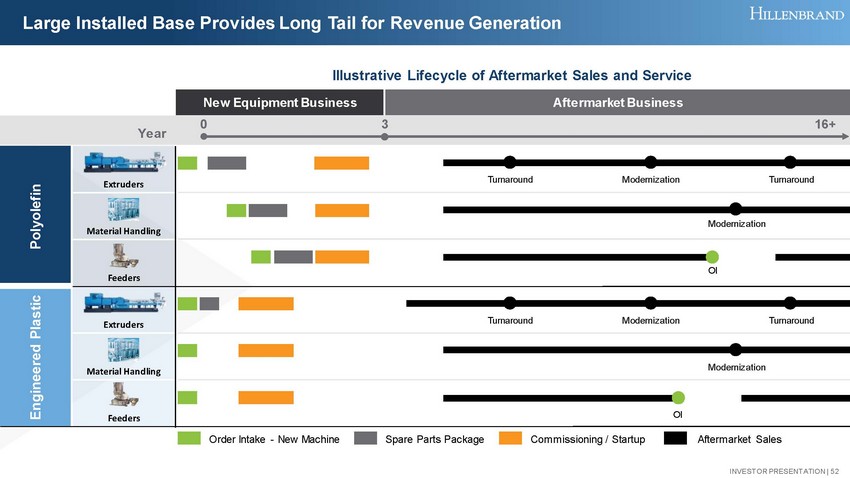
INVESTOR PRESENTATION | Large Installed Base Provides Long Tail for Revenue Generation New Equipment Business Aftermarket Business Extruders Material Handling Feeders Extruders Material Handling Feeders Polyolefin Engineered Plastic Year Illustrative Lifecycle of Aftermarket Sales and Service 3 0 Order Intake - New Machine Spare Parts Package Commissioning / Startup Aftermarket Sales Turnaround Turnaround OI Modernization Modernization Modernization Turnaround Turnaround OI 16+ Modernization 52

INVESTOR PRESENTATION | Individual Components to Integrated Systems in Plastics Value - Added Services Include: Maintenance, Parts, Modernization, and Field Service Compounding & Extrusion Systems • Highly - engineered conversion systems used in high volume polyolefin production (polyethylene and polypropylene) • Smaller conversion systems for engineered plastics, PVC, and chemicals Equipment & Components • Feeding equipment and components for large and small systems ̶ Feeders ̶ Highly - engineered valves ̶ Pneumatic conveying subsystems Materials Handling • Large engineered pneumatic material handling systems mainly for the polyolefin industry • Turnkey Solutions – Coperion engineers all key equipment and processes for a turnkey plant 53

INVESTOR PRESENTATION | Strengthens Position Across Plastics Value Chain and Enhances Growth Opportunity Better Positioned to Serve Customers and Cross - Sell Products ● Silos ● Feeder ● Conveyor piping ● Vacuum pump ● Hopper blender ● Mixer ● Material handling ● Extruder ● Dies ● Cutting ● Mold ● Material handling robot ● Cutting and pulling machine ● Printing machine ● Labeling machine ● Case packer ● Palletizing equipment ● Grinder ● Melt filter ● Extruder (single - screw) ● Extruder (twin - screw) ● Washer ● Pelletizer ● Classifier ● Conveyor ● Palletizing equipment ● Reactor ● Pump ● Pipe ● Gas Compressor ● Material handling ● Extruder ● Pelletizer ● Silos ● Feeder ● Conveyor piping ● Vacuum pump ● Hopper blender ● Mixer ● Dryer ● Funnel ● Injection unit ● Heating unit ● Hot runners ● Cooling line (pipes) ● Control unit ● Material handling robot ● Printing machine ● Labeling machine ● Case packer ● Palletizing equipment ● Material handling ● Feeders ● Mixers ● Compounders ● Pelletizers ● Classifiers Plastics Value Chain Oil R efining & C racking Base Resin Production Plastics Processing – Extruded Products Recycling Extrusion Part Ejection Printing & Labeling Packaging Onsite S torage Conveying & Mixing Drying & Molding Part Ejection Packaging Onsite storage Conveying & Mixing Reactor, Pump Conveying Extrusion Size Reduction Extrusion Pelletizer, Classifier Printing & Labeling Plastics Processing – Injection Molded Products Plastic s Compounding Conveying Compounding Primary process step Combined Secondary process step Hillenbrand equipment offering Milacron equipment offering Significant product offering Moderate product offering No offering 54

INVESTOR PRESENTATION | Reconciliation of Pro Forma Adjusted EBITDA to Consolidated Net (Loss) Income (1) During the six months ended March 31 , 2020 , Hillenbrand recorded impairment charges to goodwill and certain identifiable intangible assets within both the Process Equipment Group and Milacron reportable segments . (2) Business acquisition, disposition, and integration costs were primarily related to professional fees and other transaction co sts in connection with the divestitures of the Cimcool business in March 2020 and the blow molding business in July 2019, along with the acquisition and integration of Burnaby Machine and Mill Equipment Ltd. ("BM&M") in November 2018. (3) Restructuring and restructuring - related charges primarily included severance and other termination costs as a result of eliminated positions . (4) Represents the non - cash charges related to the fair value adjustment of inventories acquired in connection with the acquisition of BM&M in November 2018 . (5) Hillenbrand recorded a pre - tax net loss on the divestiture of the Cimcool business during the six months ended March 31 , 2020 . (6) Other costs primarily included the write - down of inventory associated with discontinued product lines, costs associated with the blow molding business that did not qualify for discontinued operations, and incremental expenses associated with the COVID - 19 pandemic . Pro Forma Pro Forma Year Ended Last Twelve Months September 30, Ended March 31, (in millions) 2020 2019 2019 2020 Pro forma consolidated net (loss) income (26.1)$ 68.0$ 137.4$ 43.3$ Interest income (2.3) (2.1) (4.1) (4.3) Interest expense 41.9 48.6 96.8 90.1 Income tax expense 24.1 26.1 62.7 60.7 Depreciation and amortization 64.8 66.4 133.1 131.5 Pro forma EBITDA 102.4 207.0 425.9 321.3 Impairment charges (1) 82.5 - - 82.5 Business acquisition, disposition, and integration costs (2) 4.7 1.3 3.8 7.2 Restructuring and restructuring-related charges (3) 4.5 15.0 30.2 19.7 Inventory step-up (4) - 0.2 0.2 - Net loss on divestiture (5) 3.0 - - 3.0 Other (6) 9.7 4.3 11.1 16.5 Pro forma adjusted EBITDA 206.8 227.8 471.2 450.2 Less: Cimcool adjusted EBITDA (10.2) (13.6) (26.8) (23.4) Pro forma adjusted EBITDA, excluding Cimcool 196.6$ 214.2$ 444.4$ 426.8$ Pro forma adjusted EBITDA by segment: Process Equipment Group 109.0$ 101.7$ 223.3$ 230.6$ Milacron 59.2 89.5 182.0 151.7 Batesville 55.0 58.3 114.2 110.9 Corporate (26.6) (35.3) (75.1) (66.4) 196.6$ 214.2$ 444.4$ 426.8$ Pro Forma Six Months Ended March 31, 55

INVESTOR PRESENTATION | Reconciliation of Pro Forma Revenue to Reported Revenue Consolidated Revenue Reconciliation Milacron Revenue Reconciliation Actual Pro Forma Pro Forma Three Months Ended Three Months Ended Year Ended (in millions) March 31, 2020 March 31, 2019 2020 2019 September 30, 2019 2018 2017 Consolidated net revenue 648.9$ 713.3$ 1,331.5$ 1,413.1$ 2,867.2$ 2,934.8$ 2,729.7$ Less: Cimcool net revenue (26.0) (29.3) (53.3) (60.4) (119.9) (129.3) (121.2) Consolidated net revenue, excluding Cimcool 622.9$ 684.0$ 1,278.2$ 1,352.7$ 2,747.3$ 2,805.5$ 2,608.5$ Pro Forma Years Ended December 31, Pro Forma Six Months Ended March 31, Three Months Ended Three Months Ended Year Ended (in millions) March 31, 2020 March 31, 2019 2020 2019 September 30, 2019 2018 2017 Milacron net revenue 199.0$ 248.7$ 448.0$ 538.2$ 1,059.9$ 1,164.7$ 1,139.5$ Less: Cimcool net revenue (26.0) (29.3) (53.3) (60.4) (119.9) (129.3) (121.2) Milacron net revenue, excluding Cimcool 173.0$ 219.4$ 394.7$ 477.8$ 940.0$ 1,035.4$ 1,018.3$ Years Ended December 31,Six Months Ended March 31, 56

INVESTOR PRESENTATION | Reconciliation of Hillenbrand Adjusted EBITDA to Consolidated Net (Loss) Income (in millions) 2020 2019 2018 2017 Consolidated net (loss) income (72.2)$ 39.5$ 81.2$ 128.4$ Interest income (0.6) (0.2) (1.4) (0.9) Interest expense 20.9 5.4 23.3 25.2 Income tax expense 1.8 13.8 65.3 59.9 Depreciation and amortization 38.6 15.1 56.5 56.6 EBITDA (11.5) 73.6 224.9 269.2 Impairment charges 82.5 - 63.4 - Business acquisition, disposition, and integration costs 8.0 0.5 3.5 1.1 Restructuring and restructuring-related charges 0.7 0.7 2.5 10.7 Inventory step-up 27.5 0.1 - - Net loss on divestiture 3.0 - - - Other 0.4 - - - Adjusted EBITDA 110.6 74.9 294.3 281.0 Less: Cimcool adjusted EBITDA (4.9) - - - Adjusted EBITDA, excluding Cimcool 105.7$ 74.9$ 294.3$ 281.0$ Adjusted EBITDA by segment: Process Equipment Group 57.5$ 55.5$ 215.8$ 177.7$ Milacron 27.0 - - - Batesville 32.0 31.6 120.8 141.9 Corporate (10.8) (12.2) (42.3) (38.6) 105.7$ 74.9$ 294.3$ 281.0$ Three Months Ended March 31, Years Ended September 30, 57

INVESTOR PRESENTATION | Reconciliation of Milacron Adjusted EBITDA to Consolidated Net (Loss) Income (1) Includes Milacron’s segment EBITDA as if Milacron was a segment of Hillenbrand for the periods presented above . Three Months Ended March 31, (in millions) 2019 2018 2017 Consolidated net (loss) income (0.8)$ 41.5$ 1.1$ Loss from discontinued operations (net of income taxes) 10.0 5.1 6.7 Interest expense 9.5 42.9 44.5 Income tax expense 7.0 18.5 14.9 Depreciation and amortization 11.9 52.1 54.3 Currency effect on intercompany advances (1.6) 3.1 (6.7) Long-term equity awards 3.2 10.1 9.4 Debt costs - 1.2 27.1 Business acquisition, disposition and integration costs 0.7 4.0 6.0 Restructuring and restructuring-related charges 1.1 35.7 51.3 Other - 5.4 12.5 Adjusted EBITDA (as reported by Milacron) 41.0 219.6 221.1 Less: Adjustments to conform with Hillenbrand: Currency effect on intercompany advances 1.6 (3.1) 6.7 Long-term equity awards (3.2) (10.1) (9.4) Adjusted EBITDA (conformed to Hillenbrand) 39.4 206.4 218.4 Less: Cimcool adjusted EBITDA (6.4) (29.3) (26.9) Adjusted EBITDA, excluding Cimcool 33.0$ 177.1$ 191.5$ Adjusted EBITDA by segment Milacron (1) 41.5$ 212.4$ 225.2$ Corporate (8.5) (35.3) (33.7) 33.0$ 177.1$ 191.5$ Years Ended December 31, 58

INVESTOR PRESENTATION | Reconciliation of Free Cash Flow & Free Cash Flow Conversion to Net Cash Provided by Operating Activities ($ in millions) 59