Attached files
| file | filename |
|---|---|
| 8-K - 8-K - Forterra, Inc. | frta8k20200528.htm |

Exhibit 99.1 Investor Presentation May 2020

DISCLAIMER Forward-Looking Statements This presentation contains forward-looking statements within the meaning of Section 27A of the Securities Act of 1933, as amended, and Section 21E of the Securities Exchange Act of 1934, as amended. Forward-looking statements may be identified by the use of words such as "anticipate", "believe", "expect", "estimate", "plan", "outlook", and "project" and other similar expressions that predict or indicate future events or trends or that are not statements of historical matters. Forward-looking statements should not be read as a guarantee of future performance or results, and will not necessarily be accurate indications of the times at, or by, which such performance or results will be achieved. Forward- looking statements are based on historical information available at the time the statements are made and are based on management's reasonable belief or expectations with respect to future events, and are subject to risks and uncertainties, many of which are beyond the Company's control, that could cause actual performance or results to differ materially from the belief or expectations expressed in or suggested by the forward-looking statements. Forward-looking statements speak only as of the date on which they are made and the Company undertakes no obligation to update any forward-looking statement to reflect future events, developments or otherwise, except as may be required by applicable law. Investors are referred to the Company's filings with the Securities and Exchange Commission, including its Annual Report on Form 10-K, as updated by any quarterly reporting on Form 10-Q, for additional information regarding the risks and uncertainties that may cause actual results to differ materially from those expressed in any forward-looking statement. Some of the risks and uncertainties that could cause actual results to differ materially from those expressed in any forward looking statement include risks and uncertainties relating to the impacts of the COVID-19 pandemic; the level of construction activity, particularly in the residential construction and non-residential construction markets; government funding of infrastructure and related construction activities; the highly competitive nature of our industry and our ability to effectively compete; the availability and price of the raw materials we use in our business; the ability to implement our growth strategy; our dependence on key customers and the absence of long-term agreements with these customers; the level of construction activity in Texas; energy costs; disruption at one or more of our manufacturing facilities or in our supply chain; construction project delays and our inventory management; our ability to successfully integrate acquisitions; labor disruptions and other union activity; a tightening of mortgage lending or mortgage financing requirements; our current dispute with HeidelbergCement related to the payment of an earnout; compliance with environmental laws and regulations; compliance with health and safety laws and regulations and other laws and regulations to which we and our products are subject; our dependence on key executives and key management personnel; our ability or that of the customers with which we work to retain and attract additional skilled and non-skilled technical or sales personnel; credit and non-payment risks of our customers; warranty and related claims; legal and regulatory claims; the seasonality of our business and its susceptibility to adverse weather; our contract backlog; our ability to maintain sufficient liquidity and ensure adequate financing or guarantees for large projects; delays or outages in our information technology systems and computer networks; security breaches in our information technology systems and other cybersecurity incidents and additional factors discussed in our filings with the Securities and Exchange Commission, including its Annual Report on Form 10-K and Quarterly Reports on Form 10-Q, for additional information regarding the risks and uncertainties that may cause actual results to differ materially from those expressed in any forward-looking statement. Industry Data We use market data and industry forecasts throughout this presentation. Unless otherwise indicated, statements in this presentation concerning our industries and the markets in which we operate, including our general expectations, competitive position, business opportunity and market size, growth and share, are based on publicly available information, periodic industry publications and surveys, government surveys and reports, and reports by market research firms. We have not independently verified market data and industry forecasts provided by any of these third-party sources, although we believe such market data and industry forecasts included in this presentation are reliable. This information cannot always be verified with complete certainty due to the limits on the availability and reliability of raw data, the voluntary nature of the data gathering process and other limitations and uncertainties inherent in surveys of market size. Management estimates are derived from the information and data referred to above, as well as our internal research, calculations and assumptions made by the Company based on our analysis of such information and data and our knowledge of our industries and markets, which we believe to be reasonable, although they have not been independently verified. While we believe that the market position information included in this presentation is generally reliable, such information is inherently imprecise. Assumptions, expectations and estimates of our future performance and the future performance of the industries and markets in which we operate are necessarily subject to a high degree of uncertainty and risk due to a variety of factors, including those described in our filings with the Securities and Exchange Commission. These and other factors could cause results to differ materially from those expressed in the estimates made by the independent parties and by us. 1
Company and Industry Overview
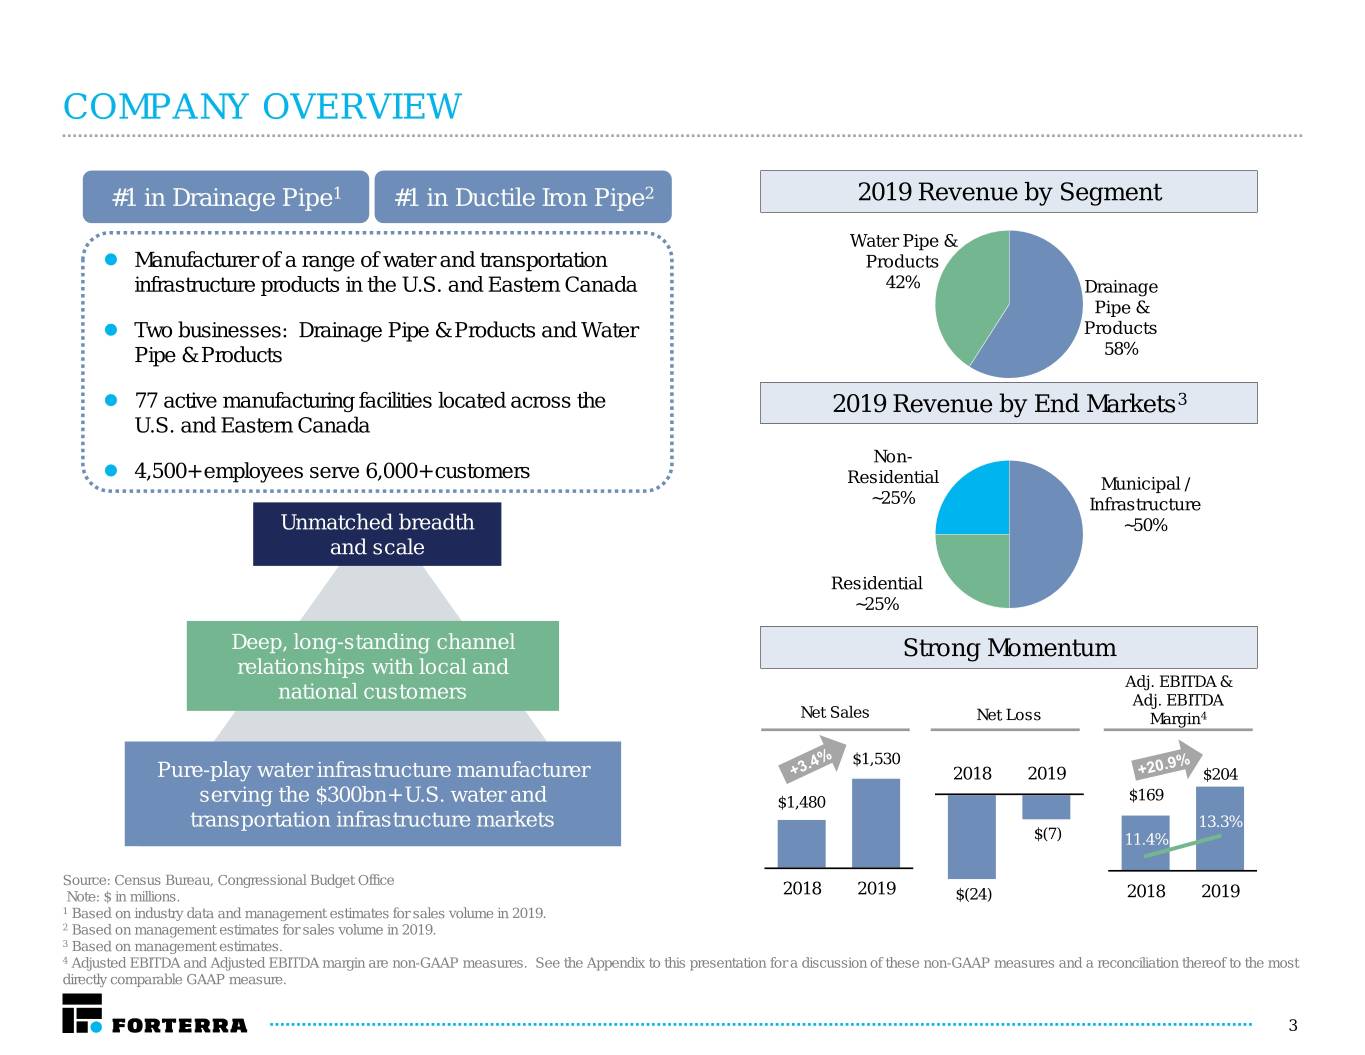
COMPANY OVERVIEW #1 in Drainage Pipe1 #1 in Ductile Iron Pipe2 2019 Revenue by Segment Water Pipe & Manufacturer of a range of water and transportation Products infrastructure products in the U.S. and Eastern Canada 42% Drainage Pipe & Two businesses: Drainage Pipe & Products and Water Products Pipe & Products 58% 77 active manufacturing facilities located across the 2019 Revenue by End Markets3 U.S. and Eastern Canada Non- 4,500+ employees serve 6,000+ customers Residential Municipal / ~25% Infrastructure Unmatched breadth ~50% and scale Residential ~25% Deep, long-standing channel Strong Momentum relationships with local and Adj. EBITDA & national customers Adj. EBITDA Net Sales Net Loss Margin4 $1,530 Pure-play water infrastructure manufacturer 2018 2019 $204 serving the $300bn+ U.S. water and $1,480 $169 transportation infrastructure markets 13.3% $(7) 11.4% Source: Census Bureau, Congressional Budget Office Note: $ in millions. 2018 2019 $(24) 2018 2019 1 Based on industry data and management estimates for sales volume in 2019. 2 Based on management estimates for sales volume in 2019. 3 Based on management estimates. 4 Adjusted EBITDA and Adjusted EBITDA margin are non-GAAP measures. See the Appendix to this presentation for a discussion of these non-GAAP measures and a reconciliation thereof to the most directly comparable GAAP measure. 3

INDUSTRY LEADER – DRAINAGE More than 90% of Drainage revenues are tied to markets where we have a #1 or #2 position1 Segment Overview Key Demand Drivers 1. Growth in public highway construction 2. Historically consistent federal and growing state level funding Reinforced Manholes Specialty Storm 3. Housing under-supply Concrete Products Water Pipe 2019 Net Sales by End Market2 Historical Financials Segment EBITDA & Adj. Segment Net Sales Margin EBITDA & Margin3 Non-Residential ~25% $895 $835 $181 Municipal / $811 $171 $162 $160 Infrastructure $729 $157 ~45% $138 $130 $137 22% Residential 19% 19% 19% 20% 20% ~30% Note: $ in millions. 16% 1 Management estimate based on 2019 revenue. 16% 2 Based on management estimates. 3 Adjusted EBITDA and Adjusted EBITDA margin are non-GAAP measures. See the Appendix to this 2016 2017 2018 2019 2016 2017 2018 2019 presentation for a discussion of these non-GAAP measures and a reconciliation thereof to the most directly 2016 2017 2018 2019 comparable GAAP measure. 4
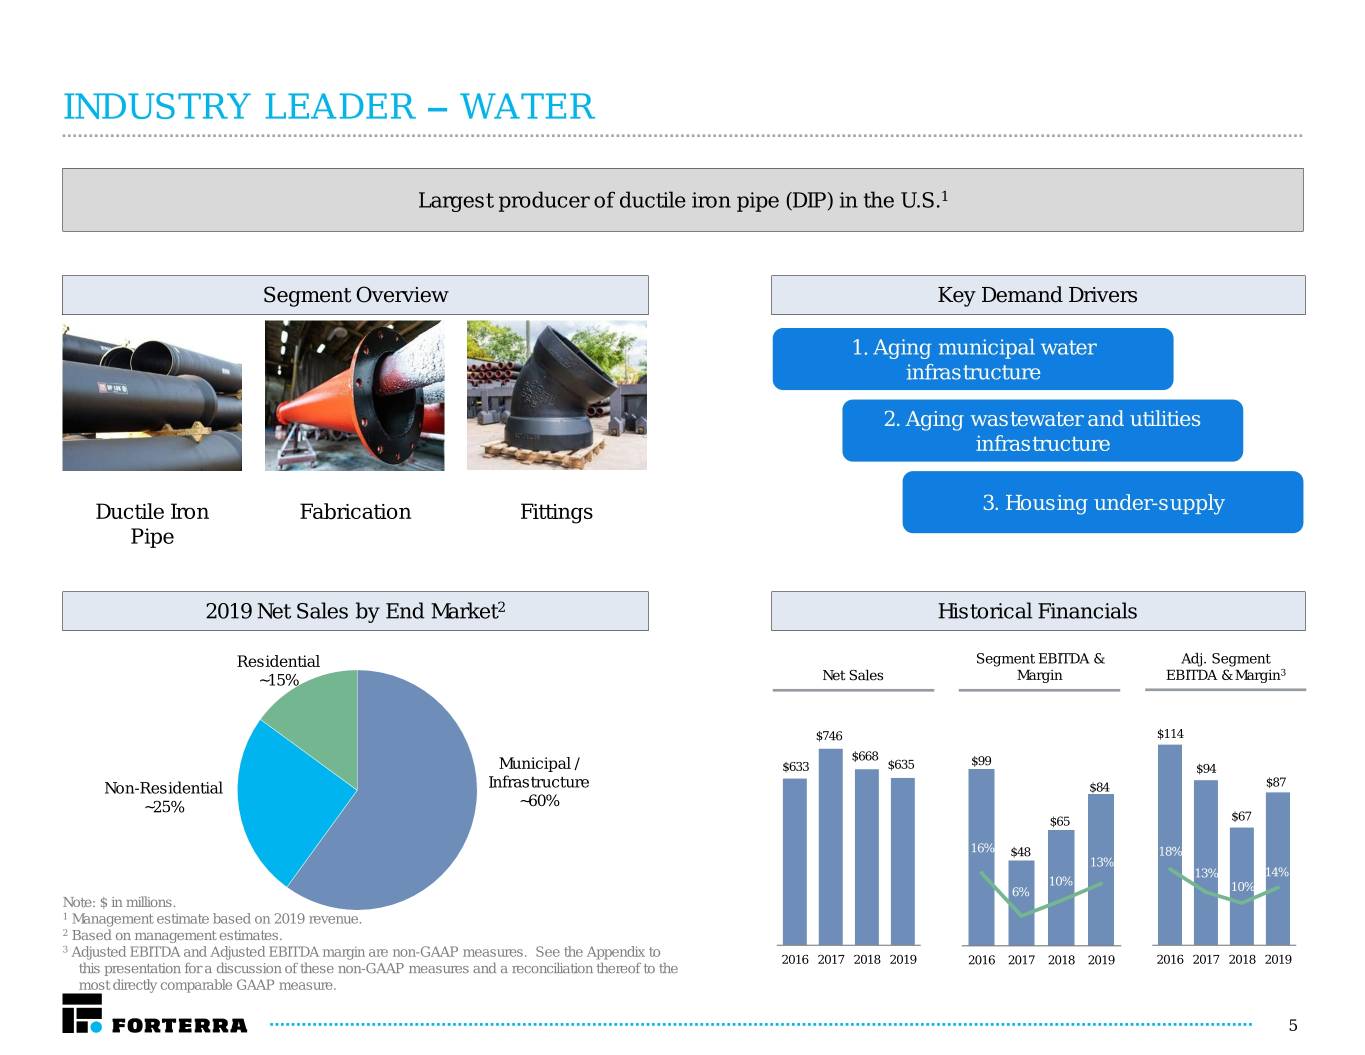
INDUSTRY LEADER – WATER Largest producer of ductile iron pipe (DIP) in the U.S.1 Segment Overview Key Demand Drivers 1. Aging municipal water infrastructure 2. Aging wastewater and utilities infrastructure Ductile Iron Fabrication Fittings 3. Housing under-supply Pipe 2019 Net Sales by End Market2 Historical Financials Residential Segment EBITDA & Adj. Segment 3 ~15% Net Sales Margin EBITDA & Margin $746 $114 $668 Municipal / $635 $99 $633 13% $94 Non-Residential Infrastructure $84 $87 ~25% ~60% $65 $67 16% $48 18% 13% 13% 14% 10% 6% 10% Note: $ in millions. 1 Management estimate based on 2019 revenue. 2 Based on management estimates. 3 Adjusted EBITDA and Adjusted EBITDA margin are non-GAAP measures. See the Appendix to 2016 2017 2018 2019 2016 2017 2018 2019 2016 2017 2018 2019 this presentation for a discussion of these non-GAAP measures and a reconciliation thereof to the most directly comparable GAAP measure. 5
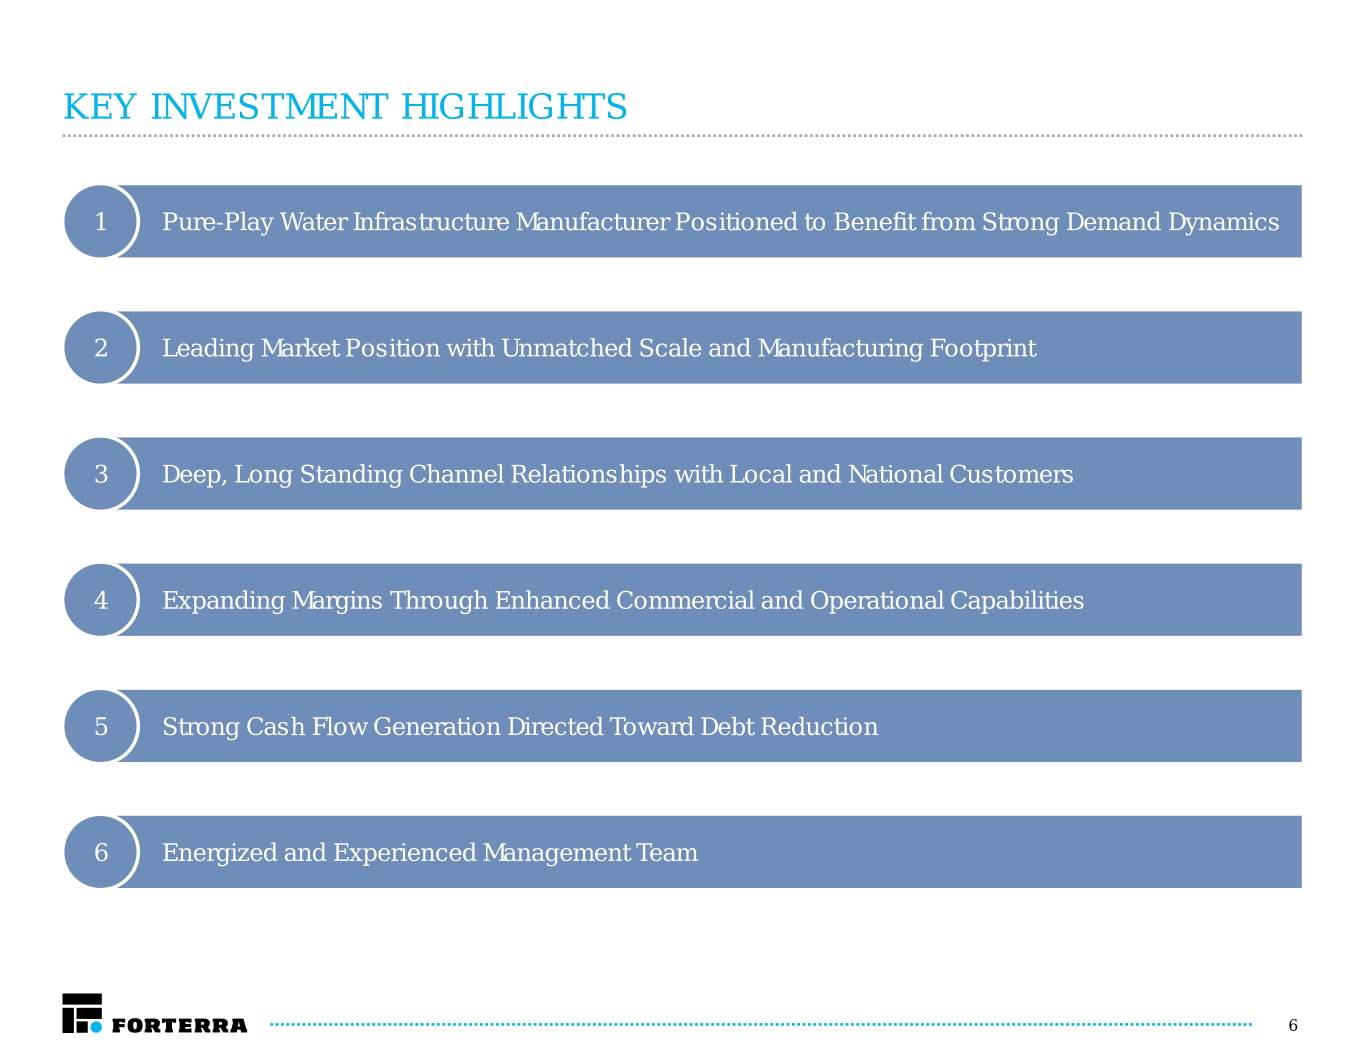
KEY INVESTMENT HIGHLIGHTS 1 Pure-Play Water Infrastructure Manufacturer Positioned to Benefit from Strong Demand Dynamics 2 Leading Market Position with Unmatched Scale and Manufacturing Footprint 3 Deep, Long Standing Channel Relationships with Local and National Customers 4 Expanding Margins Through Enhanced Commercial and Operational Capabilities 5 Strong Cash Flow Generation Directed Toward Debt Reduction 6 Energized and Experienced Management Team 6
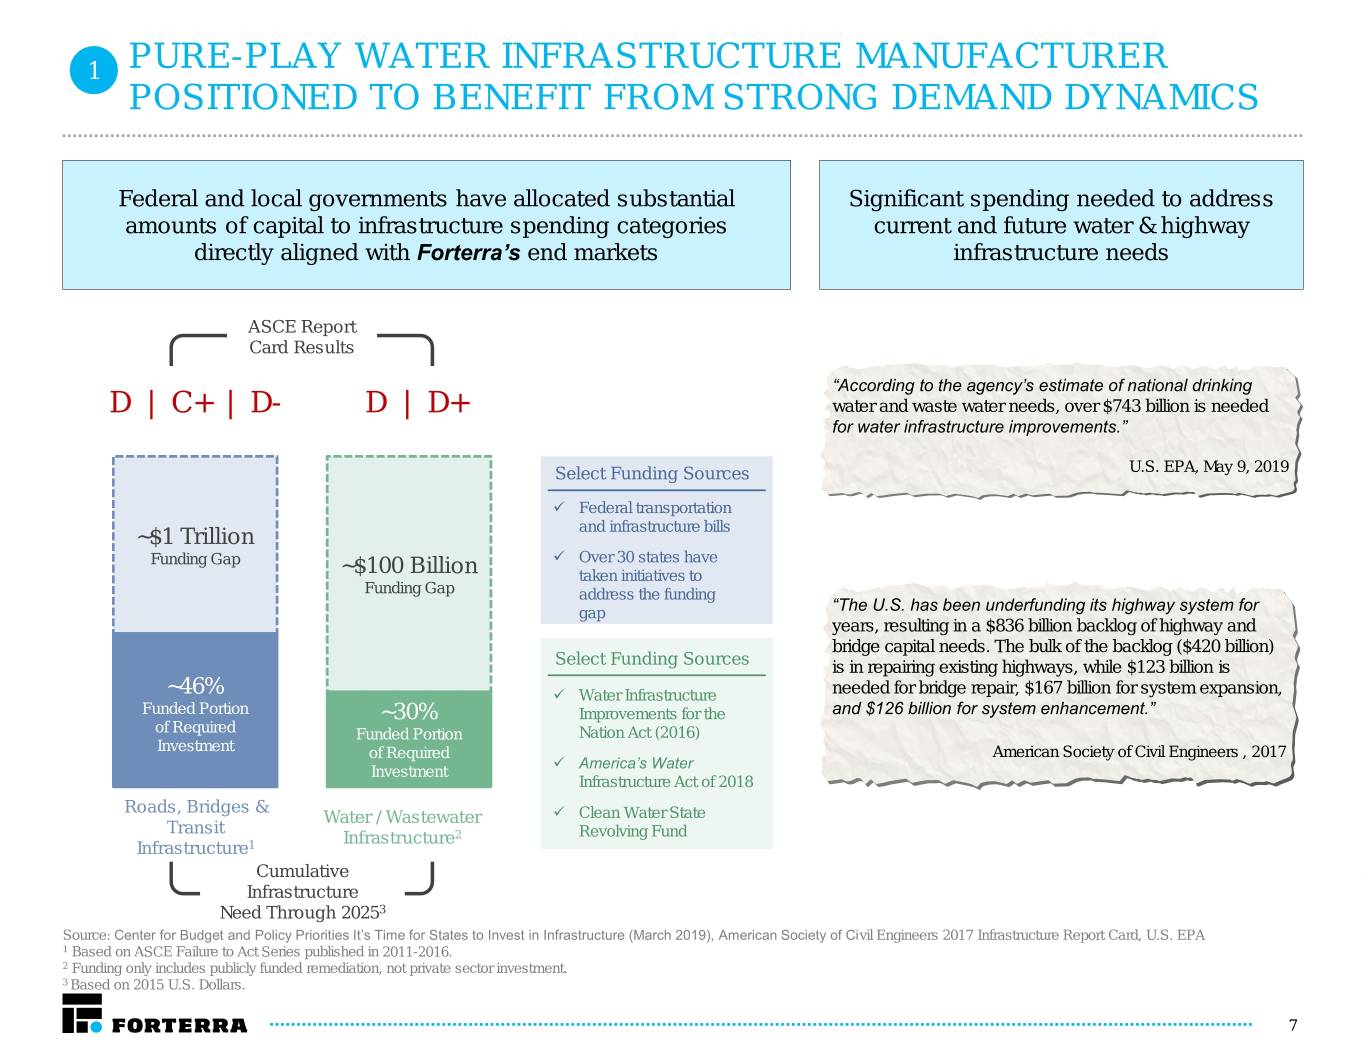
1 PURE-PLAY WATER INFRASTRUCTURE MANUFACTURER POSITIONED TO BENEFIT FROM STRONG DEMAND DYNAMICS Federal and local governments have allocated substantial Significant spending needed to address amounts of capital to infrastructure spending categories current and future water & highway directly aligned with Forterra’s end markets infrastructure needs ASCE Report Card Results “According to the agency’s estimate of national drinking D | C+ | D- D | D+ water and waste water needs, over $743 billion is needed for water infrastructure improvements.” Select Funding Sources U.S. EPA, May 9, 2019 Federal transportation ~$1 Trillion and infrastructure bills Funding Gap Over 30 states have ~$100 Billion taken initiatives to Funding Gap address the funding gap “The U.S. has been underfunding its highway system for years, resulting in a $836 billion backlog of highway and bridge capital needs. The bulk of the backlog ($420 billion) Select Funding Sources is in repairing existing highways, while $123 billion is ~46% Water Infrastructure needed for bridge repair, $167 billion for system expansion, Funded Portion ~30% Improvements for the and $126 billion for system enhancement.” of Required Funded Portion Nation Act (2016) Investment of Required American Society of Civil Engineers , 2017 America’s Water Investment Infrastructure Act of 2018 Roads, Bridges & Water / Wastewater Clean Water State Transit Infrastructure2 Revolving Fund Infrastructure1 Cumulative Infrastructure Need Through 20253 Source: Center for Budget and Policy Priorities It’s Time for States to Invest in Infrastructure (March 2019), American Society of Civil Engineers 2017 Infrastructure Report Card, U.S. EPA 1 Based on ASCE Failure to Act Series published in 2011-2016. 2 Funding only includes publicly funded remediation, not private sector investment. 3 Based on 2015 U.S. Dollars. 7
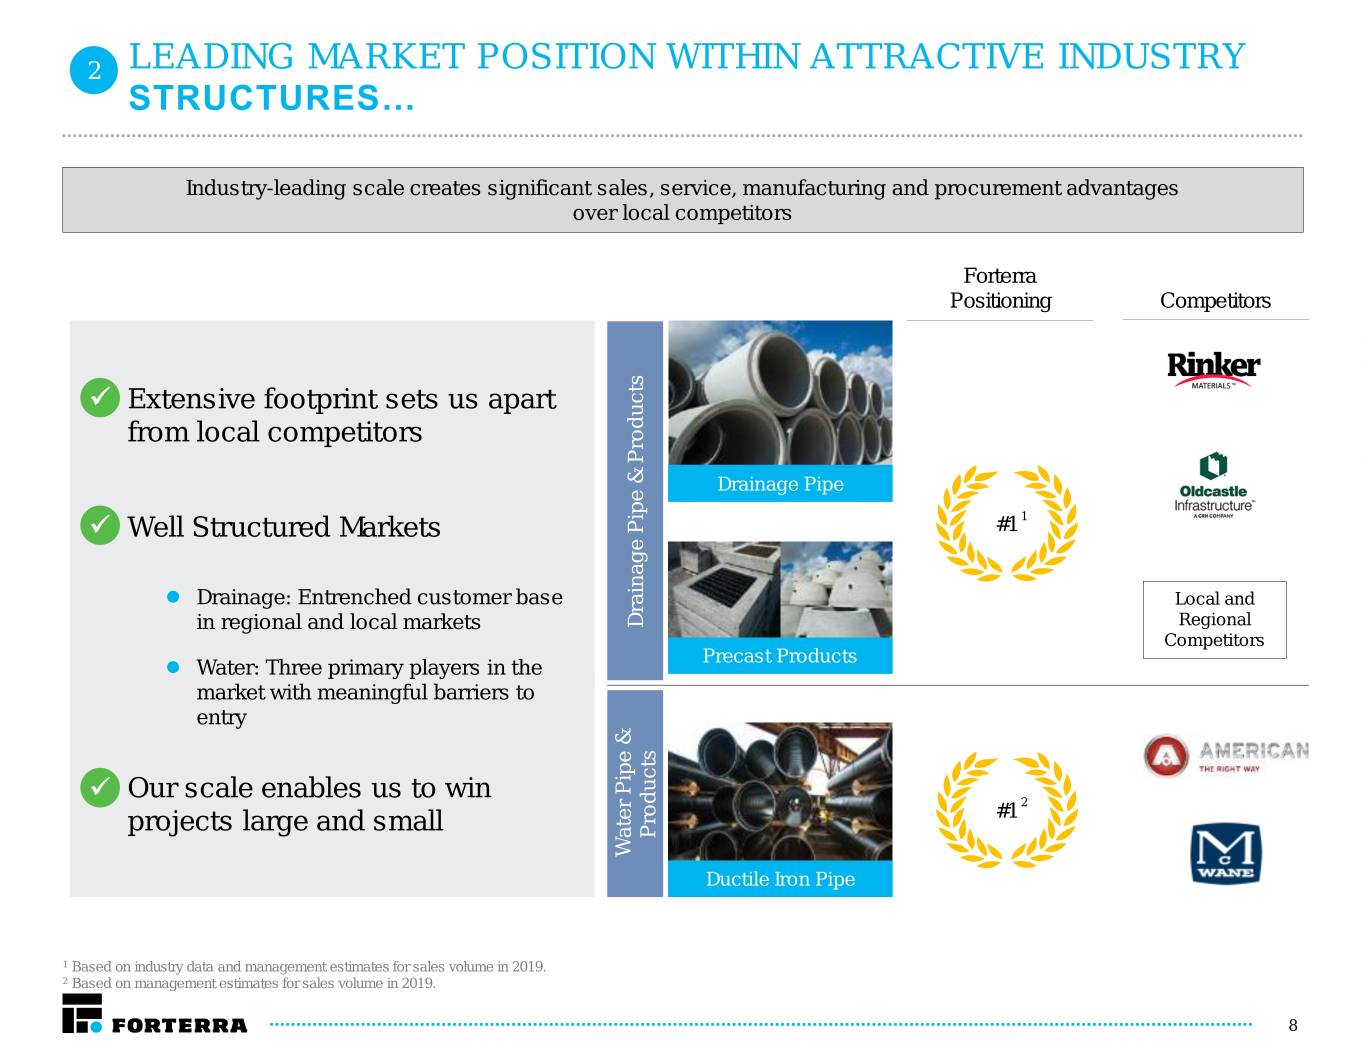
2 LEADING MARKET POSITION WITHIN ATTRACTIVE INDUSTRY STRUCTURES… Industry-leading scale creates significant sales, service, manufacturing and procurement advantages over local competitors Forterra Positioning Competitors Extensive footprint sets us apart from local competitors Drainage Pipe Well Structured Markets #1 1 Drainage: Entrenched customer base Local and in regional and local markets PipeProducts & Drainage Regional Competitors Precast Products Water: Three primary players in the market with meaningful barriers to entry Our scale enables us to win 2 projects large and small #1 Products Water Pipe & Water Ductile Iron Pipe 1 Based on industry data and management estimates for sales volume in 2019. 2 Based on management estimates for sales volume in 2019. 8
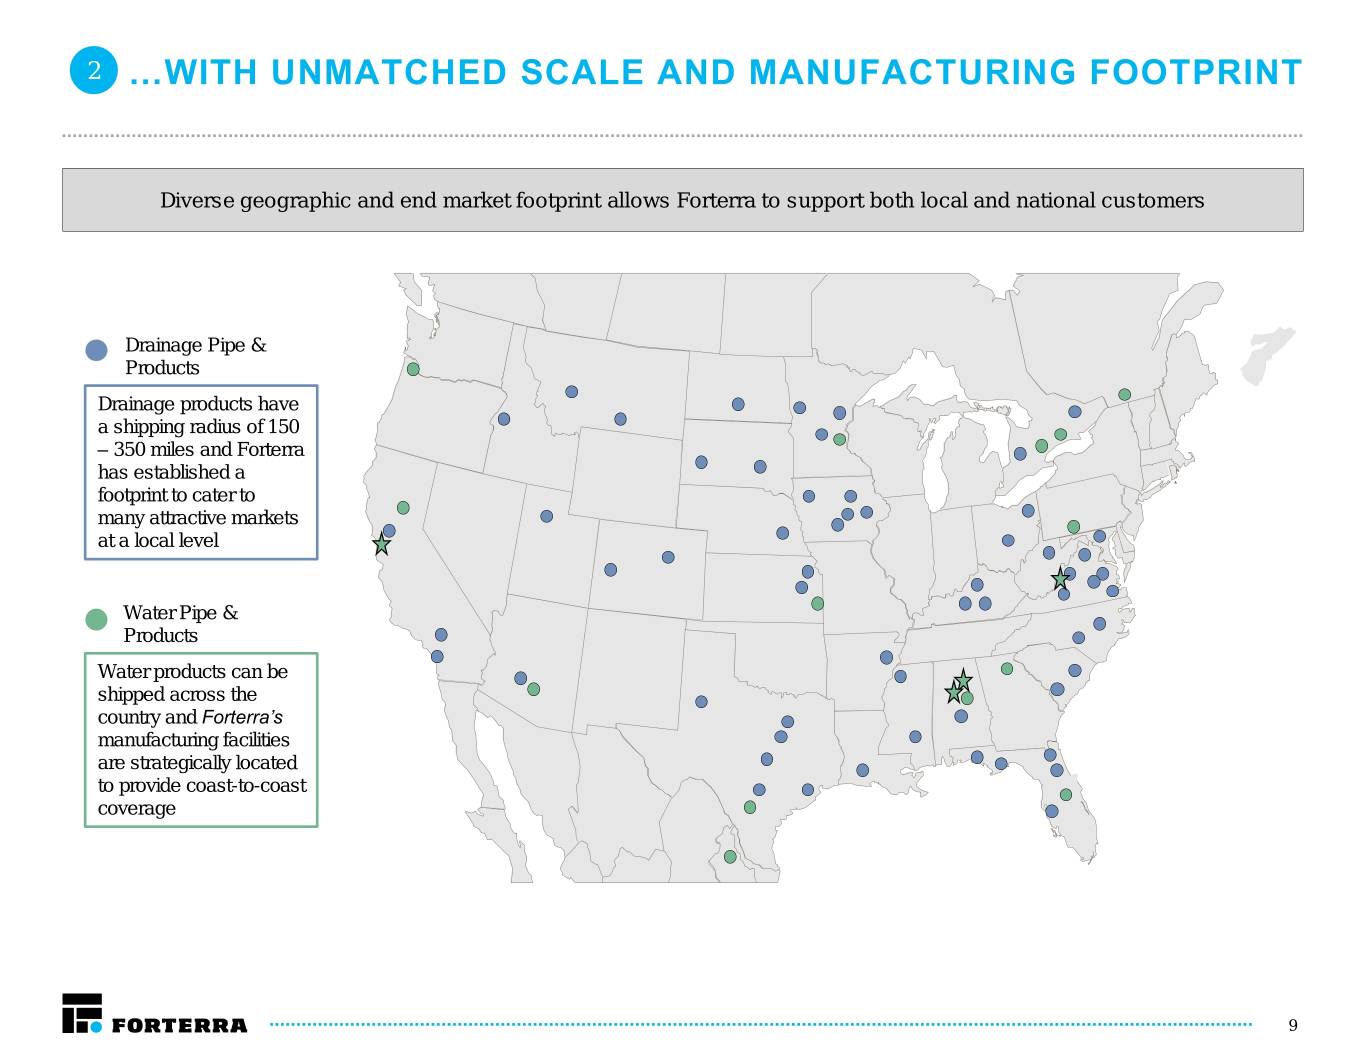
2 …WITH UNMATCHED SCALE AND MANUFACTURING FOOTPRINT Diverse geographic and end market footprint allows Forterra to support both local and national customers Drainage Pipe & Products Drainage products have a shipping radius of 150 – 350 miles and Forterra has established a footprint to cater to many attractive markets at a local level Water Pipe & Products Water products can be shipped across the country and Forterra’s manufacturing facilities are strategically located to provide coast-to-coast coverage 9
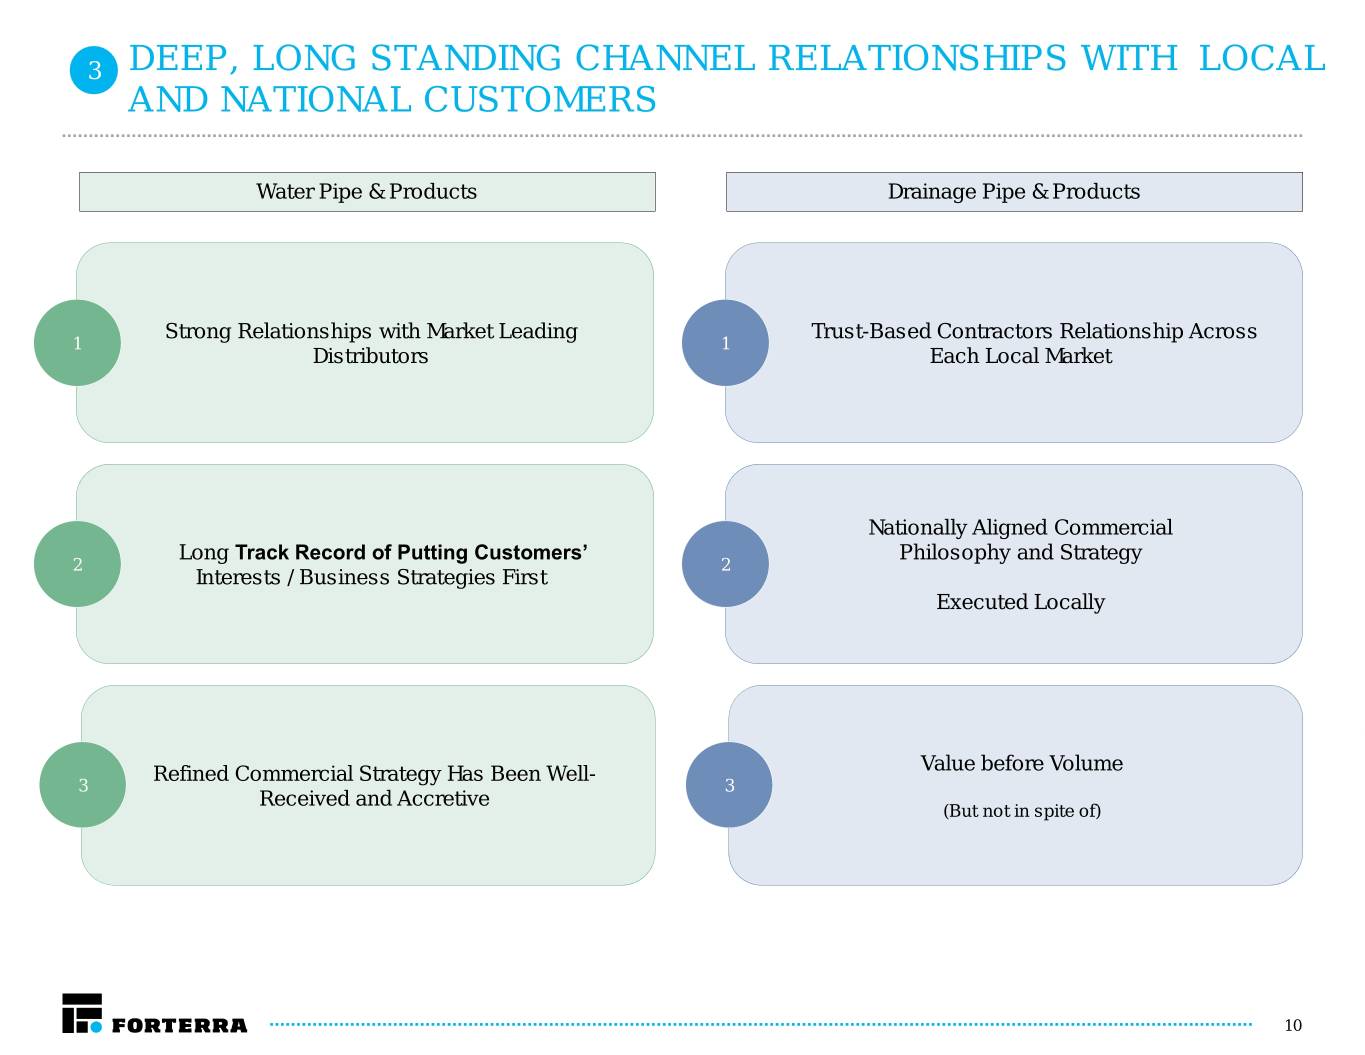
3 DEEP, LONG STANDING CHANNEL RELATIONSHIPS WITH LOCAL AND NATIONAL CUSTOMERS Water Pipe & Products Drainage Pipe & Products Strong Relationships with Market Leading Trust-Based Contractors Relationship Across 1 1 Distributors Each Local Market Nationally Aligned Commercial Long Track Record of Putting Customers’ Philosophy and Strategy 2 2 Interests / Business Strategies First Executed Locally Refined Commercial Strategy Has Been Well- Value before Volume 3 3 Received and Accretive (But not in spite of) 10
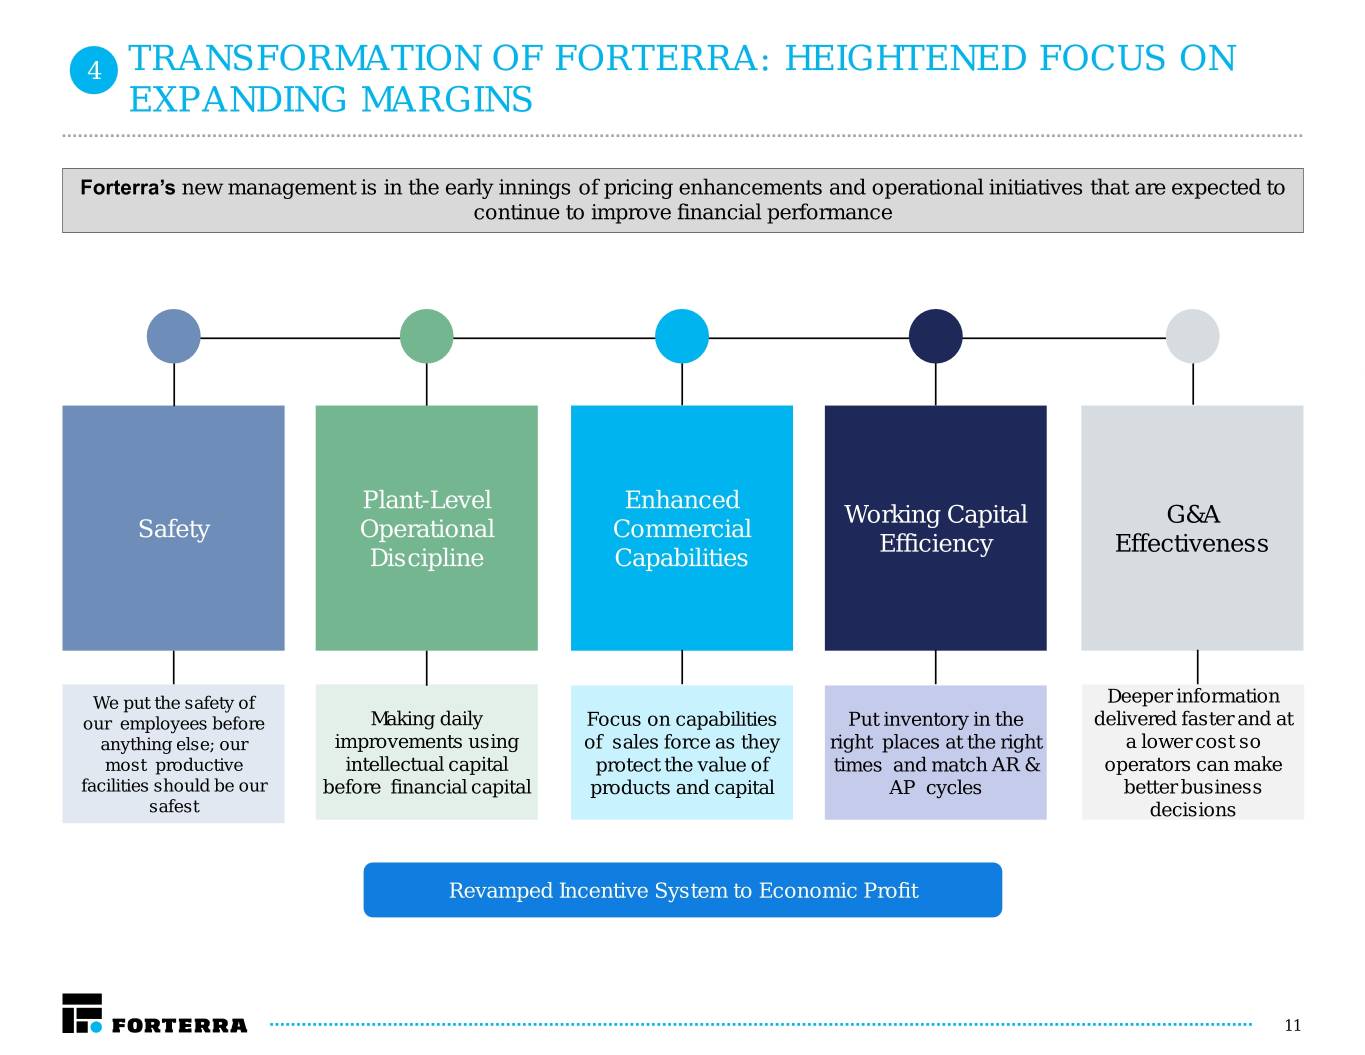
4 TRANSFORMATION OF FORTERRA: HEIGHTENED FOCUS ON EXPANDING MARGINS Forterra’s new management is in the early innings of pricing enhancements and operational initiatives that are expected to continue to improve financial performance Plant-Level Enhanced Working Capital G&A Safety Operational Commercial Efficiency Effectiveness Discipline Capabilities We put the safety of Deeper information our employees before Making daily Focus on capabilities Put inventory in the delivered faster and at anything else; our improvements using of sales force as they right places at the right a lower cost so most productive intellectual capital protect the value of times and match AR & operators can make facilities should be our before financial capital products and capital AP cycles better business safest decisions Revamped Incentive System to Economic Profit 11
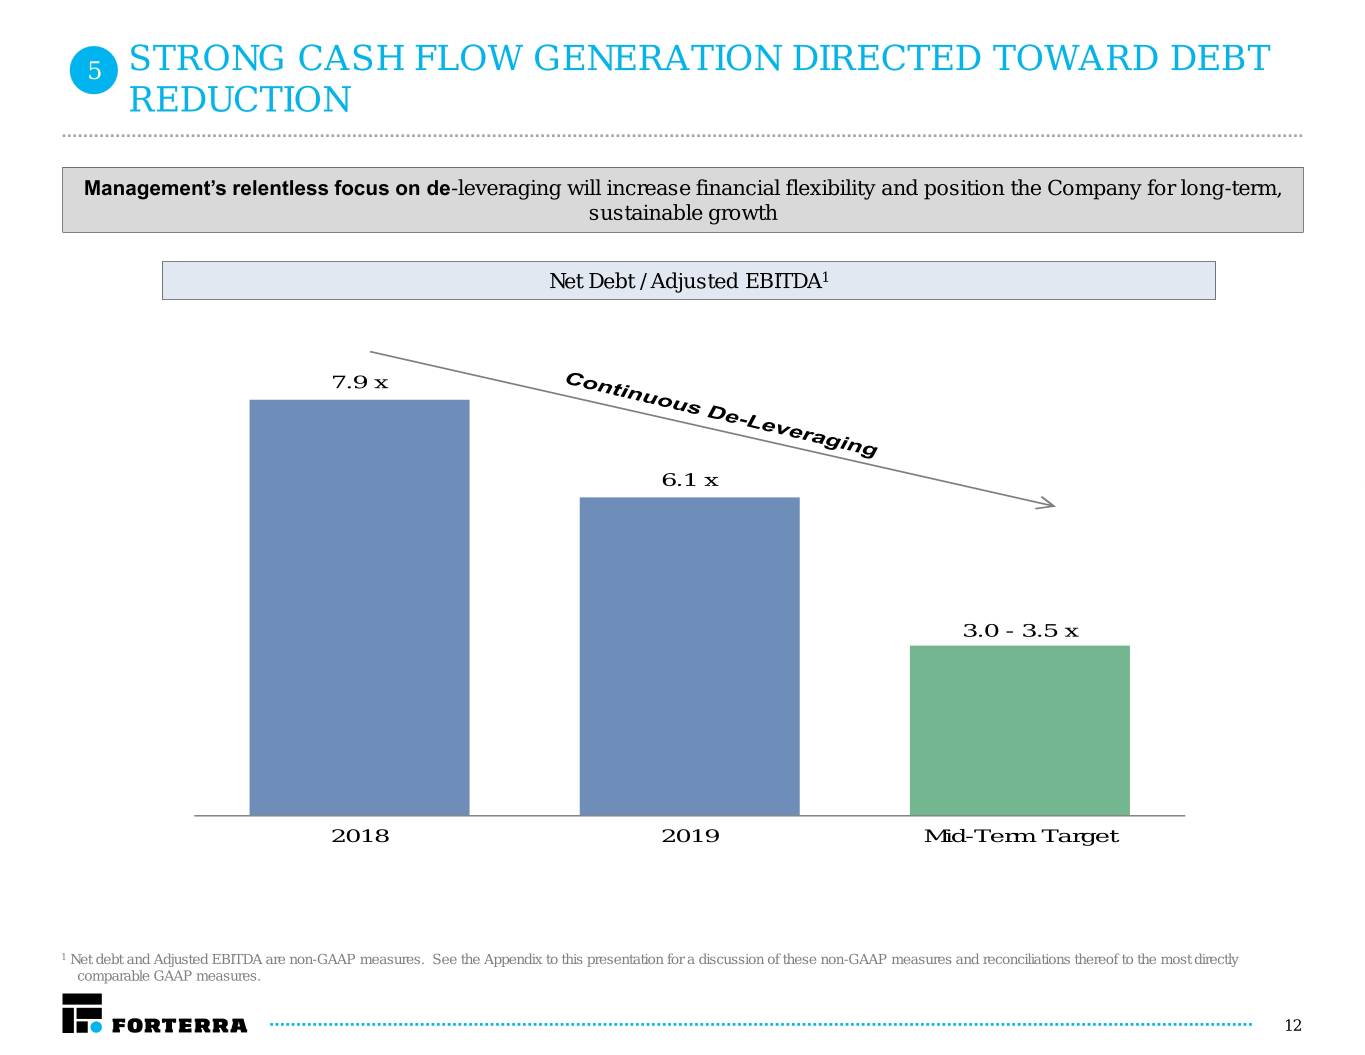
5 STRONG CASH FLOW GENERATION DIRECTED TOWARD DEBT REDUCTION Management’s relentless focus on de-leveraging will increase financial flexibility and position the Company for long-term, sustainable growth Net Debt / Adjusted EBITDA1 7.9 x 6.1 x 3.0 - 3.5 x 2018 2019 Mid-Term Target 1 Net debt and Adjusted EBITDA are non-GAAP measures. See the Appendix to this presentation for a discussion of these non-GAAP measures and reconciliations thereof to the most directly comparable GAAP measures. 12
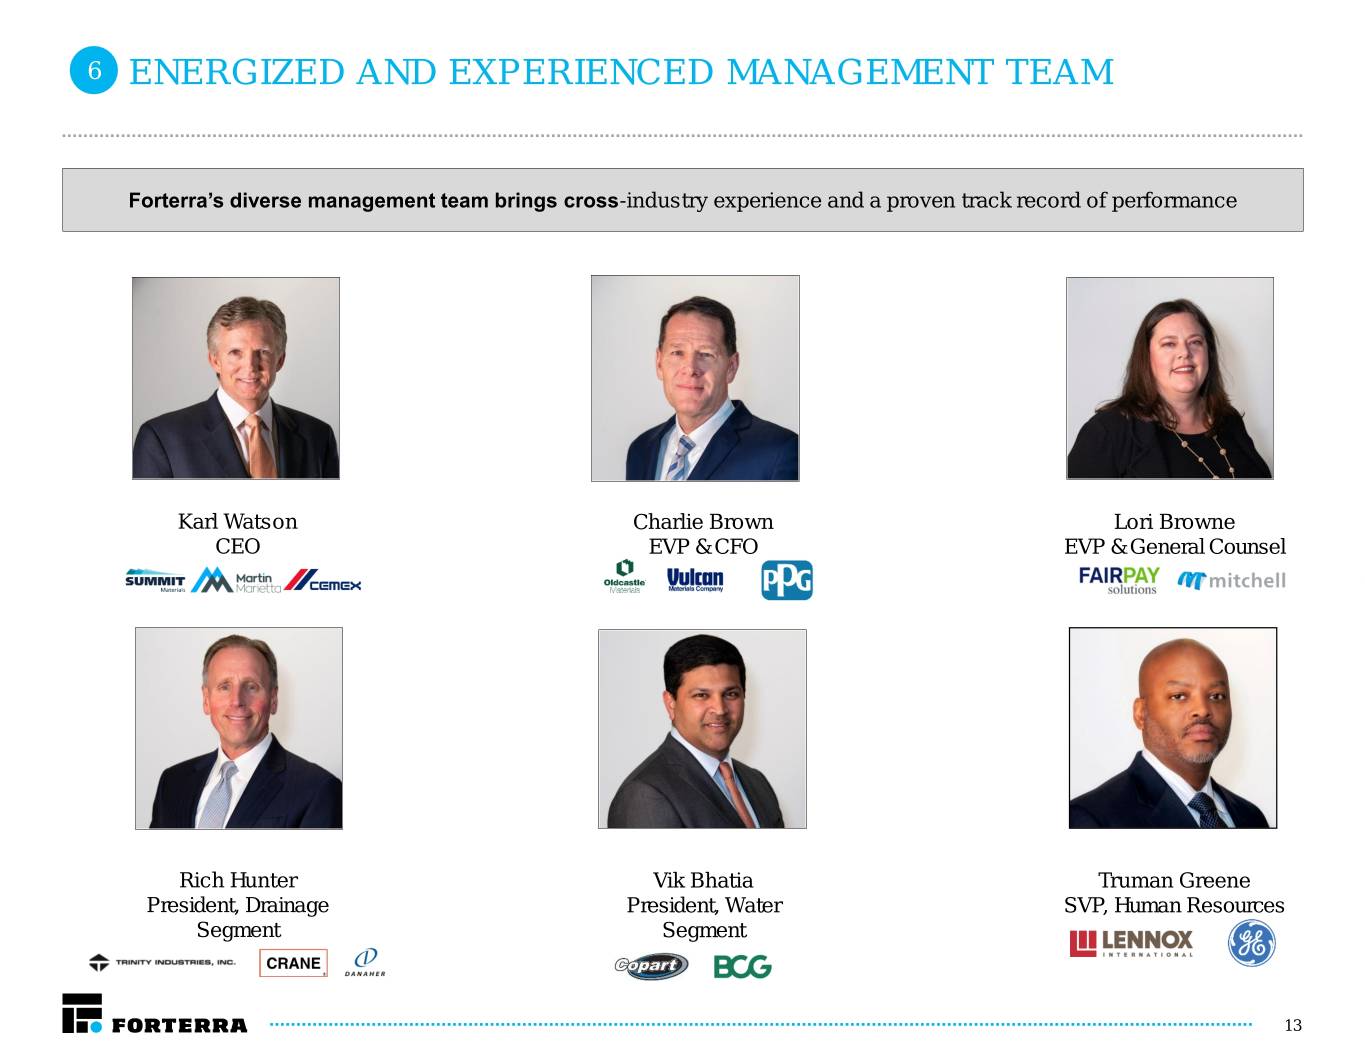
6 ENERGIZED AND EXPERIENCED MANAGEMENT TEAM Forterra’s diverse management team brings cross-industry experience and a proven track record of performance Karl Watson Charlie Brown Lori Browne CEO EVP & CFO EVP & General Counsel Rich Hunter Vik Bhatia Truman Greene President, Drainage President, Water SVP, Human Resources Segment Segment 13

Financial Results Overview
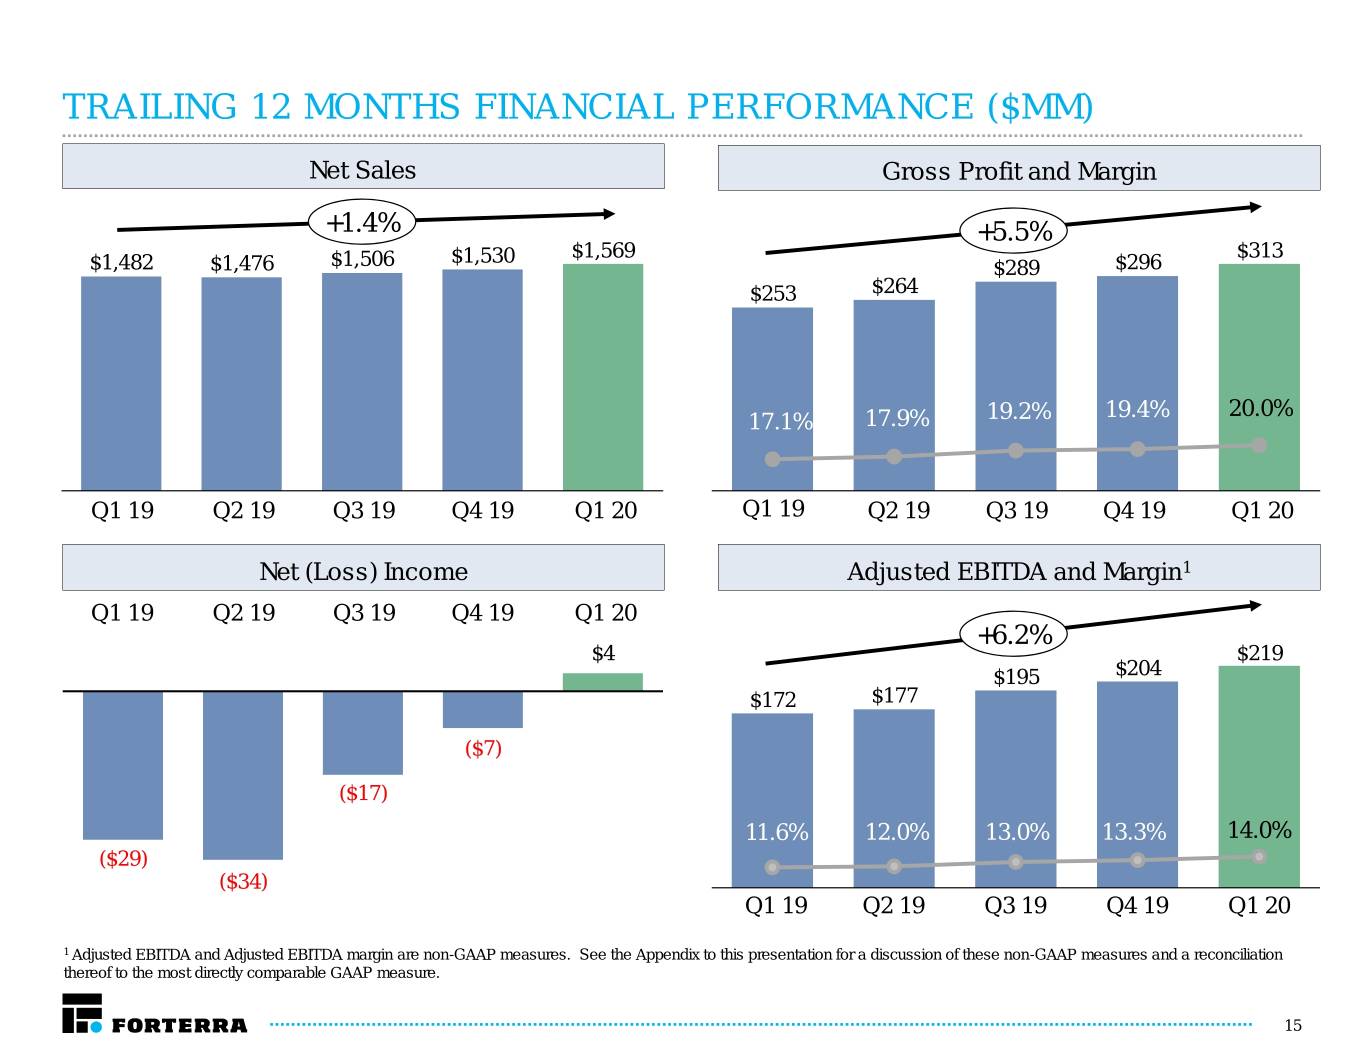
TRAILING 12 MONTHS FINANCIAL PERFORMANCE ($MM) Net Sales Gross Profit and Margin +1.4% +5.5% $1,530 $1,569 $313 $1,482 $1,476 $1,506 $289 $296 $253 $264 19.4% 20.0% 17.1% 17.9% 19.2% Q1 19 Q2 19 Q3 19 Q4 19 Q1 20 Q1 19 Q2 19 Q3 19 Q4 19 Q1 20 Net (Loss) Income Adjusted EBITDA and Margin1 Q1 19 Q2 19 Q3 19 Q4 19 Q1 20 +6.2% $4 $219 $195 $204 $172 $177 ($7) ($17) 11.6% 12.0% 13.0% 13.3% 14.0% ($29) ($34) 11.6% Q1 19 Q2 19 Q3 19 Q4 19 Q1 20 1 Adjusted EBITDA and Adjusted EBITDA margin are non-GAAP measures. See the Appendix to this presentation for a discussion of these non-GAAP measures and a reconciliation thereof to the most directly comparable GAAP measure. 15
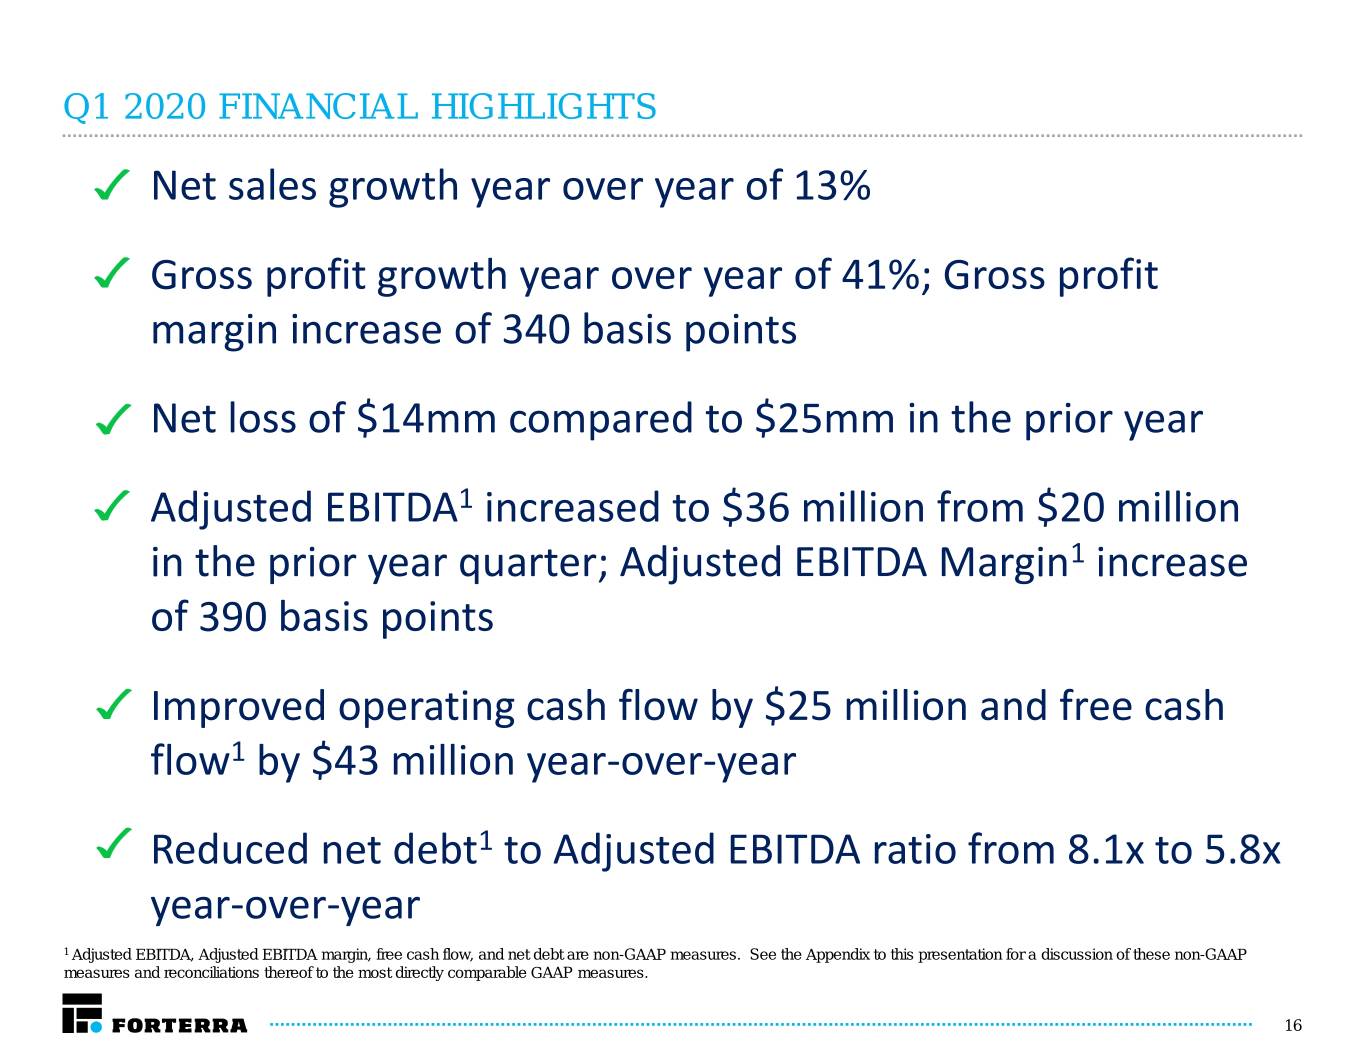
Q1 2020 FINANCIAL HIGHLIGHTS Net sales growth year over year of 13% Gross profit growth year over year of 41%; Gross profit margin increase of 340 basis points Net loss of $14mm compared to $25mm in the prior year Adjusted EBITDA1 increased to $36 million from $20 million in the prior year quarter; Adjusted EBITDA Margin1 increase of 390 basis points Improved operating cash flow by $25 million and free cash flow1 by $43 million year-over-year Reduced net debt1 to Adjusted EBITDA ratio from 8.1x to 5.8x year-over-year 1 Adjusted EBITDA, Adjusted EBITDA margin, free cash flow, and net debt are non-GAAP measures. See the Appendix to this presentation for a discussion of these non-GAAP measures and reconciliations thereof to the most directly comparable GAAP measures. 16
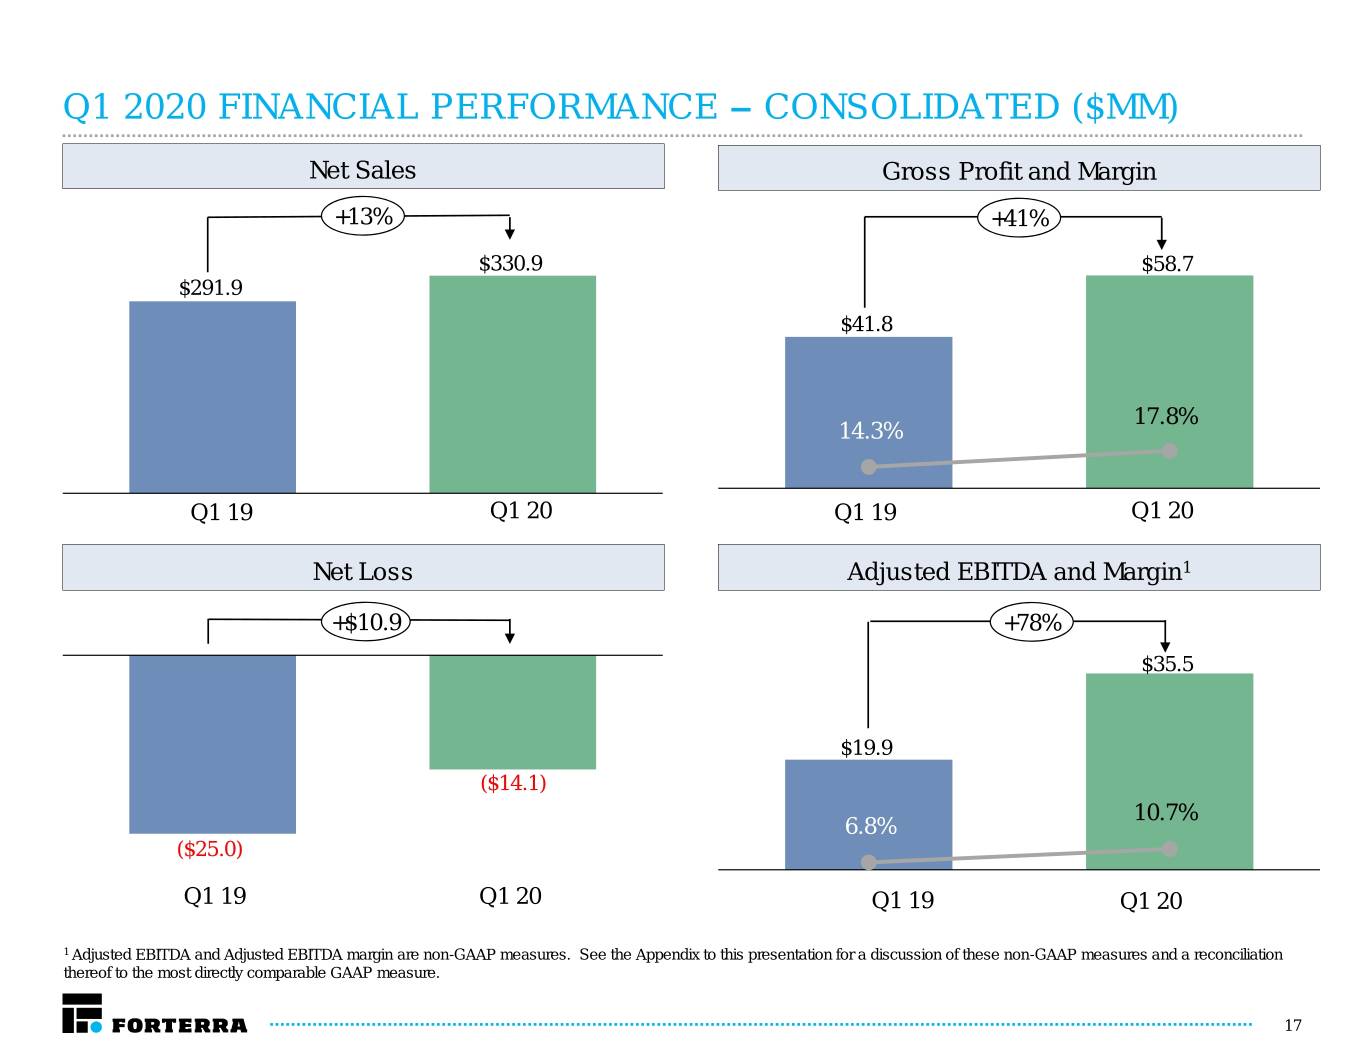
Q1 2020 FINANCIAL PERFORMANCE – CONSOLIDATED ($MM) Net Sales Gross Profit and Margin +13% +41% $330.9 $58.7 $291.9 $41.8 17.8% 14.3% Q1 19 Q1 20 Q1 19 Q1 20 Net Loss Adjusted EBITDA and Margin1 +$10.9 +78% $35.5 $19.9 ($14.1) 10.7% 6.8% ($25.0) Q1 19 Q1 20 6.8%Q1 19 Q1 20 1 Adjusted EBITDA and Adjusted EBITDA margin are non-GAAP measures. See the Appendix to this presentation for a discussion of these non-GAAP measures and a reconciliation thereof to the most directly comparable GAAP measure. 17
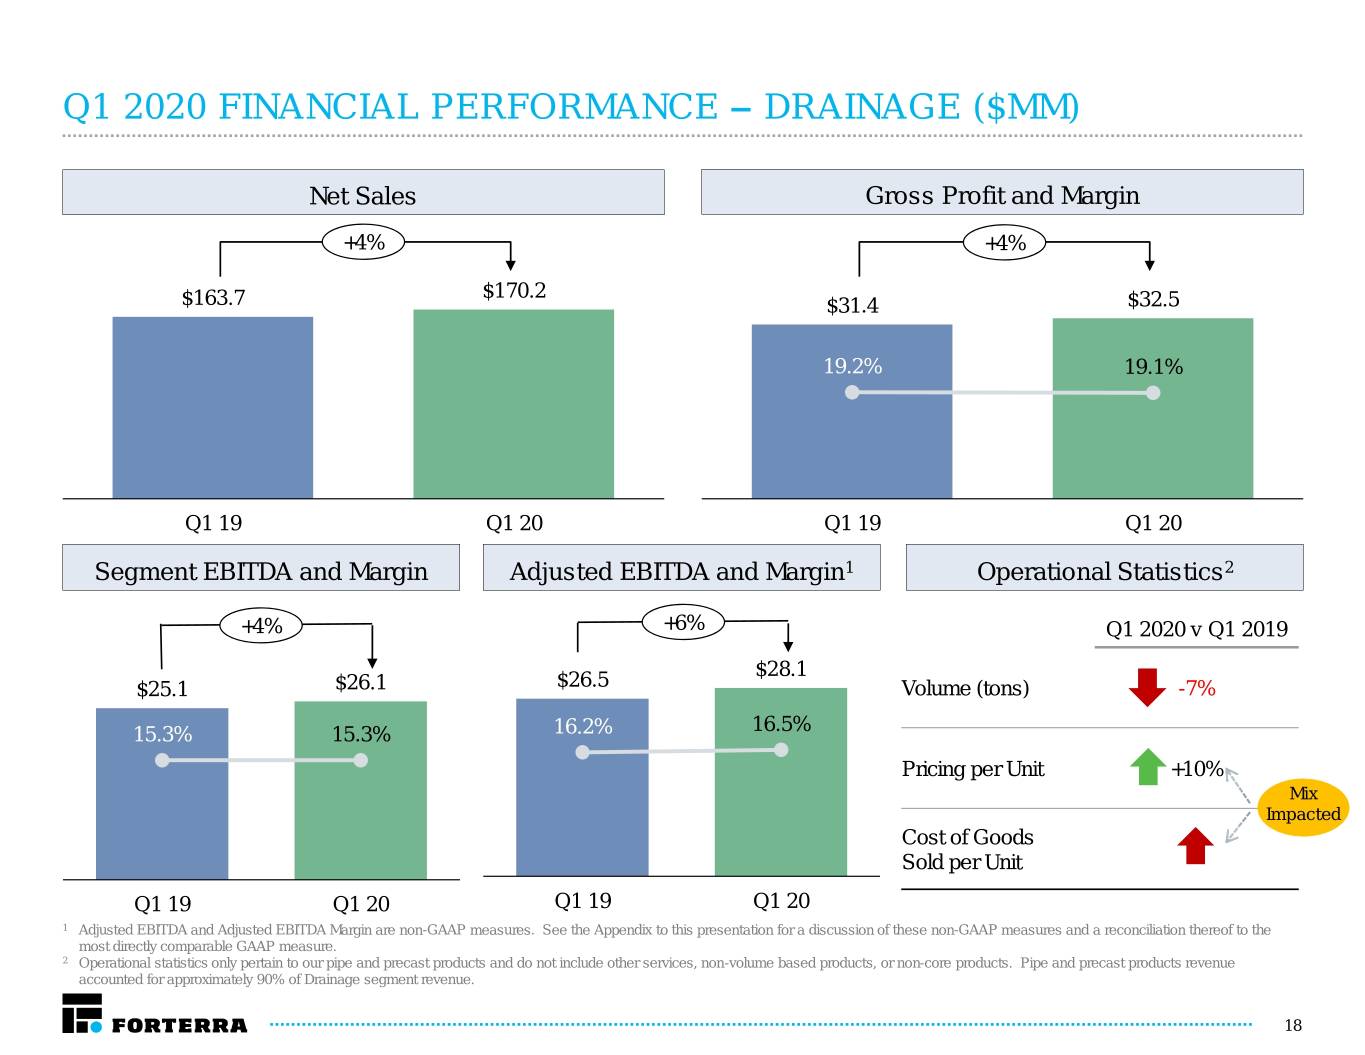
Q1 2020 FINANCIAL PERFORMANCE – DRAINAGE ($MM) Net Sales Gross Profit and Margin +4% +4% $170.2 $163.7 $31.4 $32.5 19.2% 19.1% Q1 19 Q1 20 Q1 19 Q1 20 Segment EBITDA and Margin Adjusted EBITDA and Margin1 Operational Statistics2 +4% +6% Q1 2020 v Q1 2019 $28.1 $25.1 $26.1 $26.5 Volume (tons) -7% 15.3% 15.3% 16.2% 16.5% Pricing per Unit +10% Mix Impacted Cost of Goods Sold per Unit Q1 19 Q1 20 Q1 19 Q1 20 1 Adjusted EBITDA and Adjusted EBITDA Margin are non-GAAP measures. See the Appendix to this presentation for a discussion of these non-GAAP measures and a reconciliation thereof to the most directly comparable GAAP measure. 2 Operational statistics only pertain to our pipe and precast products and do not include other services, non-volume based products, or non-core products. Pipe and precast products revenue accounted for approximately 90% of Drainage segment revenue. 18
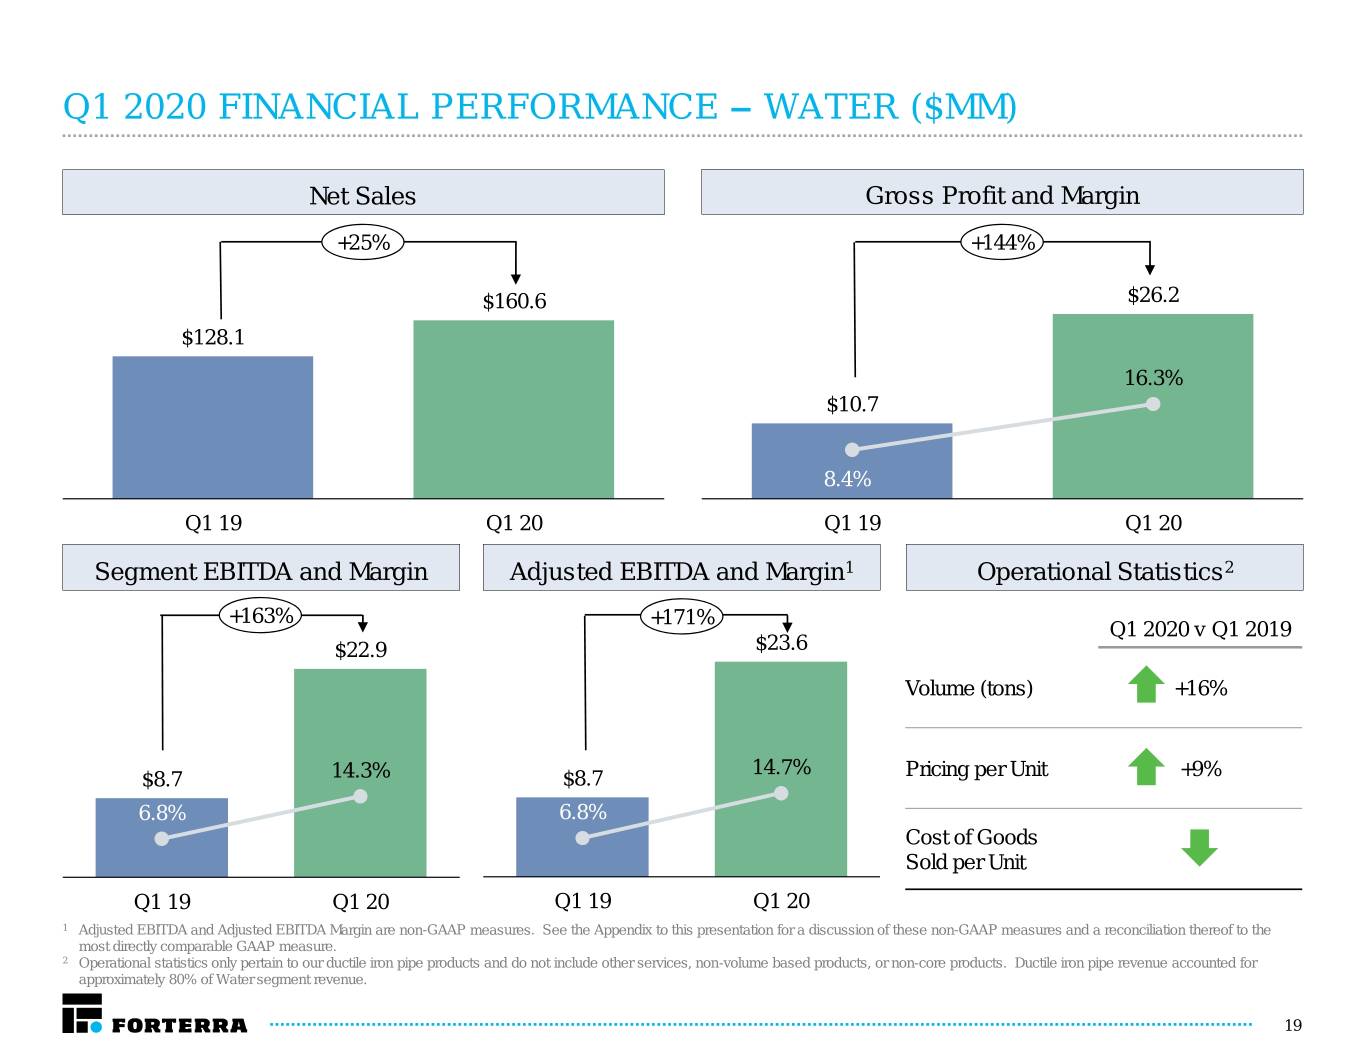
Q1 2020 FINANCIAL PERFORMANCE – WATER ($MM) Net Sales Gross Profit and Margin +25% +144% $160.6 $26.2 $128.1 16.3% $10.7 8.4% Q1 19 Q1 20 Q1 19 Q1 20 Segment EBITDA and Margin Adjusted EBITDA and Margin1 Operational Statistics2 +163% +171% Q1 2020 v Q1 2019 $22.9 $23.6 Volume (tons) +16% 14.7% $8.7 14.3% $8.7 Pricing per Unit +9% 6.8% 6.8% Cost of Goods Sold per Unit Q1 19 Q1 20 Q1 19 Q1 20 1 Adjusted EBITDA and Adjusted EBITDA Margin are non-GAAP measures. See the Appendix to this presentation for a discussion of these non-GAAP measures and a reconciliation thereof to the most directly comparable GAAP measure. 2 Operational statistics only pertain to our ductile iron pipe products and do not include other services, non-volume based products, or non-core products. Ductile iron pipe revenue accounted for approximately 80% of Water segment revenue. 19

Q1 2020 FINANCIAL PERFORMANCE – FREE CASH FLOW ($MM) Free Cash Flow ($mm) (1) Q1 2019 Q1 2020 Δ Adjusted EBITDA (1) $19.9 $35.6 $15.7 Working Capital (43.5) (39.3) 4.2 Cash Interest (19.0) (17.1) 1.9 Cash Tax Refunds (Payments) (1.2) 0.1 1.3 Other (0.2) 1.5 1.7 Net Cash Used in Operating Activities ($44.0) ($19.2) $24.8 Purchase of property, plant and equipment and intangible assets (22.9) (4.3) 18.6 Proceeds from sale of fixed assets 0.2 0.0 (0.2) Free Cash Flow ($66.7) ($23.5) $43.2 1 Adjusted EBITDA and free cash flow are non-GAAP measures. See the Appendix to this presentation for a discussion of these non-GAAP measures and reconciliations thereof to the most directly comparable GAAP measures. 20
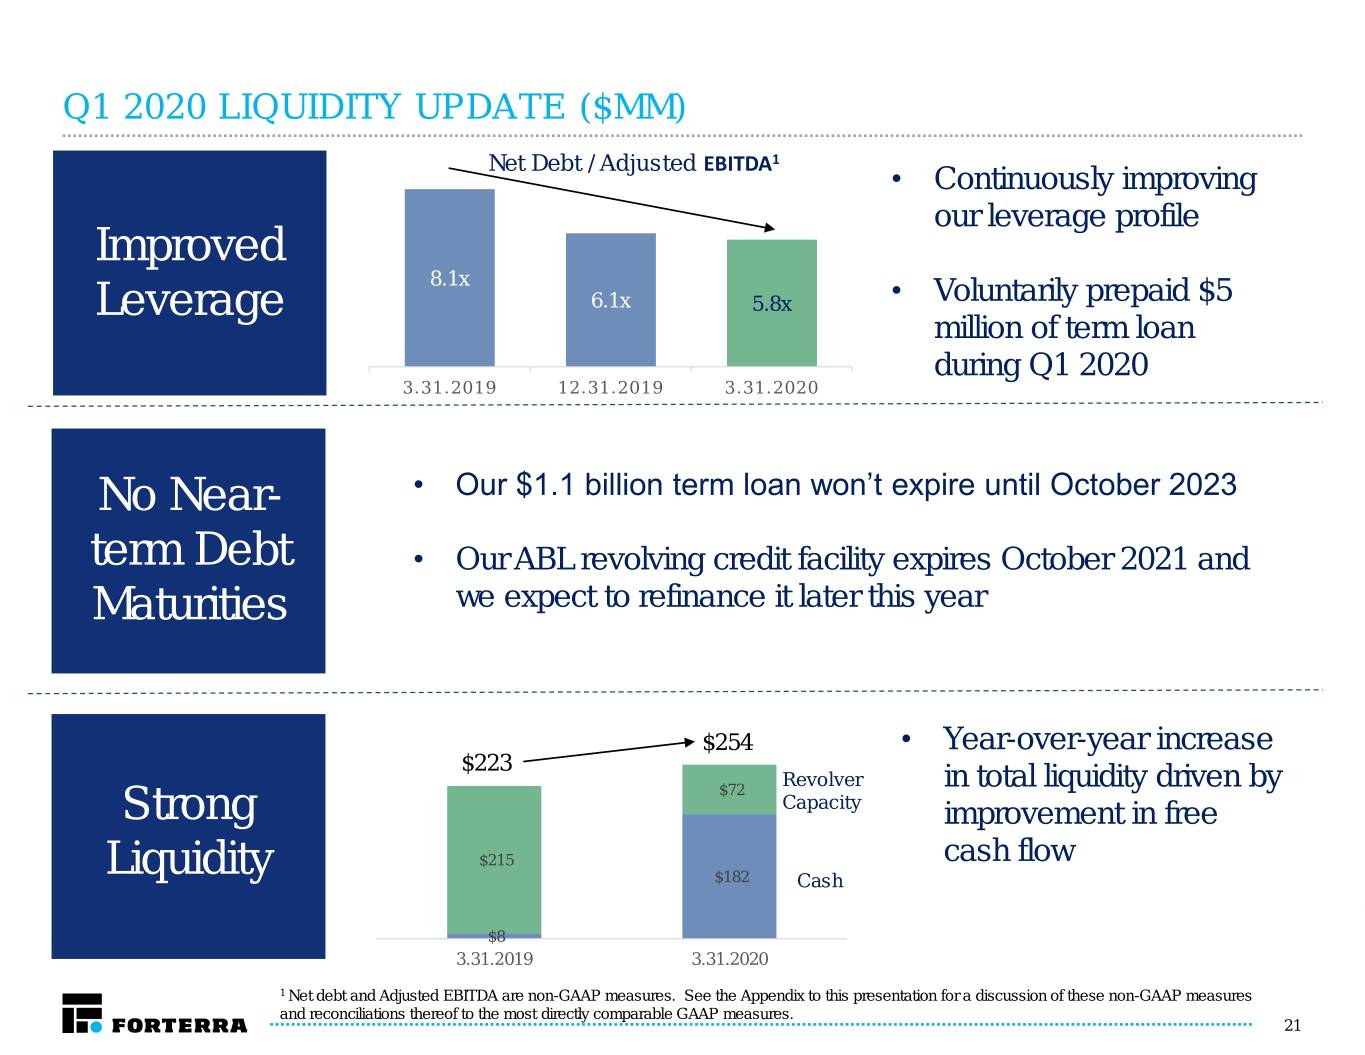
Q1 2020 LIQUIDITY UPDATE ($MM) Net Debt / Adjusted 1 EBITDA • Continuously improving our leverage profile Improved 8.1x • Voluntarily prepaid $5 Leverage 6.1x 5.8x million of term loan during Q1 2020 3.31.2019 12.31.2019 3.31.2020 No Near- • Our $1.1 billion term loan won’t expire until October 2023 term Debt • Our ABL revolving credit facility expires October 2021 and Maturities we expect to refinance it later this year $254 • Year-over-year increase $223 Revolver $72 in total liquidity driven by Strong Capacity improvement in free $215 cash flow Liquidity $182 Cash $8 3.31.2019 3.31.2020 1 Net debt and Adjusted EBITDA are non-GAAP measures. See the Appendix to this presentation for a discussion of these non-GAAP measures and reconciliations thereof to the most directly comparable GAAP measures. 21
Appendix: Non-GAAP Financial Measures
APPENDIX: NON-GAAP FINANCIAL MEASURES In addition to our results calculated under generally accepted accounting principles in the United States ("GAAP"), in this presentation we also present Adjusted EBITDA and Adjusted EBITDA margin. Adjusted EBITDA and Adjusted EBITDA margin are non-GAAP measures and have been presented in this presentation as supplemental measures of financial performance that are not required by, or presented in accordance with GAAP. We calculate Adjusted EBITDA as the sum of net income (loss), before interest expense (including (gains) losses from extinguishment of debt), depreciation and amortization, income tax benefit (expense) and before (gains) losses on the sale of property, plant and equipment, impairment and exit charges and certain other non-recurring income and expenses, such as transaction costs, inventory step-up impacting margin, non- cash compensation expense and pro-rate share of Adjusted EBITDA from equity method investee, minus earnings from equity method investee. Adjusted EBITDA margin represents Adjusted EBITDA as a percentage of net sales. Adjusted EBITDA and Adjusted EBITDA margin are presented in this presentation because they are important metrics used by management as one of the means by which it assesses our financial performance. Adjusted EBITDA and Adjusted EBITDA margin are also frequently used by analysts, investors and other interested parties to evaluate companies in our industry. We use Adjusted EBITDA and Adjusted EBITDA margin as supplements to GAAP measures of performance to evaluate the effectiveness of our business strategies, to make budgeting decisions, to allocate resources and to compare our performance relative to our peers. Adjusted EBITDA and Adjusted EBITDA margin are also important measures for assessing our operating results and evaluating each operating segment’s performance on a consistent basis, by excluding the impacts of depreciation, amortization, income tax expense, interest expense and other items not indicative of ongoing operating performance. Additionally, these measures, when used in conjunction with related GAAP financial measures, provide investors with additional financial analytical framework which management uses, in addition to historical operating results, as the basis for financial, operational and planning decisions and present measurements that third parties have indicated are useful in assessing the Company and its results of operations. Adjusted EBITDA and Adjusted EBITDA margin have certain limitations. Adjusted EBITDA should not be considered as an alternative to consolidated net income (loss), and in the case of our segment results, Adjusted EBITDA should not be considered an alternative to EBITDA, which the chief operating decision maker reviews for purposes of evaluating segment profit, or in the case of any of the non-GAAP measures, as a substitute for any other measure of financial performance calculated in accordance with GAAP. Similarly, Adjusted EBITDA margin should not be considered as an alternative to gross margin or any other margin calculated in accordance with GAAP. These measures also should not be construed as an inference that our future results will be unaffected by unusual or nonrecurring items for which these non-GAAP measures make adjustments. Additionally, Adjusted EBITDA and Adjusted EBITDA margin are not intended to be liquidity measures because of certain limitations such as: (i) they do not reflect our cash outlays for capital expenditures or future contractual commitments; (ii) they do not reflect changes in, or cash requirements for, working capital; (iii) they do not reflect interest expense, or the cash requirements necessary to service interest, or principal payments, on indebtedness; (iv) they do not reflect income tax expense or the cash necessary to pay income taxes; and (v) although depreciation and amortization are non-cash charges, the assets being depreciated and amortized will often have to be replaced in the future, and these non-GAAP measures do not reflect cash requirements for such replacements. This Presentation also includes free cash flow, a non-GAAP liquidity measure that represents cash flow from operating activities, less capital expenditure, net of proceeds from asset disposal. Management uses free cash flow, and ratios based on it, as one of the means by which it assesses available liquidity for strategic opportunities and other discretionary investment, and it is therefore useful to investors in evaluating our business using the same measures as management. Free cash flow is also useful to investors because it is often used by securities analysts and other interested parties in evaluating our operating results. Free cash flow does however have certain limitations due to the fact that it does not represent the total increase or decrease in the cash, cash equivalents and investments balance for the period nor does it represent the residual cash flow available for discretionary expenditures. Therefore, free cash flow should not be considered as an alternative to or in isolation from net cash flows from operating activities or any other measure of cash flow calculated in accordance with GAAP. Other companies, including other companies in our industry, may not use such measures or may calculate one or more of the measures differently than as presented in this presentation, limiting their usefulness as a comparative measure. In evaluating Adjusted EBITDA and Adjusted EBITDA margin, you should be aware that in the future we will incur expenses that are the same as or similar to some of the adjustments made in the calculations below and the presentation of Adjusted EBITDA and Adjusted EBITDA margin should not be construed to mean that our future results will be unaffected by such adjustments. Management compensates for these limitations by using Adjusted EBITDA and Adjusted EBITDA margin as supplemental financial metrics and in conjunction with results prepared in accordance with GAAP. 23

ADJUSTED EBITDA RECONCILIATION – THREE MONTHS ENDED MARCH 31, 2020 AND MARCH 31, 2019 ($ in thousands) Q1 2019 Q1 2020 Net Loss ($25,039) ($14,066) Interest expense 24,665 20,745 Depreciation & amortization 24,392 22,501 Income tax (benefit) expense (7,297) 78 EBITDA 1 16,721 29,258 (Gain) loss on sale of property, plant & equipment, net (53) 36 Loss on extinguishment of debt — 50 Impairment & exit charges 2 231 824 Transaction costs 3 420 1,458 Inventory step-up impacting margin 4 93 — Non-cash compensation 5 1,529 2,864 Earnings from equity method investee 6 (1,567) (2,799) Pro-rate share of Adjusted EBITDA from equity method investee 7 2,536 3,772 Adjusted EBITDA $19,910 $35,463 % Margin 6.8% 10.7% 1. For purposes of evaluating segment profit, the Company's chief operating decision maker reviews EBITDA as a basis for making the decisions to allocate resources and assess performance. 2. Impairment of goodwill and long-lived assets and other exit and disposal costs. 3. Legal, valuation, accounting, advisory and other costs related to business combinations and other transactions. 4. Effect of the purchase accounting step-up in the value of inventory to fair value recognized in cost of goods sold as a result of business combinations. 5. Non-cash equity compensation expense. 6. Net income from Forterra's 50% ownership in the Concrete Pipe & Precast LLC ("CP&P") joint venture accounted for under the equity method of accounting. 7. Adjusted EBITDA from Forterra's 50% ownership in the CP&P joint venture. Calculated as CP&P net income adjusted primarily to add back Forterra's pro- rata portion of CP&P's depreciation and amortization and interest expense. 24
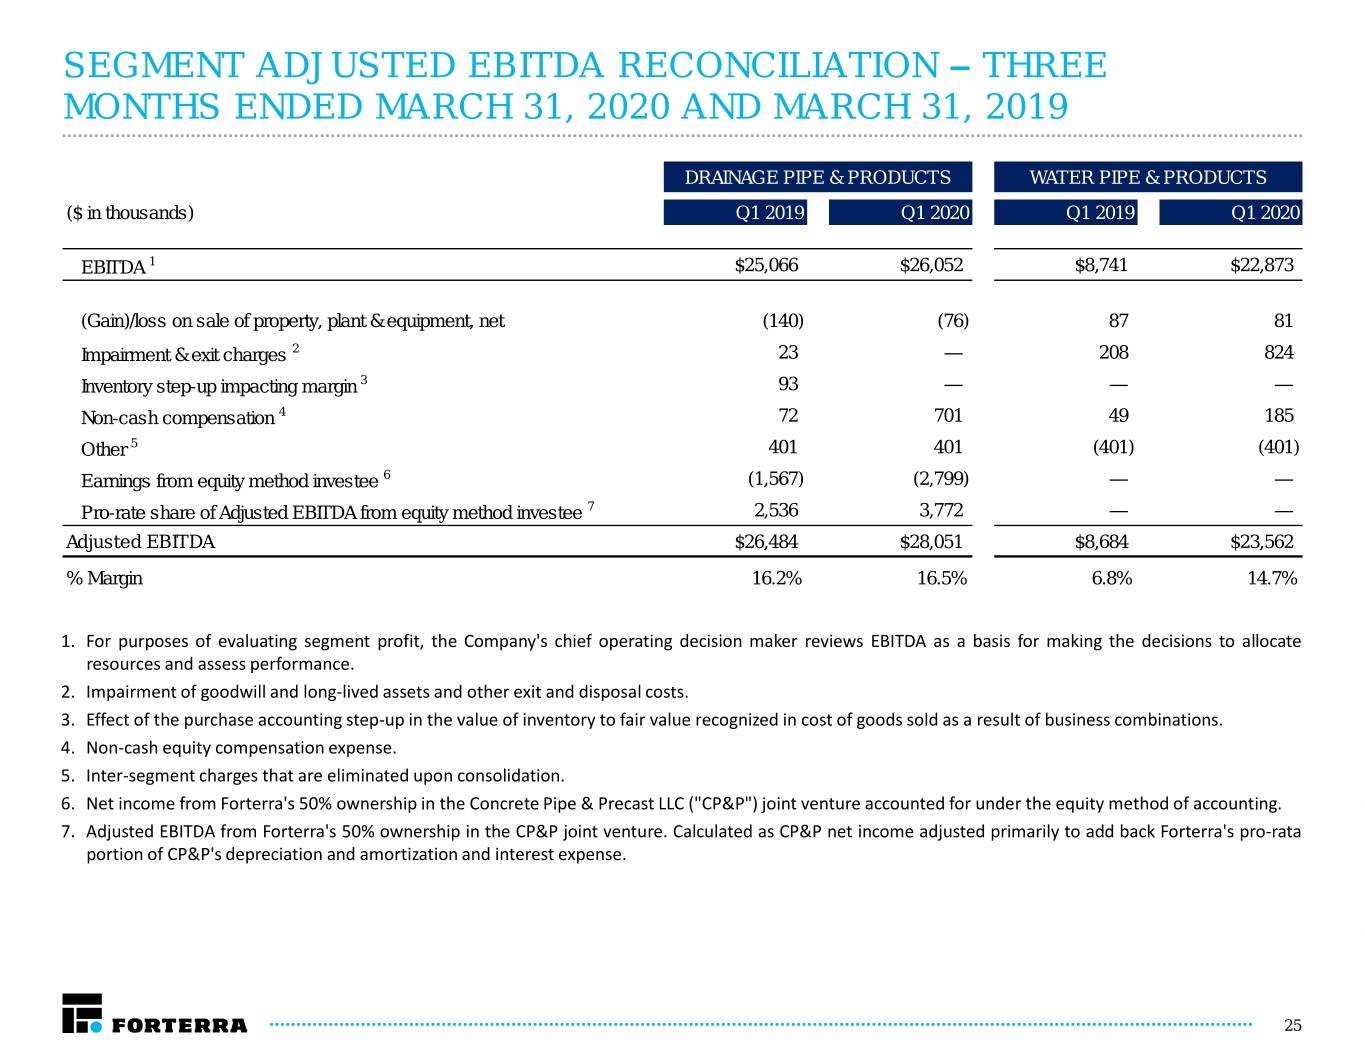
SEGMENT ADJUSTED EBITDA RECONCILIATION – THREE MONTHS ENDED MARCH 31, 2020 AND MARCH 31, 2019 DRAINAGE PIPE & PRODUCTS WATER PIPE & PRODUCTS ($ in thousands) Q1 2019 Q1 2020 Q1 2019 Q1 2020 EBITDA 1 $25,066 $26,052 $8,741 $22,873 (Gain)/loss on sale of property, plant & equipment, net (140) (76) 87 81 Impairment & exit charges 2 23 — 208 824 Inventory step-up impacting margin 3 93 — — — Non-cash compensation 4 72 701 49 185 Other 5 401 401 (401) (401) Earnings from equity method investee 6 (1,567) (2,799) — — Pro-rate share of Adjusted EBITDA from equity method investee 7 2,536 3,772 — — Adjusted EBITDA $26,484 $28,051 $8,684 $23,562 % Margin 16.2% 16.5% 6.8% 14.7% 1. For purposes of evaluating segment profit, the Company's chief operating decision maker reviews EBITDA as a basis for making the decisions to allocate resources and assess performance. 2. Impairment of goodwill and long-lived assets and other exit and disposal costs. 3. Effect of the purchase accounting step-up in the value of inventory to fair value recognized in cost of goods sold as a result of business combinations. 4. Non-cash equity compensation expense. 5. Inter-segment charges that are eliminated upon consolidation. 6. Net income from Forterra's 50% ownership in the Concrete Pipe & Precast LLC ("CP&P") joint venture accounted for under the equity method of accounting. 7. Adjusted EBITDA from Forterra's 50% ownership in the CP&P joint venture. Calculated as CP&P net income adjusted primarily to add back Forterra's pro-rata portion of CP&P's depreciation and amortization and interest expense. 25
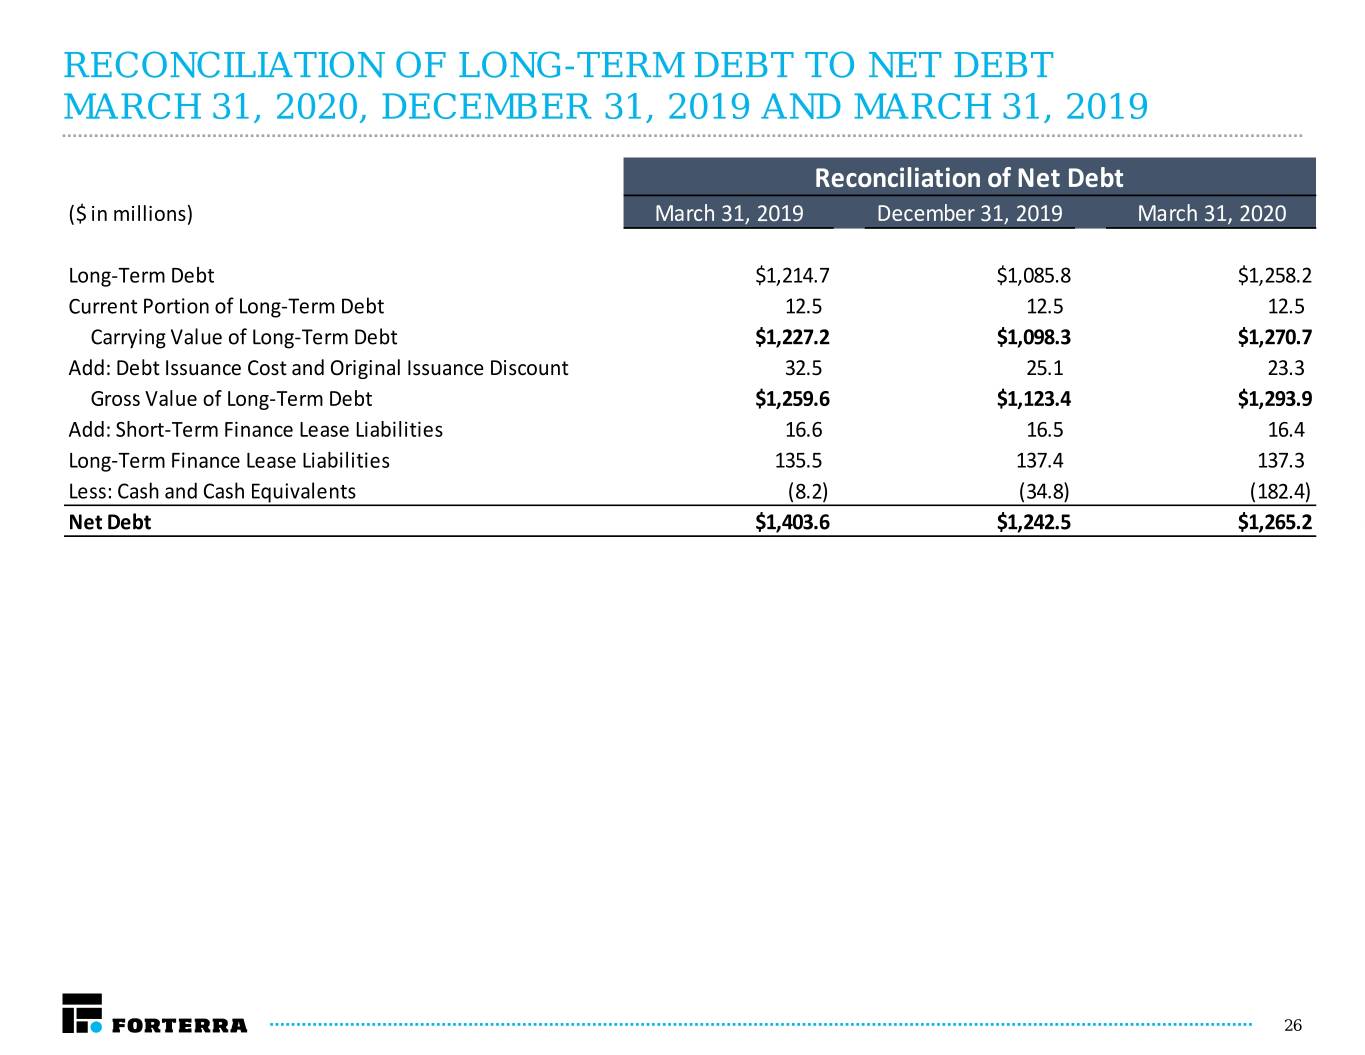
RECONCILIATION OF LONG-TERM DEBT TO NET DEBT MARCH 31, 2020, DECEMBER 31, 2019 AND MARCH 31, 2019 Reconciliation of Net Debt ($ in millions) March 31, 2019 December 31, 2019 March 31, 2020 Long-Term Debt $1,214.7 $1,085.8 $1,258.2 Current Portion of Long-Term Debt 12.5 12.5 12.5 Carrying Value of Long-Term Debt $1,227.2 $1,098.3 $1,270.7 Add: Debt Issuance Cost and Original Issuance Discount 32.5 25.1 23.3 Gross Value of Long-Term Debt $1,259.6 $1,123.4 $1,293.9 Add: Short-Term Finance Lease Liabilities 16.6 16.5 16.4 Long-Term Finance Lease Liabilities 135.5 137.4 137.3 Less: Cash and Cash Equivalents (8.2) (34.8) (182.4) Net Debt $1,403.6 $1,242.5 $1,265.2 26
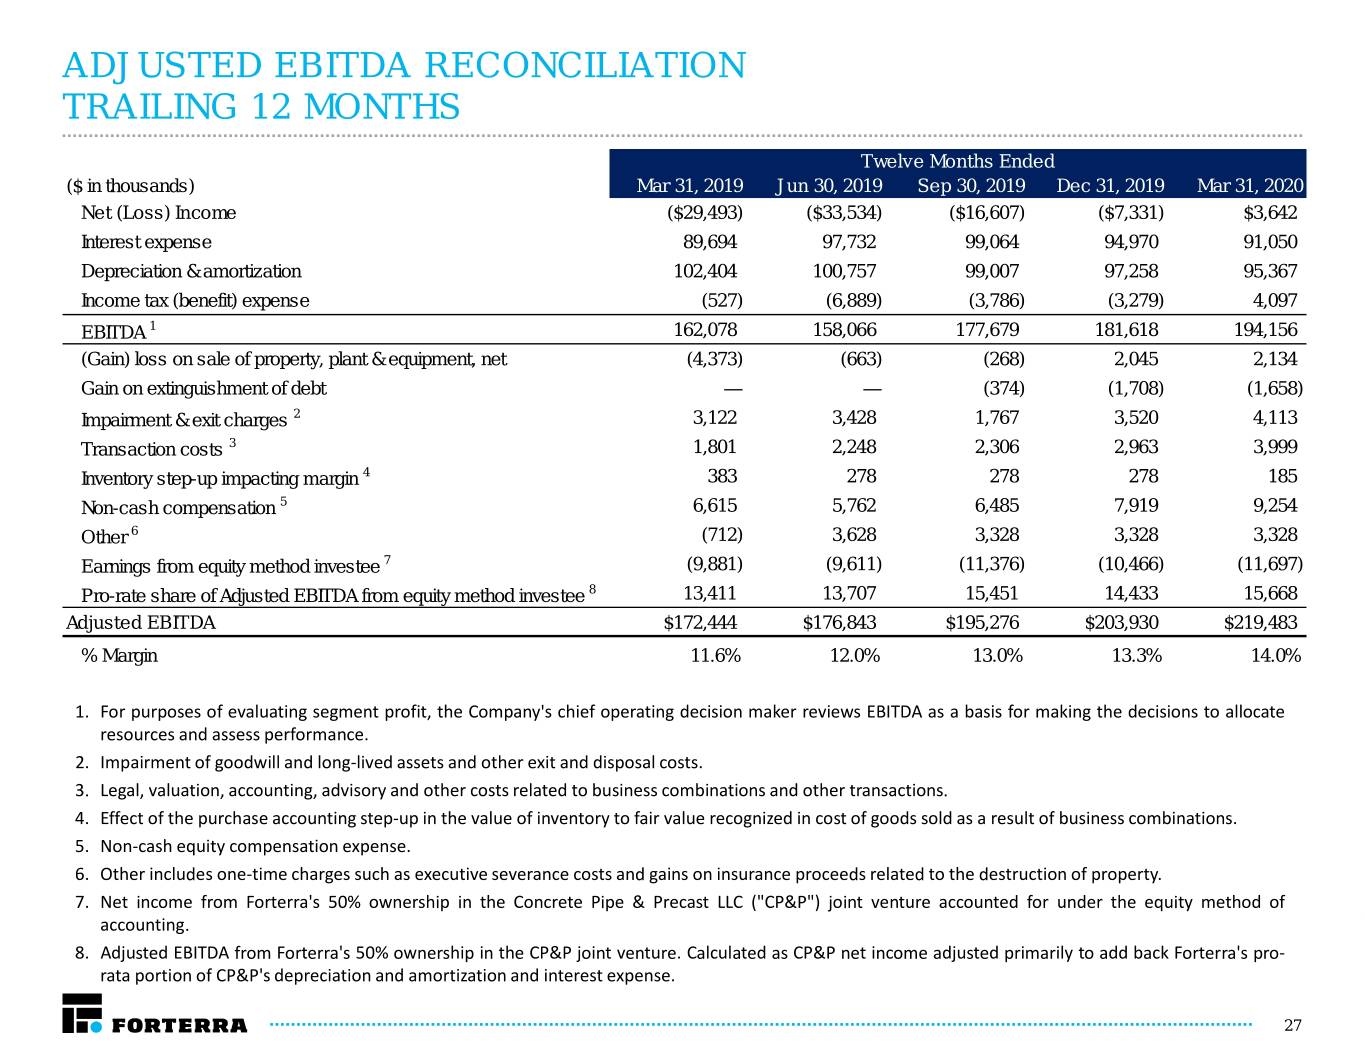
ADJUSTED EBITDA RECONCILIATION TRAILING 12 MONTHS Twelve Months Ended ($ in thousands) Mar 31, 2019 Jun 30, 2019 Sep 30, 2019 Dec 31, 2019 Mar 31, 2020 Net (Loss) Income ($29,493) ($33,534) ($16,607) ($7,331) $3,642 Interest expense 89,694 97,732 99,064 94,970 91,050 Depreciation & amortization 102,404 100,757 99,007 97,258 95,367 Income tax (benefit) expense (527) (6,889) (3,786) (3,279) 4,097 EBITDA 1 162,078 158,066 177,679 181,618 194,156 (Gain) loss on sale of property, plant & equipment, net (4,373) (663) (268) 2,045 2,134 Gain on extinguishment of debt — — (374) (1,708) (1,658) Impairment & exit charges 2 3,122 3,428 1,767 3,520 4,113 Transaction costs 3 1,801 2,248 2,306 2,963 3,999 Inventory step-up impacting margin 4 383 278 278 278 185 Non-cash compensation 5 6,615 5,762 6,485 7,919 9,254 Other 6 (712) 3,628 3,328 3,328 3,328 Earnings from equity method investee 7 (9,881) (9,611) (11,376) (10,466) (11,697) Pro-rate share of Adjusted EBITDA from equity method investee 8 13,411 13,707 15,451 14,433 15,668 Adjusted EBITDA $172,444 $176,843 $195,276 $203,930 $219,483 % Margin 11.6% 12.0% 13.0% 13.3% 14.0% 1. For purposes of evaluating segment profit, the Company's chief operating decision maker reviews EBITDA as a basis for making the decisions to allocate resources and assess performance. 2. Impairment of goodwill and long-lived assets and other exit and disposal costs. 3. Legal, valuation, accounting, advisory and other costs related to business combinations and other transactions. 4. Effect of the purchase accounting step-up in the value of inventory to fair value recognized in cost of goods sold as a result of business combinations. 5. Non-cash equity compensation expense. 6. Other includes one-time charges such as executive severance costs and gains on insurance proceeds related to the destruction of property. 7. Net income from Forterra's 50% ownership in the Concrete Pipe & Precast LLC ("CP&P") joint venture accounted for under the equity method of accounting. 8. Adjusted EBITDA from Forterra's 50% ownership in the CP&P joint venture. Calculated as CP&P net income adjusted primarily to add back Forterra's pro- rata portion of CP&P's depreciation and amortization and interest expense. 27
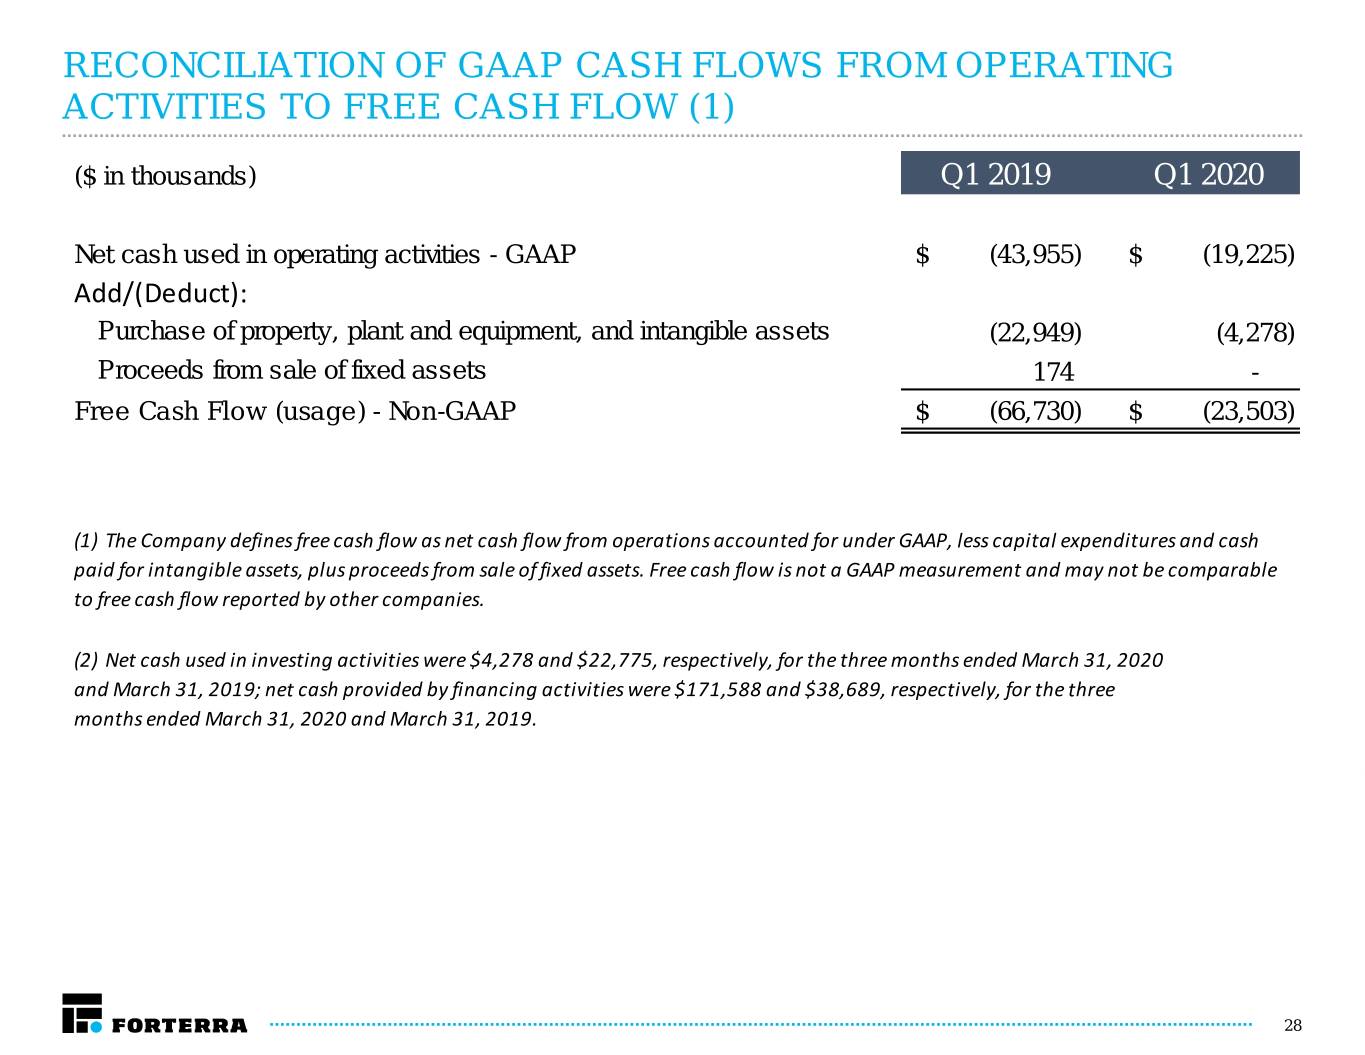
RECONCILIATION OF GAAP CASH FLOWS FROM OPERATING ACTIVITIES TO FREE CASH FLOW (1) ($ in thousands) Q1 2019 Q1 2020 Net cash used in operating activities - GAAP $ (43,955) $ (19,225) Add/(Deduct): Purchase of property, plant and equipment, and intangible assets (22,949) (4,278) Proceeds from sale of fixed assets 174 - Free Cash Flow (usage) - Non-GAAP $ (66,730) $ (23,503) (1) The Company defines free cash flow as net cash flow from operations accounted for under GAAP, less capital expenditures and cash paid for intangible assets, plus proceeds from sale of fixed assets. Free cash flow is not a GAAP measurement and may not be comparable to free cash flow reported by other companies. (2) Net cash used in investing activities were $4,278 and $22,775, respectively, for the three months ended March 31, 2020 and March 31, 2019; net cash provided by financing activities were $171,588 and $38,689, respectively, for the three months ended March 31, 2020 and March 31, 2019. 28
