Attached files
| file | filename |
|---|---|
| 8-K - 8-K - TE Connectivity Ltd. | tel-20200528x8k.htm |
Exhibit 99.1
| EVERY CONNECTION COUNTS TE Connectivity Bernstein Strategic Decisions Conference Terrence Curtin, CEO |

| © 2020 TE Connectivity. Forward-Looking Statements and Non-GAAP Financial Measures 2 Forward-Looking Statements This presentation contains certain "forward-looking statements" within the meaning of the U.S. Private Securities Litigation Reform Act of 1995. These statements are based on management's current expectations and are subject to risks, uncertainty and changes in circumstances, which may cause actual results, performance, financial condition or achievements to differ materially from anticipated results, performance, financial condition or achievements. All statements contained herein that are not clearly historical in nature are forward-looking and the words "anticipate," "believe," "expect," "estimate," "plan," and similar expressions are generally intended to identify forward-looking statements. We have no intention and are under no obligation to update or alter (and expressly disclaim any such intention or obligation to do so) our forward-looking statements whether as a result of new information, future events or otherwise, except to the extent required by law. The forward-looking statements in this presentation include statements addressing our future financial condition and operating results, and the impact on our operations resulting from the coronavirus disease 2019 (“COVID-19”). Examples of factors that could cause actual results to differ materially from those described in the forward-looking statements include, among others, the extent, severity and duration of COVID-19 negatively affecting our business operations; business, economic, competitive and regulatory risks, such as conditions affecting demand for products in the automotive and other industries we serve; competition and pricing pressure; fluctuations in foreign currency exchange rates and commodity prices; natural disasters and political, economic and military instability in countries in which we operate; developments in the credit markets; future goodwill impairment; compliance with current and future environmental and other laws and regulations; and the possible effects on us of changes in tax laws, tax treaties and other legislation, including the effects of Swiss tax reform. In addition, the extent to which COVID-19 will impact our business and our financial results will depend on future developments, which are highly uncertain and cannot be predicted. Such developments may include the geographic spread of the virus, the severity of the virus, the duration of the outbreak, the impact on our suppliers’ and customers’ supply chains, the actions that may be taken by various governmental authorities in response to the outbreak in jurisdictions in which we operate, and the possible impact on the global economy and local economies in which we operate. More detailed information about these and other factors is set forth in TE Connectivity Ltd.'s Annual Report on Form 10-K for the fiscal year ended Sept. 27, 2019 as well as in our Quarterly Reports on Form 10-Q, Current Reports on Form 8-K and other reports filed by us with the U.S. Securities and Exchange Commission. Non-GAAP Financial Measures Where we have used non-GAAP financial measures, reconciliations to the most comparable GAAP measure are provided, along with a disclosure on the usefulness of the non-GAAP financial measure, in this presentation. |
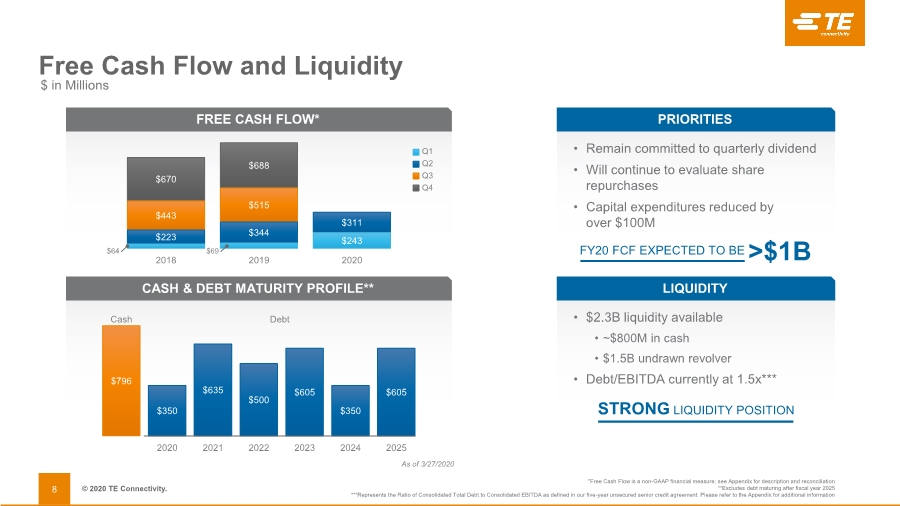
| © 2020 TE Connectivity. • Q3 sequential drivers trending roughly as expected, driven by COVID-19 impacts • Orders and sales trending roughly in line with expectations through April and May, month to date • China continuing to show improvement, with regional weakness in NA and Europe, as expected • Continuing to demonstrate resiliency in manufacturing, with most factories operating globally; few shut downs due to government regulations • Our balance sheet is strong, with a strong free cash flow generation model • Greater than $2B of liquidity available; expect FY20 FCF to exceed $1B • Remain committed to quarterly dividend; will continue to evaluate share repurchases • Continue to execute on footprint consolidation efforts, with acceleration of cost actions • Investing in content growth and benefiting from secular trends across our business • Expect higher earnings leverage when markets return to growth • Well positioned to benefit from recovery in China and broader recovery in the Auto market • Enabling a sustainable future and continuing to drive ESG initiatives • Enabling sustainable applications including electric vehicles, interventional medical procedures, and efficient data centers • Making continued progress on ESG initiatives and metrics Key Messages 3 Free Cash Flow is a non-GAAP financial measure: see Appendix for description. |
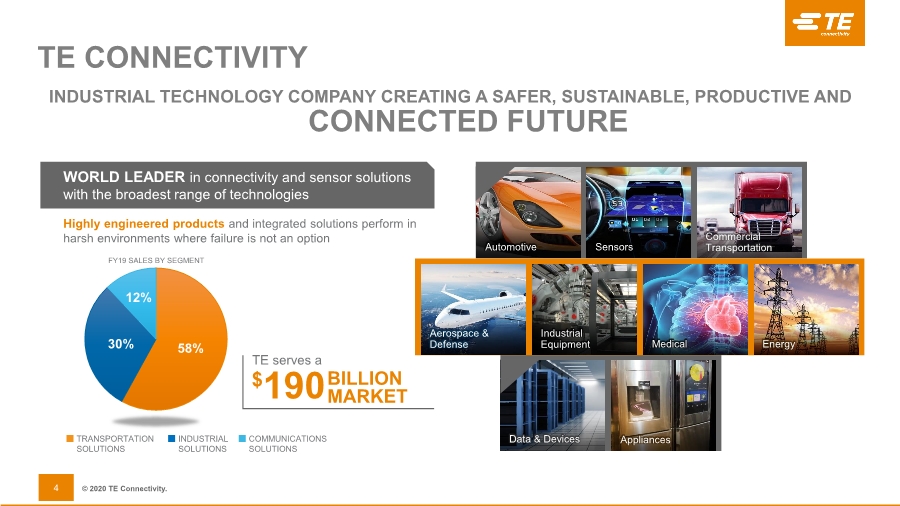
| © 2020 TE Connectivity. 4 INDUSTRIAL TECHNOLOGY COMPANY CREATING A SAFER, SUSTAINABLE, PRODUCTIVE AND CONNECTED FUTURE TE CONNECTIVITY WORLD LEADER in connectivity and sensor solutions with the broadest range of technologies Highly engineered products and integrated solutions perform in harsh environments where failure is not an option TE serves a BILLION MARKET $190 TRANSPORTATION SOLUTIONS INDUSTRIAL SOLUTIONS COMMUNICATIONS SOLUTIONS 58% 30% 12% FY19 SALES BY SEGMENT Automotive Sensors Commercial Transportation Data & Devices Appliances Aerospace & Defense Industrial Equipment Medical Energy |
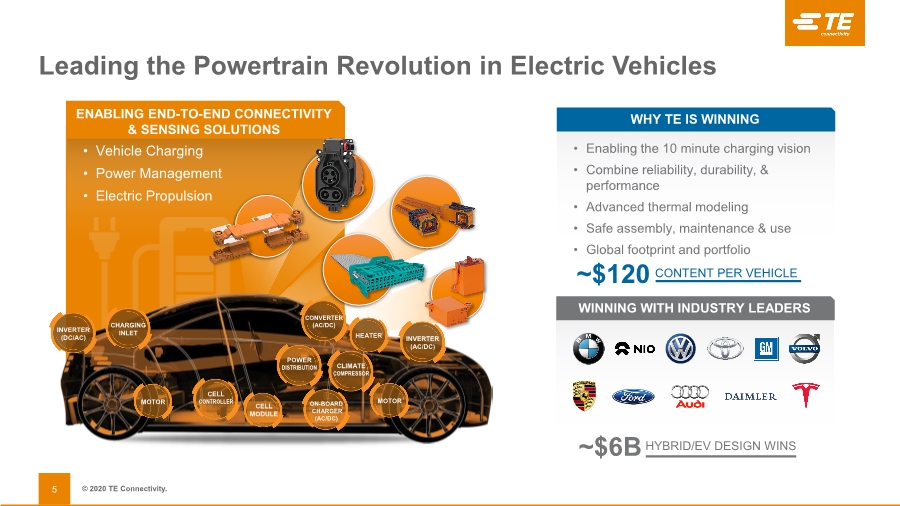
| © 2020 TE Connectivity. Leading the Powertrain Revolution in Electric Vehicles 5 ENABLING END-TO-END CONNECTIVITY & SENSING SOLUTIONS WHY TE IS WINNING • Enabling the 10 minute charging vision • Combine reliability, durability, & performance • Advanced thermal modeling • Safe assembly, maintenance & use • Global footprint and portfolio WINNING WITH INDUSTRY LEADERS • Vehicle Charging • Power Management • Electric Propulsion ~$6B HYBRID/EV DESIGN WINS MOTOR MOTOR POWER DISTRIBUTION CLIMATE COMPRESSOR CELL CONTROLLER CELL MODULE ON-BOARD CHARGER (AC/DC) INVERTER (DC/AC) CHARGING INLET CONVERTER (AC/DC) INVERTER (AC/DC) HEATER ~$120 CONTENT PER VEHICLE |
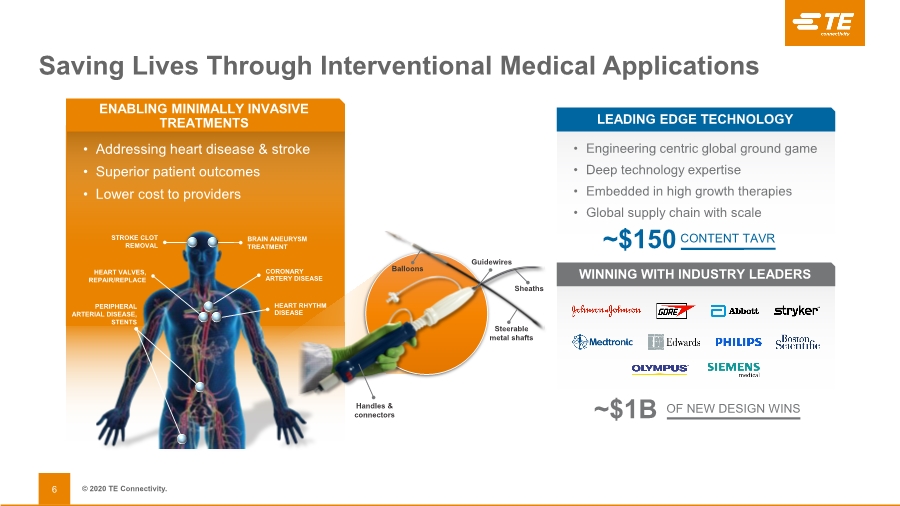
| © 2020 TE Connectivity. Saving Lives Through Interventional Medical Applications 6 ENABLING MINIMALLY INVASIVE TREATMENTS LEADING EDGE TECHNOLOGY • Engineering centric global ground game • Deep technology expertise • Embedded in high growth therapies • Global supply chain with scale WINNING WITH INDUSTRY LEADERS • Addressing heart disease & stroke • Superior patient outcomes • Lower cost to providers ~$1B OF NEW DESIGN WINS ~$150 CONTENT TAVR PERIPHERAL ARTERIAL DISEASE, STENTS HEART VALVES, REPAIR/REPLACE STROKE CLOT REMOVAL BRAIN ANEURYSM TREATMENT Handles & connectors Guidewires Balloons Sheaths Steerable metal shafts CORONARY ARTERY DISEASE HEART RHYTHM DISEASE |
| © 2020 TE Connectivity. Enabling Higher Performance in the Data Center 7 THE APPLICATIONS WE ENABLE WHY TE IS WINNING • Global engineering excellence • Strong signal integrity at high speed rates • Thermal management • Safe power delivery WINNING WITH INDUSTRY LEADERS • 800Gbps performance • Cooler data centers • 45KW Power Rack SERVER ~$80 CONTENT SWITCH ~$150 CONTENT ~$1B IN NEW DESIGN WINS Existing Platform New Platform |

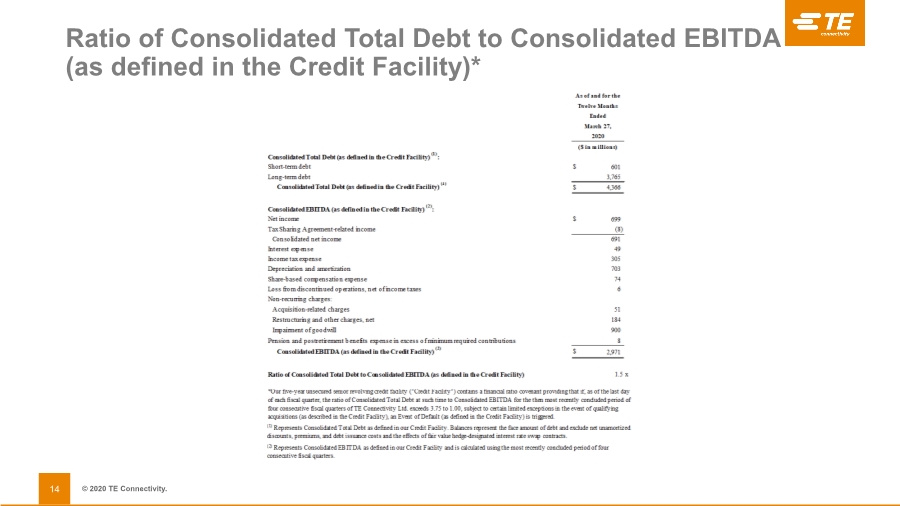
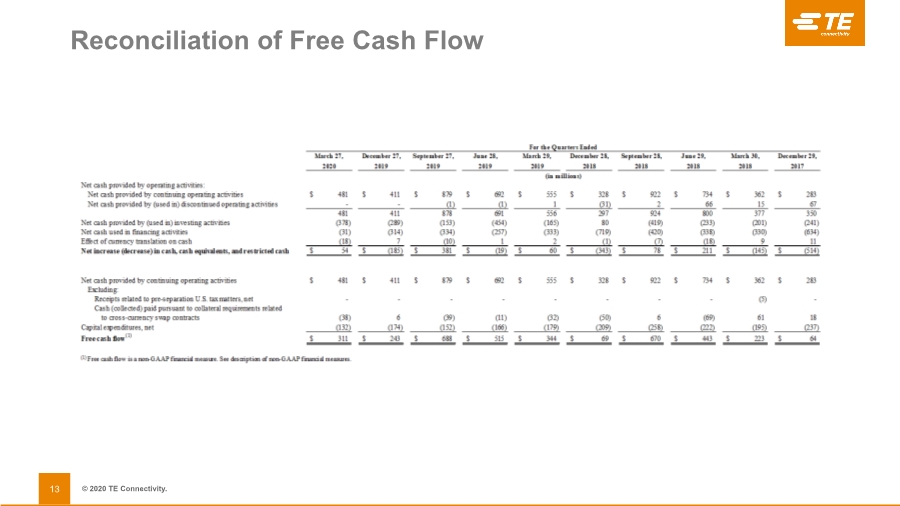
| © 2020 TE Connectivity. Free Cash Flow and Liquidity 8 LIQUIDITY STRONG LIQUIDITY POSITION • $2.3B liquidity available • ~$800M in cash • $1.5B undrawn revolver • Debt/EBITDA currently at 1.5x*** PRIORITIES • Remain committed to quarterly dividend • Will continue to evaluate share repurchases • Capital expenditures reduced by over $100M FY20 FCF EXPECTED TO BE >$1B *Free Cash Flow is a non-GAAP financial measure; see Appendix for description and reconciliation **Excludes debt maturing after fiscal year 2025 ***Represents the Ratio of Consolidated Total Debt to Consolidated EBITDA as defined in our five-year unsecured senior credit agreement. Please refer to the Appendix for additional information $ in Millions CASH & DEBT MATURITY PROFILE** As of 3/27/2020 Cash Debt $796 $350 $635 $500 $605 $350 $605 2020 2021 2022 2023 2024 2025 FREE CASH FLOW* $64 Q1 Q2 Q3 Q4 2018 2019 2020 $670 $688 $443 $515 $344 $223 $311 $243 $69 |
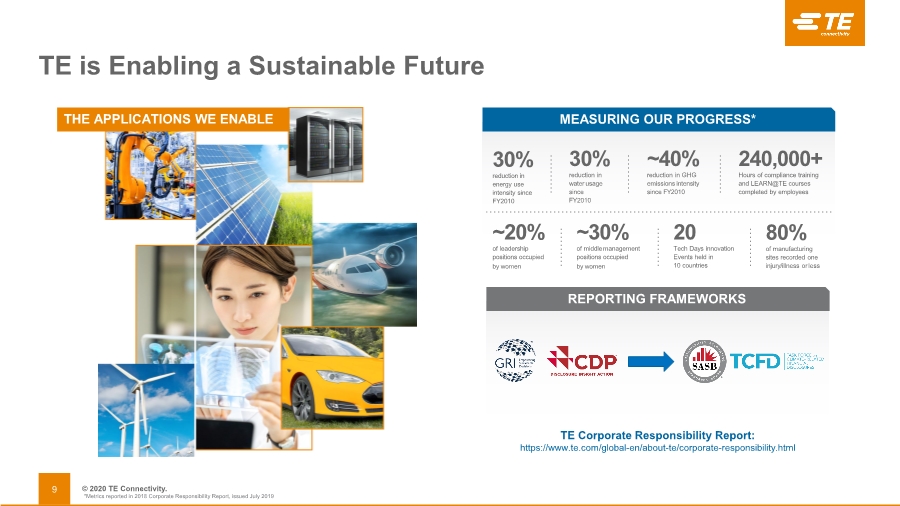
| © 2020 TE Connectivity. REPORTING FRAMEWORKS TE is Enabling a Sustainable Future 9 MEASURING OUR PROGRESS* ~40% reduction in GHG emissions intensity since FY2010 30% reduction in water usage since FY2010 80% of manufacturing sites recorded one injury/illness orless 30% reduction in energy use intensity since FY2010 ~30% of middlemanagement positions occupied by women 240,000+ Hours of compliance training and LEARN@TE courses completed by employees 20 Tech Days innovation Events held in 10 countries ~20% of leadership positions occupied by women THE APPLICATIONS WE ENABLE TE Corporate Responsibility Report: https://www.te.com/global-en/about-te/corporate-responsibility.html *Metrics reported in 2018 Corporate Responsibility Report, issued July 2019 |
| WHEN TECHNOLOGY CONNECTS, SO DOES HUMANITY. EVERY CONNECTION COUNTS |
| © 2020 TE Connectivity. Appendix |

| © 2020 TE Connectivity. Non-GAAP Financial Measures 12 |
| © 2020 TE Connectivity. Reconciliation of Free Cash Flow 13 |
| © 2020 TE Connectivity. Ratio of Consolidated Total Debt to Consolidated EBITDA (as defined in the Credit Facility)* 14 |