Attached files
| file | filename |
|---|---|
| 8-K - 8-K - Ecovyst Inc. | d935984d8k.htm |

Exhibit 99.1 INVESTOR PRESENTATION May 2020Exhibit 99.1 INVESTOR PRESENTATION May 2020

LEGAL DISCLAIMER Forward-Looking Statements Some of the information contained in this presentation constitutes “forward-looking statements”. Forward-looking statements can be identified by words such as “anticipates,” “intends,” “plans,” “seeks,” “believes,” “estimates,” “expects,” “projects” and similar references to future periods. Forward-looking statements are based on our current expectations and assumptions regarding our business, the economy and other future conditions. Because forward-looking statements relate to the future, they are subject to inherent uncertainties, risks and changes in circumstances that are difficult to predict. Examples of forward looking statements include, but are not limited to, statements regarding our results of operations, financial condition, liquidity, prospects, growth, strategies, product and service offerings and end use demand trends, including the impact of the COVID-19 pandemic on such items, and financial 2020 outlook. Our actual results may differ materially from those contemplated by the forward-looking statements. We caution you, therefore, against relying on any of these forward-looking statements. They are neither statements of historical fact nor guarantees or assurances of future performance. Important factors that could cause actual results to differ materially from those in the forward-looking statements include, but are not limited to, regional, national or global political, economic, business, competitive, market and regulatory conditions, including the ongoing COVID-19 pandemic, tariffs, and trade disputes, currency exchange rates and other factors, including those described in the sections titled “Risk Factors” and “Management Discussion & Analysis of Financial Condition and Results of Operations” in our filings with the SEC, which are available on the SEC’s website at www.sec.gov. Any forward-looking statement made by us in this presentation speaks only as of the date on which it is made. Factors or events that could cause our actual results to differ may emerge from time to time, and it is not possible for us to predict all of them. We undertake no obligation to update any forward-looking statement, whether as a result of new information, future developments or otherwise, except as may be required by applicable law. Certain supply share statistics included in this presentation, including our estimated supply share positions, are based on management estimates. Non-GAAP Financial Measures This presentation includes certain non-GAAP financial measures, including adjusted EBITDA, adjusted EBITDA margin, adjusted diluted EPS, adjusted net income, constant currency sales and Adjusted EBITDA and adjusted free cash flow which are provided to assist in an understanding of our business and its performance. These non-GAAP financial measures should be considered only as supplemental to, and not as superior to, financial measures prepared in accordance with GAAP. Non-GAAP financial measures should be read only in conjunction with consolidated financials prepared in accordance with GAAP. Reconciliations of non-GAAP measures to the relevant GAAP measures are provided in the appendix of this presentation. In discussing our operating results, the term currency exchange rates refers to the currency exchange rates we use to convert the operating results for all countries where the functional currency is not the U.S. dollar. We calculate constant currency sales and constant currency adjusted EBITDA by translating current period results at the prior period’s currency exchange rates. When we refer to constant currency sales and constant currency adjusted EBITDA, this means sales and adjusted EBITDA without the impact of the currency exchange rate fluctuations from period-to-period. The Company is not able to provide a reconciliation of the Company’s non-GAAP financial guidance to the corresponding GAAP measures without unreasonable effort because of the inherent difficulty in forecasting and quantifying certain amounts necessary for such a reconciliation such as certain non-cash, nonrecurring or other items, that are included in net income and EBITDA as well as the related tax impacts of these items and asset dispositions/acquisitions and changes in foreign currency exchange rates that are included in cash flow, due to the uncertainty and variability of the nature and amount of these future charges and costs. Non-GAAP Financial Measures – Business Combination On May 4, 2016, we consummated a series of transactions (the Business Combination ) to reorganize and combine the businesses of PQ Holdings Inc. and Eco Services Operations LLC under a new holding company, PQ Group Holdings Inc. In this presentation, we present pro forma information for the years ended December 31, 2016 and 2015, which gives effect to the Business Combination and the related financing transactions as if they occurred on January 1, 2015. Such information is illustrative and not intended to represent what our results of operations would have been had the Business Combination and related financing transactions occurred at any time prior to May 4, 2016 or to project our results of operations for any future period. Such information may not be comparable to, or indicative of, future performance. Zeolyst Joint Venture Zeolyst International and Zeolyst C.V. (our 50% owned joint ventures that we refer to collectively as the “Zeolyst Joint Venture”) are accounted for as an equity method investment in accordance with GAAP. The presentation of the Zeolyst Joint Venture’s sales in this presentation represents 50% of the sales of the Zeolyst Joint Venture. We do not record sales by the Zeolyst Joint Venture as revenue and such sales are not consolidated within our results of operations. However, our adjusted EBITDA reflects our share of the earnings of the Zeolyst Joint Venture that have been recorded as equity in net income from affiliated companies in our consolidated statements of income for such periods and includes Zeolyst Joint Venture adjustments on a proportionate basis based on our 50% ownership interest. Accordingly, our adjusted EBITDA margins are calculated including 50% of the sales of the Zeolyst Joint Venture for the relevant periods in the denominator. 2LEGAL DISCLAIMER Forward-Looking Statements Some of the information contained in this presentation constitutes “forward-looking statements”. Forward-looking statements can be identified by words such as “anticipates,” “intends,” “plans,” “seeks,” “believes,” “estimates,” “expects,” “projects” and similar references to future periods. Forward-looking statements are based on our current expectations and assumptions regarding our business, the economy and other future conditions. Because forward-looking statements relate to the future, they are subject to inherent uncertainties, risks and changes in circumstances that are difficult to predict. Examples of forward looking statements include, but are not limited to, statements regarding our results of operations, financial condition, liquidity, prospects, growth, strategies, product and service offerings and end use demand trends, including the impact of the COVID-19 pandemic on such items, and financial 2020 outlook. Our actual results may differ materially from those contemplated by the forward-looking statements. We caution you, therefore, against relying on any of these forward-looking statements. They are neither statements of historical fact nor guarantees or assurances of future performance. Important factors that could cause actual results to differ materially from those in the forward-looking statements include, but are not limited to, regional, national or global political, economic, business, competitive, market and regulatory conditions, including the ongoing COVID-19 pandemic, tariffs, and trade disputes, currency exchange rates and other factors, including those described in the sections titled “Risk Factors” and “Management Discussion & Analysis of Financial Condition and Results of Operations” in our filings with the SEC, which are available on the SEC’s website at www.sec.gov. Any forward-looking statement made by us in this presentation speaks only as of the date on which it is made. Factors or events that could cause our actual results to differ may emerge from time to time, and it is not possible for us to predict all of them. We undertake no obligation to update any forward-looking statement, whether as a result of new information, future developments or otherwise, except as may be required by applicable law. Certain supply share statistics included in this presentation, including our estimated supply share positions, are based on management estimates. Non-GAAP Financial Measures This presentation includes certain non-GAAP financial measures, including adjusted EBITDA, adjusted EBITDA margin, adjusted diluted EPS, adjusted net income, constant currency sales and Adjusted EBITDA and adjusted free cash flow which are provided to assist in an understanding of our business and its performance. These non-GAAP financial measures should be considered only as supplemental to, and not as superior to, financial measures prepared in accordance with GAAP. Non-GAAP financial measures should be read only in conjunction with consolidated financials prepared in accordance with GAAP. Reconciliations of non-GAAP measures to the relevant GAAP measures are provided in the appendix of this presentation. In discussing our operating results, the term currency exchange rates refers to the currency exchange rates we use to convert the operating results for all countries where the functional currency is not the U.S. dollar. We calculate constant currency sales and constant currency adjusted EBITDA by translating current period results at the prior period’s currency exchange rates. When we refer to constant currency sales and constant currency adjusted EBITDA, this means sales and adjusted EBITDA without the impact of the currency exchange rate fluctuations from period-to-period. The Company is not able to provide a reconciliation of the Company’s non-GAAP financial guidance to the corresponding GAAP measures without unreasonable effort because of the inherent difficulty in forecasting and quantifying certain amounts necessary for such a reconciliation such as certain non-cash, nonrecurring or other items, that are included in net income and EBITDA as well as the related tax impacts of these items and asset dispositions/acquisitions and changes in foreign currency exchange rates that are included in cash flow, due to the uncertainty and variability of the nature and amount of these future charges and costs. Non-GAAP Financial Measures – Business Combination On May 4, 2016, we consummated a series of transactions (the Business Combination ) to reorganize and combine the businesses of PQ Holdings Inc. and Eco Services Operations LLC under a new holding company, PQ Group Holdings Inc. In this presentation, we present pro forma information for the years ended December 31, 2016 and 2015, which gives effect to the Business Combination and the related financing transactions as if they occurred on January 1, 2015. Such information is illustrative and not intended to represent what our results of operations would have been had the Business Combination and related financing transactions occurred at any time prior to May 4, 2016 or to project our results of operations for any future period. Such information may not be comparable to, or indicative of, future performance. Zeolyst Joint Venture Zeolyst International and Zeolyst C.V. (our 50% owned joint ventures that we refer to collectively as the “Zeolyst Joint Venture”) are accounted for as an equity method investment in accordance with GAAP. The presentation of the Zeolyst Joint Venture’s sales in this presentation represents 50% of the sales of the Zeolyst Joint Venture. We do not record sales by the Zeolyst Joint Venture as revenue and such sales are not consolidated within our results of operations. However, our adjusted EBITDA reflects our share of the earnings of the Zeolyst Joint Venture that have been recorded as equity in net income from affiliated companies in our consolidated statements of income for such periods and includes Zeolyst Joint Venture adjustments on a proportionate basis based on our 50% ownership interest. Accordingly, our adjusted EBITDA margins are calculated including 50% of the sales of the Zeolyst Joint Venture for the relevant periods in the denominator. 2
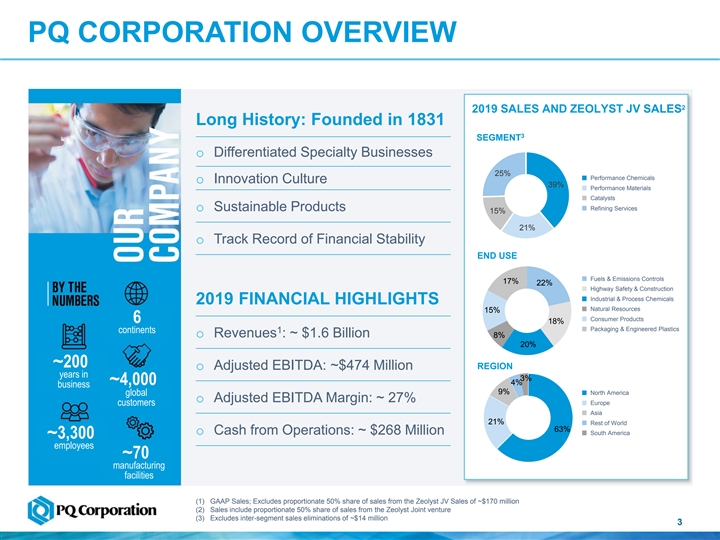
PQ CORPORATION OVERVIEW 2 2019 SALES AND ZEOLYST JV SALES Long History: Founded in 1831 3 SEGMENT SALES o Differentiated Specialty Businesses 25% Performance Chemicals o Innovation Culture 39% Performance Materials Catalysts Refining Services o Sustainable Products 15% 21% o Track Record of Financial Stability END USE Fuels & Emissions Controls 17% 22% Highway Safety & Construction Industrial & Process Chemicals 2019 FINANCIAL HIGHLIGHTS Natural Resources 15% 6 Consumer Products 6 18% continents Packaging & Engineered Plastics continents 1 o Revenues : ~ $1.6 Billion 8% 20% ~200 REGION o Adjusted EBITDA: ~$474 Million years in 3% ~4,000 4% business 9% North America global o Adjusted EBITDA Margin: ~ 27% Europe customers Asia 21% Rest of World 63% o Cash from Operations: ~ $268 Million South America ~3,300 employees ~70 manufacturing facilities (1) GAAP Sales; Excludes proportionate 50% share of sales from the Zeolyst JV Sales of ~$170 million (2) Sales include proportionate 50% share of sales from the Zeolyst Joint venture (3) Excludes inter-segment sales eliminations of ~$14 million 3PQ CORPORATION OVERVIEW 2 2019 SALES AND ZEOLYST JV SALES Long History: Founded in 1831 3 SEGMENT SALES o Differentiated Specialty Businesses 25% Performance Chemicals o Innovation Culture 39% Performance Materials Catalysts Refining Services o Sustainable Products 15% 21% o Track Record of Financial Stability END USE Fuels & Emissions Controls 17% 22% Highway Safety & Construction Industrial & Process Chemicals 2019 FINANCIAL HIGHLIGHTS Natural Resources 15% 6 Consumer Products 6 18% continents Packaging & Engineered Plastics continents 1 o Revenues : ~ $1.6 Billion 8% 20% ~200 REGION o Adjusted EBITDA: ~$474 Million years in 3% ~4,000 4% business 9% North America global o Adjusted EBITDA Margin: ~ 27% Europe customers Asia 21% Rest of World 63% o Cash from Operations: ~ $268 Million South America ~3,300 employees ~70 manufacturing facilities (1) GAAP Sales; Excludes proportionate 50% share of sales from the Zeolyst JV Sales of ~$170 million (2) Sales include proportionate 50% share of sales from the Zeolyst Joint venture (3) Excludes inter-segment sales eliminations of ~$14 million 3

OUR DIVERSIFIED SPECIALTY BUSINESSES REFINING PERFORMANCE PERFORMANCE 1 CATALYSTS SERVICES MATERIALS CHEMICALS COMPETITIVE STRENGTHS o Supplier to largest North o Key supplier for global refineries o Transportation safety lead bead o Strategic global infrastructure America refineries supplier o Leader in zeolite technology o Vertically integrated silicate o Largest integrated supply for heavy duty diesel o Extensive global supply network expertise network o Specified with top polyethylene o Co-production for industrial o 50+ years customer o Favorable long-term contracts and methyl methacrylate applications relationships producers 2017 – 2019 PERFORMANCE 1 Sales CAGR 5.9% Sales CAGR 8.1% Sales CAGR 5.8% Sales CAGR -0.2% 1 Adjusted EBITDA CAGR 6.7% Adjusted EBITDA CAGR 9.8% Adjusted EBITDA CAGR 4.9% Adjusted EBITDA CAGR -4.9% 2 Adjusted EBITDA Margin ~24% Adjusted EBITDA Margin ~39% Adjusted EBITDA Margin ~39% Adjusted EBITDA Margin ~21% LONG TERM GROWTH DRIVERS o Shale oil share growth o Broader adoption of emissions o Steady highway demand o Shifting consumer preferences standards o Demand increase in premium o Higher safety regulations o Regulation driven substitution gasoline o Tightening vehicle emission o Lightweighting & materials o Higher performance standards standards o Rising gasoline exports substitution o Trend for lighter and stronger plastics (1) Includes Silica Catalysts and Zeolyst Joint Venture (2) Adjusted EBITDA margin includes proportionate 50% share of sales from Zeolyst Joint Venture 4OUR DIVERSIFIED SPECIALTY BUSINESSES REFINING PERFORMANCE PERFORMANCE 1 CATALYSTS SERVICES MATERIALS CHEMICALS COMPETITIVE STRENGTHS o Supplier to largest North o Key supplier for global refineries o Transportation safety lead bead o Strategic global infrastructure America refineries supplier o Leader in zeolite technology o Vertically integrated silicate o Largest integrated supply for heavy duty diesel o Extensive global supply network expertise network o Specified with top polyethylene o Co-production for industrial o 50+ years customer o Favorable long-term contracts and methyl methacrylate applications relationships producers 2017 – 2019 PERFORMANCE 1 Sales CAGR 5.9% Sales CAGR 8.1% Sales CAGR 5.8% Sales CAGR -0.2% 1 Adjusted EBITDA CAGR 6.7% Adjusted EBITDA CAGR 9.8% Adjusted EBITDA CAGR 4.9% Adjusted EBITDA CAGR -4.9% 2 Adjusted EBITDA Margin ~24% Adjusted EBITDA Margin ~39% Adjusted EBITDA Margin ~39% Adjusted EBITDA Margin ~21% LONG TERM GROWTH DRIVERS o Shale oil share growth o Broader adoption of emissions o Steady highway demand o Shifting consumer preferences standards o Demand increase in premium o Higher safety regulations o Regulation driven substitution gasoline o Tightening vehicle emission o Lightweighting & materials o Higher performance standards standards o Rising gasoline exports substitution o Trend for lighter and stronger plastics (1) Includes Silica Catalysts and Zeolyst Joint Venture (2) Adjusted EBITDA margin includes proportionate 50% share of sales from Zeolyst Joint Venture 4
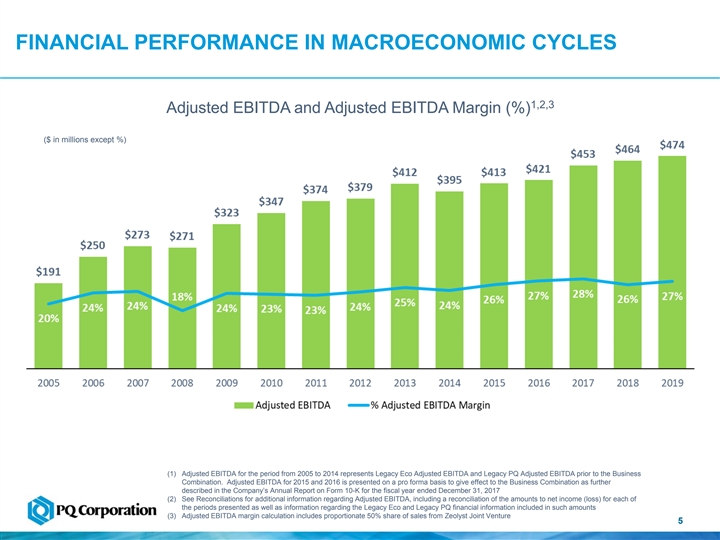
FINANCIAL PERFORMANCE IN MACROECONOMIC CYCLES 1,2,3 Adjusted EBITDA and Adjusted EBITDA Margin (%) ($ in millions except %) (1) Adjusted EBITDA for the period from 2005 to 2014 represents Legacy Eco Adjusted EBITDA and Legacy PQ Adjusted EBITDA prior to the Business Combination. Adjusted EBITDA for 2015 and 2016 is presented on a pro forma basis to give effect to the Business Combination as further described in the Company’s Annual Report on Form 10-K for the fiscal year ended December 31, 2017 (2) See Reconciliations for additional information regarding Adjusted EBITDA, including a reconciliation of the amounts to net income (loss) for each of the periods presented as well as information regarding the Legacy Eco and Legacy PQ financial information included in such amounts (3) Adjusted EBITDA margin calculation includes proportionate 50% share of sales from Zeolyst Joint Venture 5FINANCIAL PERFORMANCE IN MACROECONOMIC CYCLES 1,2,3 Adjusted EBITDA and Adjusted EBITDA Margin (%) ($ in millions except %) (1) Adjusted EBITDA for the period from 2005 to 2014 represents Legacy Eco Adjusted EBITDA and Legacy PQ Adjusted EBITDA prior to the Business Combination. Adjusted EBITDA for 2015 and 2016 is presented on a pro forma basis to give effect to the Business Combination as further described in the Company’s Annual Report on Form 10-K for the fiscal year ended December 31, 2017 (2) See Reconciliations for additional information regarding Adjusted EBITDA, including a reconciliation of the amounts to net income (loss) for each of the periods presented as well as information regarding the Legacy Eco and Legacy PQ financial information included in such amounts (3) Adjusted EBITDA margin calculation includes proportionate 50% share of sales from Zeolyst Joint Venture 5
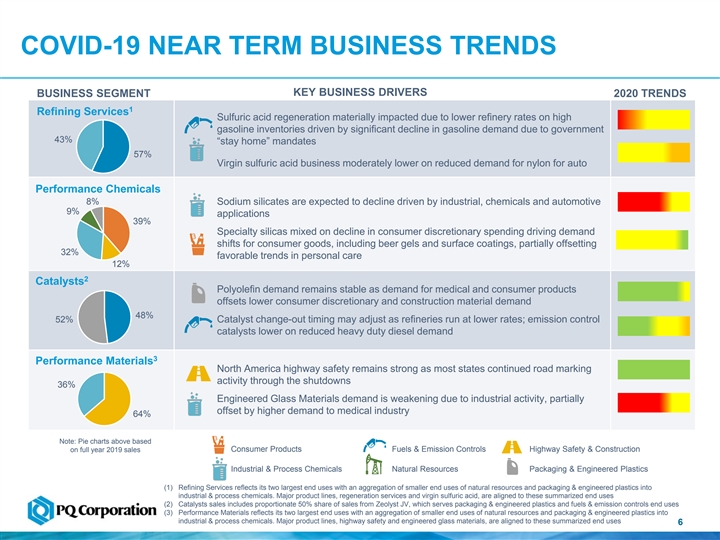
COVID-19 NEAR TERM BUSINESS TRENDS KEY BUSINESS DRIVERS BUSINESS SEGMENT 2020 TRENDS 1 Refining Services Sulfuric acid regeneration materially impacted due to lower refinery rates on high gasoline inventories driven by significant decline in gasoline demand due to government 43% “stay home” mandates 57% Virgin sulfuric acid business moderately lower on reduced demand for nylon for auto Performance Chemicals 8% Sodium silicates are expected to decline driven by industrial, chemicals and automotive 9% applications 39% Specialty silicas mixed on decline in consumer discretionary spending driving demand shifts for consumer goods, including beer gels and surface coatings, partially offsetting 32% favorable trends in personal care 12% 2 Catalysts Polyolefin demand remains stable as demand for medical and consumer products offsets lower consumer discretionary and construction material demand 48% 52% Catalyst change-out timing may adjust as refineries run at lower rates; emission control catalysts lower on reduced heavy duty diesel demand 3 Performance Materials North America highway safety remains strong as most states continued road marking activity through the shutdowns 36% Engineered Glass Materials demand is weakening due to industrial activity, partially offset by higher demand to medical industry 64% Note: Pie charts above based on full year 2019 sales Consumer Products Fuels & Emission Controls Highway Safety & Construction Industrial & Process Chemicals Natural Resources Packaging & Engineered Plastics (1) Refining Services reflects its two largest end uses with an aggregation of smaller end uses of natural resources and packaging & engineered plastics into industrial & process chemicals. Major product lines, regeneration services and virgin sulfuric acid, are aligned to these summarized end uses (2) Catalysts sales includes proportionate 50% share of sales from Zeolyst JV, which serves packaging & engineered plastics and fuels & emission controls end uses (3) Performance Materials reflects its two largest end uses with an aggregation of smaller end uses of natural resources and packaging & engineered plastics into industrial & process chemicals. Major product lines, highway safety and engineered glass materials, are aligned to these summarized end uses 6COVID-19 NEAR TERM BUSINESS TRENDS KEY BUSINESS DRIVERS BUSINESS SEGMENT 2020 TRENDS 1 Refining Services Sulfuric acid regeneration materially impacted due to lower refinery rates on high gasoline inventories driven by significant decline in gasoline demand due to government 43% “stay home” mandates 57% Virgin sulfuric acid business moderately lower on reduced demand for nylon for auto Performance Chemicals 8% Sodium silicates are expected to decline driven by industrial, chemicals and automotive 9% applications 39% Specialty silicas mixed on decline in consumer discretionary spending driving demand shifts for consumer goods, including beer gels and surface coatings, partially offsetting 32% favorable trends in personal care 12% 2 Catalysts Polyolefin demand remains stable as demand for medical and consumer products offsets lower consumer discretionary and construction material demand 48% 52% Catalyst change-out timing may adjust as refineries run at lower rates; emission control catalysts lower on reduced heavy duty diesel demand 3 Performance Materials North America highway safety remains strong as most states continued road marking activity through the shutdowns 36% Engineered Glass Materials demand is weakening due to industrial activity, partially offset by higher demand to medical industry 64% Note: Pie charts above based on full year 2019 sales Consumer Products Fuels & Emission Controls Highway Safety & Construction Industrial & Process Chemicals Natural Resources Packaging & Engineered Plastics (1) Refining Services reflects its two largest end uses with an aggregation of smaller end uses of natural resources and packaging & engineered plastics into industrial & process chemicals. Major product lines, regeneration services and virgin sulfuric acid, are aligned to these summarized end uses (2) Catalysts sales includes proportionate 50% share of sales from Zeolyst JV, which serves packaging & engineered plastics and fuels & emission controls end uses (3) Performance Materials reflects its two largest end uses with an aggregation of smaller end uses of natural resources and packaging & engineered plastics into industrial & process chemicals. Major product lines, highway safety and engineered glass materials, are aligned to these summarized end uses 6

2020 OUTLOOK AND DECISIVE ACTIONS Rapid COVID-19 response o Ensured health and safety of our employees o Maintained operations with minor disruptions o Adapted to customer demand o Refinanced debt at lower costs with extended maturities Q1 2020 Results 2020 Outlook Additional Actions Second Quarter: Solid performance driven by Target additional free cash flow portfolio diversity; minimal benefits o Sales $360 to $375 impact from COVID-19 million o Capital expenditure reduction ~$15 o Sales up ~2% and adjusted o Adjusted EBITDA $95 to million in the first half of 2020 EBITDA up ~3% on a constant $105 million o Operating and SG&A cost currency basis reductions Full Year: o Volume growth in 3 of our 4 o ~$15 million lower annual cash businesses: Catalysts, o Adjusted EBITDA margin interest from reduced rates and Performance Materials and mid 20% recent refinancings Refining Services; double-digit o Adjusted free cash flow sequential quarterly o CARES Act tax deferrals target $130 – $150 million improvement in Performance Chemicals 72020 OUTLOOK AND DECISIVE ACTIONS Rapid COVID-19 response o Ensured health and safety of our employees o Maintained operations with minor disruptions o Adapted to customer demand o Refinanced debt at lower costs with extended maturities Q1 2020 Results 2020 Outlook Additional Actions Second Quarter: Solid performance driven by Target additional free cash flow portfolio diversity; minimal benefits o Sales $360 to $375 impact from COVID-19 million o Capital expenditure reduction ~$15 o Sales up ~2% and adjusted o Adjusted EBITDA $95 to million in the first half of 2020 EBITDA up ~3% on a constant $105 million o Operating and SG&A cost currency basis reductions Full Year: o Volume growth in 3 of our 4 o ~$15 million lower annual cash businesses: Catalysts, o Adjusted EBITDA margin interest from reduced rates and Performance Materials and mid 20% recent refinancings Refining Services; double-digit o Adjusted free cash flow sequential quarterly o CARES Act tax deferrals target $130 – $150 million improvement in Performance Chemicals 7
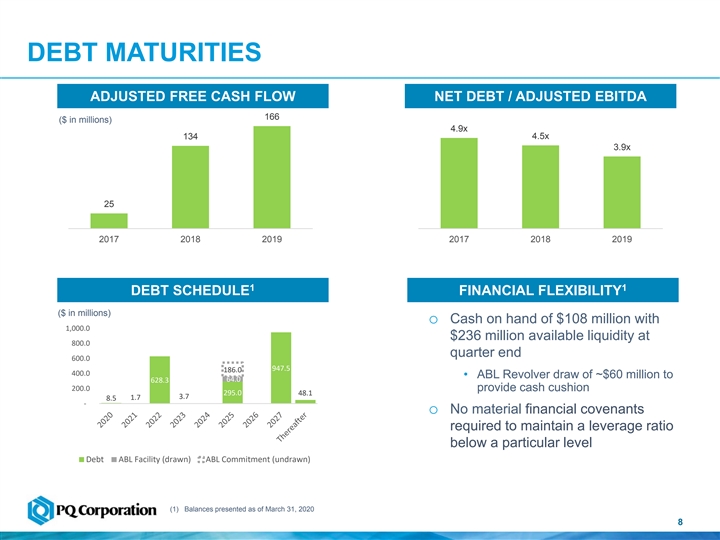
DEBT MATURITIES ADJUSTED FREE CASH FLOW NET DEBT / ADJUSTED EBITDA 166 ($ in millions) 4.9x 4.5x 134 3.9x 25 2017 2018 2019 2017 2018 2019 1 1 DEBT SCHEDULE FINANCIAL FLEXIBILITY ($ in millions) o Cash on hand of $108 million with 1,000.0 $236 million available liquidity at 800.0 quarter end 600.0 947.5 186.0 400.0 • ABL Revolver draw of ~$60 million to 64.0 628.3 200.0 provide cash cushion 295.0 48.1 3.7 1.7 8.5 - o No material financial covenants required to maintain a leverage ratio below a particular level Debt ABL Facility (drawn) ABL Commitment (undrawn) (1) Balances presented as of March 31, 2020 8DEBT MATURITIES ADJUSTED FREE CASH FLOW NET DEBT / ADJUSTED EBITDA 166 ($ in millions) 4.9x 4.5x 134 3.9x 25 2017 2018 2019 2017 2018 2019 1 1 DEBT SCHEDULE FINANCIAL FLEXIBILITY ($ in millions) o Cash on hand of $108 million with 1,000.0 $236 million available liquidity at 800.0 quarter end 600.0 947.5 186.0 400.0 • ABL Revolver draw of ~$60 million to 64.0 628.3 200.0 provide cash cushion 295.0 48.1 3.7 1.7 8.5 - o No material financial covenants required to maintain a leverage ratio below a particular level Debt ABL Facility (drawn) ABL Commitment (undrawn) (1) Balances presented as of March 31, 2020 8

ONGOING PORTFOLIO OPTIMIZATION STRATEGY 2018 – 2019 2020 Assessing opportunities to optimize overall portfolio Monetizing non-core assets within each business at value o Performance Materials asset swap o Sale of o Completed Performance o Refining Services non-core asset sale non-core Chemicals o Completed non- asset sale for product line for o Sale of Performance Chemicals JV interest core asset sale $13 million $28 million for $19 million o Additional monetization of non-core assets in progress o Delayered and o Agreement Advance Performance Chemicals Transformation Plan separated into with INEOS to four distinct expand Silica Enhancing commercial effectiveness, productivity and capital businesses Catalyst product efficiency structure line sales into Ziegler Natta o Expected annualized benefit of $10 to $15 million technology to adjusted EBITDA o Drive cash improvements from reduced working capital and capital expenditures o Anticipate annualized run-rate of these benefits in late 2021/early 2022 9ONGOING PORTFOLIO OPTIMIZATION STRATEGY 2018 – 2019 2020 Assessing opportunities to optimize overall portfolio Monetizing non-core assets within each business at value o Performance Materials asset swap o Sale of o Completed Performance o Refining Services non-core asset sale non-core Chemicals o Completed non- asset sale for product line for o Sale of Performance Chemicals JV interest core asset sale $13 million $28 million for $19 million o Additional monetization of non-core assets in progress o Delayered and o Agreement Advance Performance Chemicals Transformation Plan separated into with INEOS to four distinct expand Silica Enhancing commercial effectiveness, productivity and capital businesses Catalyst product efficiency structure line sales into Ziegler Natta o Expected annualized benefit of $10 to $15 million technology to adjusted EBITDA o Drive cash improvements from reduced working capital and capital expenditures o Anticipate annualized run-rate of these benefits in late 2021/early 2022 9

WHY PQ’s SPECIALTY CHEMICAL PORTFOLIO? #1 and #2 positions in nearly all product lines Sustainable growth from diverse underlying secular macro trends Strategic and extensive global manufacturing network Input cost small as percentage of customer total product cost Track record of innovation and customer collaboration Environmentally friendly end use applications and solutions Stable, high-margins drive strong sustainable free cash flow 10WHY PQ’s SPECIALTY CHEMICAL PORTFOLIO? #1 and #2 positions in nearly all product lines Sustainable growth from diverse underlying secular macro trends Strategic and extensive global manufacturing network Input cost small as percentage of customer total product cost Track record of innovation and customer collaboration Environmentally friendly end use applications and solutions Stable, high-margins drive strong sustainable free cash flow 10

SUPPLEMENTAL INFORMATION 11SUPPLEMENTAL INFORMATION 11

PQ’s PRODUCTS FOR A SUSTAINABLE FUTURE 1 Inorganic Materials Drive ~ 75% of our Sales REFINING SERVICES CATALYSTS Largest North America recycler of spent sulfuric Remove sulfur from diesel fuel for landand acid, avoiding 1.5 million tons of landfill or deep marine transportation well disposal annually Provide active component for > 90% reduction of One of the largest consumers of refinery by- NOx emissions from diesel engines product sulfur, converting for other applications Improve fuel economy by reducing frictionin World class low SO₂ emissions lubricants PERFORMANCE CHEMICALS PERFORMANCE MATERIALS Recycle > 1 billion pounds of glass per year, Silica-based sensory particles for personal care avoiding landfill disposal products replace plastic spheres Improve safety and save lives throughsuperior Specialty silicas for use in environmentally- road and airport marking technologies friendly low VOC coatings Glass bead applications provide alternative to Sodium silicate used in productionof silica to petroleum-based solvents for industrial cleaning replace carbon black in fuel efficient “green tires” and surface finishingapplications Sodium silicates inhibit corrosion in municipal water treatment pipelines Recyclability Safety Conscious Emissions Innovative Green Solution Environmentally Friendly Efficient Energy Usage (1) Based on 2019 Sales 12PQ’s PRODUCTS FOR A SUSTAINABLE FUTURE 1 Inorganic Materials Drive ~ 75% of our Sales REFINING SERVICES CATALYSTS Largest North America recycler of spent sulfuric Remove sulfur from diesel fuel for landand acid, avoiding 1.5 million tons of landfill or deep marine transportation well disposal annually Provide active component for > 90% reduction of One of the largest consumers of refinery by- NOx emissions from diesel engines product sulfur, converting for other applications Improve fuel economy by reducing frictionin World class low SO₂ emissions lubricants PERFORMANCE CHEMICALS PERFORMANCE MATERIALS Recycle > 1 billion pounds of glass per year, Silica-based sensory particles for personal care avoiding landfill disposal products replace plastic spheres Improve safety and save lives throughsuperior Specialty silicas for use in environmentally- road and airport marking technologies friendly low VOC coatings Glass bead applications provide alternative to Sodium silicate used in productionof silica to petroleum-based solvents for industrial cleaning replace carbon black in fuel efficient “green tires” and surface finishingapplications Sodium silicates inhibit corrosion in municipal water treatment pipelines Recyclability Safety Conscious Emissions Innovative Green Solution Environmentally Friendly Efficient Energy Usage (1) Based on 2019 Sales 12

PERFORMANCE CHEMICALS TRANSFORMATION MANUFACTURING NETWORK EXCELLENCE: OPTIMIZATION: EXPECTED Accelerate productivity Align footprint with DRIVERS: BENEFIT: and throughput growth opportunities Commercial $10 million to $15 effectiveness million Adjusted EBITDA on ENHANCE Productivity and annualized basis CUSTOMER sustainability EXPERIENCE improvements Capital efficiency INTEGRATED BUSINESS COMMERCIAL MANAGEMENT: DISCIPLINE: Step change in Enhance customer supply/demand planning account management 13PERFORMANCE CHEMICALS TRANSFORMATION MANUFACTURING NETWORK EXCELLENCE: OPTIMIZATION: EXPECTED Accelerate productivity Align footprint with DRIVERS: BENEFIT: and throughput growth opportunities Commercial $10 million to $15 effectiveness million Adjusted EBITDA on ENHANCE Productivity and annualized basis CUSTOMER sustainability EXPERIENCE improvements Capital efficiency INTEGRATED BUSINESS COMMERCIAL MANAGEMENT: DISCIPLINE: Step change in Enhance customer supply/demand planning account management 13

ADJUSTED FREE CASH FLOW Full Year Full Year Full Year ($ in millions) 2019 2018 2017 Cash Flow from Operations before interest 401.9 377.5 364.5 and tax Less: Cash paid for taxes 17.4 23.8 29.2 1 Cash paid for interest 116.8 105.1 170.1 Cash Flow from Operations 267.7 248.6 165.2 Less: Purchases of property, plant and 127.6 131.7 140.5 2 equipment Free Cash Flow 140.1 116.9 24.7 Plus: Proceeds from sale of assets 17.6 12.4 - Plus: Net interest proceeds on currency 8.5 4.9 - swaps Adjusted Free Cash Flow 166.2 134.2 24.7 (1) Excludes net interest proceeds on swaps designated as net investment hedges (2) Excludes the Company’s proportionate 50% share of capital expenditures from the Zeolyst Joint Venture 14ADJUSTED FREE CASH FLOW Full Year Full Year Full Year ($ in millions) 2019 2018 2017 Cash Flow from Operations before interest 401.9 377.5 364.5 and tax Less: Cash paid for taxes 17.4 23.8 29.2 1 Cash paid for interest 116.8 105.1 170.1 Cash Flow from Operations 267.7 248.6 165.2 Less: Purchases of property, plant and 127.6 131.7 140.5 2 equipment Free Cash Flow 140.1 116.9 24.7 Plus: Proceeds from sale of assets 17.6 12.4 - Plus: Net interest proceeds on currency 8.5 4.9 - swaps Adjusted Free Cash Flow 166.2 134.2 24.7 (1) Excludes net interest proceeds on swaps designated as net investment hedges (2) Excludes the Company’s proportionate 50% share of capital expenditures from the Zeolyst Joint Venture 14

QUARTERLY SEGMENT SALES, ADJUSTED EBITDA AND MARGINS Three Months For the Quarter Ended Ended Three Months Ended Year Ended Year Ended Year Ended December 31, March 31, March 31, June 30, September 30, December 31, December 31, December 31, ($ in millions except %, unaudited) 2020 2019 2019 2019 2019 2019 2018 2017 Sales: 100.7 105.8 117.3 118.3 105.7 447.1 455.6 398.4 Refining Services 24.9 15.9 20.9 25.6 23.3 85.7 72.1 75.3 Silica Catalysts 65.5 61.1 118.9 115.1 67.9 363.0 378.3 324.2 Performance Materials 174.3 180.5 177.8 167.9 158.9 685.1 717.3 687.6 Performance Chemicals (15.1) (13.4) Eliminations (3.8) (4.1) (3.2) (3.1) (3.4) (13.8) 361.6 359.2 431.7 423.8 352.4 1,567.1 1,608.2 1,472.1 Total sales 32.3 29.5 39.1 54.4 47.3 170.3 156.7 143.8 Zeolyst joint venture sales Adjusted EBITDA: 37.2 39.7 42.8 51.2 41.9 175.6 176.5 154.2 Refining Services 22.7 18.1 29.6 31.6 28.5 107.8 81.1 89.4 Catalysts 72.5 Performance Materials 13.5 10.5 29.2 25.8 11.2 76.7 69.7 40.5 42.7 41.2 36.8 33.6 154.3 170.9 170.5 Performance Chemicals Total Segment Adjusted 113.8 111.0 142.8 145.4 115.2 514.4 501.0 483.8 EBITDA (37.0) Corporate (10.7) (10.0) (10.3) (7.7) (12.1) (40.1) (30.5) 103.1 101.0 132.5 137.7 103.1 474.3 464.0 453.3 Total Adjusted EBITDA Adjusted EBITDA Margin: 36.9% 37.5% 36.5% 43.3% 39.6% 39.3% 38.7% 38.7% Refining Services 1 Catalysts 39.7% 40.0% 49.4% 39.5% 40.4% 42.1% 35.4% 40.8% 20.6% 17.2% 24.6% 22.4% 16.5% 21.1% 19.2% 21.5% Performance Materials 23.2% 23.7% 23.1% 21.9% 21.1% 22.5% 23.8% 24.8% Performance Chemicals Total Adjusted EBITDA 26.2% 26.0% 28.1% 28.8% 25.8% 27.3% 26.3% 28.1% 1 Margin (1) Adjusted EBITDA margin calculation includes proportionate 50% share of net sales from Zeolyst Joint Venture 15QUARTERLY SEGMENT SALES, ADJUSTED EBITDA AND MARGINS Three Months For the Quarter Ended Ended Three Months Ended Year Ended Year Ended Year Ended December 31, March 31, March 31, June 30, September 30, December 31, December 31, December 31, ($ in millions except %, unaudited) 2020 2019 2019 2019 2019 2019 2018 2017 Sales: 100.7 105.8 117.3 118.3 105.7 447.1 455.6 398.4 Refining Services 24.9 15.9 20.9 25.6 23.3 85.7 72.1 75.3 Silica Catalysts 65.5 61.1 118.9 115.1 67.9 363.0 378.3 324.2 Performance Materials 174.3 180.5 177.8 167.9 158.9 685.1 717.3 687.6 Performance Chemicals (15.1) (13.4) Eliminations (3.8) (4.1) (3.2) (3.1) (3.4) (13.8) 361.6 359.2 431.7 423.8 352.4 1,567.1 1,608.2 1,472.1 Total sales 32.3 29.5 39.1 54.4 47.3 170.3 156.7 143.8 Zeolyst joint venture sales Adjusted EBITDA: 37.2 39.7 42.8 51.2 41.9 175.6 176.5 154.2 Refining Services 22.7 18.1 29.6 31.6 28.5 107.8 81.1 89.4 Catalysts 72.5 Performance Materials 13.5 10.5 29.2 25.8 11.2 76.7 69.7 40.5 42.7 41.2 36.8 33.6 154.3 170.9 170.5 Performance Chemicals Total Segment Adjusted 113.8 111.0 142.8 145.4 115.2 514.4 501.0 483.8 EBITDA (37.0) Corporate (10.7) (10.0) (10.3) (7.7) (12.1) (40.1) (30.5) 103.1 101.0 132.5 137.7 103.1 474.3 464.0 453.3 Total Adjusted EBITDA Adjusted EBITDA Margin: 36.9% 37.5% 36.5% 43.3% 39.6% 39.3% 38.7% 38.7% Refining Services 1 Catalysts 39.7% 40.0% 49.4% 39.5% 40.4% 42.1% 35.4% 40.8% 20.6% 17.2% 24.6% 22.4% 16.5% 21.1% 19.2% 21.5% Performance Materials 23.2% 23.7% 23.1% 21.9% 21.1% 22.5% 23.8% 24.8% Performance Chemicals Total Adjusted EBITDA 26.2% 26.0% 28.1% 28.8% 25.8% 27.3% 26.3% 28.1% 1 Margin (1) Adjusted EBITDA margin calculation includes proportionate 50% share of net sales from Zeolyst Joint Venture 15

RECONCILATION OF NET INCOME TO SEGMENT ADJUSTED EBITDA Three Months Ended Three Months Ended Year Ended Year Ended Year Ended March 31, March 31, June 30, September 30, December 31, December 31, December 31, December 31, ($ in millions) 2020 2019 2019 2019 2019 2019 2018 2017 Reconciliation of net income attributable to PQ Group Holdings Inc. to Segment Adjusted EBITDA Net income attributable to PQ Group Holdings Inc. 0.2 3.2 30.6 26.7 19.1 79.5 58.3 57.6 Provision for (benefit from) income taxes 1.4 2.4 20.3 16.7 1.2 40.7 29.0 (119.2) Interest expense 24.5 28.6 28.5 27.7 26.7 111.5 113.7 179.0 Depreciation and amortization 45.7 45.9 45.1 44.2 46.9 182.1 185.2 177.1 EBITDA 71.8 80.1 124.5 115.3 93.9 413.8 386.2 294.5 a Joint venture depreciation, amortization and interest 3.8 3.8 3.7 3.7 3.5 14.7 12.6 11.1 b Amortization of investment in affiliate step-up 1.7 2.6 1.7 1.7 1.7 7.5 6.6 8.6 c Amortization of inventory step-up — — — — — — 1.6 0.9 Impairment of fixed assets, intangibles and goodwill — — — — 1.6 1.6 — — Debt extinguishment costs 2.5 — — 1.8 1.6 3.4 7.8 61.9 d Net loss (gain) on asset disposals 9.4 0.8 (9.7) 1.1 (5.3) (13.1) 6.6 5.8 e Foreign currency exchange (gain) loss 3.3 (2.7) 3.6 4.5 (2.6) 2.8 13.8 25.8 f (0.3) 10.2 0.1 0.5 0.3 11.1 8.4 LIFO expense 3.7 g Management advisory fees — — — — — — — 3.8 h Transaction and other related costs 2.1 0.1 1.0 0.7 1.8 3.6 0.9 7.4 Equity-based and other non-cash compensation 5.9 3.4 5.4 4.8 4.6 18.2 19.5 8.8 i Restructuring, integration and business optimization expenses 2.0 0.7 — 0.7 2.7 4.1 14.0 13.2 j Defined benefit plan pension cost (benefit) (0.2) 1.0 0.6 0.8 0.7 3.1 (0.8) 2.9 k Gain on contract termination — — — — — — (20.6) — l Other 1.1 1.0 1.6 2.1 (1.4) 3.5 7.4 4.9 Adjusted EBITDA 103.1 101.0 132.5 137.7 103.1 474.3 464.0 453.3 Unallocated corporate costs 10.7 10.0 10.3 7.7 12.1 40.1 37.0 30.5 1 Total Segment Adjusted EBITDA 113.8 111.0 142.8 145.4 115.2 514.4 501.0 483.8 EBITDA Adjustments by Line Item EBITDA 71.8 80.1 124.5 115.3 93.9 413.8 386.2 294.5 Cost of goods sold 0.4 10.8 0.4 0.9 0.9 13.0 16.3 7.9 Selling, general and administrative expenses 6.5 4.4 5.9 5.7 5.6 21.6 23.0 13.2 Other operating expense (income), net 13.4 1.8 (7.3) 6.5 (1.0) — (0.9) 31.5 Equity in net (income) from affiliated companies 1.7 2.6 1.7 1.7 1.7 7.7 6.6 8.6 2 Other expense (income), net 5.5 (2.5) 3.6 3.9 (1.5) 3.5 20.2 86.5 a Joint venture depreciation, amortization and interest 3.8 3.8 3.7 3.7 3.5 14.7 12.6 11.1 Adjusted EBITDA 103.1 101.0 132.5 137.7 103.1 474.3 464.0 453.3 (1) For additional information with respect to each adjustment, see “Reconciliation of Non-GAAP Financial Measures” (2) Other expense (income), net includes debt extinguishment costs 16RECONCILATION OF NET INCOME TO SEGMENT ADJUSTED EBITDA Three Months Ended Three Months Ended Year Ended Year Ended Year Ended March 31, March 31, June 30, September 30, December 31, December 31, December 31, December 31, ($ in millions) 2020 2019 2019 2019 2019 2019 2018 2017 Reconciliation of net income attributable to PQ Group Holdings Inc. to Segment Adjusted EBITDA Net income attributable to PQ Group Holdings Inc. 0.2 3.2 30.6 26.7 19.1 79.5 58.3 57.6 Provision for (benefit from) income taxes 1.4 2.4 20.3 16.7 1.2 40.7 29.0 (119.2) Interest expense 24.5 28.6 28.5 27.7 26.7 111.5 113.7 179.0 Depreciation and amortization 45.7 45.9 45.1 44.2 46.9 182.1 185.2 177.1 EBITDA 71.8 80.1 124.5 115.3 93.9 413.8 386.2 294.5 a Joint venture depreciation, amortization and interest 3.8 3.8 3.7 3.7 3.5 14.7 12.6 11.1 b Amortization of investment in affiliate step-up 1.7 2.6 1.7 1.7 1.7 7.5 6.6 8.6 c Amortization of inventory step-up — — — — — — 1.6 0.9 Impairment of fixed assets, intangibles and goodwill — — — — 1.6 1.6 — — Debt extinguishment costs 2.5 — — 1.8 1.6 3.4 7.8 61.9 d Net loss (gain) on asset disposals 9.4 0.8 (9.7) 1.1 (5.3) (13.1) 6.6 5.8 e Foreign currency exchange (gain) loss 3.3 (2.7) 3.6 4.5 (2.6) 2.8 13.8 25.8 f (0.3) 10.2 0.1 0.5 0.3 11.1 8.4 LIFO expense 3.7 g Management advisory fees — — — — — — — 3.8 h Transaction and other related costs 2.1 0.1 1.0 0.7 1.8 3.6 0.9 7.4 Equity-based and other non-cash compensation 5.9 3.4 5.4 4.8 4.6 18.2 19.5 8.8 i Restructuring, integration and business optimization expenses 2.0 0.7 — 0.7 2.7 4.1 14.0 13.2 j Defined benefit plan pension cost (benefit) (0.2) 1.0 0.6 0.8 0.7 3.1 (0.8) 2.9 k Gain on contract termination — — — — — — (20.6) — l Other 1.1 1.0 1.6 2.1 (1.4) 3.5 7.4 4.9 Adjusted EBITDA 103.1 101.0 132.5 137.7 103.1 474.3 464.0 453.3 Unallocated corporate costs 10.7 10.0 10.3 7.7 12.1 40.1 37.0 30.5 1 Total Segment Adjusted EBITDA 113.8 111.0 142.8 145.4 115.2 514.4 501.0 483.8 EBITDA Adjustments by Line Item EBITDA 71.8 80.1 124.5 115.3 93.9 413.8 386.2 294.5 Cost of goods sold 0.4 10.8 0.4 0.9 0.9 13.0 16.3 7.9 Selling, general and administrative expenses 6.5 4.4 5.9 5.7 5.6 21.6 23.0 13.2 Other operating expense (income), net 13.4 1.8 (7.3) 6.5 (1.0) — (0.9) 31.5 Equity in net (income) from affiliated companies 1.7 2.6 1.7 1.7 1.7 7.7 6.6 8.6 2 Other expense (income), net 5.5 (2.5) 3.6 3.9 (1.5) 3.5 20.2 86.5 a Joint venture depreciation, amortization and interest 3.8 3.8 3.7 3.7 3.5 14.7 12.6 11.1 Adjusted EBITDA 103.1 101.0 132.5 137.7 103.1 474.3 464.0 453.3 (1) For additional information with respect to each adjustment, see “Reconciliation of Non-GAAP Financial Measures” (2) Other expense (income), net includes debt extinguishment costs 16

RECONCILATION OF QUARTERLY NET INCOME TO ADJUSTED NET INCOME AND ADJUSTED DILUTED EARNINGS PER SHARE Three Months Ended Three Months Ended Year Ended Year Ended March 31, March 31, June 30, September 30, December 31, December 31, ($ in millions except share and per share data) 2020 2019 2019 2019 December 31, 2019 2019 2018 Net Income 0.5 3.5 30.7 26.8 19.4 80.3 59.6 Less: Net income attributable to the non-controlling interest 0.3 0.3 0.1 0.1 0.3 0.8 1.3 1 Net Income attributable to PQ Group Holdings, Inc. 0.2 3.2 30.6 26.7 19.1 79.5 58.3 Diluted net income per share: — 0.02 0.23 0.20 0.14 0.59 0.43 1 Net Income attributable to PQ Group Holdings, Inc. 0.2 3.2 30.6 26.7 19.1 79.5 58.3 b Amortization of investment in affiliate step-up 1.1 1.6 1.0 1.1 1.2 5.0 4.1 c Amortization of inventory step-up — — — — 1.0 — — — 1.1 1.1 — Impairment of long-lived assets — — — Debt extinguishment costs 1.6 — — 1.2 1.1 2.3 4.9 d Net loss (gain) on asset disposal 7.1 0.5 (7.4) 0.8 (3.5) (9.7) 4.2 e Foreign currency exchange (gain) loss 1.0 (2.0) 4.1 3.9 (1.7) 4.3 8.2 f LIFO expense (0.2) 6.5 0.2 0.4 0.4 7.4 5.3 h Transaction and other related costs 1.3 0.1 0.6 0.4 1.3 2.4 0.6 Equity-based and other non-cash compensation 3.8 2.2 3.5 3.2 3.3 12.1 14.9 i 0.5 1.8 2.7 8.8 Restructuring, integration and business optimization expenses 1.3 0.5 — j Defined benefit pension plan cost (benefit) (0.1) 0.6 0.4 0.5 0.5 2.1 (0.5) k Gain on contract termination — — — — (13.0) — — l Other 0.7 0.6 1.0 1.4 (1.0) 2.2 4.6 40.1 23.6 111.4 101.4 Adjusted net income, including tax reform and non-cash GILTI tax 17.8 13.8 34.0 2 Impact of non-cash GILTI tax 7.5 8.2 (5.6) 13.8 21.2 3.9 3.7 3 Impact of tax reform — — — — — — (6.0) Adjusted net income 21.7 17.5 41.5 48.3 18.0 125.2 116.6 Adjusted diluted net income per share: 0.16 0.13 0.31 0.36 0.13 0.92 0.87 Diluted Weighted Average shares outstanding 136.1 134.9 135.3 135.6 136.2 135.5 134.7 (1) For additional information with respect to each adjustment, see “Reconciliations of Non-GAAP Financial Measures” within this appendix (2) Amount represents the impact to tax expense in net income before non-controlling interest and the related adjustments to net income associated with GILTI provisions of the Tax Cuts and Jobs Act of 2017 (“TCJA”). Beginning January 1, 2018, GILTI results in taxation of “excess of foreign earnings,” which is defined as amounts greater than a 10% rate of return on applicable foreign tangible asset basis. The Company is required to record incremental tax provision impact with respect to GILTI as a result of having historical U.S. net operating loss (“NOL”) amounts to offset the GILTI taxable income inclusion. This NOL utilization precludes us from recognizing foreign tax credits (“FTCs”) which would otherwise help offset the tax impacts of GILTI. No FTCs will be recognized with respect to GILTI until our cumulative NOL balance has been exhausted. Because the GILTI provision does not impact our cash taxes (given available U.S. NOLs), and given that we expect to recognize FTCs to offset GILTI impacts once the NOLs are exhausted, we do not view this item as a component of core operations. (3) Represents the provisional benefit (loss) for the impact of the U.S. Tax Cuts and Jobs Act of 2017 and the Dutch Tax Plan 2019 recorded in Net Income 17RECONCILATION OF QUARTERLY NET INCOME TO ADJUSTED NET INCOME AND ADJUSTED DILUTED EARNINGS PER SHARE Three Months Ended Three Months Ended Year Ended Year Ended March 31, March 31, June 30, September 30, December 31, December 31, ($ in millions except share and per share data) 2020 2019 2019 2019 December 31, 2019 2019 2018 Net Income 0.5 3.5 30.7 26.8 19.4 80.3 59.6 Less: Net income attributable to the non-controlling interest 0.3 0.3 0.1 0.1 0.3 0.8 1.3 1 Net Income attributable to PQ Group Holdings, Inc. 0.2 3.2 30.6 26.7 19.1 79.5 58.3 Diluted net income per share: — 0.02 0.23 0.20 0.14 0.59 0.43 1 Net Income attributable to PQ Group Holdings, Inc. 0.2 3.2 30.6 26.7 19.1 79.5 58.3 b Amortization of investment in affiliate step-up 1.1 1.6 1.0 1.1 1.2 5.0 4.1 c Amortization of inventory step-up — — — — 1.0 — — — 1.1 1.1 — Impairment of long-lived assets — — — Debt extinguishment costs 1.6 — — 1.2 1.1 2.3 4.9 d Net loss (gain) on asset disposal 7.1 0.5 (7.4) 0.8 (3.5) (9.7) 4.2 e Foreign currency exchange (gain) loss 1.0 (2.0) 4.1 3.9 (1.7) 4.3 8.2 f LIFO expense (0.2) 6.5 0.2 0.4 0.4 7.4 5.3 h Transaction and other related costs 1.3 0.1 0.6 0.4 1.3 2.4 0.6 Equity-based and other non-cash compensation 3.8 2.2 3.5 3.2 3.3 12.1 14.9 i 0.5 1.8 2.7 8.8 Restructuring, integration and business optimization expenses 1.3 0.5 — j Defined benefit pension plan cost (benefit) (0.1) 0.6 0.4 0.5 0.5 2.1 (0.5) k Gain on contract termination — — — — (13.0) — — l Other 0.7 0.6 1.0 1.4 (1.0) 2.2 4.6 40.1 23.6 111.4 101.4 Adjusted net income, including tax reform and non-cash GILTI tax 17.8 13.8 34.0 2 Impact of non-cash GILTI tax 7.5 8.2 (5.6) 13.8 21.2 3.9 3.7 3 Impact of tax reform — — — — — — (6.0) Adjusted net income 21.7 17.5 41.5 48.3 18.0 125.2 116.6 Adjusted diluted net income per share: 0.16 0.13 0.31 0.36 0.13 0.92 0.87 Diluted Weighted Average shares outstanding 136.1 134.9 135.3 135.6 136.2 135.5 134.7 (1) For additional information with respect to each adjustment, see “Reconciliations of Non-GAAP Financial Measures” within this appendix (2) Amount represents the impact to tax expense in net income before non-controlling interest and the related adjustments to net income associated with GILTI provisions of the Tax Cuts and Jobs Act of 2017 (“TCJA”). Beginning January 1, 2018, GILTI results in taxation of “excess of foreign earnings,” which is defined as amounts greater than a 10% rate of return on applicable foreign tangible asset basis. The Company is required to record incremental tax provision impact with respect to GILTI as a result of having historical U.S. net operating loss (“NOL”) amounts to offset the GILTI taxable income inclusion. This NOL utilization precludes us from recognizing foreign tax credits (“FTCs”) which would otherwise help offset the tax impacts of GILTI. No FTCs will be recognized with respect to GILTI until our cumulative NOL balance has been exhausted. Because the GILTI provision does not impact our cash taxes (given available U.S. NOLs), and given that we expect to recognize FTCs to offset GILTI impacts once the NOLs are exhausted, we do not view this item as a component of core operations. (3) Represents the provisional benefit (loss) for the impact of the U.S. Tax Cuts and Jobs Act of 2017 and the Dutch Tax Plan 2019 recorded in Net Income 17

RECONCILIATION OF SALES AND ADJUSTED EBITDA Year Ended December 31, 2015 2016 Pro Pro 3 3 ($ in millions) 2005 2006 2007 2008 2009 2010 2011 2012 2013 2014 forma forma 2017 2018 2019 Reconciliation of sales and adjusted EBITDA 1 Legacy PQ Sales 635.3 708.6 775.0 977.0 1,009.9 1,087.9 1,115.0 1,084.8 1,085.0 1,114.9 2,5 Legacy Eco Services Sales 260.2 288.7 289.4 449.4 293.9 331.0 415.4 410.4 390.8 397.4 Total Sales 895.5 997.3 1,064.4 1,426.4 1,303.8 1,418.9 1,530.4 1,495.2 1,475.8 1,512.3 1,413.2 1,403.0 1,472.1 1,608.2 1,567.1 Zeolyst Joint Venture total net sales 45.6 60.4 63.8 69.4 63.2 69.9 99.0 87.3 148.5 106.7 159.8 131.3 143.8 156.7 170.3 1 Legacy PQ Adjusted EBITDA 119.6 151.2 177.3 164.3 225.4 253.8 274.6 268.7 306.8 288.1 2 Legacy Eco Services Adjusted EBITDA 71.5 99.0 96.0 106.4 97.5 93.6 99.8 110.8 105.5 107.2 Total Adjusted EBITDA 191.1 250.2 273.3 270.7 322.9 347.4 374.4 379.5 412.3 395.3 413.2 420.8 453.3 464.0 474.3 4 % Adjusted EBITDA Margin 20.3% 23.7% 24.2% 18.1% 23.6% 23.3% 23.0% 24.0% 25.4% 24.4% 26.3% 27.4% 28.1% 26.3% 27.3% (1) Legacy PQ is the results of PQ Holdings Inc. prior to the Business Combination in May 2016 (2) Legacy Eco Services is the results of Eco Services which prior to December 1, 2014 was part of Solvay / Rhodia. Information for 2005 through 2010 is derived from financial information obtained in connection with the acquisition of Legacy Eco and is unaudited and, in some cases, is based upon management estimates (3) Reflects unaudited pro forma results which gives effect to the Business Combination as further described in the company’s annual report on Form 10-K for the year ended December 31, 2017 (4) Adjusted EBITDA margin calculation includes proportionate 50% share of sales from Zeolyst Joint Venture (5) Amounts presented for Legacy Eco Services in 2014 includes $361.8 and $35.5 of sales and $98.1 and $9.1 of Adjusted EBITDA for the predecessor and successor periods, respectively. Refer to reconciliations for additional details. 18RECONCILIATION OF SALES AND ADJUSTED EBITDA Year Ended December 31, 2015 2016 Pro Pro 3 3 ($ in millions) 2005 2006 2007 2008 2009 2010 2011 2012 2013 2014 forma forma 2017 2018 2019 Reconciliation of sales and adjusted EBITDA 1 Legacy PQ Sales 635.3 708.6 775.0 977.0 1,009.9 1,087.9 1,115.0 1,084.8 1,085.0 1,114.9 2,5 Legacy Eco Services Sales 260.2 288.7 289.4 449.4 293.9 331.0 415.4 410.4 390.8 397.4 Total Sales 895.5 997.3 1,064.4 1,426.4 1,303.8 1,418.9 1,530.4 1,495.2 1,475.8 1,512.3 1,413.2 1,403.0 1,472.1 1,608.2 1,567.1 Zeolyst Joint Venture total net sales 45.6 60.4 63.8 69.4 63.2 69.9 99.0 87.3 148.5 106.7 159.8 131.3 143.8 156.7 170.3 1 Legacy PQ Adjusted EBITDA 119.6 151.2 177.3 164.3 225.4 253.8 274.6 268.7 306.8 288.1 2 Legacy Eco Services Adjusted EBITDA 71.5 99.0 96.0 106.4 97.5 93.6 99.8 110.8 105.5 107.2 Total Adjusted EBITDA 191.1 250.2 273.3 270.7 322.9 347.4 374.4 379.5 412.3 395.3 413.2 420.8 453.3 464.0 474.3 4 % Adjusted EBITDA Margin 20.3% 23.7% 24.2% 18.1% 23.6% 23.3% 23.0% 24.0% 25.4% 24.4% 26.3% 27.4% 28.1% 26.3% 27.3% (1) Legacy PQ is the results of PQ Holdings Inc. prior to the Business Combination in May 2016 (2) Legacy Eco Services is the results of Eco Services which prior to December 1, 2014 was part of Solvay / Rhodia. Information for 2005 through 2010 is derived from financial information obtained in connection with the acquisition of Legacy Eco and is unaudited and, in some cases, is based upon management estimates (3) Reflects unaudited pro forma results which gives effect to the Business Combination as further described in the company’s annual report on Form 10-K for the year ended December 31, 2017 (4) Adjusted EBITDA margin calculation includes proportionate 50% share of sales from Zeolyst Joint Venture (5) Amounts presented for Legacy Eco Services in 2014 includes $361.8 and $35.5 of sales and $98.1 and $9.1 of Adjusted EBITDA for the predecessor and successor periods, respectively. Refer to reconciliations for additional details. 18

RECONCILIATIONS FOR ADJUSTED EBITDA 1 Years 2005 – 2014 Legacy PQ Net Income (Loss) to Adjusted EBITDA Year Ended December 31, ($ in millions) 2005 2006 2007 2008 2009 2010 2011 2012 2013 2014 Reconciliation of net income (loss) attributable to Legacy PQ to Adjusted EBITDA Net income (loss) attributable to Legacy PQ (41.9) 14.2 (64.7) (168.2) (10.6) 11.5 (65.4) 5.2 26.7 (3.6) Provision for (benefit from) income taxes (2.2) 14.0 (29.5) (28.7) (12.1) (4.7) (0.4) 18.9 10.6 7.5 Interest expense 38.3 51.9 79.5 119.2 117.8 112.9 121.2 111.2 120.3 111.6 Depreciation and amortization 44.6 46.8 57.1 88.6 99.6 96.1 98.0 93.4 89.4 91.3 EBITDA 38.8 126.9 42.4 10.9 194.7 215.8 153.4 228.7 247.0 206.8 Joint venture depreciation, amortization and interest 2.4 2.1 2.1 2.3 2.1 2.5 3.2 3.3 6.1 6.9 Amortization of investment in affiliate step-up 6.1 1.2 24.7 4.0 2.7 2.7 2.7 2.6 2.4 2.4 Amortization of inventory step-up 32.7 14.0 22.2 28.3 — — — — — — Impairment of long-lived and intangible assets — — — — 0.3 4.2 67.0 — 0.9 — Debt extinguishment costs — — 32.6 — — — 2.3 20.1 20.3 2.5 Net loss on asset disposals 0.3 0.2 0.7 0.1 1.0 (1.1) 2.2 0.8 0.7 0.7 Foreign currency exchange loss (gain) — — 1.2 77.0 (26.9) 13.9 5.6 (1.9) 4.4 23.4 Non-cash revaluation of inventory, including LIFO (0.8) — 1.7 1.1 7.6 (1.5) 1.5 0.3 1.2 0.8 Management advisory fees — 2.0 2.0 3.5 5.0 5.0 7.0 7.5 5.0 5.0 Transaction related costs 29.9 0.5 35.8 11.5 0.5 5.5 7.9 0.5 5.6 24.4 Equity-based and other non-cash compensation 0.1 0.1 0.3 0.7 0.2 1.0 0.3 — 1.0 — Restructuring, integration and business optimization 12.6 4.4 7.3 7.3 11.7 2.6 5.9 5.6 5.4 4.6 expenses Defined benefit plan pension cost (benefit) — — — 0.6 (0.1) — — 0.5 3.6 1.8 Other (2.5) (0.2) 4.3 17.0 26.6 3.2 15.6 0.7 3.2 8.8 Adjusted EBITDA 119.6 151.2 177.3 164.3 225.4 253.8 274.6 268.7 306.8 288.1 (1) Legacy PQ is the results of PQ Holdings Inc. prior to the Business Combination in May 2016 19RECONCILIATIONS FOR ADJUSTED EBITDA 1 Years 2005 – 2014 Legacy PQ Net Income (Loss) to Adjusted EBITDA Year Ended December 31, ($ in millions) 2005 2006 2007 2008 2009 2010 2011 2012 2013 2014 Reconciliation of net income (loss) attributable to Legacy PQ to Adjusted EBITDA Net income (loss) attributable to Legacy PQ (41.9) 14.2 (64.7) (168.2) (10.6) 11.5 (65.4) 5.2 26.7 (3.6) Provision for (benefit from) income taxes (2.2) 14.0 (29.5) (28.7) (12.1) (4.7) (0.4) 18.9 10.6 7.5 Interest expense 38.3 51.9 79.5 119.2 117.8 112.9 121.2 111.2 120.3 111.6 Depreciation and amortization 44.6 46.8 57.1 88.6 99.6 96.1 98.0 93.4 89.4 91.3 EBITDA 38.8 126.9 42.4 10.9 194.7 215.8 153.4 228.7 247.0 206.8 Joint venture depreciation, amortization and interest 2.4 2.1 2.1 2.3 2.1 2.5 3.2 3.3 6.1 6.9 Amortization of investment in affiliate step-up 6.1 1.2 24.7 4.0 2.7 2.7 2.7 2.6 2.4 2.4 Amortization of inventory step-up 32.7 14.0 22.2 28.3 — — — — — — Impairment of long-lived and intangible assets — — — — 0.3 4.2 67.0 — 0.9 — Debt extinguishment costs — — 32.6 — — — 2.3 20.1 20.3 2.5 Net loss on asset disposals 0.3 0.2 0.7 0.1 1.0 (1.1) 2.2 0.8 0.7 0.7 Foreign currency exchange loss (gain) — — 1.2 77.0 (26.9) 13.9 5.6 (1.9) 4.4 23.4 Non-cash revaluation of inventory, including LIFO (0.8) — 1.7 1.1 7.6 (1.5) 1.5 0.3 1.2 0.8 Management advisory fees — 2.0 2.0 3.5 5.0 5.0 7.0 7.5 5.0 5.0 Transaction related costs 29.9 0.5 35.8 11.5 0.5 5.5 7.9 0.5 5.6 24.4 Equity-based and other non-cash compensation 0.1 0.1 0.3 0.7 0.2 1.0 0.3 — 1.0 — Restructuring, integration and business optimization 12.6 4.4 7.3 7.3 11.7 2.6 5.9 5.6 5.4 4.6 expenses Defined benefit plan pension cost (benefit) — — — 0.6 (0.1) — — 0.5 3.6 1.8 Other (2.5) (0.2) 4.3 17.0 26.6 3.2 15.6 0.7 3.2 8.8 Adjusted EBITDA 119.6 151.2 177.3 164.3 225.4 253.8 274.6 268.7 306.8 288.1 (1) Legacy PQ is the results of PQ Holdings Inc. prior to the Business Combination in May 2016 19
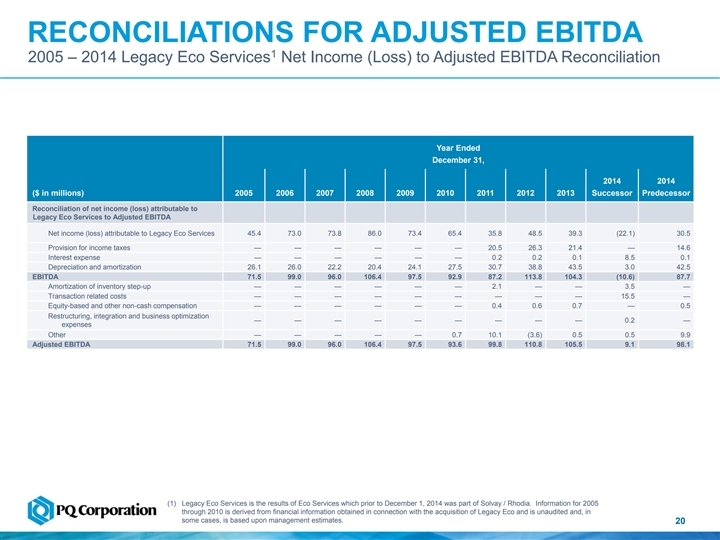
RECONCILIATIONS FOR ADJUSTED EBITDA 1 2005 – 2014 Legacy Eco Services Net Income (Loss) to Adjusted EBITDA Reconciliation Year Ended December 31, 2014 2014 ($ in millions) 2005 2006 2007 2008 2009 2010 2011 2012 2013 Successor Predecessor Reconciliation of net income (loss) attributable to Legacy Eco Services to Adjusted EBITDA Net income (loss) attributable to Legacy Eco Services 45.4 73.0 73.8 86.0 73.4 65.4 35.8 48.5 39.3 (22.1) 30.5 Provision for income taxes — — — — — — 20.5 26.3 21.4 — 14.6 Interest expense — — — — — — 0.2 0.2 0.1 8.5 0.1 Depreciation and amortization 26.1 26.0 22.2 20.4 24.1 27.5 30.7 38.8 43.5 3.0 42.5 EBITDA 71.5 99.0 96.0 106.4 97.5 92.9 87.2 113.8 104.3 (10.6) 87.7 Amortization of inventory step-up — — — — — — 2.1 — — 3.5 — Transaction related costs — — — — — — — — — 15.5 — Equity-based and other non-cash compensation — — — — — — 0.4 0.6 0.7 — 0.5 Restructuring, integration and business optimization — — — — — — — — — 0.2 — expenses Other — — — — — 0.7 10.1 (3.6) 0.5 0.5 9.9 Adjusted EBITDA 71.5 99.0 96.0 106.4 97.5 93.6 99.8 110.8 105.5 9.1 98.1 (1) Legacy Eco Services is the results of Eco Services which prior to December 1, 2014 was part of Solvay / Rhodia. Information for 2005 through 2010 is derived from financial information obtained in connection with the acquisition of Legacy Eco and is unaudited and, in some cases, is based upon management estimates. 20RECONCILIATIONS FOR ADJUSTED EBITDA 1 2005 – 2014 Legacy Eco Services Net Income (Loss) to Adjusted EBITDA Reconciliation Year Ended December 31, 2014 2014 ($ in millions) 2005 2006 2007 2008 2009 2010 2011 2012 2013 Successor Predecessor Reconciliation of net income (loss) attributable to Legacy Eco Services to Adjusted EBITDA Net income (loss) attributable to Legacy Eco Services 45.4 73.0 73.8 86.0 73.4 65.4 35.8 48.5 39.3 (22.1) 30.5 Provision for income taxes — — — — — — 20.5 26.3 21.4 — 14.6 Interest expense — — — — — — 0.2 0.2 0.1 8.5 0.1 Depreciation and amortization 26.1 26.0 22.2 20.4 24.1 27.5 30.7 38.8 43.5 3.0 42.5 EBITDA 71.5 99.0 96.0 106.4 97.5 92.9 87.2 113.8 104.3 (10.6) 87.7 Amortization of inventory step-up — — — — — — 2.1 — — 3.5 — Transaction related costs — — — — — — — — — 15.5 — Equity-based and other non-cash compensation — — — — — — 0.4 0.6 0.7 — 0.5 Restructuring, integration and business optimization — — — — — — — — — 0.2 — expenses Other — — — — — 0.7 10.1 (3.6) 0.5 0.5 9.9 Adjusted EBITDA 71.5 99.0 96.0 106.4 97.5 93.6 99.8 110.8 105.5 9.1 98.1 (1) Legacy Eco Services is the results of Eco Services which prior to December 1, 2014 was part of Solvay / Rhodia. Information for 2005 through 2010 is derived from financial information obtained in connection with the acquisition of Legacy Eco and is unaudited and, in some cases, is based upon management estimates. 20

RECONCILIATIONS FOR ADJUSTED EBITDA Years 2015 – 2019 Post-Business Combination PQ Net Income (Loss) to Adjusted EBITDA Year Ended December 31, 2015 2016 1 1 ($ in millions) Pro forma Pro forma 2017 2018 2019 Reconciliation of net income (loss) attributable to PQ Group Holdings Inc. to Adjusted EBITDA Net income (loss) attributable to PQ Group Holdings Inc. (26.9) (59.0) 57.6 58.3 79.5 Provision for (benefit from) income taxes 1.2 58.0 (119.2) 29.0 40.7 Interest expense 199.6 187.9 179.0 113.7 111.5 Depreciation and amortization 152.2 165.8 177.1 185.2 182.1 EBITDA 326.1 352.7 294.5 386.2 413.8 a Joint venture depreciation, amortization and interest 7.9 10.3 11.1 12.6 14.7 b Amortization of investment in affiliate step-up 6.6 5.8 8.6 6.6 7.5 c Amortization of inventory step-up — 4.9 0.9 1.6 — Impairment of long-lived and intangible assets 0.4 6.9 — — 1.6 Debt extinguishment costs — 1.8 61.9 7.8 3.4 d Net loss on asset disposals 5.5 4.8 5.8 6.6 (13.1) e Foreign currency exchange loss (gain) 21.1 (9.0) 25.8 13.8 2.8 f LIFO expense (2.1) 1.3 3.7 8.4 11.1 g Management advisory fees 5.6 5.3 3.8 — — h Transaction and other related costs 13.2 2.6 7.4 0.9 3.6 Equity-based and other non-cash compensation 4.2 6.5 8.8 19.5 18.2 i Restructuring, integration and business optimization expenses 8.6 17.9 13.2 14.0 4.1 j Defined benefit plan pension cost (benefit) 6.1 2.8 2.9 (0.8) 3.1 Transition services 4.9 — — — — k Gain on contract termination — — — (20.6) — l Other 5.1 6.2 4.9 7.4 3.5 Adjusted EBITDA 413.2 420.8 453.3 464.0 474.3 (1) Reflects unaudited pro forma results which gives effect to the Business Combination as further described in the company’s annual report on Form 10-K for the year ended December 31, 2017 21RECONCILIATIONS FOR ADJUSTED EBITDA Years 2015 – 2019 Post-Business Combination PQ Net Income (Loss) to Adjusted EBITDA Year Ended December 31, 2015 2016 1 1 ($ in millions) Pro forma Pro forma 2017 2018 2019 Reconciliation of net income (loss) attributable to PQ Group Holdings Inc. to Adjusted EBITDA Net income (loss) attributable to PQ Group Holdings Inc. (26.9) (59.0) 57.6 58.3 79.5 Provision for (benefit from) income taxes 1.2 58.0 (119.2) 29.0 40.7 Interest expense 199.6 187.9 179.0 113.7 111.5 Depreciation and amortization 152.2 165.8 177.1 185.2 182.1 EBITDA 326.1 352.7 294.5 386.2 413.8 a Joint venture depreciation, amortization and interest 7.9 10.3 11.1 12.6 14.7 b Amortization of investment in affiliate step-up 6.6 5.8 8.6 6.6 7.5 c Amortization of inventory step-up — 4.9 0.9 1.6 — Impairment of long-lived and intangible assets 0.4 6.9 — — 1.6 Debt extinguishment costs — 1.8 61.9 7.8 3.4 d Net loss on asset disposals 5.5 4.8 5.8 6.6 (13.1) e Foreign currency exchange loss (gain) 21.1 (9.0) 25.8 13.8 2.8 f LIFO expense (2.1) 1.3 3.7 8.4 11.1 g Management advisory fees 5.6 5.3 3.8 — — h Transaction and other related costs 13.2 2.6 7.4 0.9 3.6 Equity-based and other non-cash compensation 4.2 6.5 8.8 19.5 18.2 i Restructuring, integration and business optimization expenses 8.6 17.9 13.2 14.0 4.1 j Defined benefit plan pension cost (benefit) 6.1 2.8 2.9 (0.8) 3.1 Transition services 4.9 — — — — k Gain on contract termination — — — (20.6) — l Other 5.1 6.2 4.9 7.4 3.5 Adjusted EBITDA 413.2 420.8 453.3 464.0 474.3 (1) Reflects unaudited pro forma results which gives effect to the Business Combination as further described in the company’s annual report on Form 10-K for the year ended December 31, 2017 21

CONSTANT CURRENCY SALES AND ADJUSTED EBITDA Three Months Ended March 31, Three Months Ended 2019 March 31, 2020 Constant ($ in millions except %, Currency % Constant unaudited) As Reported FX Impact As Reported Change Currency Sales: $ $ $ $ % Refining Services 100.7 — 100.7 105.8 (4.8) Silica Catalysts 24.9 0.2 25.1 15.9 57.9 Performance Materials 65.5 1.4 66.9 61.1 9.5 Performance Chemicals 174.3 4.2 178.5 180.5 (1.1) Eliminations (3.8) (0.1) (3.9) (4.1) (4.9) Total sales 361.6 5.7 367.3 359.2 2.3 Zeolyst joint venture sales 32.3 — 32.3 29.5 9.6 Adjusted EBITDA: $ $ $ $ % Refining Services 37.2 — 37.2 39.7 (6.3) Catalysts 22.7 0.1 22.8 18.1 26.0 Performance Materials 13.5 0.1 13.6 10.5 29.5 Performance Chemicals 40.5 1.0 41.5 42.7 (2.8) Total Segment Adjusted EBITDA 113.8 1.2 115.0 111.0 3.6 Corporate (10.7) — (10.7) (10.0) 7.0 Total Adjusted EBITDA 103.1 1.2 104.3 101.0 3.3 22CONSTANT CURRENCY SALES AND ADJUSTED EBITDA Three Months Ended March 31, Three Months Ended 2019 March 31, 2020 Constant ($ in millions except %, Currency % Constant unaudited) As Reported FX Impact As Reported Change Currency Sales: $ $ $ $ % Refining Services 100.7 — 100.7 105.8 (4.8) Silica Catalysts 24.9 0.2 25.1 15.9 57.9 Performance Materials 65.5 1.4 66.9 61.1 9.5 Performance Chemicals 174.3 4.2 178.5 180.5 (1.1) Eliminations (3.8) (0.1) (3.9) (4.1) (4.9) Total sales 361.6 5.7 367.3 359.2 2.3 Zeolyst joint venture sales 32.3 — 32.3 29.5 9.6 Adjusted EBITDA: $ $ $ $ % Refining Services 37.2 — 37.2 39.7 (6.3) Catalysts 22.7 0.1 22.8 18.1 26.0 Performance Materials 13.5 0.1 13.6 10.5 29.5 Performance Chemicals 40.5 1.0 41.5 42.7 (2.8) Total Segment Adjusted EBITDA 113.8 1.2 115.0 111.0 3.6 Corporate (10.7) — (10.7) (10.0) 7.0 Total Adjusted EBITDA 103.1 1.2 104.3 101.0 3.3 22

RECONCILIATION OF NON-GAAP FINANCIAL MEASURES Descriptions to PQ Non-GAAP Reconciliations a) We use Adjusted EBITDA as a performance measure to evaluate our financial results. Because our Catalysts segment includes our 50% interest in the Zeolyst Joint venture, we include an adjustment for our 50% proportionate share of depreciation, amortization and interest expense of the Zeolyst Joint venture. b) Represents the amortization of the fair value adjustments associated with the equity affiliate investment in the Zeolyst Joint venture as a result of the combination of the businesses of PQ Holdings Inc. and Eco Services Operations LLC in May 2016 (the “Business Combination”). We determined the fair value of the equity affiliate investment and the fair value step-up was then attributed to the underlying assets of the Zeolyst Joint venture. Amortization is primarily related to the fair value adjustments associated with inventory, fixed assets and intangible assets, including customer relationships and technical know-how. c) As a result of the Sovitec acquisition and the Business Combination, there was a step-up in the fair value of inventory, which is amortized through cost of goods sold in the statements of income. d) When asset disposals occur, we remove the impact of net gain/loss of the disposed asset because such impact primarily reflects the non-cash write-off of long-lived assets no longer in use. During the year ended December 31, 2019, the net gain on asset disposals includes the gains related to the sale of a non-core product line and sale of property. e) Reflects the exclusion of the foreign currency transaction gains and losses in the statements of income primarily related to the non-permanent intercompany debt denominated in local currency translated to U.S. dollars and, during 2018 and 2017, the Euro denominated term loan (which was settled as part of the February 2018 term loan refinancing). f) Represents non-cash adjustments to the Company’s LIFO reserves for certain inventories in the U.S. that are valued using the LIFO method, which we believe provides a means of comparison to other companies that may not use the same basis of accounting for inventories. g) Reflects consulting fees paid to CCMP and affiliates of INEOS for consulting services that include certain financial advisory and management services. These consulting agreements were terminated upon completion of our initial public offering (“IPO”) on October 3, 2017. h) Represents the costs related to several transactions that are completed, pending or abandoned and that we believe are not representative of our ongoing business operations. i) Includes the impact of restructuring, integration and business optimization expenses which are incremental costs that are not representative of our ongoing business operations. j) Represents adjustments for defined benefit pension plan costs in our statements of income. More than two-thirds of our defined benefit pension plan obligations are under defined benefit pension plans that are frozen, and the remaining obligations primarily relate to plans operated in certain of our non-U.S. locations that, pursuant to jurisdictional requirements, cannot be frozen. As such, we do not view such expenses as core to our ongoing business operations. k) Represents a non-cash gain on the write-off of the remaining liability under a contractual supply arrangement. As part of the acquisition by Eco Services Operations LLC of substantially all of the assets of Solvay USA Inc.’s sulfuric acid refining business unit on December 1, 2014, we recognized a liability as part of business combination accounting related to our obligation to serve a customer under a pre-existing unfavorable supply agreement. In December 2018, the customer who was party to the agreement closed its facility, and as a result, we were relieved from our obligation to continue to supply the customer on the below market contract. Because the fair value of the unfavorable contract liability was recognized as part of the application of business combination accounting, and since the write-off of the remaining liability was non-cash in nature, we believe this gain is a special item that is not representative of our ongoing business operations. l) Other costs consist of certain expenses that are not core to our ongoing business operations, including environmental remediation-related costs associated with the legacy operations of our business prior to the Business Combination, capital and franchise taxes, non-cash asset retirement obligation accretion and the initial implementation of procedures to comply with Section 404 of the Sarbanes-Oxley Act. Included in this line-item are rounding discrepancies that may arise from rounding from dollars (in thousands) to dollars (in millions). 23RECONCILIATION OF NON-GAAP FINANCIAL MEASURES Descriptions to PQ Non-GAAP Reconciliations a) We use Adjusted EBITDA as a performance measure to evaluate our financial results. Because our Catalysts segment includes our 50% interest in the Zeolyst Joint venture, we include an adjustment for our 50% proportionate share of depreciation, amortization and interest expense of the Zeolyst Joint venture. b) Represents the amortization of the fair value adjustments associated with the equity affiliate investment in the Zeolyst Joint venture as a result of the combination of the businesses of PQ Holdings Inc. and Eco Services Operations LLC in May 2016 (the “Business Combination”). We determined the fair value of the equity affiliate investment and the fair value step-up was then attributed to the underlying assets of the Zeolyst Joint venture. Amortization is primarily related to the fair value adjustments associated with inventory, fixed assets and intangible assets, including customer relationships and technical know-how. c) As a result of the Sovitec acquisition and the Business Combination, there was a step-up in the fair value of inventory, which is amortized through cost of goods sold in the statements of income. d) When asset disposals occur, we remove the impact of net gain/loss of the disposed asset because such impact primarily reflects the non-cash write-off of long-lived assets no longer in use. During the year ended December 31, 2019, the net gain on asset disposals includes the gains related to the sale of a non-core product line and sale of property. e) Reflects the exclusion of the foreign currency transaction gains and losses in the statements of income primarily related to the non-permanent intercompany debt denominated in local currency translated to U.S. dollars and, during 2018 and 2017, the Euro denominated term loan (which was settled as part of the February 2018 term loan refinancing). f) Represents non-cash adjustments to the Company’s LIFO reserves for certain inventories in the U.S. that are valued using the LIFO method, which we believe provides a means of comparison to other companies that may not use the same basis of accounting for inventories. g) Reflects consulting fees paid to CCMP and affiliates of INEOS for consulting services that include certain financial advisory and management services. These consulting agreements were terminated upon completion of our initial public offering (“IPO”) on October 3, 2017. h) Represents the costs related to several transactions that are completed, pending or abandoned and that we believe are not representative of our ongoing business operations. i) Includes the impact of restructuring, integration and business optimization expenses which are incremental costs that are not representative of our ongoing business operations. j) Represents adjustments for defined benefit pension plan costs in our statements of income. More than two-thirds of our defined benefit pension plan obligations are under defined benefit pension plans that are frozen, and the remaining obligations primarily relate to plans operated in certain of our non-U.S. locations that, pursuant to jurisdictional requirements, cannot be frozen. As such, we do not view such expenses as core to our ongoing business operations. k) Represents a non-cash gain on the write-off of the remaining liability under a contractual supply arrangement. As part of the acquisition by Eco Services Operations LLC of substantially all of the assets of Solvay USA Inc.’s sulfuric acid refining business unit on December 1, 2014, we recognized a liability as part of business combination accounting related to our obligation to serve a customer under a pre-existing unfavorable supply agreement. In December 2018, the customer who was party to the agreement closed its facility, and as a result, we were relieved from our obligation to continue to supply the customer on the below market contract. Because the fair value of the unfavorable contract liability was recognized as part of the application of business combination accounting, and since the write-off of the remaining liability was non-cash in nature, we believe this gain is a special item that is not representative of our ongoing business operations. l) Other costs consist of certain expenses that are not core to our ongoing business operations, including environmental remediation-related costs associated with the legacy operations of our business prior to the Business Combination, capital and franchise taxes, non-cash asset retirement obligation accretion and the initial implementation of procedures to comply with Section 404 of the Sarbanes-Oxley Act. Included in this line-item are rounding discrepancies that may arise from rounding from dollars (in thousands) to dollars (in millions). 23

2424