Attached files
| file | filename |
|---|---|
| 8-K - FORM 8-K - KBS Growth & Income REIT, Inc. | kbsgi8k-webinarmay2020.htm |
Exhibit 99.1 Portfolio Update Meeting May 28, 2020
The information contained herein should be read in conjunction with, and is qualified by, the information in KBS Growth & Income Real Estate Investment Trust’s (the “Company or KBS Growth & Important Income REIT or KBS G&I REIT”) Annual Report on Form 10-K for the year ended December 31, 2019 (the “Annual Report”), and in the Company’s Quarterly Report on Form 10-Q for the period ended March 31, 2020 (the “Quarterly Report”), including the “Risk Factors” contained therein. For a full description of the limitations, methodologies and assumptions used to value KBS G&I REIT’s assets and Disclosures liabilities in connection with the calculation of KBS G&I REIT’s estimated value per share, see KBS G&I REIT’s Current Report on Form 8-K dated December 4, 2019 (the “Valuation 8-K”). Forward-Looking Statements Certain statements contained herein may be deemed to be forward-looking statements within the meaning of the Federal Private Securities Litigation Reform Act of 1995. The Company intends that such forward-looking statements be subject to the safe harbors created by Section 27A of the Securities Act of 1933, as amended, and Section 21E of the Securities Exchange Act of 1934, as amended. These statements include statements regarding the intent, belief or current expectations of the Company and members of its management team, as well as the assumptions on which such statements are based, and generally are identified by the use of words such as “may,” “will,” “seeks,” “anticipates,” “believes,” “estimates,” “expects,” “plans,” “intends,” “should” or similar expressions. Readers are cautioned not to place undue reliance on these forward-looking statements, which speak only as of the date they are made. The Company undertakes no obligation to update or revise forward- looking statements to reflect changed assumptions, the occurrence of unanticipated events or changes to future operating results over time, unless required by law. Such statements are subject to known and unknown risks and uncertainties which could cause actual results to differ materially from those contemplated by such forward-looking statements. The Company makes no representation or warranty (express or implied) about the accuracy of any such forward-looking statements. These statements are based on a number of assumptions involving the judgment of management. The Company may fund distributions from any source including, without limitation, from offering proceeds or borrowings. Distributions paid through March 31, 2020 have been funded in part with cash flow from operating activities and in part with debt financing, including advances from the Company’s advisor. In addition, distributions have been funded with cash resulting from the advisor’s waiver and deferral of its asset management fee. There are no guarantees that the Company will continue to pay distributions or that distributions at the current rate are sustainable. Actual events may cause the value and returns on the Company’s investments to be less than that used for purposes of the Company’s estimated NAV per share. With respect to the NAV per share, the appraisal methodology used for the appraised properties assumes the properties realize the projected net operating income and expected exit cap rates and that investors would be willing to invest in such properties at yields equal to the expected discount rates. Though the appraisals of the appraised properties, with respect to Duff & Phelps, and the valuation estimates used in calculating the estimated value per share, with respect to Duff & Phelps, the Company’s advisor and the Company, are the respective party’s best estimates as of September 30, 2019, the Company can give no assurance in this regard. Even small changes to these assumptions could result in significant differences in the appraised values of the appraised properties and the estimated value per share. These statements herein also depend on factors such as: future economic, competitive and market conditions; the Company’s ability to maintain occupancy levels and rental rates at its real estate properties; and other risks identified in Part I, Item IA of the Company’s Annual Report and in Part II, Item 1A of the Company’s Quarterly Report. Moreover, the estimated NAV per share does not take into account developments in the portfolio since December 4, 2019 and the estimated NAV per share does not take into account the outbreak of the COVID-19 pandemic and its impact on the Company’s portfolio. Further, you should interpret many of the risks that may impact the forward-looking statements herein as being heightened as a result of the ongoing and numerous adverse impacts of the COVID-19 pandemic. WWW. KBS.COM 2
The Impact of COVID-19 on Capital Markets and US Real Estate Investments WWW. KBS.COM 3
COVID-19 Impact Introduction Since initially being reported in December 2019, COVID-19 has spread around the world, including to every state in the United States. On March 11, 2020, the World Health Organization declared COVID-19 a pandemic, and on March 13, 2020, the United States declared a national emergency with respect to COVID- 19. The COVID-19 pandemic has severely impacted global economic activity and caused significant volatility and negative pressure in financial markets. The global impact of the pandemic is rapidly evolving and many countries, including the United States, have reacted by instituting quarantines, mandating business and school closures and restricting travel. As a result, the COVID-19 pandemic is negatively impacting almost every industry, including the real estate industry and the industries of our tenants, directly or indirectly. The extent to which the COVID-19 pandemic impacts our operations and those of our tenants will depend on future developments, which are highly uncertain and cannot be predicted with confidence, including the scope, severity and duration of the pandemic, the actions taken to contain the pandemic or mitigate its impact, and the direct and indirect economic effects of the pandemic and containment measures, among others. Nevertheless, the COVID-19 pandemic presents material uncertainty and risk with respect to our business, financial condition, results of operations and cash flows. We continue to evaluate the impact and uncertainty of the COVID-19 pandemic on our real estate portfolio’s ongoing cash flows. WWW. KBS.COM 4
COVID-19 As one would expect, leasing activity has come to a near halt for property tours and inquiries for new prospects. In Impact (cont.) addition, many of the leasing transactions that were in various stages of negotiation have slowed but continue to move forward slowly. The Federal Government has issued a guideline of three phases for states to begin easing social distancing measures and stay-at-home orders. Across the portfolio the range of expected phase 1 openings of local business varies with the majority of states beginning to ease restrictions under phase 1. Few if any sales transactions are occurring at the moment. Investments that were in various phases of the marketing process have been removed from the market and investments that were under due diligence have also slowed or been dropped by potential purchasers. Lenders remain selective on completing loan originations and are charging higher interest rate spreads, though all in rates remain low due to current LIBOR being near historic lows. WWW. KBS.COM 5
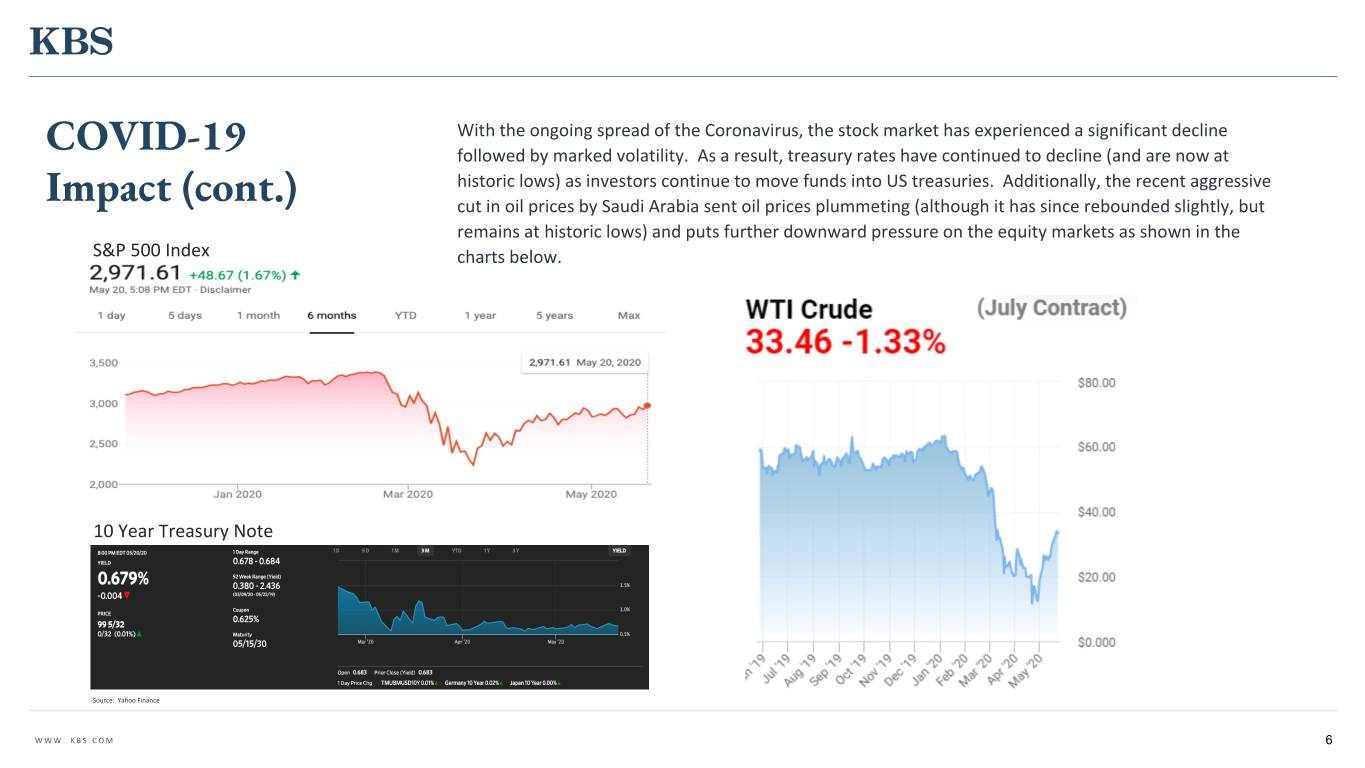
With the ongoing spread of the Coronavirus, the stock market has experienced a significant decline COVID-19 followed by marked volatility. As a result, treasury rates have continued to decline (and are now at historic lows) as investors continue to move funds into US treasuries. Additionally, the recent aggressive Impact (cont.) cut in oil prices by Saudi Arabia sent oil prices plummeting (although it has since rebounded slightly, but remains at historic lows) and puts further downward pressure on the equity markets as shown in the S&P 500 Index charts below. 10 Year Treasury Note Source: Yahoo Finance WWW. KBS.COM 6
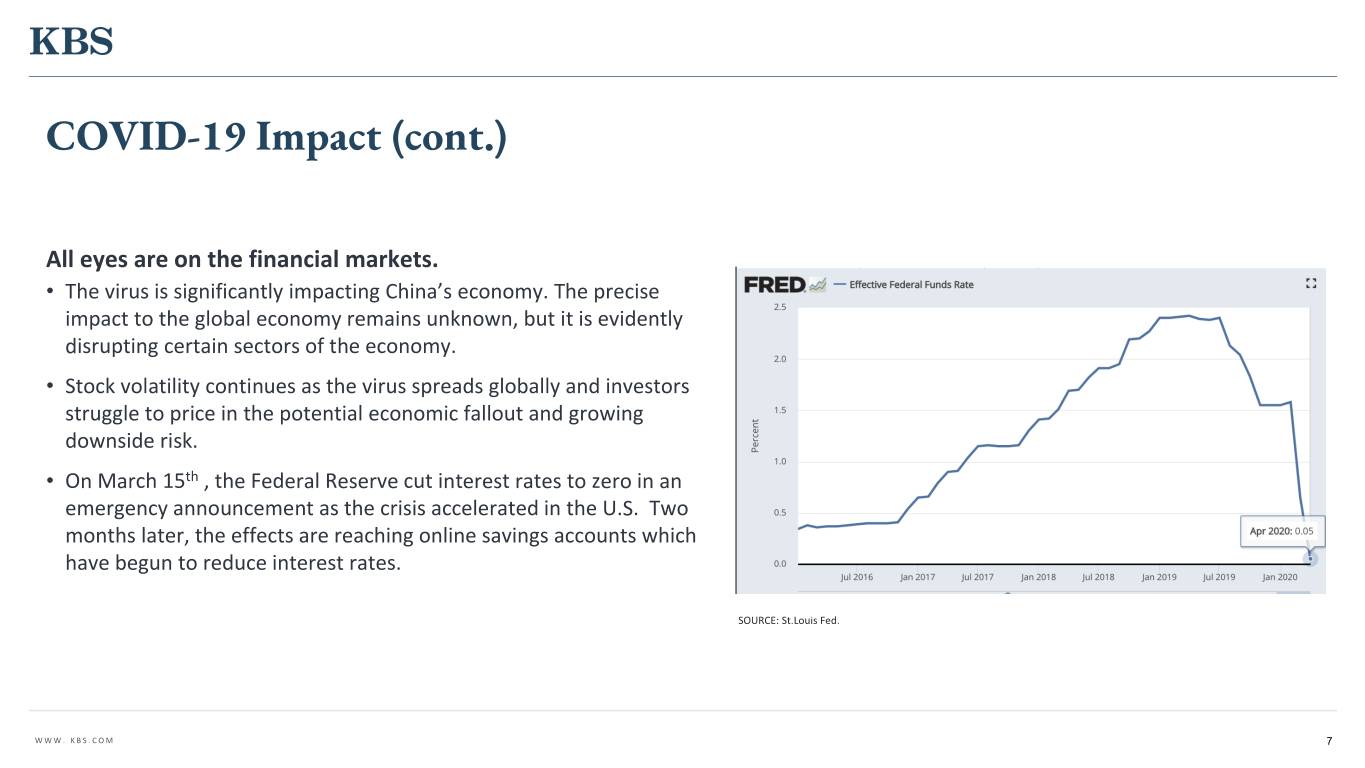
COVID-19 Impact (cont.) All eyes are on the financial markets. • The virus is significantly impacting China’s economy. The precise impact to the global economy remains unknown, but it is evidently disrupting certain sectors of the economy. • Stock volatility continues as the virus spreads globally and investors struggle to price in the potential economic fallout and growing downside risk. • On March 15th , the Federal Reserve cut interest rates to zero in an emergency announcement as the crisis accelerated in the U.S. Two months later, the effects are reaching online savings accounts which have begun to reduce interest rates. SOURCE: St.Louis Fed. WWW. KBS.COM 7
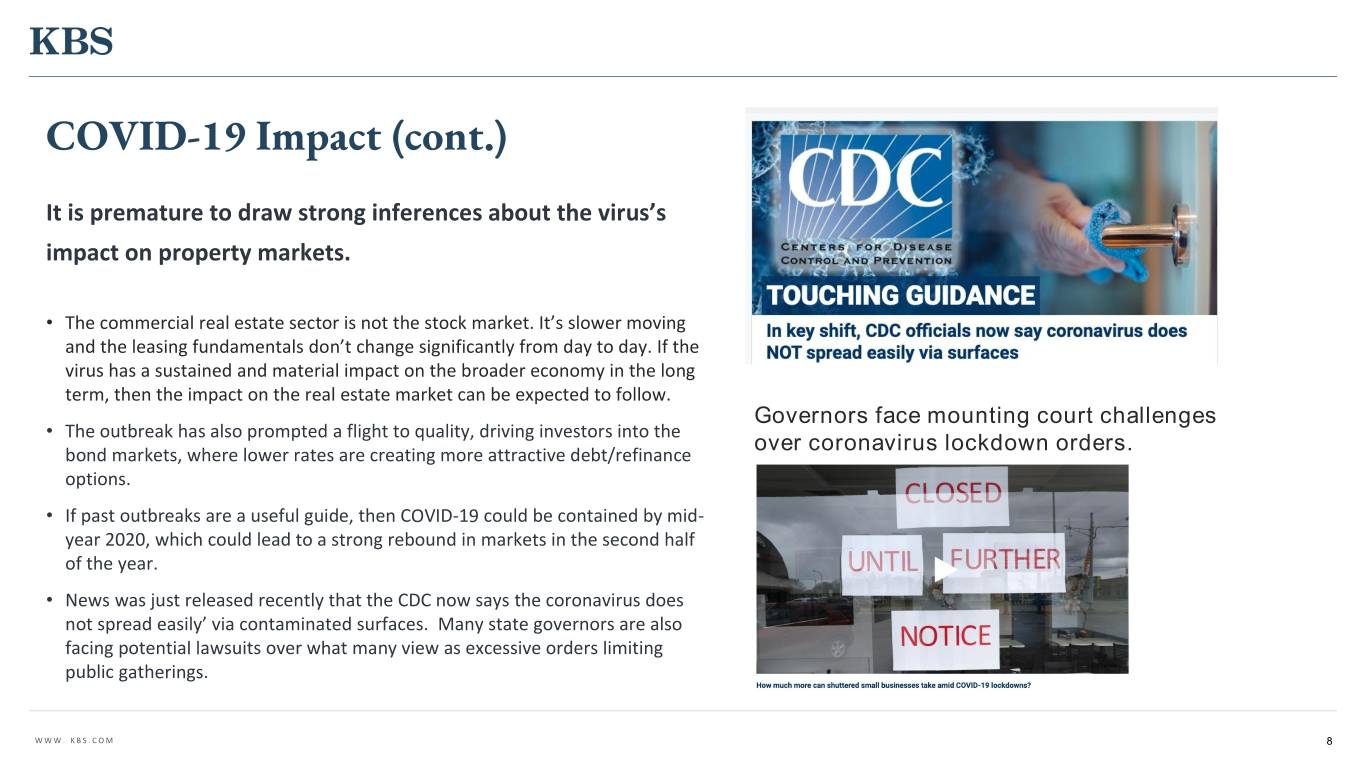
COVID-19 Impact (cont.) It is premature to draw strong inferences about the virus’s impact on property markets. • The commercial real estate sector is not the stock market. It’s slower moving and the leasing fundamentals don’t change significantly from day to day. If the virus has a sustained and material impact on the broader economy in the long term, then the impact on the real estate market can be expected to follow. Governors face mounting court challenges • The outbreak has also prompted a flight to quality, driving investors into the over coronavirus lockdown orders. bond markets, where lower rates are creating more attractive debt/refinance options. • If past outbreaks are a useful guide, then COVID-19 could be contained by mid- year 2020, which could lead to a strong rebound in markets in the second half of the year. • News was just released recently that the CDC now says the coronavirus does not spread easily’ via contaminated surfaces. Many state governors are also facing potential lawsuits over what many view as excessive orders limiting public gatherings. WWW. KBS.COM 8
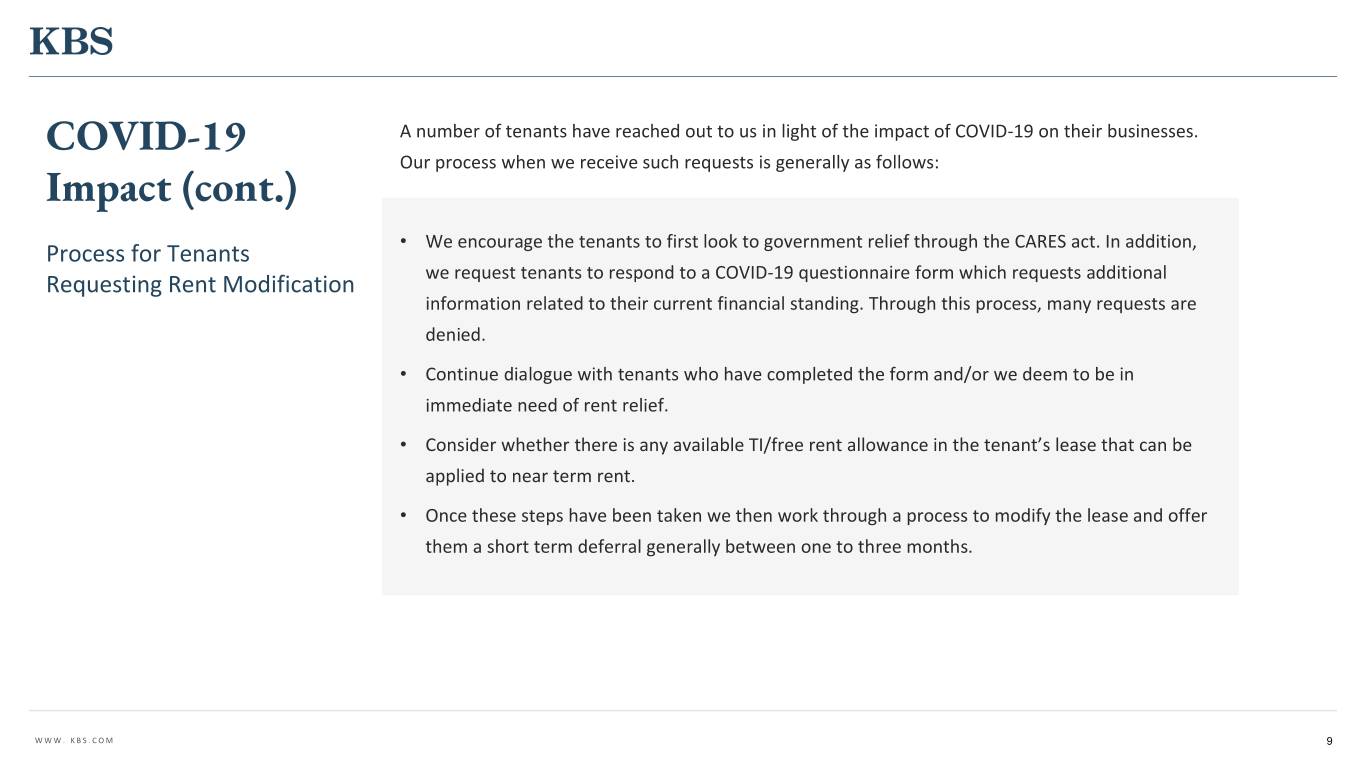
COVID-19 A number of tenants have reached out to us in light of the impact of COVID-19 on their businesses. Our process when we receive such requests is generally as follows: Impact (cont.) • Process for Tenants We encourage the tenants to first look to government relief through the CARES act. In addition, Requesting Rent Modification we request tenants to respond to a COVID-19 questionnaire form which requests additional information related to their current financial standing. Through this process, many requests are denied. • Continue dialogue with tenants who have completed the form and/or we deem to be in immediate need of rent relief. • Consider whether there is any available TI/free rent allowance in the tenant’s lease that can be applied to near term rent. • Once these steps have been taken we then work through a process to modify the lease and offer them a short term deferral generally between one to three months. WWW. KBS.COM 9
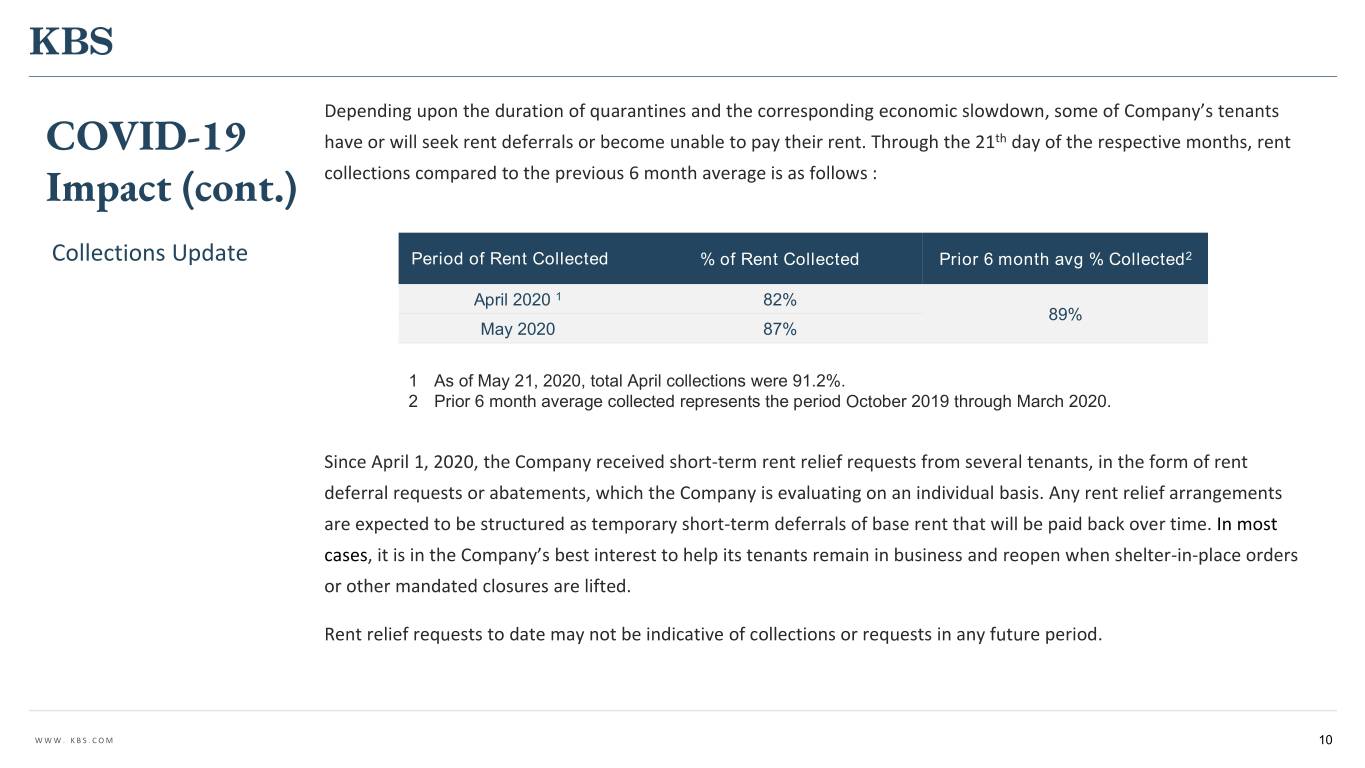
Depending upon the duration of quarantines and the corresponding economic slowdown, some of Company’s tenants COVID-19 have or will seek rent deferrals or become unable to pay their rent. Through the 21th day of the respective months, rent Impact (cont.) collections compared to the previous 6 month average is as follows : Collections Update Period of Rent Collected % of Rent Collected Prior 6 month avg % Collected2 April 2020 1 82% 89% May 2020 87% 1 As of May 21, 2020, total April collections were 91.2%. 2 Prior 6 month average collected represents the period October 2019 through March 2020. Since April 1, 2020, the Company received short-term rent relief requests from several tenants, in the form of rent deferral requests or abatements, which the Company is evaluating on an individual basis. Any rent relief arrangements are expected to be structured as temporary short-term deferrals of base rent that will be paid back over time. In most cases, it is in the Company’s best interest to help its tenants remain in business and reopen when shelter-in-place orders or other mandated closures are lifted. Rent relief requests to date may not be indicative of collections or requests in any future period. WWW. KBS.COM 10
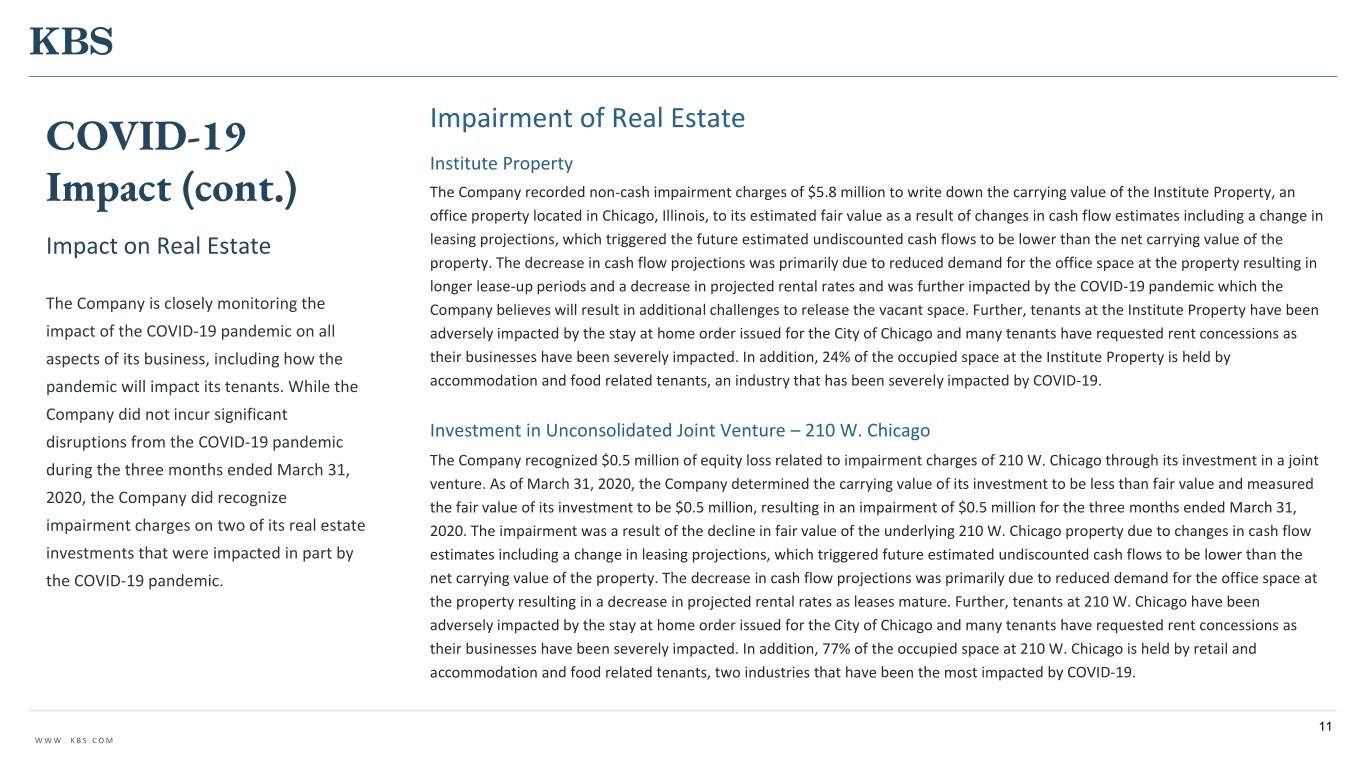
COVID-19 Impairment of Real Estate Institute Property Impact (cont.) The Company recorded non-cash impairment charges of $5.8 million to write down the carrying value of the Institute Property, an office property located in Chicago, Illinois, to its estimated fair value as a result of changes in cash flow estimates including a change in Impact on Real Estate leasing projections, which triggered the future estimated undiscounted cash flows to be lower than the net carrying value of the property. The decrease in cash flow projections was primarily due to reduced demand for the office space at the property resulting in longer lease-up periods and a decrease in projected rental rates and was further impacted by the COVID-19 pandemic which the The Company is closely monitoring the Company believes will result in additional challenges to release the vacant space. Further, tenants at the Institute Property have been impact of the COVID-19 pandemic on all adversely impacted by the stay at home order issued for the City of Chicago and many tenants have requested rent concessions as aspects of its business, including how the their businesses have been severely impacted. In addition, 24% of the occupied space at the Institute Property is held by pandemic will impact its tenants. While the accommodation and food related tenants, an industry that has been severely impacted by COVID-19. Company did not incur significant Investment in Unconsolidated Joint Venture – 210 W. Chicago disruptions from the COVID-19 pandemic The Company recognized $0.5 million of equity loss related to impairment charges of 210 W. Chicago through its investment in a joint during the three months ended March 31, venture. As of March 31, 2020, the Company determined the carrying value of its investment to be less than fair value and measured 2020, the Company did recognize the fair value of its investment to be $0.5 million, resulting in an impairment of $0.5 million for the three months ended March 31, impairment charges on two of its real estate 2020. The impairment was a result of the decline in fair value of the underlying 210 W. Chicago property due to changes in cash flow investments that were impacted in part by estimates including a change in leasing projections, which triggered future estimated undiscounted cash flows to be lower than the the COVID-19 pandemic. net carrying value of the property. The decrease in cash flow projections was primarily due to reduced demand for the office space at the property resulting in a decrease in projected rental rates as leases mature. Further, tenants at 210 W. Chicago have been adversely impacted by the stay at home order issued for the City of Chicago and many tenants have requested rent concessions as their businesses have been severely impacted. In addition, 77% of the occupied space at 210 W. Chicago is held by retail and accommodation and food related tenants, two industries that have been the most impacted by COVID-19. 11 WWW. KBS.COM
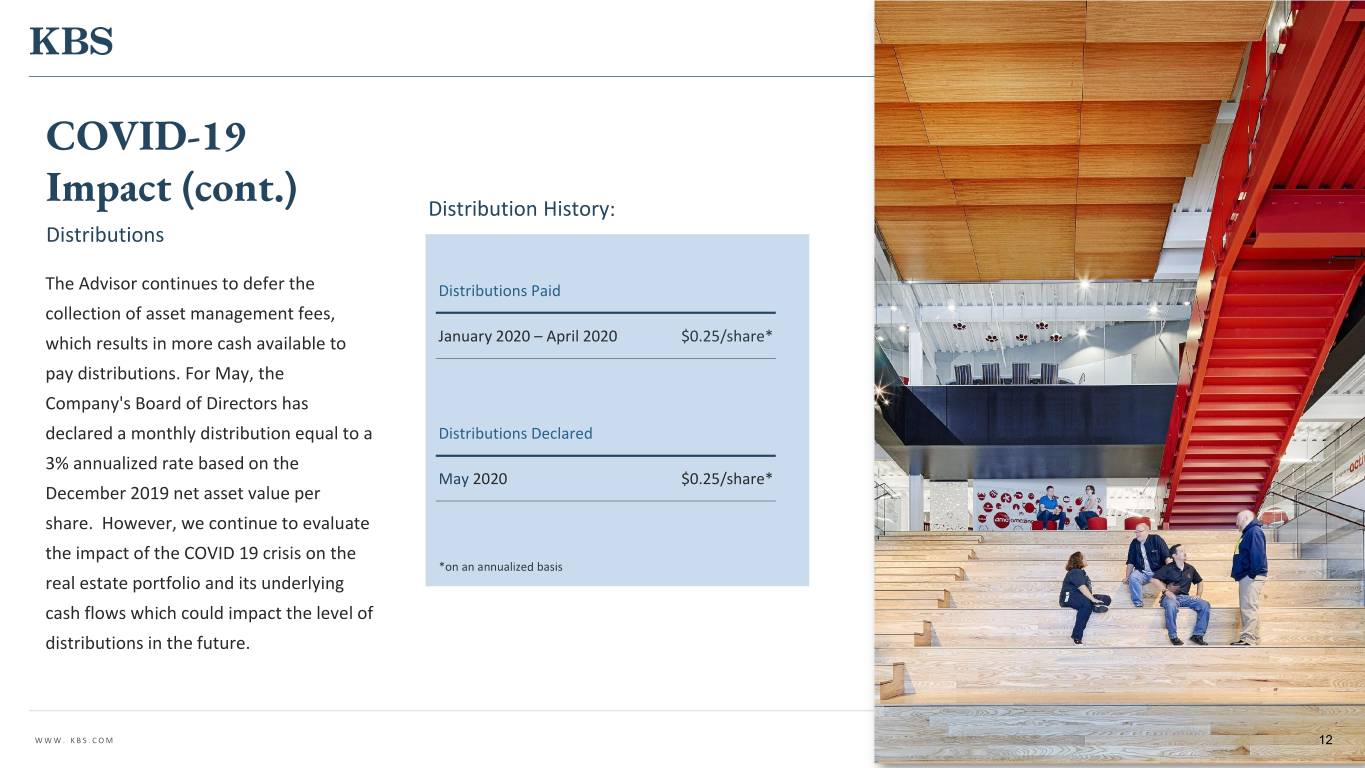
COVID-19 Impact (cont.) Distribution History: Distributions The Advisor continues to defer the Distributions Paid collection of asset management fees, which results in more cash available to January 2020 – April 2020 $0.25/share* pay distributions. For May, the Company's Board of Directors has declared a monthly distribution equal to a Distributions Declared 3% annualized rate based on the May 2020 $0.25/share* December 2019 net asset value per share. However, we continue to evaluate the impact of the COVID 19 crisis on the *on an annualized basis real estate portfolio and its underlying cash flows which could impact the level of distributions in the future. WWW. KBS.COM 12
Portfolio Highlights 13 13
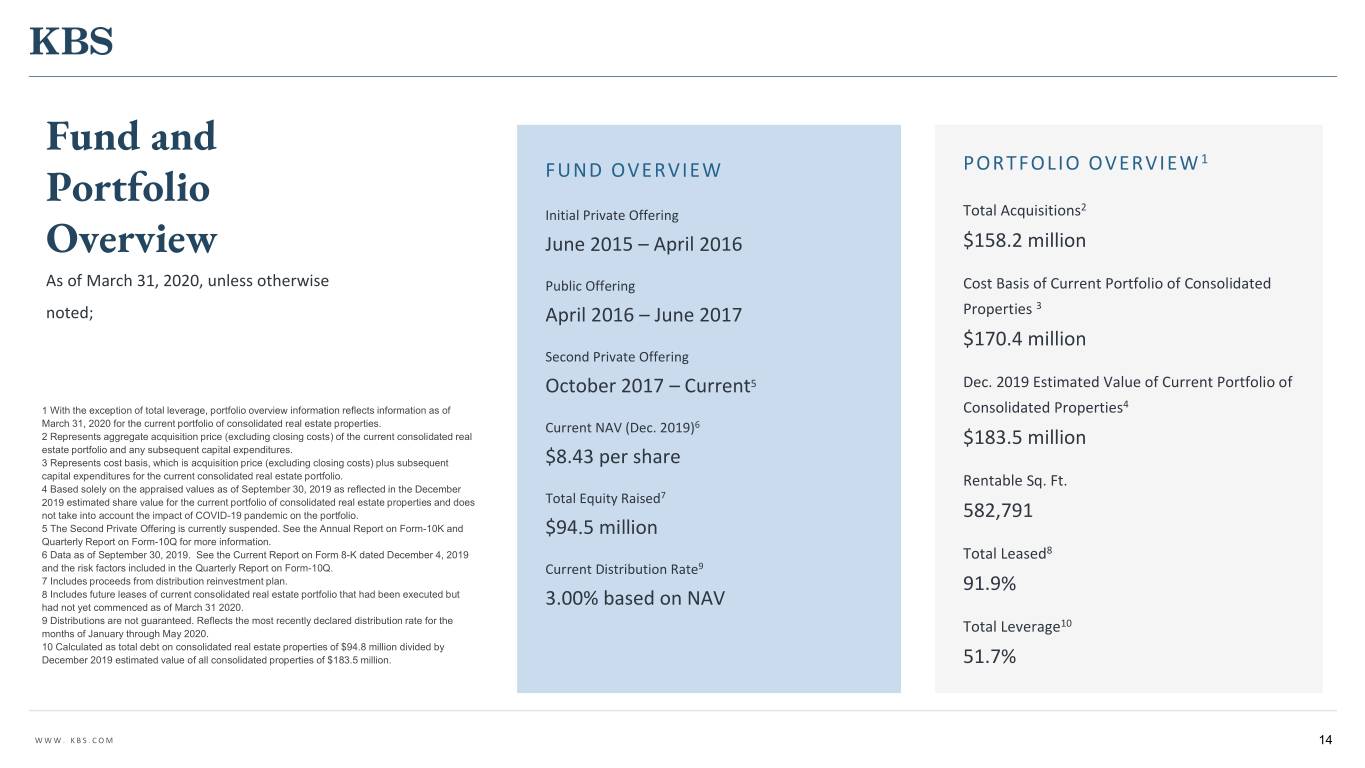
Fund and 1 FUND OVERVIEW PORTFOLIO OVERVIEW Portfolio 2 Initial Private Offering Total Acquisitions Overview June 2015 – April 2016 $158.2 million As of March 31, 2020, unless otherwise Public Offering Cost Basis of Current Portfolio of Consolidated noted; April 2016 – June 2017 Properties 3 $170.4 million Second Private Offering October 2017 – Current5 Dec. 2019 Estimated Value of Current Portfolio of 4 1 With the exception of total leverage, portfolio overview information reflects information as of Consolidated Properties March 31, 2020 for the current portfolio of consolidated real estate properties. Current NAV (Dec. 2019)6 2 Represents aggregate acquisition price (excluding closing costs) of the current consolidated real $183.5 million estate portfolio and any subsequent capital expenditures. 3 Represents cost basis, which is acquisition price (excluding closing costs) plus subsequent $8.43 per share capital expenditures for the current consolidated real estate portfolio. Rentable Sq. Ft. 4 Based solely on the appraised values as of September 30, 2019 as reflected in the December 7 2019 estimated share value for the current portfolio of consolidated real estate properties and does Total Equity Raised not take into account the impact of COVID-19 pandemic on the portfolio. 582,791 5 The Second Private Offering is currently suspended. See the Annual Report on Form-10K and $94.5 million Quarterly Report on Form-10Q for more information. 6 Data as of September 30, 2019. See the Current Report on Form 8-K dated December 4, 2019 Total Leased8 and the risk factors included in the Quarterly Report on Form-10Q. Current Distribution Rate9 7 Includes proceeds from distribution reinvestment plan. 8 Includes future leases of current consolidated real estate portfolio that had been executed but 91.9% had not yet commenced as of March 31 2020. 3.00% based on NAV 9 Distributions are not guaranteed. Reflects the most recently declared distribution rate for the 10 months of January through May 2020. Total Leverage 10 Calculated as total debt on consolidated real estate properties of $94.8 million divided by December 2019 estimated value of all consolidated properties of $183.5 million. 51.7% WWW. KBS.COM 14
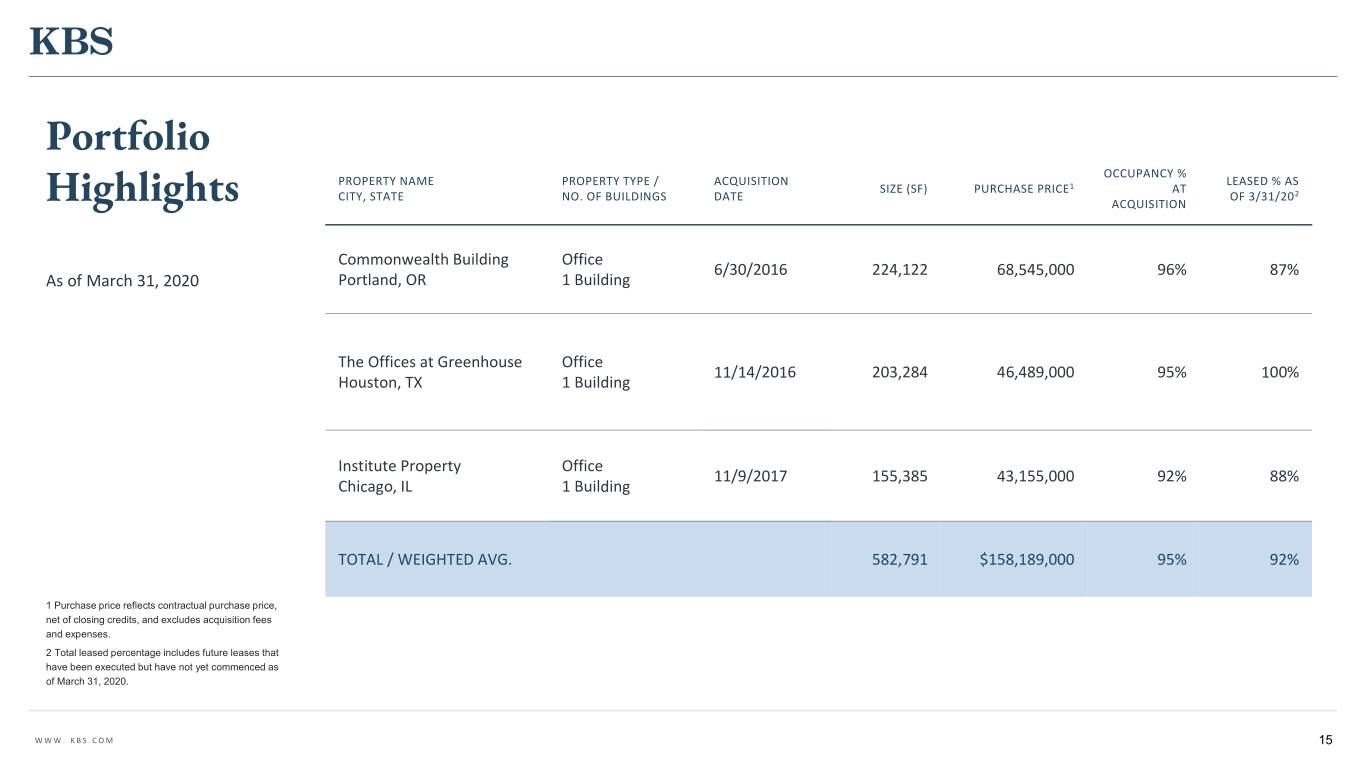
Portfolio OCCUPANCY % PROPERTY NAME PROPERTY TYPE / ACQUISITION LEASED % AS SIZE (SF) PURCHASE PRICE1 AT CITY, STATE NO. OF BUILDINGS DATE OF 3/31/202 Highlights ACQUISITION Commonwealth Building Office 6/30/2016 224,122 68,545,000 96% 87% As of March 31, 2020 Portland, OR 1 Building The Offices at Greenhouse Office 11/14/2016 203,284 46,489,000 95% 100% Houston, TX 1 Building Institute Property Office 11/9/2017 155,385 43,155,000 92% 88% Chicago, IL 1 Building TOTAL / WEIGHTED AVG. 582,791 $158,189,000 95% 92% 1 Purchase price reflects contractual purchase price, net of closing credits, and excludes acquisition fees and expenses. 2 Total leased percentage includes future leases that have been executed but have not yet commenced as of March 31, 2020. WWW. KBS.COM 15
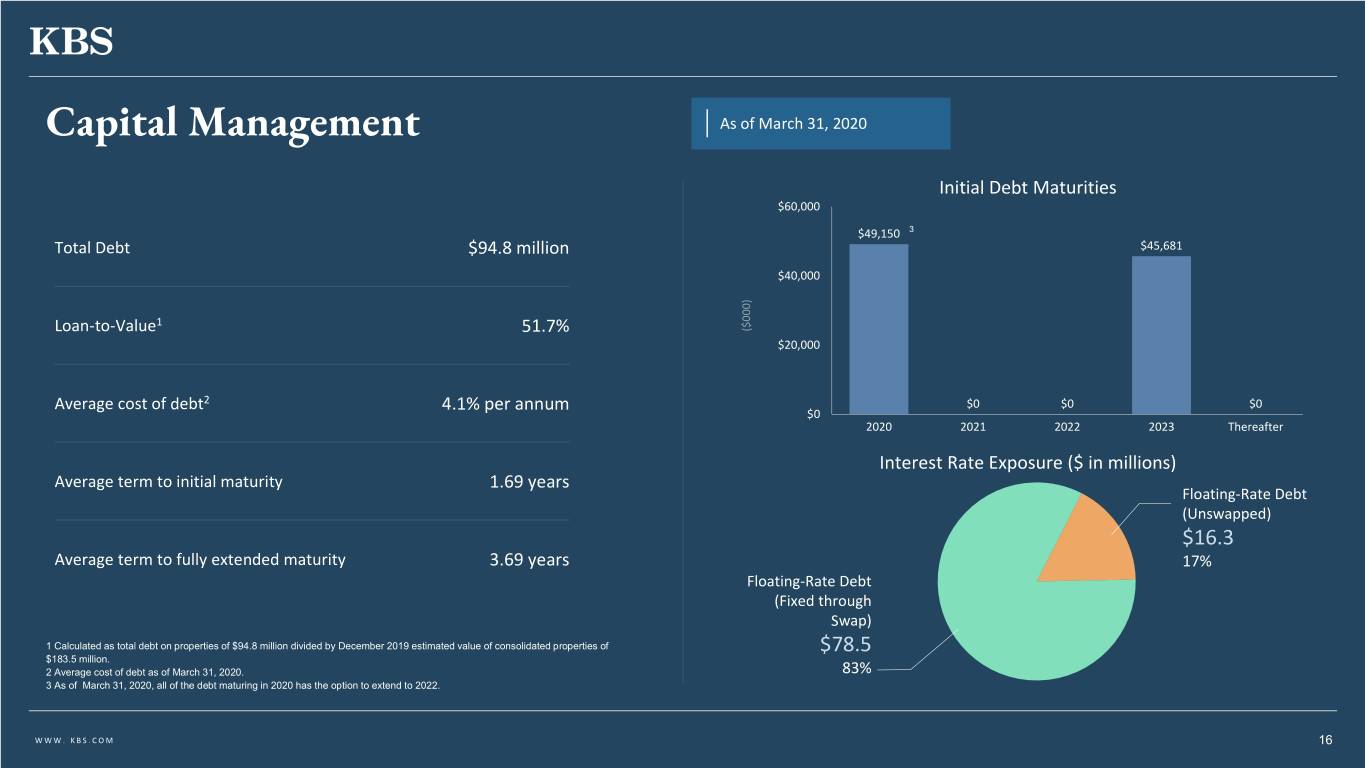
Capital Management As of March 31, 2020 Initial Debt Maturities $60,000 $49,150 3 Total Debt $94.8 million $45,681 $40,000 Loan-to-Value1 51.7% $20,000 Average cost of debt2 4.1% per annum $0 $0 $0 $0 2020 2021 2022 2023 Thereafter Interest Rate Exposure ($ in millions) Average term to initial maturity 1.69 years Floating-Rate Debt (Unswapped) $16.3 Average term to fully extended maturity 3.69 years 17% Floating-Rate Debt (Fixed through Swap) 1 Calculated as total debt on properties of $94.8 million divided by December 2019 estimated value of consolidated properties of $78.5 $183.5 million. 2 Average cost of debt as of March 31, 2020. 83% 3 As of March 31, 2020, all of the debt maturing in 2020 has the option to extend to 2022. WWW. KBS.COM 16
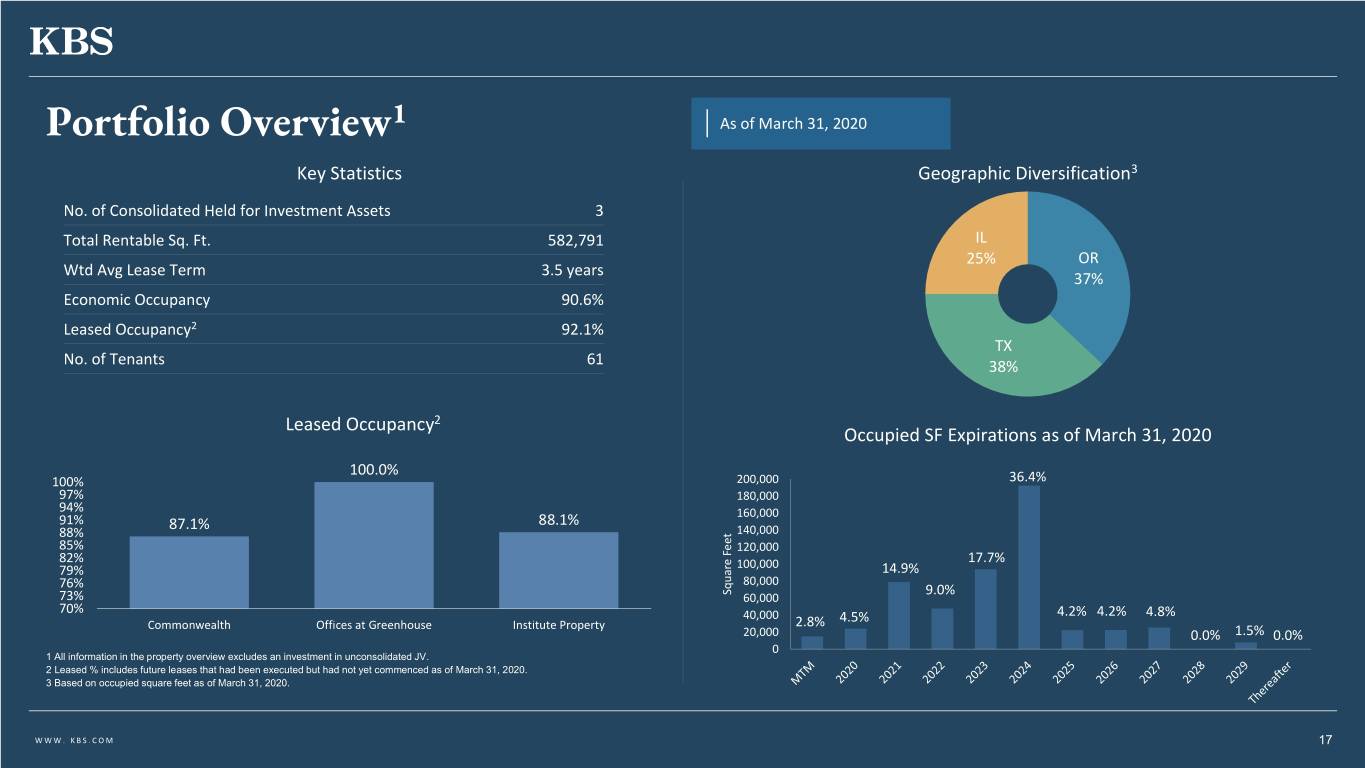
Portfolio Overview1 As of March 31, 2020 Key Statistics Geographic Diversification3 No. of Consolidated Held for Investment Assets 3 Total Rentable Sq. Ft. 582,791 IL 25% OR Wtd Avg Lease Term 3.5 years 37% Economic Occupancy 90.6% Leased Occupancy2 92.1% TX No. of Tenants 61 38% Leased Occupancy2 Occupied SF Expirations as of March 31, 2020 100.0% 100% 200,000 36.4% 97% 180,000 94% 160,000 91% 87.1% 88.1% 88% 140,000 85% 120,000 82% 17.7% 79% 100,000 14.9% 76% 80,000 Square Feet Square 9.0% 73% 60,000 70% 40,000 4.5% 4.2% 4.2% 4.8% Commonwealth Offices at Greenhouse Institute Property 2.8% 20,000 0.0% 1.5% 0.0% 0 1 All information in the property overview excludes an investment in unconsolidated JV. 2 Leased % includes future leases that had been executed but had not yet commenced as of March 31, 2020. 3 Based on occupied square feet as of March 31, 2020. WWW. KBS.COM 17
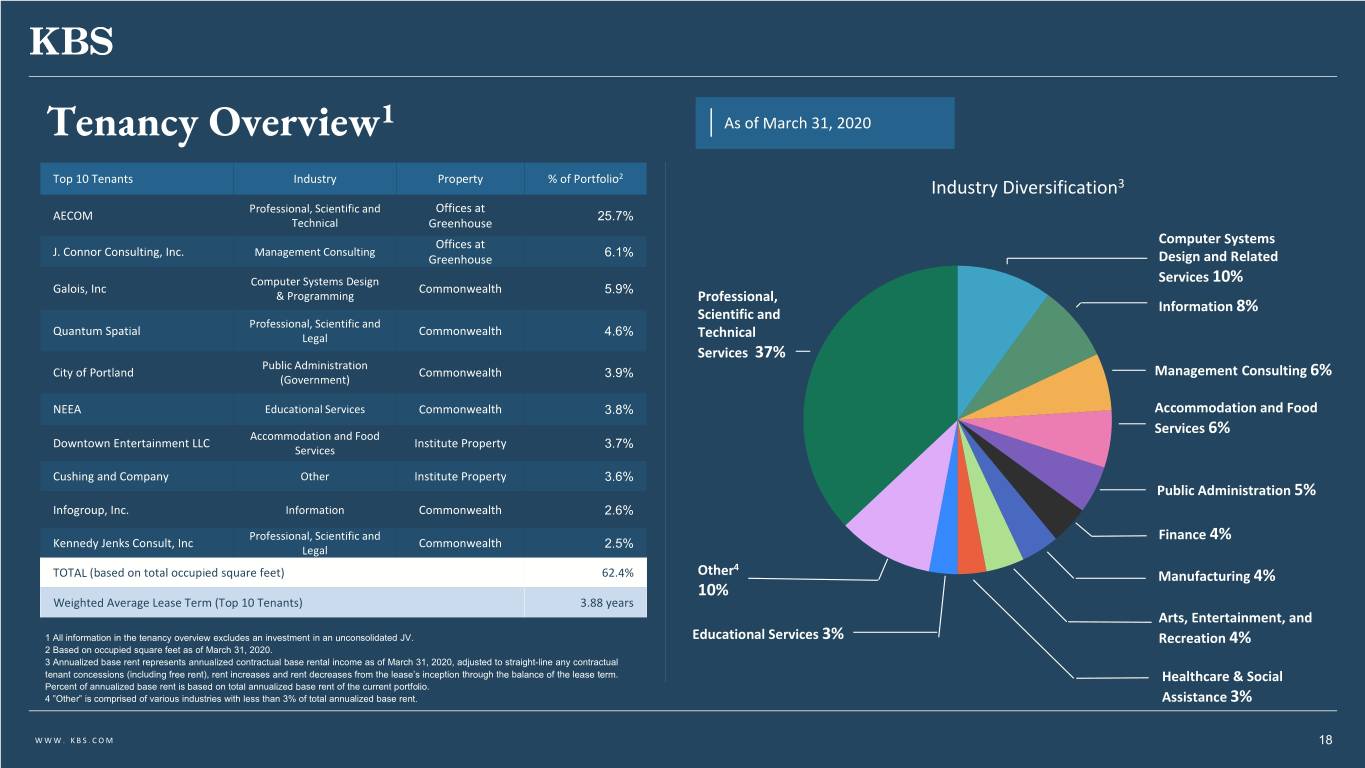
Tenancy Overview1 As of March 31, 2020 2 Top 10 Tenants Industry Property % of Portfolio Industry Diversification3 Professional, Scientific and Offices at AECOM 25.7% Technical Greenhouse Offices at Computer Systems J. Connor Consulting, Inc. Management Consulting 6.1% Greenhouse Design and Related Computer Systems Design Services 10% Galois, Inc Commonwealth 5.9% & Programming Professional, Information Scientific and 8% Professional, Scientific and Quantum Spatial Commonwealth 4.6% Legal Technical Services 37% Public Administration City of Portland Commonwealth 3.9% Management Consulting 6% (Government) NEEA Educational Services Commonwealth 3.8% Accommodation and Food Services Accommodation and Food 6% Downtown Entertainment LLC Institute Property 3.7% Services Cushing and Company Other Institute Property 3.6% Public Administration 5% Infogroup, Inc. Information Commonwealth 2.6% Professional, Scientific and Finance 4% Kennedy Jenks Consult, Inc Commonwealth 2.5% Legal 4 TOTAL (based on total occupied square feet) 62.4% Other Manufacturing 4% 10% Weighted Average Lease Term (Top 10 Tenants) 3.88 years Arts, Entertainment, and 1 All information in the tenancy overview excludes an investment in an unconsolidated JV. Educational Services 3% Recreation 4% 2 Based on occupied square feet as of March 31, 2020. 3 Annualized base rent represents annualized contractual base rental income as of March 31, 2020, adjusted to straight-line any contractual tenant concessions (including free rent), rent increases and rent decreases from the lease’s inception through the balance of the lease term. Healthcare & Social Percent of annualized base rent is based on total annualized base rent of the current portfolio. 4 ”Other” is comprised of various industries with less than 3% of total annualized base rent. Assistance 3% WWW. KBS.COM 18
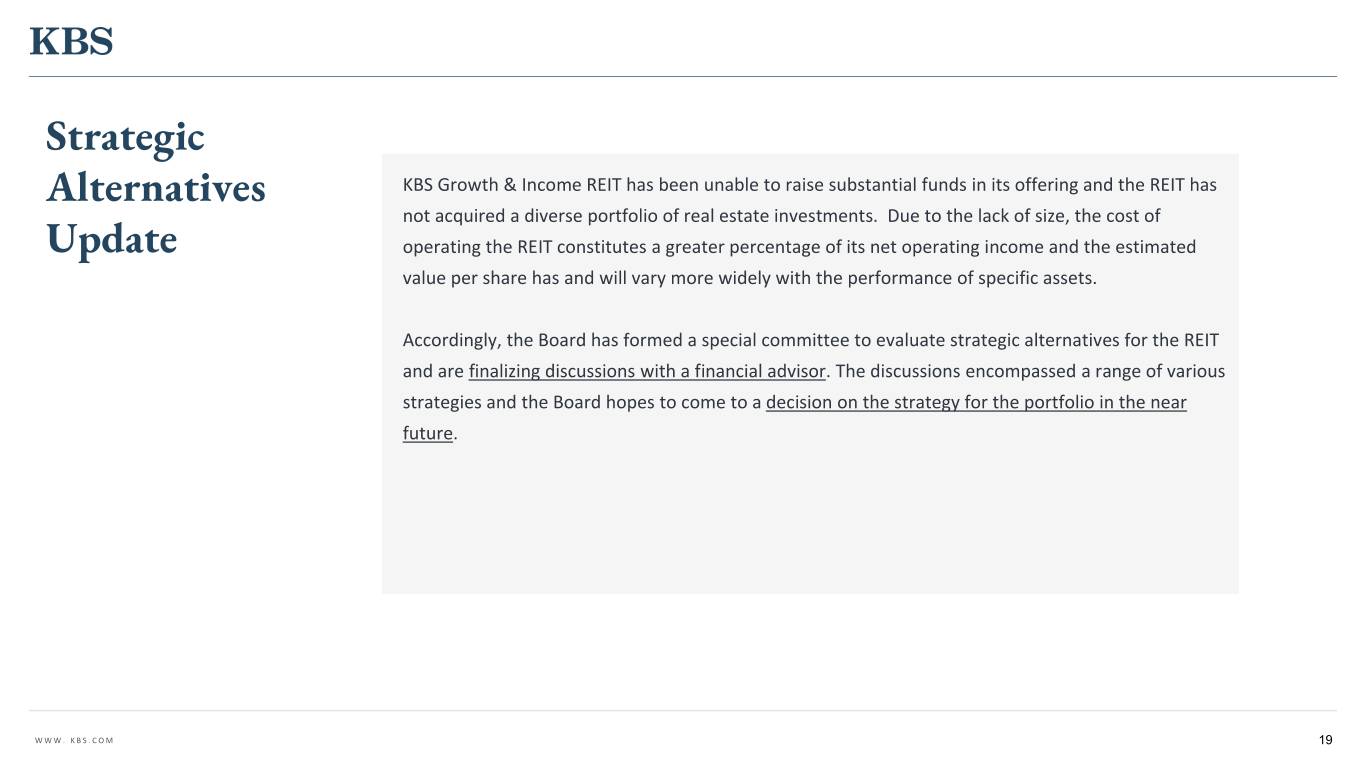
Strategic Alternatives KBS Growth & Income REIT has been unable to raise substantial funds in its offering and the REIT has not acquired a diverse portfolio of real estate investments. Due to the lack of size, the cost of Update operating the REIT constitutes a greater percentage of its net operating income and the estimated value per share has and will vary more widely with the performance of specific assets. Accordingly, the Board has formed a special committee to evaluate strategic alternatives for the REIT and are finalizing discussions with a financial advisor. The discussions encompassed a range of various strategies and the Board hopes to come to a decision on the strategy for the portfolio in the near future. WWW. KBS.COM 19
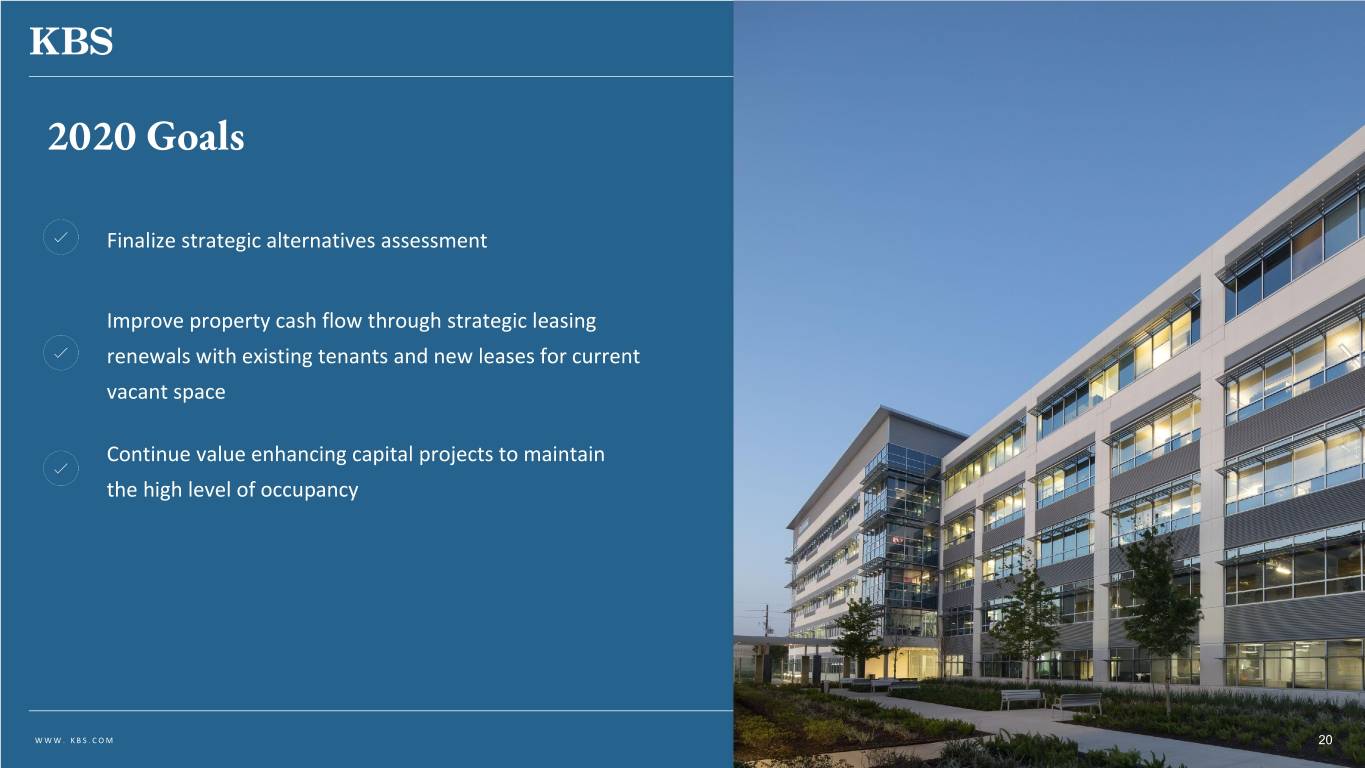
2020 Goals Finalize strategic alternatives assessment Improve property cash flow through strategic leasing renewals with existing tenants and new leases for current vacant space Continue value enhancing capital projects to maintain the high level of occupancy WWW. KBS.COM 20
Q&A For additional questions, contact KBS Capital Markets Group Investor Relations (866) 527-4264 21
