Attached files
| file | filename |
|---|---|
| 8-K - FORM 8-K - Essent Group Ltd. | tm2021200-2_8k.htm |
Exhibit 99.1
 |
Investor Presentation May 28th, 2020 |
 |
Disclaimer Forward-Looking Statements This presentation may include “forward-looking statements” which are subject to known and unknown risks and uncertainties, many of which may be beyond the Company’s control. Forward-looking statements generally can be identified by the use of forward-looking terminology such as “may,” “will,” “should,” “expect,” “plan,” “anticipate,” “believe,” “estimate,” “predict,” or “potential” or the negative thereof or variations thereon or similar terminology. Actual events, results and outcomes may differ materially from the Company’s expectations due to a variety of known and unknown risks, uncertainties and other factors. Although it is not possible to identify all of these risks and factors, they include, among others, the following: the impact of COVID-19 and related economic conditions; changes in or to Fannie Mae and Freddie Mac (the “GSEs”), whether through Federal legislation, restructurings or a shift in business practices; failure to continue to meet the mortgage insurer eligibility requirements of the GSEs; competition for customers; lenders or investors seeking alternatives to private mortgage insurance; an increase in the number of loans insured through Federal government mortgage insurance programs, including those offered by the Federal Housing Administration; decline in new insurance written and franchise value due to loss of a significant customer; decline in the volume of low down payment mortgage originations; the definition of “Qualified Mortgage” reducing the size of the mortgage origination market or creating incentives to use government mortgage insurance programs; the definition of “Qualified Residential Mortgage” reducing the number of low down payment loans or lenders and investors seeking alternatives to private mortgage insurance; the implementation of the Basel III Capital Accord discouraging the use of private mortgage insurance; a decrease in the length of time that insurance policies are in force; uncertainty of loss reserve estimates; deteriorating economic conditions; the Company’s non-U.S. operations becoming subject to U.S. Federal income taxation; and becoming considered a passive foreign investment company for U.S. Federal income tax purposes. Any forward-looking information presented herein is made only as of the date of this presentation, and the Company does not undertake any obligation to update or revise any forward-looking information to reflect changes in assumptions, the occurrence of unanticipated events, or otherwise. Other factors not identified above, including those described under the headings “Risk Factors” and “Management’s Discussion and Analysis of Financial Condition and Results of Operations,” in the Company’s Annual Report on Form 10-K for the year ended December 31, 2019 filed with the Securities and Exchange Commission on February 18, 2020 and in the Company’s Quarterly Report on Form 10-Q for the period ended March 31, 2020 filed with the Securities and Exchange Commission on May 8, 2020, may also cause actual results to differ materially from those described in the Company’s forward-looking statements. Most of these factors are difficult to anticipate and are generally beyond the Company’s control. You should consider these factors in connection with considering any forward-looking statements that may be made by the Company and its businesses generally. The modeling scenarios described on the page titled “Illustrative Stress Testing Scenarios” are hypothetical and have been provided to give a general sense of how the Company could be affected by COVID-19, depending on the duration and severity of the pandemic and related governmental and social responses and the economic consequences of the pandemic. There are many modeling scenarios that could result in materially different projected outcomes from the three described herein and, accordingly the modeling scenarios described herein do not constitute an exclusive set of possible outcomes resulting from COVID-19 which could affect the Company, results of operations, financial condition and liquidity. Similarly, given the unprecedented nature of the COVID-19 pandemic, the assumptions used in these modeling scenarios, and the related range of outcomes, are based on assumed facts which are inherently unpredictable and, accordingly, if the pandemic progresses and updated assumptions were to be applied to the modeling scenarios the outcome generated by the application of updated assumptions to these modeling scenarios may be materially different from those described herein. Similarly, if the economic impact of COVID-19 is ultimately worse than contemplated by the Company’s modeled scenarios, the impact to the Company, results of operations, financial condition and liquidity could be significantly different than described herein. 2 |
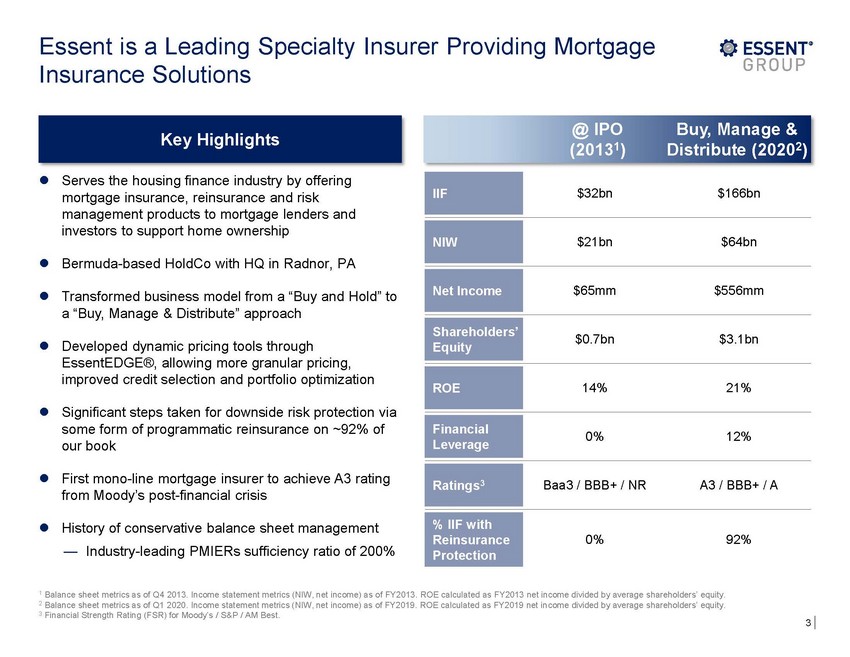 |
Essent is a Leading Specialty Insurance Solutions Insurer Providing Mortgage @ IPO (20131) Buy, Manage & Distribute (20202) Serves the housing finance industry by offering mortgage insurance, reinsurance and risk management products to mortgage lenders and investors to support home ownership $32bn $166bn $21bn $64bn Bermuda-based HoldCo with HQ in Radnor, PA $65mm $556mm Transformed business model from a “Buy and Hold” to a “Buy, Manage & Distribute” approach $0.7bn $3.1bn Developed dynamic pricing tools through EssentEDGE®, allowing more granular pricing, improved credit selection and portfolio optimization 14% 21% Significant steps taken for downside risk protection via some form of programmatic reinsurance on ~92% of our book 0% 12% First mono-line mortgage insurer to achieve A3 rating from Moody’s post-financial crisis Baa3 / BBB+ / NR A3 / BBB+ / A History of conservative balance sheet management — Industry-leading PMIERs sufficiency ratio of 200% 0% 92% 1 Balance sheet metrics as of Q4 2013. Income statement metrics (NIW, net income) as of FY2013. ROE calculated as FY2013 net income divided by average shareholders’ equity. 2 Balance sheet metrics as of Q1 2020. Income statement metrics (NIW, net income) as of FY2019. ROE calculated as FY2019 net income divided by average shareholders’ equity. 3 Financial Strength Rating (FSR) for Moody’s / S&P / AM Best. 3 % IIF with Reinsurance Protection Ratings3 Financial Leverage ROE Shareholders’ Equity Net Income NIW IIF Key Highlights |
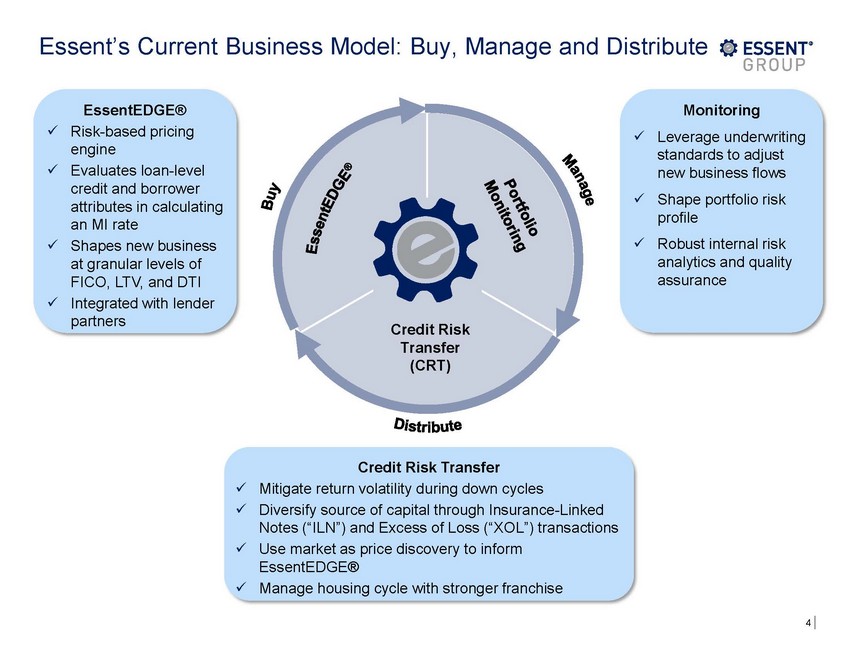 |
Essent’s Current Business Model: Buy, Manage and Distribute EssentEDGE® Risk-based pricing engine Evaluates loan-level credit and borrower attributes in calculating an MI rate Shapes new business at granular levels of FICO, LTV, and DTI Integrated with lender partners Monitoring Leverage underwriting standards to adjust new business flows Shape portfolio risk profile Robust internal risk analytics and quality assurance x x x x x x x Credit Risk Transfer (CRT) Credit Risk Transfer Mitigate return volatility during down cycles Diversify source of capital through Insurance-Linked Notes (“ILN”) and Excess of Loss (“XOL”) transactions Use market as price discovery to inform EssentEDGE® Manage housing cycle with stronger franchise x x x x 4 |
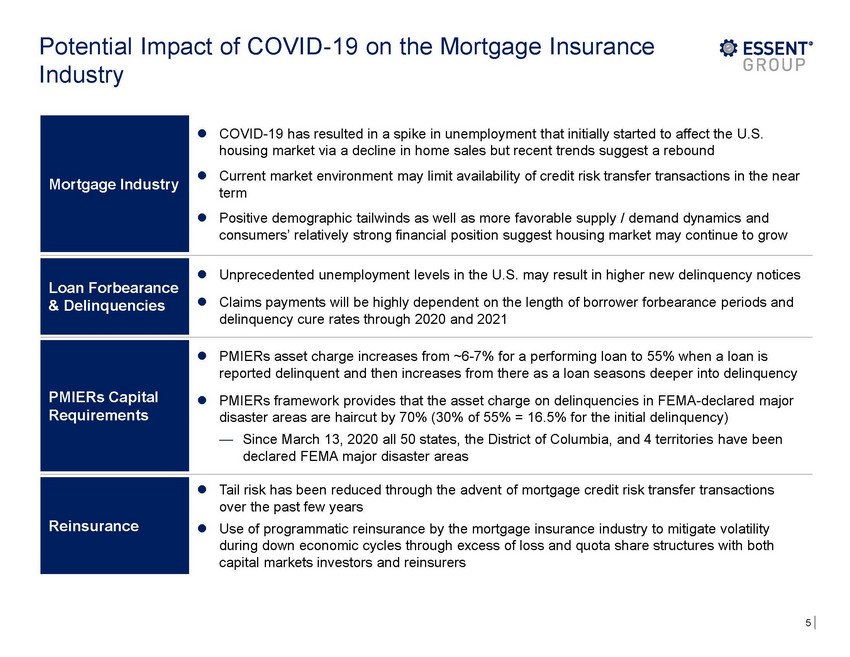 |
Potential Industry Impact of COVID-19 on the Mortgage Insurance COVID-19 has resulted in a spike in unemployment that initially started to affect the U.S. housing market via a decline in home sales but recent trends suggest a rebound Current market environment may limit availability of credit risk transfer transactions in the near term Positive demographic tailwinds as well as more favorable supply / demand dynamics and consumers’ relatively strong financial position suggest housing market may continue to grow Unprecedented unemployment levels in the U.S. may result in higher new delinquency notices Claims payments will be highly dependent on the length of borrower forbearance periods and delinquency cure rates through 2020 and 2021 PMIERs asset charge increases from ~6-7% for a performing loan to 55% when a loan is reported delinquent and then increases from there as a loan seasons deeper into delinquency PMIERs framework provides that the asset charge on delinquencies in FEMA-declared major disaster areas are haircut by 70% (30% of 55% = 16.5% for the initial delinquency) — Since March 13, 2020 all 50 states, the District of Columbia, and 4 territories have been declared FEMA major disaster areas Tail risk has been reduced through the advent of mortgage credit risk transfer transactions over the past few years Use of programmatic reinsurance by the mortgage insurance industry to mitigate volatility during down economic cycles through excess of loss and quota share structures with both capital markets investors and reinsurers 5 Reinsurance PMIERs Capital Requirements Loan Forbearance & Delinquencies Mortgage Industry |
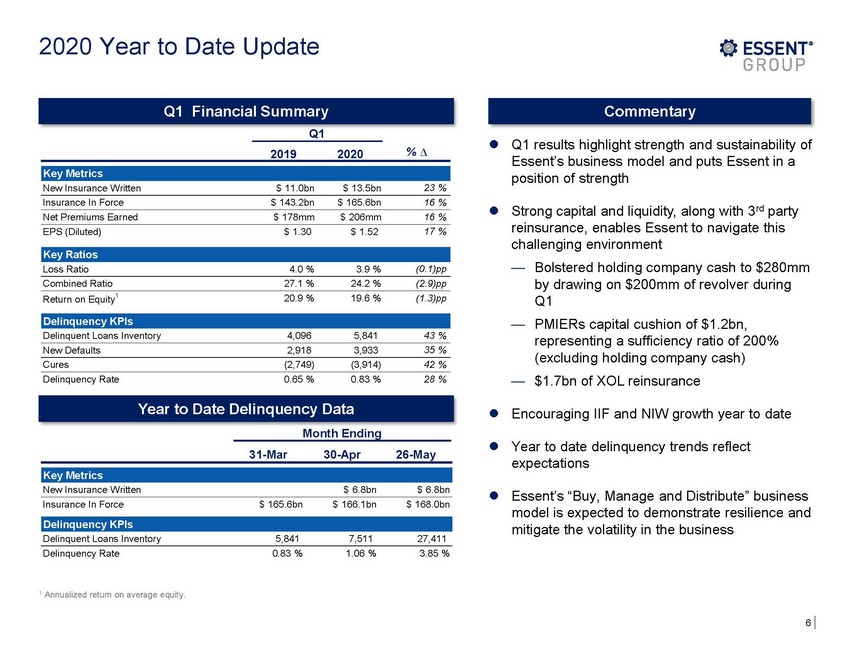 |
2020 Year to Date Update Q1 Q1 results highlight strength and sustainability of Essent’s business model and puts Essent in a position of strength 2019 2020 % ∆ New Insurance Written $ 11.0bn $ 13.5bn 23 % Insurance In Force $ 143.2bn $ 165.6bn 16 % Strong capital and liquidity, along with 3rd party reinsurance, enables Essent to navigate this challenging environment Net Premiums Earned $ 178mm $ 206mm 16 % EPS (Diluted) $ 1.30 $ 1.52 17 % — Bolstered holding company cash to $280mm by drawing on $200mm of revolver during Q1 PMIERs capital cushion of $1.2bn, representing a sufficiency ratio of 200% (excluding holding company cash) $1.7bn of XOL reinsurance Loss Ratio 4.0 % 3.9 % (0.1)pp Combined Ratio 27.1 % 24.2 % (2.9)pp 1 (1.3)pp Return on Equity 20.9 % 19.6 % — Delinquent Loans Inventory 4,096 5,841 43 % New Defaults 2,918 3,933 35 % 42 % Cures (2,749) (3,914) Delinquency Rate 0.65 % 0.83 % 28 % — Encouraging IIF and NIW growth year to date Month Ending Year to date delinquency trends reflect expectations 31-Mar 30-Apr 26-May New Insurance Written $ 6.8bn $ 6.8bn Essent’s “Buy, Manage and Distribute” business model is expected to demonstrate resilience and mitigate the volatility in the business Insurance In Force $ 165.6bn $ 166.1bn $ 168.0bn Delinquent Loans Inventory 5,841 7,511 27,411 Delinquency Rate 0.83 % 1.06 % 3.85 % 1 Annualized return on average equity. 6 Delinquency KPIs Key Metrics Year to Date Delinquency Data Delinquency KPIs Key Ratios Key Metrics Commentary Q1 Financial Summary |
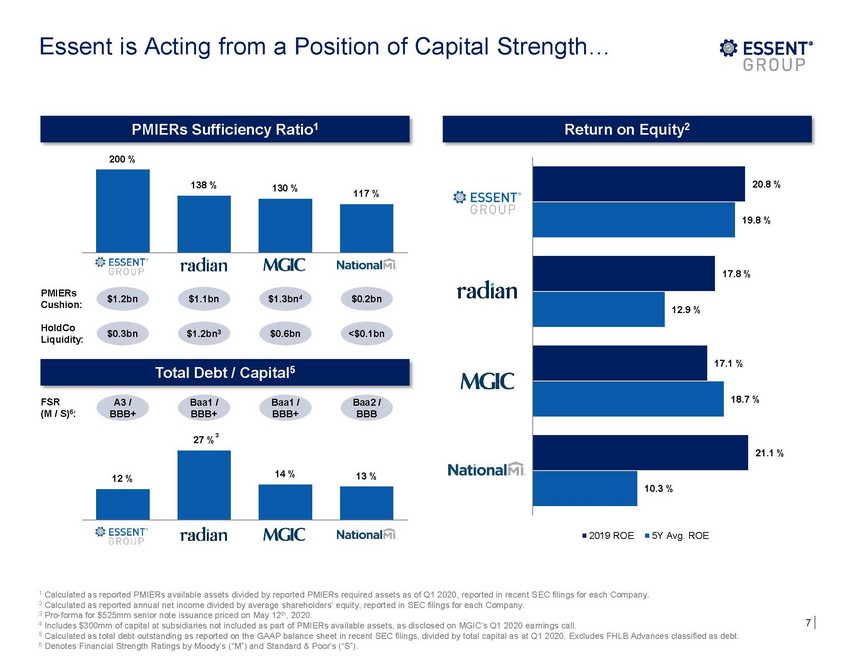 |
Essent is Acting from a Position of Capital Strength… 200 % 20.8 % 117 % 9.8 % % PMIERs Cushion: $1.2bn $1.1bn $1.3bn4 $0.2bn HoldCo Liquidity: $1.2bn3 $0.3bn $0.6bn <$0.1bn % FSR (M / S)6: A3 / BBB+ Baa1 / BBB+ Baa1 / BBB+ Baa2 / BBB 3 27 % 21.1 % 2019 ROE 5Y Avg. ROE 1 Calculated as reported PMIERs available assets divided by reported PMIERs required assets as of Q1 2020, reported in recent SEC filings for each Company. 2 Calculated as reported annual net income divided by average shareholders’ equity, reported in SEC filings for each Company. 3 Pro-forma for $525mm senior note issuance priced on May 12th, 2020. 4 Includes $300mm of capital at subsidiaries not included as part of PMIERs available assets, as disclosed on MGIC’s Q1 2020 earnings call. 5 Calculated as total debt outstanding as reported on the GAAP balance sheet in recent SEC filings, divided by total capital as at Q1 2020. Excludes FHLB Advances classified as debt. 6 Denotes Financial Strength Ratings by Moody’s (“M”) and Standard & Poor’s (“S”). 7 12 % 14 %13 % Total Debt / Capital5 138 %130 % 1 17.8 12.9 % 17.1 % 18.7 10.3 % PMIERs Sufficiency Ratio1 Return on Equity2 |
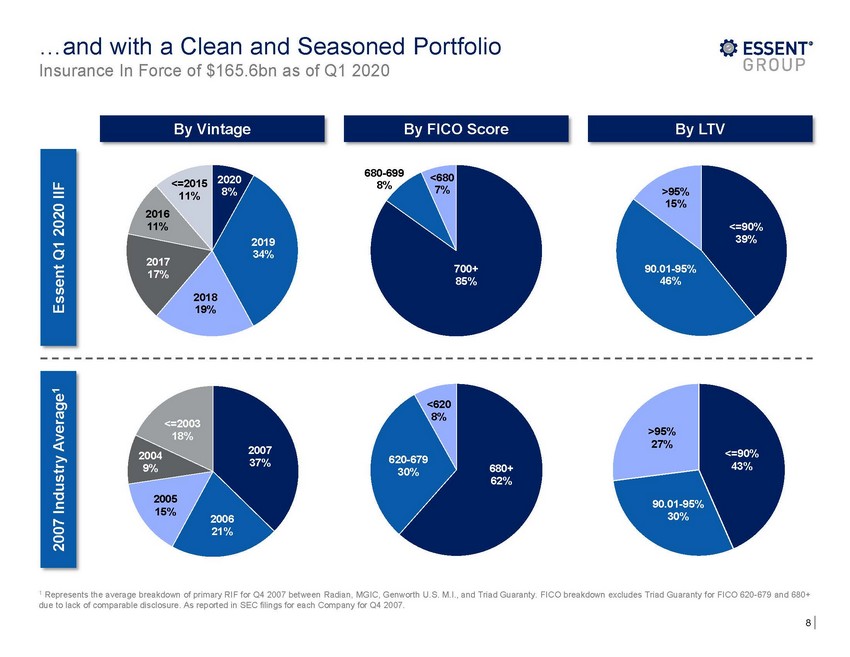 |
…and with a Clean and Seasoned Insurance In Force of $165.6bn as of Q1 2020 Portfolio 680-699 8% <680 7% 2020 8% <=2015 11% >95% 15% 2016 11% <=90 39% 2019 34% 2017 17% 700+ 85% 90.01-95% 46% 2018 19% <620 8% <=2003 18% >95% 27% 2007 37% <=90% 43% 2004 620-680+ 62% 2005 15% 90.01-95% 30% 06 21% 1 Represents the average breakdown of primary RIF for Q4 2007 between Radian, MGIC, Genworth U.S. M.I., and Triad Guaranty. FICO breakdown excludes Triad Guaranty for FICO 620-679 and 680+ due to lack of comparable disclosure. As reported in SEC filings for each Company for Q4 2007. 8 2007 Industry Average1 Essent Q1 2020 IIF By LTV By FICO Score By Vintage |
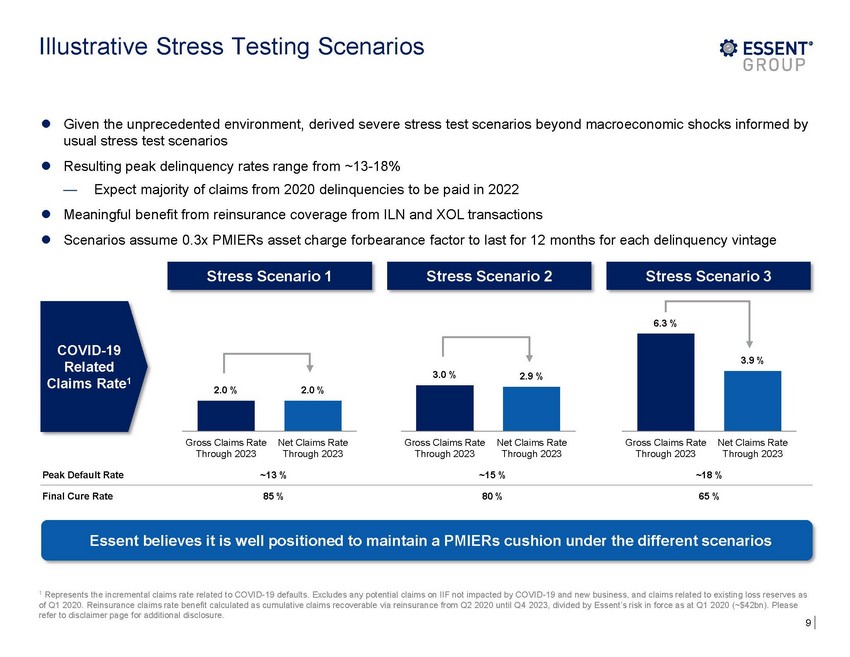 |
Illustrative Stress Testing Scenarios Given the unprecedented environment, derived severe stress test scenarios beyond macroeconomic shocks informed by usual stress test scenarios Resulting peak delinquency rates range from ~13-18% — Expect majority of claims from 2020 delinquencies to be paid in 2022 Meaningful benefit from reinsurance coverage from ILN and XOL transactions Scenarios assume 0.3x PMIERs asset charge forbearance factor to last for 12 months for each delinquency vintage 6.3 % COVID-19 Related Claims Rate1 3.0 % 2.9 % 2.0 % 2.0 % Gross Claims Rate Through 2023 Net Claims Rate Through 2023 Gross Claims Rate Through 2023 Net Claims Rate Through 2023 Gross Claims RateNet Claims Rate Through 2023 Through 2023 Peak Default Rate ~13 % ~15 % ~18 % Final Cure Rate 85 % 80 % 65 % Essent believes it is well positioned to maintain a PMIERs cushion under the different scenarios 1 Represents the incremental claims rate related to COVID-19 defaults. Excludes any potential claims on IIF not impacted by COVID-19 and new business, and claims related to existing loss reserves as of Q1 2020. Reinsurance claims rate benefit calculated as cumulative claims recoverable via reinsurance from Q2 2020 until Q4 2023, divided by Essent’s risk in force as at Q1 2020 (~$42bn). Please refer to disclaimer page for additional disclosure. 9 3.9 % Stress Scenario 3 Stress Scenario 2 Stress Scenario 1 |
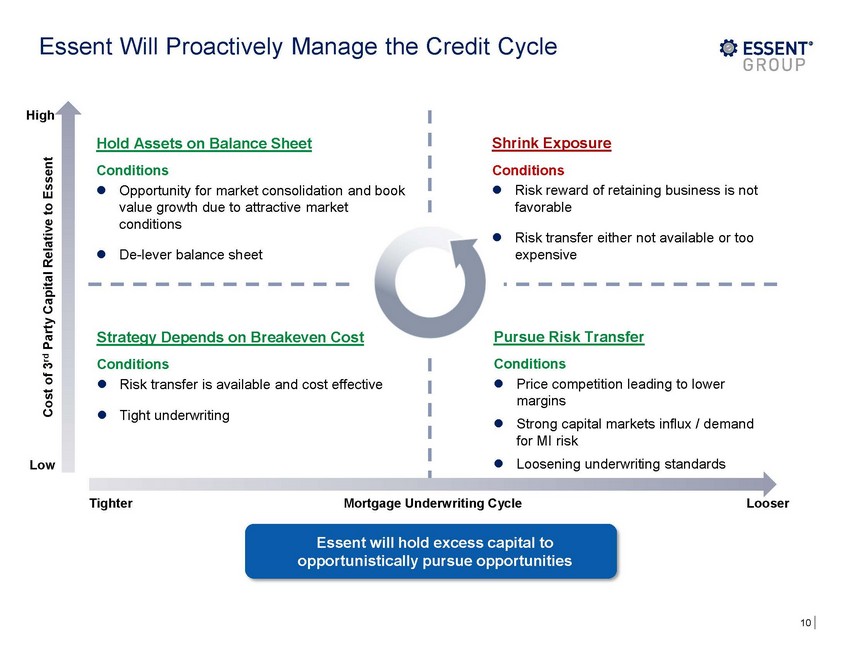 |
Essent Will Proactively Manage the Credit Cycle High Low Tighter Mortgage Underwriting Cycle Looser Essent will hold excess capital to opportunistically pursue opportunities 10 Cost of 3rd Party Capital Relative to Essent Hold Assets on Balance Sheet Conditions Opportunity for market consolidation and book value growth due to attractive market conditions De-lever balance sheet Shrink Exposure Conditions Risk reward of retaining business is not favorable Risk transfer either not available or too expensive Strategy Depends on Breakeven Cost Conditions Risk transfer is available and cost effective Tight underwriting Pursue Risk Transfer Conditions Price competition leading to lower margins Strong capital markets influx / demand for MI risk Loosening underwriting standards |
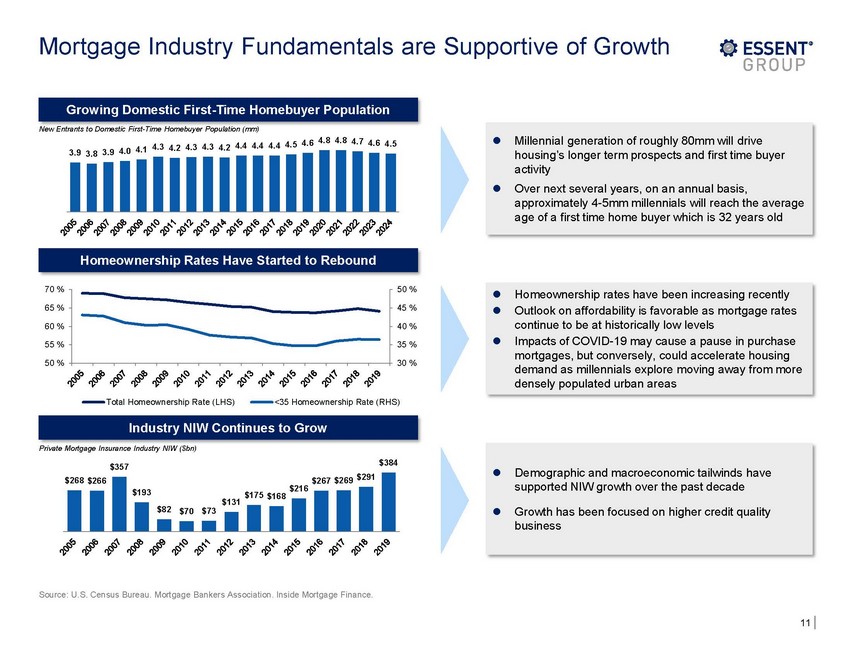 |
Mortgage Industry Fundamentals are Supportive of Growth New Entrants to Domestic First-Time Homebuyer Population (mm) 4.5 4.6 4.8 4.8 4.7 4.6 4.5 3.9 3.8 3.9 4.0 4.1 4.3 4.2 4.3 4.3 4.2 4.4 4.4 4.4 70 % 50 % 65 % 45 % 60 % 40 % 55 % 35 % 50 % 30 % Total Homeownership Rate (LHS) <35 Homeownership Rate (RHS) Private Mortgage Insurance Industry NIW ($bn) $384 $357 $216 $175 $168 $193 $131 $82 $70 $73 Source: U.S. Census Bureau. Mortgage Bankers Association. Inside Mortgage Finance. 11 $268 $266 $267 $269 $291 Demographic and macroeconomic tailwinds have supported NIW growth over the past decade Growth has been focused on higher credit quality business Industry NIW Continues to Grow Homeownership rates have been increasing recently Outlook on affordability is favorable as mortgage rates continue to be at historically low levels Impacts of COVID-19 may cause a pause in purchase mortgages, but conversely, could accelerate housing demand as millennials explore moving away from more densely populated urban areas Homeownership Rates Have Started to Rebound Millennial generation of roughly 80mm will drive housing’s longer term prospects and first time buyer activity Over next several years, on an annual basis, approximately 4-5mm millennials will reach the average age of a first time home buyer which is 32 years old Growing Domestic First-Time Homebuyer Population |
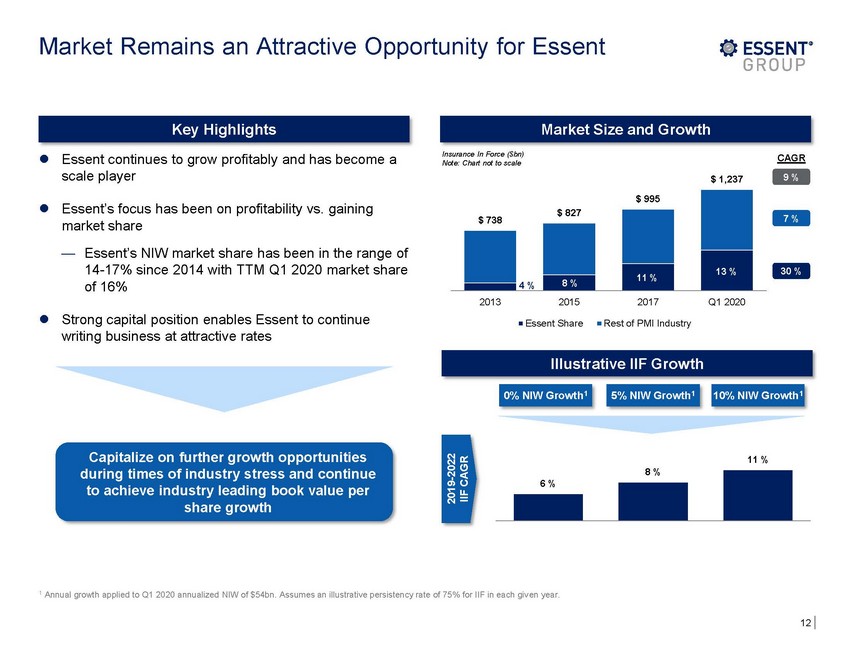 |
Market Remains an Attractive Opportunity for Essent Insurance In Force ($bn) Note: Chart not to scale Essent continues to grow profitably and has become a scale player CAGR 9 % $ 1,237 $ 995 Essent’s focus has been on profitability vs. gaining market share — Essent’s NIW market share has been in the range of 14-17% since 2014 with TTM Q1 2020 market share of 16% 7 % 30 % 2013 2015 2017 Q1 2020 Strong capital position enables Essent to continue writing business at attractive rates Essent Share Rest of PMI Industry Capitalize on further growth opportunities during times of industry stress and continue to achieve industry leading book value per share growth 11 % 0 % 5 % 10 % 1 Annual growth applied to Q1 2020 annualized NIW of $54bn. Assumes an illustrative persistency rate of 75% for IIF in each given year. 12 2019-2022 IIF CAGR 8 % 6 % 10% NIW Growth1 5% NIW Growth1 0% NIW Growth1 Illustrative IIF Growth $ 738 4 % $ 827 13 % 11 % 8 % Market Size and Growth Key Highlights |
 |
Appendix 13 |
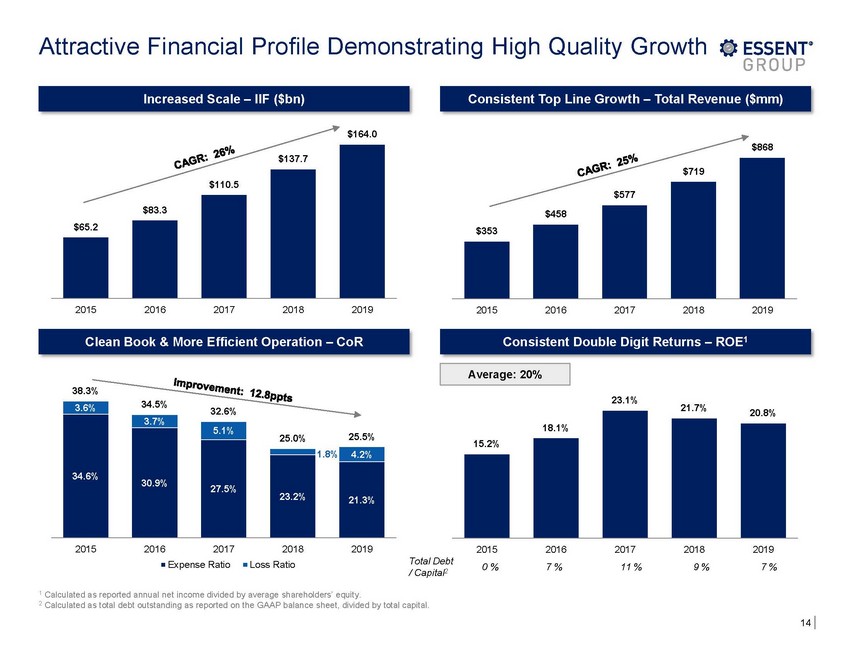 |
Attractive Financial Profile Demonstrating High Quality Growth $164.0 $868 2015 2016 2017 2018 2019 2015 2016 2017 2018 2019 38.3% 23.1% 21.7% 20.8% 2015 2016 2017 Expense Ratio 2018 Loss Ratio 2019 2015 0 % 2016 7 % 2017 11 % 2018 9 % 2019 7 % Total Debt / Capital2 1 Calculated as reported annual net income divided by average shareholders’ equity. 2 Calculated as total debt outstanding as reported on the GAAP balance sheet, divided by total capital. 14 18.1% 15.2% 3.6% 34.5%32.6% 34.6% 3.7% 5.1% 25.0%25.5% 30.9% 27.5% 1.8% 4.2% 23.2% 21.3% Average: 20% Consistent Double Digit Returns – ROE1 Clean Book & More Efficient Operation – CoR $719 $577 $458 $353 $137.7 $110.5 $83.3 $65.2 Consistent Top Line Growth – Total Revenue ($mm) Increased Scale – IIF ($bn) |