Attached files
| file | filename |
|---|---|
| EX-99.1 - EXHIBIT 99.1 - INDEPENDENT BANK CORP /MI/ | ex99_1.htm |
| EX-10.1 - EXHIBIT 10.1 - INDEPENDENT BANK CORP /MI/ | ex10_1.htm |
| 8-K - 8-K - INDEPENDENT BANK CORP /MI/ | form8k.htm |
Exhibit 99.2
Fixed Income Investor PresentationFirst Quarter 2020
Cautionary Note Regarding Forward-looking Statements 2 Statements in this presentation that are not
statements of historical fact, including statements that include terms such as ‘‘will,’’ ‘‘may,’’ ‘‘should,’’ ‘‘believe,’’ ‘‘expect,’’ ‘‘forecast,’’ ‘‘anticipate,’’ ‘‘estimate,’’ ‘‘project,’’ ‘‘intend,’’ ‘‘likely,’’ ‘‘optimistic’’ and ‘‘plan’’
and statements about future or projected financial and operating results, plans, projections, objectives, expectations, and intentions, are forward-looking statements. Forward-looking statements include, but are not limited to, descriptions of
plans and objectives for future operations, products or services; projections of our future revenue, earnings or other measures of economic performance; forecasts of credit losses and other asset quality trends; statements about our business
and growth strategies; and expectations about economic and market conditions and trends. These forward-looking statements express our current expectations, forecasts of future events, or long-term goals. They are based on assumptions,
estimates, and forecasts that, although believed to be reasonable, may turn out to be incorrect. Actual results could differ materially from those discussed in the forward-looking statements for a variety of reasons, including:• economic,
market, operational, liquidity, credit, and interest rate risks associated with our business including the impact of the ongoing COVID-19 pandemic on each of these items;• economic conditions generally and in the financial services industry,
particularly economic conditions within Michigan and the regional and local real estate markets in which our bank operates including the economic impact of the ongoing COVID-19 pandemic in each of these areas;• the failure of assumptions
underlying the establishment of, and provisions made to, our allowance for loan losses;• increased competition in the financial services industry, either nationally or regionally;• our ability to achieve loan and deposit growth;• volatility and
direction of market interest rates;• the continued services of our management team; and• implementation of new legislation, which may have significant effects on us and the financial services industry.This list provides examples of factors that
could affect the results described by forward-looking statements contained in this presentation, but the list is not intended to be all-inclusive. The risk factors disclosed in Part I – Item 1A of our Annual Report on Form 10-K for the year
ended December 31, 2019, as updated by any new or modified risk factors disclosed in Part II – Item 1A of any subsequently filed Quarterly Report on Form 10-Q, include the known risks our management believes could materially affect the results
described by forward-looking statements in this presentation. However, those risks may not be the only risks we face. Our results of operations, cash flows, financial position, and prospects could also be materially and adversely affected by
additional factors that are not presently known to us that we currently consider to be immaterial, or that develop after the date of this presentation. We cannot assure you that our future results will meet expectations. While we believe the
forward-looking statements in this presentation are reasonable, you should not place undue reliance on any forward-looking statement. In addition, these statements speak only as of the date made. We do not undertake, and expressly disclaim, any
obligation to update or alter any statements, whether as a result of new information, future events, or otherwise, except as required by applicable law.
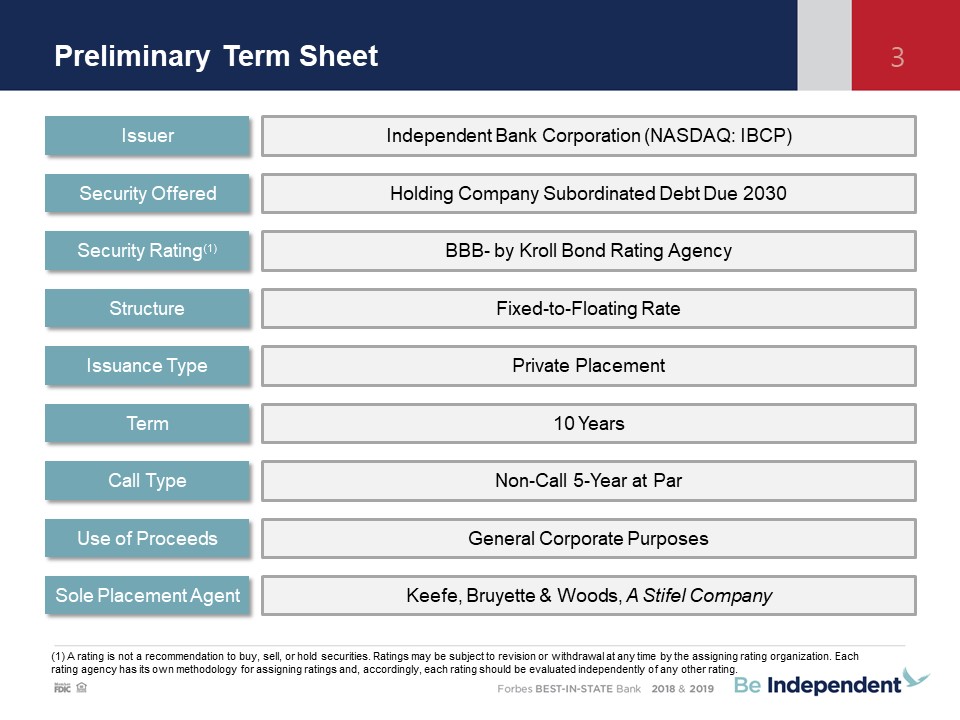
Preliminary Term Sheet 3 (1) A rating is not a recommendation to buy, sell, or hold securities. Ratings
may be subject to revision or withdrawal at any time by the assigning rating organization. Each rating agency has its own methodology for assigning ratings and, accordingly, each rating should be evaluated independently of any other rating.
Issuer Security Offered Security Rating(1) Structure Term Call Type Use of Proceeds Sole Placement Agent Independent Bank Corporation (NASDAQ: IBCP) Holding Company Subordinated Debt Due 2030 BBB- by Kroll Bond Rating Agency
Fixed-to-Floating Rate 10 Years Non-Call 5-Year at Par General Corporate Purposes Keefe, Bruyette & Woods, A Stifel Company Issuance Type Private Placement

About Independent
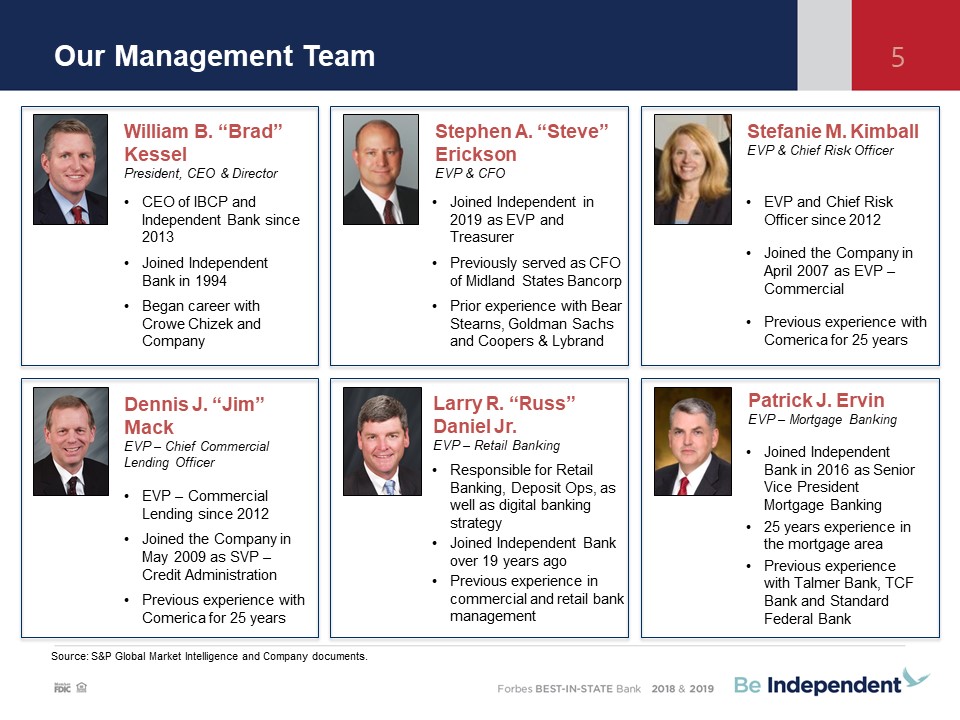
Our Management Team 5 EVP and Chief Risk Officer since 2012Joined the Company in April 2007 as EVP –
Commercial Previous experience with Comerica for 25 years EVP – Commercial Lending since 2012Joined the Company in May 2009 as SVP – Credit AdministrationPrevious experience with Comerica for 25 years CEO of IBCP and Independent Bank since
2013Joined Independent Bank in 1994Began career with Crowe Chizek and Company Joined Independent in 2019 as EVP and TreasurerPreviously served as CFO of Midland States BancorpPrior experience with Bear Stearns, Goldman Sachs and Coopers &
Lybrand William B. “Brad” KesselPresident, CEO & Director Stephen A. “Steve” EricksonEVP & CFO Dennis J. “Jim” MackEVP – Chief Commercial Lending Officer Stefanie M. KimballEVP & Chief Risk Officer Joined Independent
Bank in 2016 as Senior Vice President Mortgage Banking25 years experience in the mortgage areaPrevious experience with Talmer Bank, TCF Bank and Standard Federal Bank Responsible for Retail Banking, Deposit Ops, as well as digital banking
strategyJoined Independent Bank over 19 years ago Previous experience in commercial and retail bank management Larry R. “Russ” Daniel Jr.EVP – Retail Banking Patrick J. ErvinEVP – Mortgage Banking Source: S&P Global Market
Intelligence and Company documents.
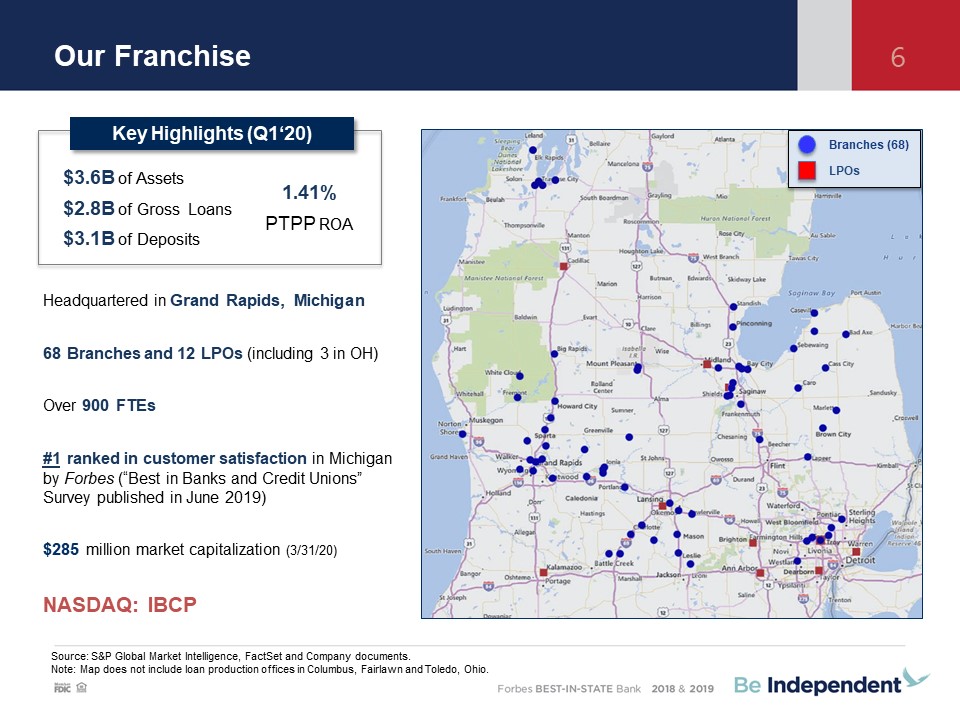
Our Franchise 6 Source: S&P Global Market Intelligence, FactSet and Company documents.Note: Map
does not include loan production offices in Columbus, Fairlawn and Toledo, Ohio. Headquartered in Grand Rapids, Michigan68 Branches and 12 LPOs (including 3 in OH)Over 900 FTEs#1 ranked in customer satisfaction in Michigan by Forbes (“Best in
Banks and Credit Unions” Survey published in June 2019) $285 million market capitalization (3/31/20) NASDAQ: IBCP Branches (68) LPOs Key Highlights (Q1‘20) $3.6B of Assets $2.8B of Gross Loans $3.1B of Deposits 1.41% PTPP ROA
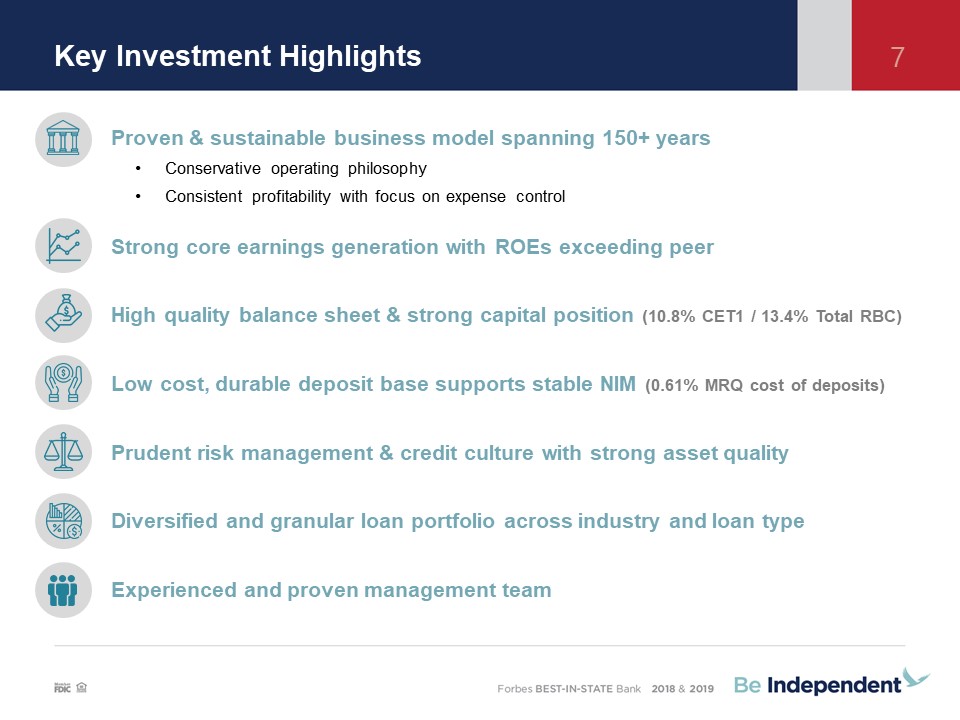
Proven & sustainable business model spanning 150+ yearsConservative operating philosophy Consistent
profitability with focus on expense controlStrong core earnings generation with ROEs exceeding peerHigh quality balance sheet & strong capital position (10.8% CET1 / 13.4% Total RBC) Low cost, durable deposit base supports stable NIM (0.61%
MRQ cost of deposits)Prudent risk management & credit culture with strong asset quality Diversified and granular loan portfolio across industry and loan typeExperienced and proven management team Key Investment
Highlights 7
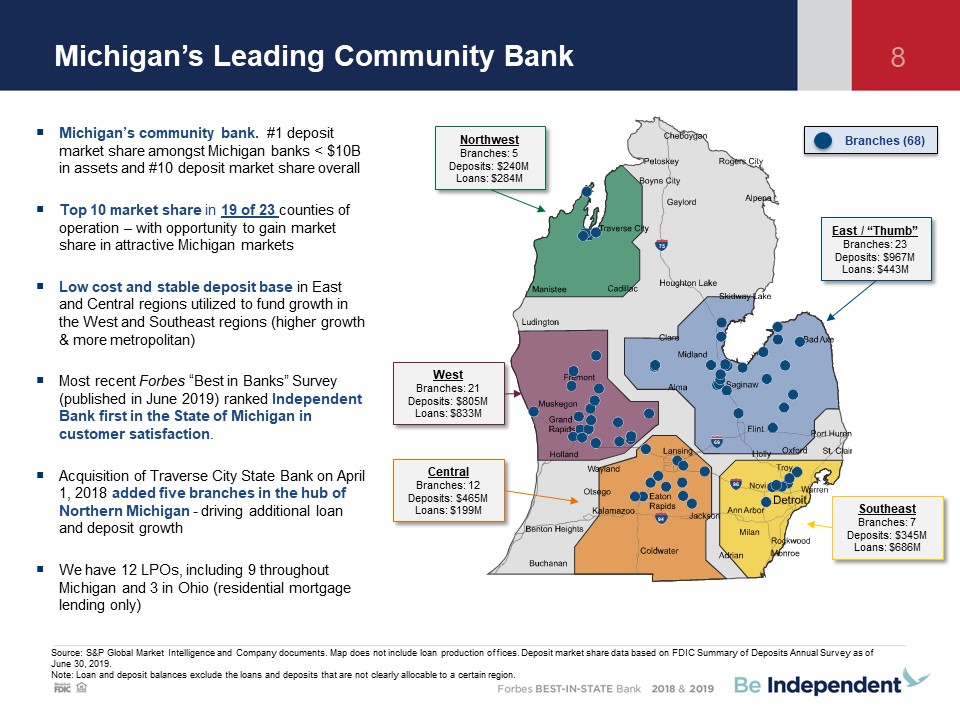
Michigan’s Leading Community Bank 8 Source: S&P Global Market Intelligence and Company documents.
Map does not include loan production offices. Deposit market share data based on FDIC Summary of Deposits Annual Survey as of June 30, 2019.Note: Loan and deposit balances exclude the loans and deposits that are not clearly allocable to a
certain region. 94 96 75 69 Michigan’s community bank. #1 deposit market share amongst Michigan banks < $10B in assets and #10 deposit market share overall Top 10 market share in 19 of 23 counties of
operation – with opportunity to gain market share in attractive Michigan marketsLow cost and stable deposit base in East and Central regions utilized to fund growth in the West and Southeast regions (higher growth & more metropolitan)Most
recent Forbes “Best in Banks” Survey (published in June 2019) ranked Independent Bank first in the State of Michigan in customer satisfaction.Acquisition of Traverse City State Bank on April 1, 2018 added five branches in the hub of Northern
Michigan - driving additional loan and deposit growth We have 12 LPOs, including 9 throughout Michigan and 3 in Ohio (residential mortgage lending only) Branches (68) East / “Thumb”Branches: 23Deposits: $967MLoans:
$443M SoutheastBranches: 7Deposits: $345MLoans: $686M CentralBranches: 12Deposits: $465MLoans: $199M WestBranches: 21Deposits: $805MLoans: $833M NorthwestBranches: 5Deposits: $240MLoans: $284M
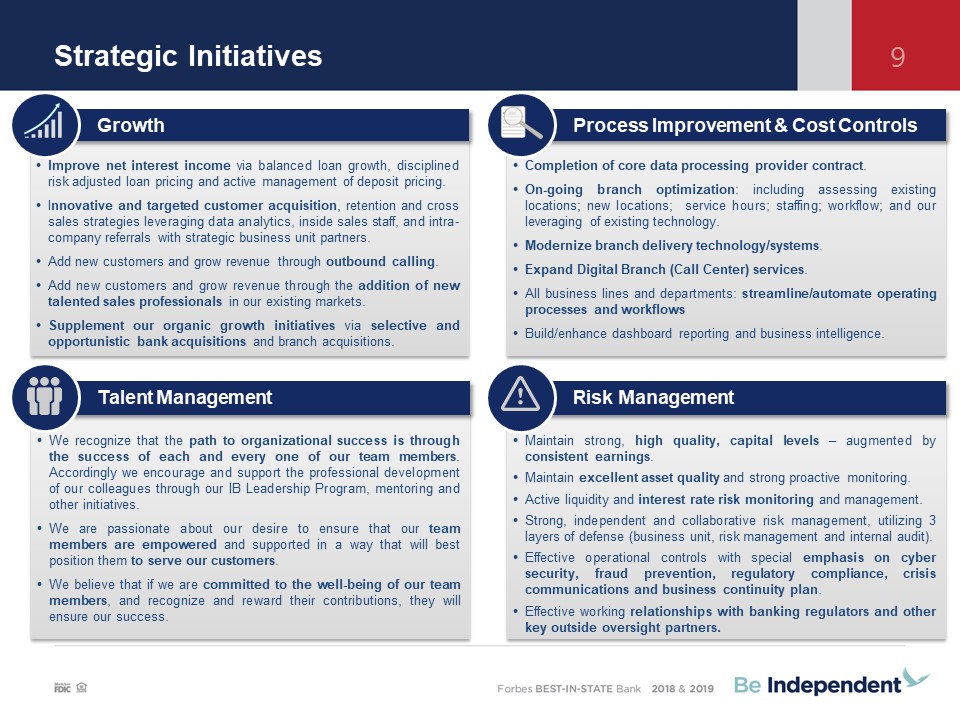
Strategic Initiatives 9 Improve net interest income via balanced loan growth, disciplined risk
adjusted loan pricing and active management of deposit pricing. Innovative and targeted customer acquisition, retention and cross sales strategies leveraging data analytics, inside sales staff, and intra-company referrals with strategic
business unit partners.Add new customers and grow revenue through outbound calling.Add new customers and grow revenue through the addition of new talented sales professionals in our existing markets. Supplement our organic growth initiatives
via selective and opportunistic bank acquisitions and branch acquisitions. Growth Completion of core data processing provider contract.On-going branch optimization: including assessing existing locations; new locations; service hours;
staffing; workflow; and our leveraging of existing technology. Modernize branch delivery technology/systems.Expand Digital Branch (Call Center) services.All business lines and departments: streamline/automate operating processes and workflows
Build/enhance dashboard reporting and business intelligence. Process Improvement & Cost Controls We recognize that the path to organizational success is through the success of each and every one of our team members. Accordingly we
encourage and support the professional development of our colleagues through our IB Leadership Program, mentoring and other initiatives. We are passionate about our desire to ensure that our team members are empowered and supported in a way
that will best position them to serve our customers. We believe that if we are committed to the well-being of our team members, and recognize and reward their contributions, they will ensure our success. Talent Management Maintain
strong, high quality, capital levels – augmented by consistent earnings. Maintain excellent asset quality and strong proactive monitoring.Active liquidity and interest rate risk monitoring and management.Strong, independent and collaborative
risk management, utilizing 3 layers of defense (business unit, risk management and internal audit). Effective operational controls with special emphasis on cyber security, fraud prevention, regulatory compliance, crisis communications and
business continuity plan.Effective working relationships with banking regulators and other key outside oversight partners. Risk Management
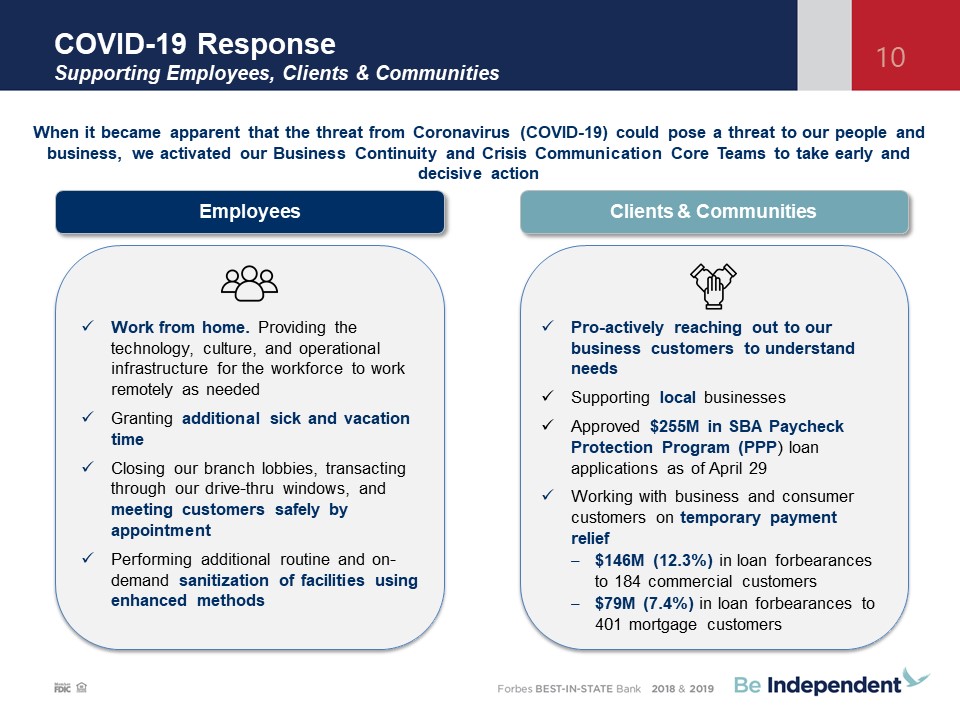
COVID-19 ResponseSupporting Employees, Clients & Communities 10 Employees Clients &
Communities Work from home. Providing the technology, culture, and operational infrastructure for the workforce to work remotely as neededGranting additional sick and vacation timeClosing our branch lobbies, transacting through our
drive-thru windows, and meeting customers safely by appointmentPerforming additional routine and on-demand sanitization of facilities using enhanced methods Pro-actively reaching out to our business customers to understand needs Supporting
local businesses Approved $255M in SBA Paycheck Protection Program (PPP) loan applications as of April 29 Working with business and consumer customers on temporary payment relief$146M (12.3%) in loan forbearances to 184 commercial customers
$79M (7.4%) in loan forbearances to 401 mortgage customers When it became apparent that the threat from Coronavirus (COVID-19) could pose a threat to our people and business, we activated our Business Continuity and Crisis Communication Core
Teams to take early and decisive action

Financial Performance
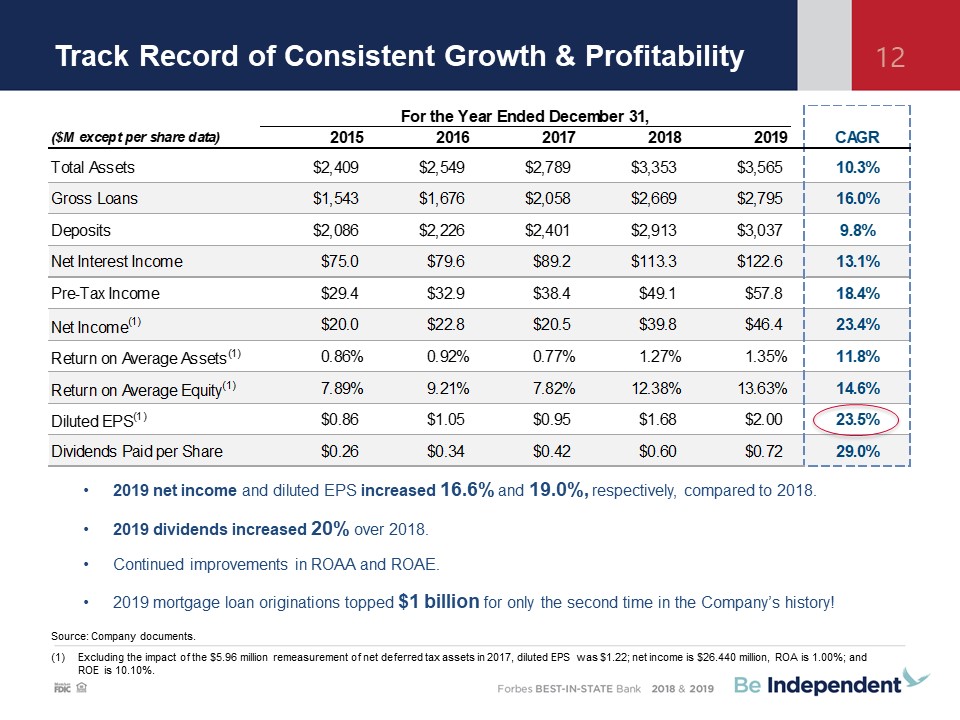
Track Record of Consistent Growth & Profitability 12 2019 net income and diluted EPS increased
16.6% and 19.0%, respectively, compared to 2018.2019 dividends increased 20% over 2018.Continued improvements in ROAA and ROAE.2019 mortgage loan originations topped $1 billion for only the second time in the Company’s history! Source:
Company documents.Excluding the impact of the $5.96 million remeasurement of net deferred tax assets in 2017, diluted EPS was $1.22; net income is $26.440 million, ROA is 1.00%; and ROE is 10.10%.
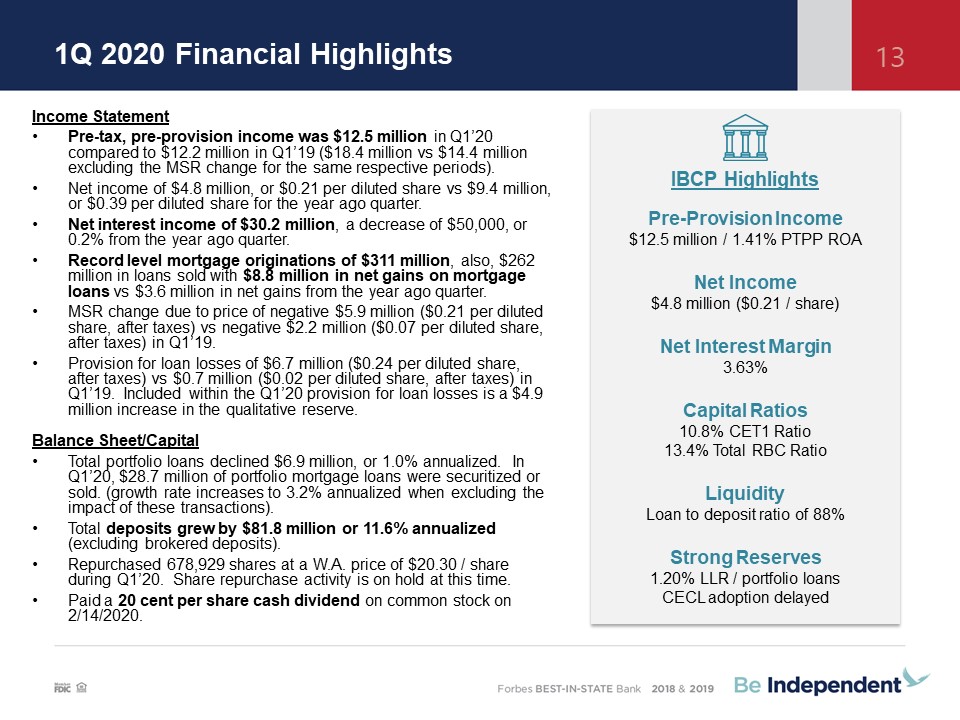
1Q 2020 Financial Highlights Income StatementPre-tax, pre-provision income was $12.5 million in Q1’20
compared to $12.2 million in Q1’19 ($18.4 million vs $14.4 million excluding the MSR change for the same respective periods).Net income of $4.8 million, or $0.21 per diluted share vs $9.4 million, or $0.39 per diluted share for the year ago
quarter.Net interest income of $30.2 million, a decrease of $50,000, or 0.2% from the year ago quarter.Record level mortgage originations of $311 million, also, $262 million in loans sold with $8.8 million in net gains on mortgage loans vs $3.6
million in net gains from the year ago quarter. MSR change due to price of negative $5.9 million ($0.21 per diluted share, after taxes) vs negative $2.2 million ($0.07 per diluted share, after taxes) in Q1’19. Provision for loan losses of $6.7
million ($0.24 per diluted share, after taxes) vs $0.7 million ($0.02 per diluted share, after taxes) in Q1’19. Included within the Q1’20 provision for loan losses is a $4.9 million increase in the qualitative reserve.Balance Sheet/CapitalTotal
portfolio loans declined $6.9 million, or 1.0% annualized. In Q1’20, $28.7 million of portfolio mortgage loans were securitized or sold. (growth rate increases to 3.2% annualized when excluding the impact of these transactions).Total deposits
grew by $81.8 million or 11.6% annualized (excluding brokered deposits).Repurchased 678,929 shares at a W.A. price of $20.30 / share during Q1’20. Share repurchase activity is on hold at this time. Paid a 20 cent per share cash dividend on
common stock on 2/14/2020. 13 IBCP HighlightsPre-Provision Income$12.5 million / 1.41% PTPP ROANet Income$4.8 million ($0.21 / share)Net Interest Margin3.63%Capital Ratios10.8% CET1 Ratio13.4% Total RBC RatioLiquidityLoan to deposit ratio
of 88%Strong Reserves1.20% LLR / portfolio loansCECL adoption delayed
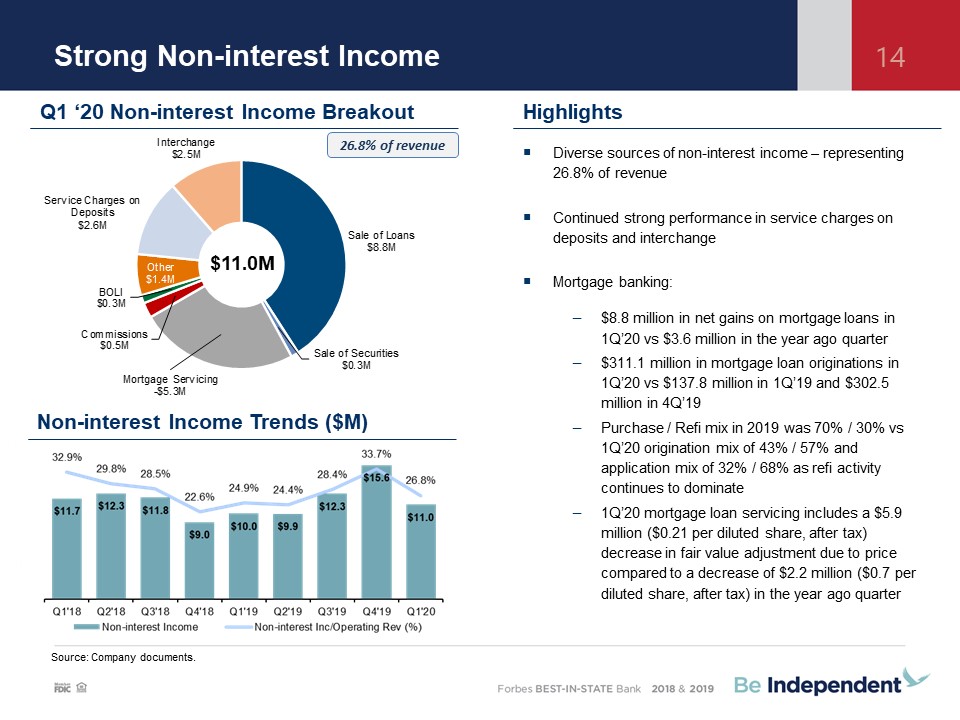
Strong Non-interest Income 14 Diverse sources of non-interest income – representing 26.8% of revenue
Continued strong performance in service charges on deposits and interchangeMortgage banking: $8.8 million in net gains on mortgage loans in 1Q’20 vs $3.6 million in the year ago quarter$311.1 million in mortgage loan originations in 1Q’20 vs
$137.8 million in 1Q’19 and $302.5 million in 4Q’19Purchase / Refi mix in 2019 was 70% / 30% vs 1Q’20 origination mix of 43% / 57% and application mix of 32% / 68% as refi activity continues to dominate1Q’20 mortgage loan servicing includes a
$5.9 million ($0.21 per diluted share, after tax) decrease in fair value adjustment due to price compared to a decrease of $2.2 million ($0.7 per diluted share, after tax) in the year ago quarter Source: Company documents. $11.0M Q1 ‘20
Non-interest Income Breakout Non-interest Income Trends ($M) Highlights 26.8% of revenue
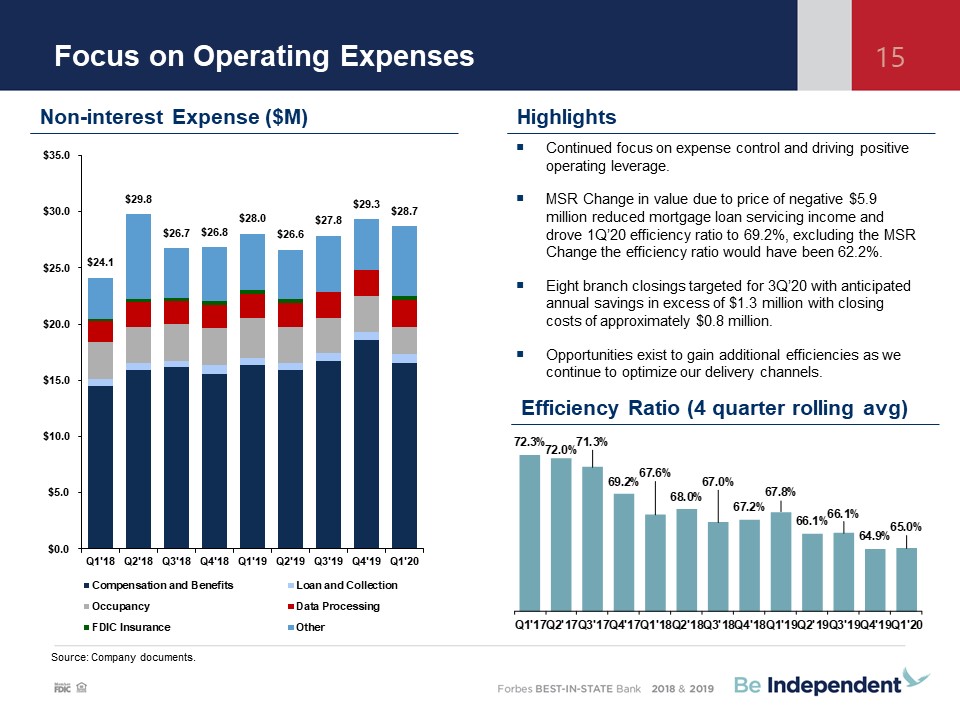
Focus on Operating Expenses 15 Source: Company documents. Non-interest Expense
($M) Highlights Efficiency Ratio (4 quarter rolling avg) Continued focus on expense control and driving positive operating leverage. MSR Change in value due to price of negative $5.9 million reduced mortgage loan servicing income and drove
1Q’20 efficiency ratio to 69.2%, excluding the MSR Change the efficiency ratio would have been 62.2%. Eight branch closings targeted for 3Q’20 with anticipated annual savings in excess of $1.3 million with closing costs of approximately $0.8
million.Opportunities exist to gain additional efficiencies as we continue to optimize our delivery channels.
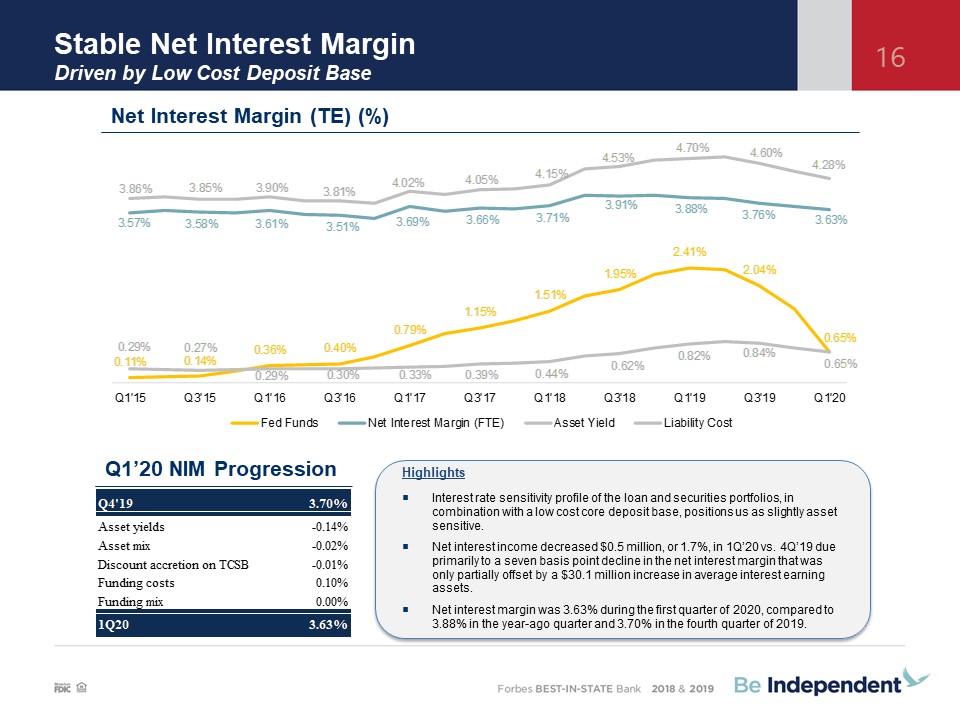
HighlightsInterest rate sensitivity profile of the loan and securities portfolios, in combination with
a low cost core deposit base, positions us as slightly asset sensitive.Net interest income decreased $0.5 million, or 1.7%, in 1Q’20 vs. 4Q’19 due primarily to a seven basis point decline in the net interest margin that was only partially
offset by a $30.1 million increase in average interest earning assets.Net interest margin was 3.63% during the first quarter of 2020, compared to 3.88% in the year-ago quarter and 3.70% in the fourth quarter of 2019. Stable Net Interest
MarginDriven by Low Cost Deposit Base 16 Net Interest Margin (TE) (%) Q1’20 NIM Progression
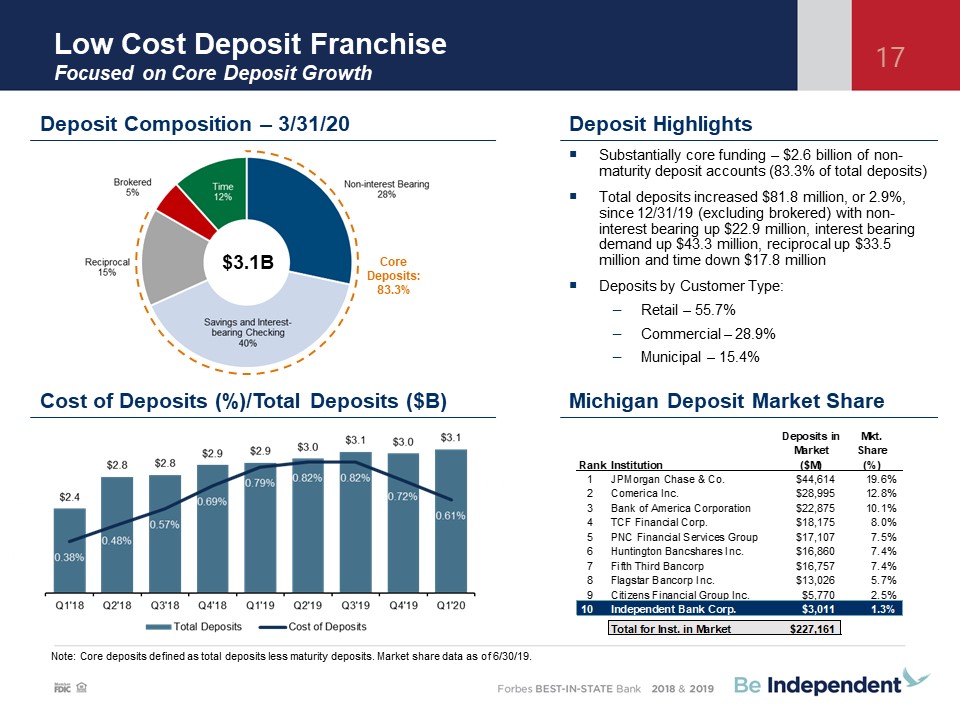
Low Cost Deposit Franchise Focused on Core Deposit Growth 17 Substantially core funding – $2.6
billion of non-maturity deposit accounts (83.3% of total deposits)Total deposits increased $81.8 million, or 2.9%, since 12/31/19 (excluding brokered) with non-interest bearing up $22.9 million, interest bearing demand up $43.3 million,
reciprocal up $33.5 million and time down $17.8 millionDeposits by Customer Type:Retail – 55.7%Commercial – 28.9%Municipal – 15.4% Deposit Composition – 3/31/20 Deposit Highlights Michigan Deposit Market Share $3.1B Core Deposits:
83.3% Cost of Deposits (%)/Total Deposits ($B) Note: Core deposits defined as total deposits less maturity deposits. Market share data as of 6/30/19.
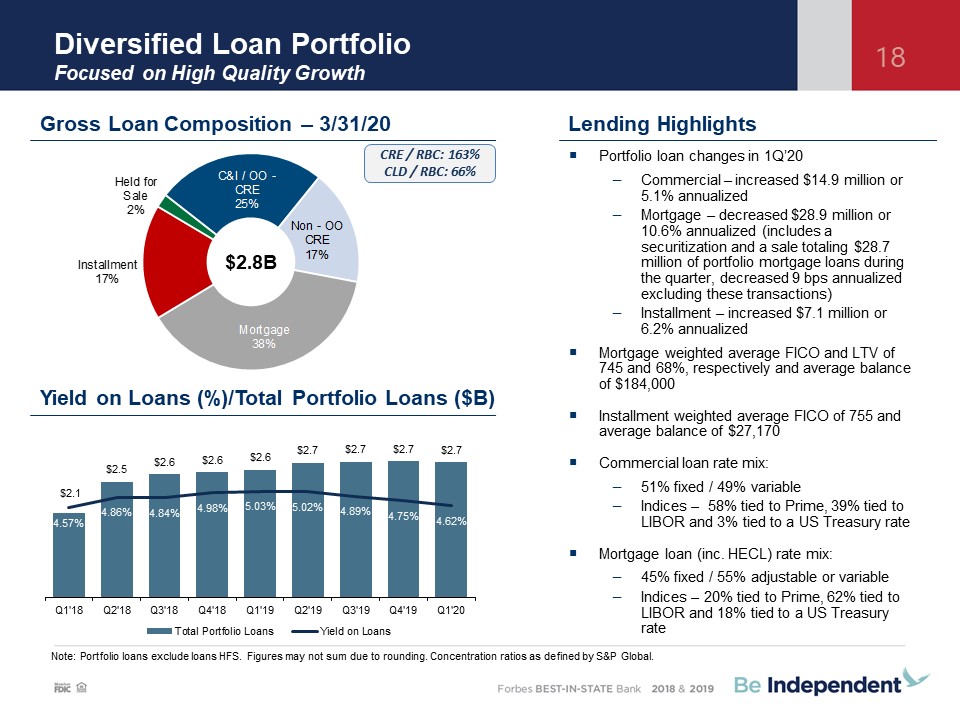
Diversified Loan PortfolioFocused on High Quality Growth 18 Lending Highlights Note: Portfolio loans
exclude loans HFS. Figures may not sum due to rounding. Concentration ratios as defined by S&P Global. Portfolio loan changes in 1Q’20Commercial – increased $14.9 million or 5.1% annualizedMortgage – decreased $28.9 million or 10.6%
annualized (includes a securitization and a sale totaling $28.7 million of portfolio mortgage loans during the quarter, decreased 9 bps annualized excluding these transactions)Installment – increased $7.1 million or 6.2% annualizedMortgage
weighted average FICO and LTV of 745 and 68%, respectively and average balance of $184,000Installment weighted average FICO of 755 and average balance of $27,170Commercial loan rate mix:51% fixed / 49% variableIndices – 58% tied to Prime, 39%
tied to LIBOR and 3% tied to a US Treasury rateMortgage loan (inc. HECL) rate mix: 45% fixed / 55% adjustable or variable Indices – 20% tied to Prime, 62% tied to LIBOR and 18% tied to a US Treasury rate Gross Loan Composition –
3/31/20 $2.8B Yield on Loans (%)/Total Portfolio Loans ($B) CRE / RBC: 163%CLD / RBC: 66%
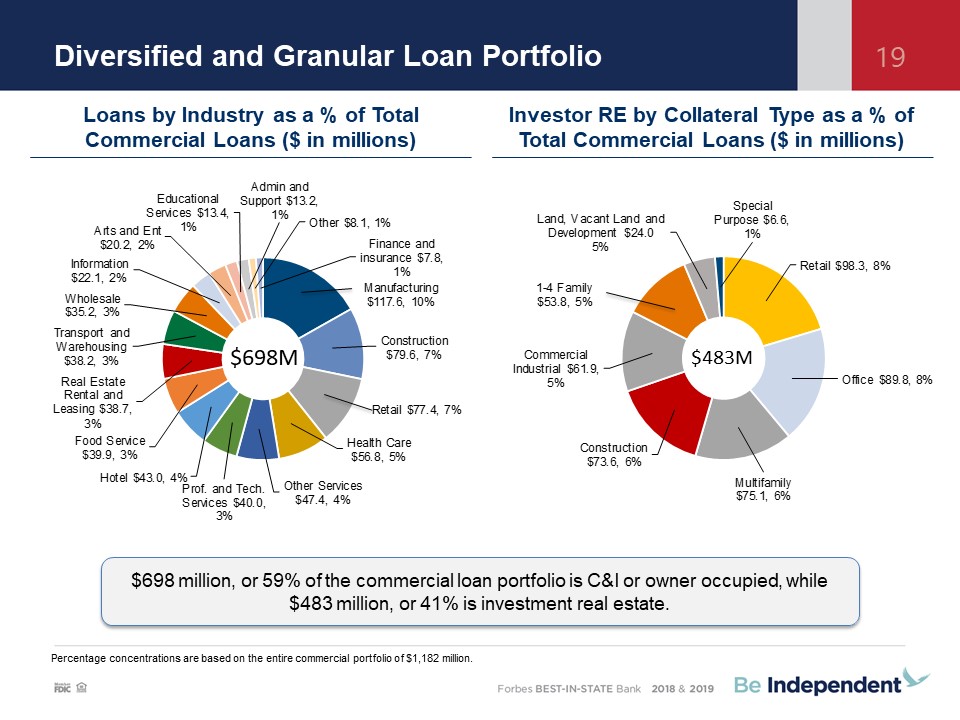
Diversified and Granular Loan Portfolio 19 Percentage concentrations are based on the entire
commercial portfolio of $1,182 million. $483M $698M $698 million, or 59% of the commercial loan portfolio is C&I or owner occupied, while $483 million, or 41% is investment real estate. Loans by Industry as a % of Total Commercial Loans
($ in millions) Investor RE by Collateral Type as a % of Total Commercial Loans ($ in millions)
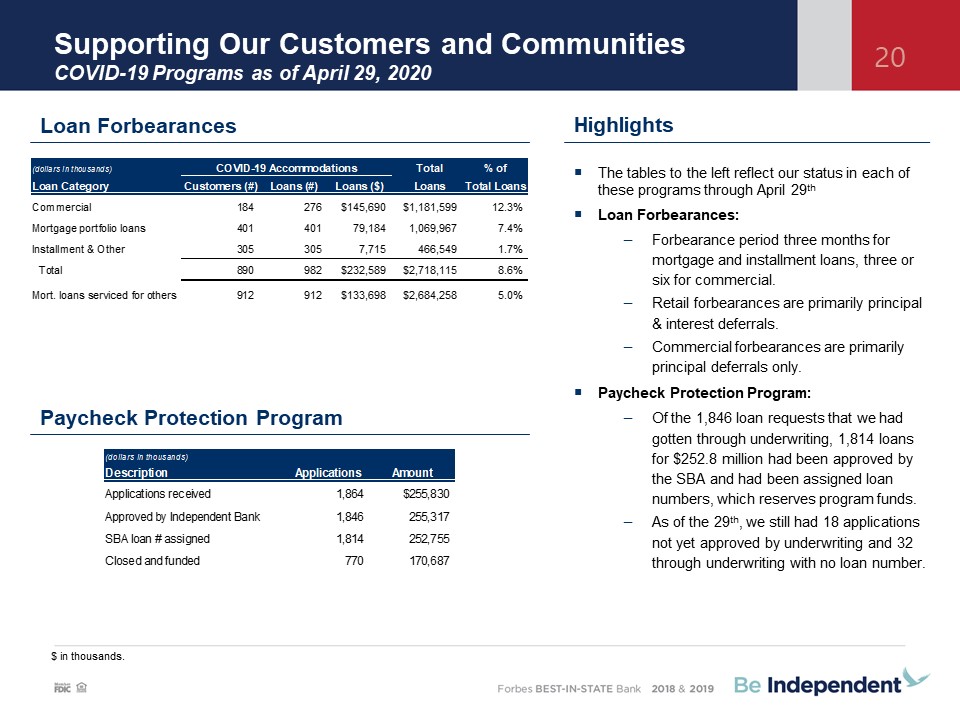
Supporting Our Customers and CommunitiesCOVID-19 Programs as of April 29, 2020 20 Paycheck Protection
Program Loan Forbearances $ in thousands. The tables to the left reflect our status in each of these programs through April 29thLoan Forbearances:Forbearance period three months for mortgage and installment loans, three or six for
commercial. Retail forbearances are primarily principal & interest deferrals.Commercial forbearances are primarily principal deferrals only.Paycheck Protection Program:Of the 1,846 loan requests that we had gotten through underwriting,
1,814 loans for $252.8 million had been approved by the SBA and had been assigned loan numbers, which reserves program funds.As of the 29th, we still had 18 applications not yet approved by underwriting and 32 through underwriting with no loan
number. Highlights
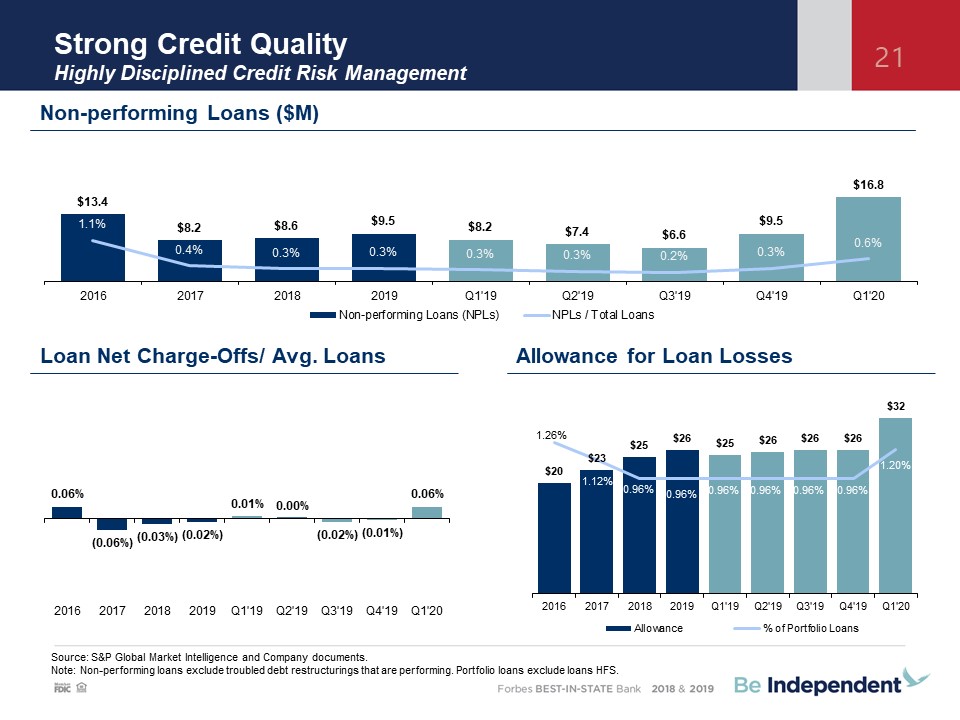
Strong Credit QualityHighly Disciplined Credit Risk Management 21 Source: S&P Global Market
Intelligence and Company documents.Note: Non-performing loans exclude troubled debt restructurings that are performing. Portfolio loans exclude loans HFS. Non-performing Loans ($M) Loan Net Charge-Offs/ Avg. Loans Allowance for Loan Losses
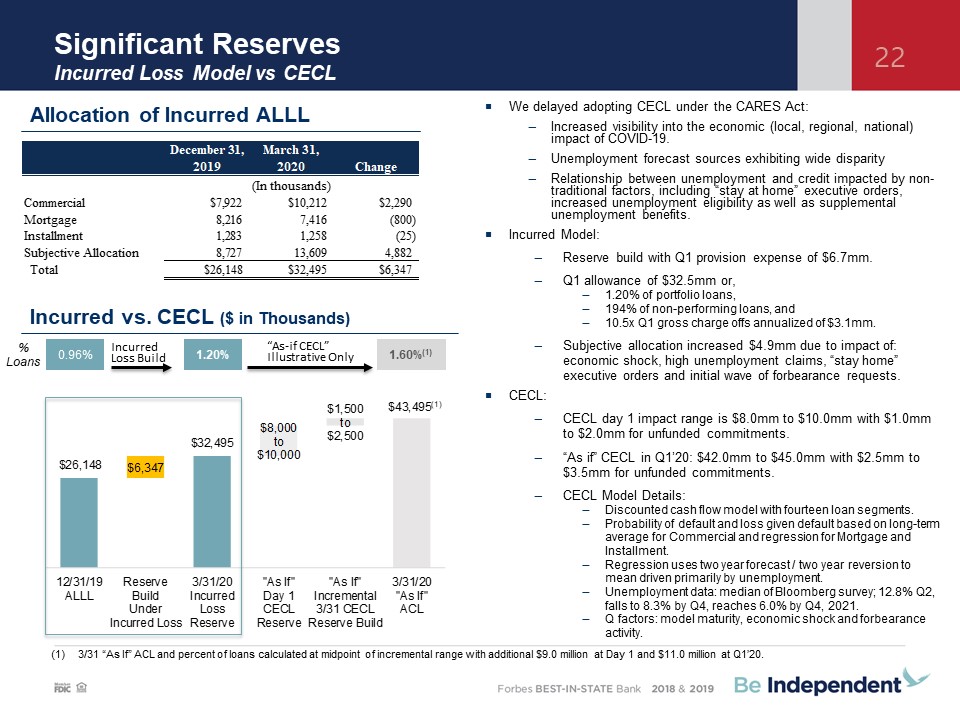
Significant ReservesIncurred Loss Model vs CECL 22 Incurred vs. CECL ($ in Thousands) 3/31 “As If” ACL
and percent of loans calculated at midpoint of incremental range with additional $9.0 million at Day 1 and $11.0 million at Q1’20. % Loans 0.96% 1.20% 1.60%(1) “As-if CECL” Illustrative Only Incurred Loss Build We delayed adopting CECL
under the CARES Act:Increased visibility into the economic (local, regional, national) impact of COVID-19. Unemployment forecast sources exhibiting wide disparityRelationship between unemployment and credit impacted by non-traditional factors,
including “stay at home” executive orders, increased unemployment eligibility as well as supplemental unemployment benefits. Incurred Model:Reserve build with Q1 provision expense of $6.7mm. Q1 allowance of $32.5mm or,1.20% of portfolio
loans,194% of non-performing loans, and10.5x Q1 gross charge offs annualized of $3.1mm.Subjective allocation increased $4.9mm due to impact of: economic shock, high unemployment claims, “stay home” executive orders and initial wave of
forbearance requests.CECL:CECL day 1 impact range is $8.0mm to $10.0mm with $1.0mm to $2.0mm for unfunded commitments.“As if” CECL in Q1’20: $42.0mm to $45.0mm with $2.5mm to $3.5mm for unfunded commitments.CECL Model Details:Discounted cash
flow model with fourteen loan segments.Probability of default and loss given default based on long-term average for Commercial and regression for Mortgage and Installment.Regression uses two year forecast / two year reversion to mean driven
primarily by unemployment.Unemployment data: median of Bloomberg survey; 12.8% Q2, falls to 8.3% by Q4, reaches 6.0% by Q4, 2021.Q factors: model maturity, economic shock and forbearance activity. Allocation of Incurred ALLL
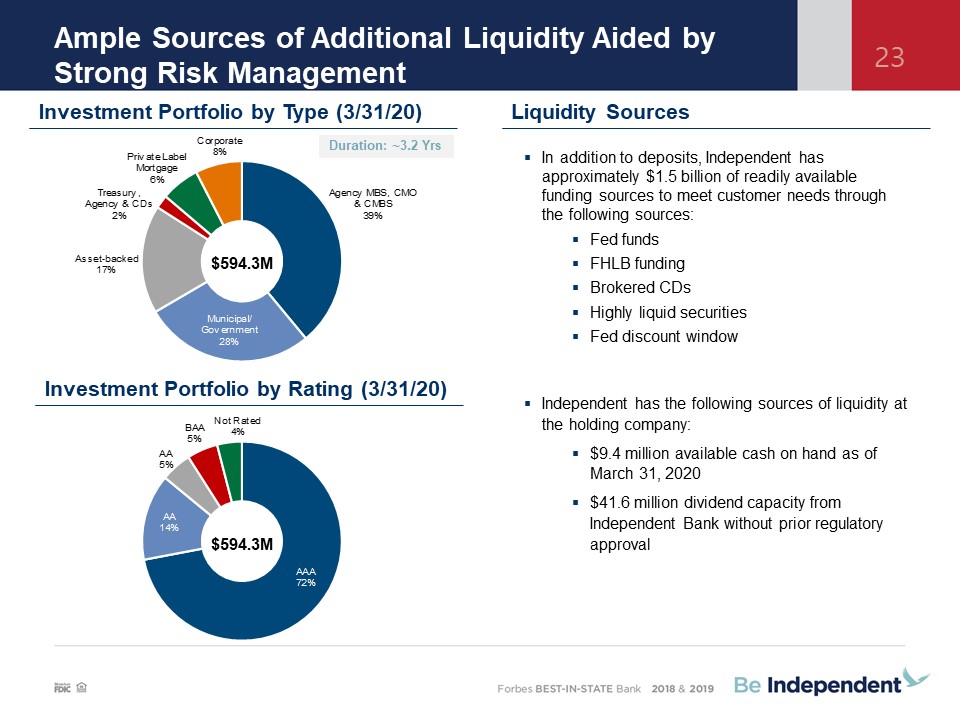
Ample Sources of Additional Liquidity Aided by Strong Risk Management 23 Liquidity Sources In addition
to deposits, Independent has approximately $1.5 billion of readily available funding sources to meet customer needs through the following sources:Fed fundsFHLB funding Brokered CDsHighly liquid securitiesFed discount
window $594.3M $594.3M Investment Portfolio by Type (3/31/20) Investment Portfolio by Rating (3/31/20) Independent has the following sources of liquidity at the holding company:$9.4 million available cash on hand as of March 31, 2020
$41.6 million dividend capacity from Independent Bank without prior regulatory approval Duration: ~3.2 Yrs
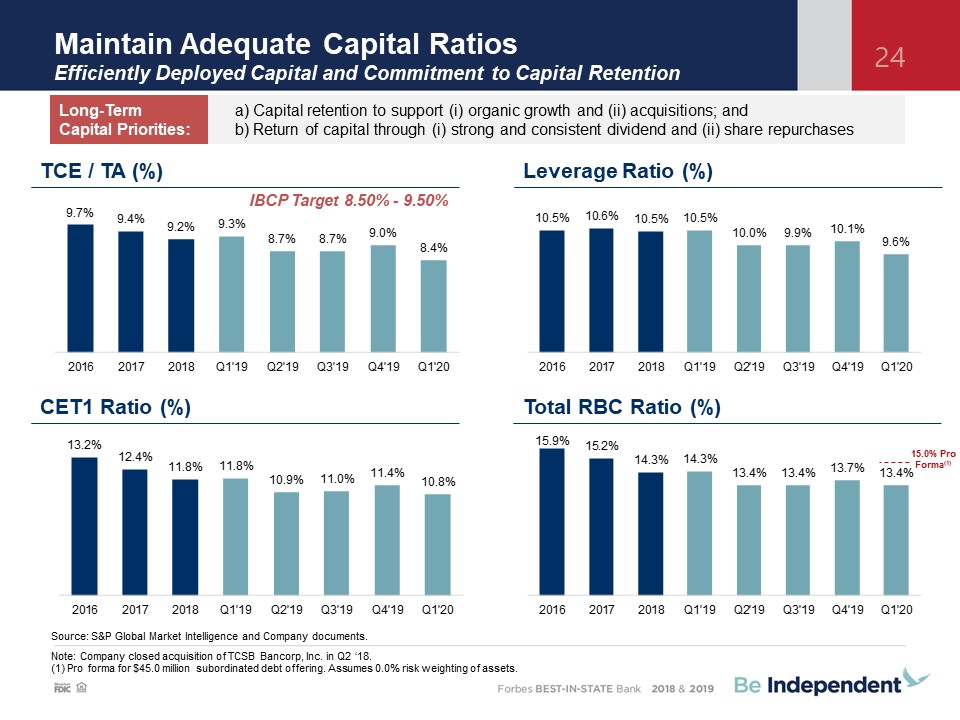
Maintain Adequate Capital RatiosEfficiently Deployed Capital and Commitment to Capital
Retention 24 Source: S&P Global Market Intelligence and Company documents.Note: Company closed acquisition of TCSB Bancorp, Inc. in Q2 ‘18.(1) Pro forma for $45.0 million subordinated debt offering. Assumes 0.0% risk weighting of
assets. TCE / TA (%) Leverage Ratio (%) CET1 Ratio (%) Total RBC Ratio (%) IBCP Target 8.50% - 9.50% Capital retention to support (i) organic growth and (ii) acquisitions; and Return of capital through (i) strong and consistent
dividend and (ii) share repurchases Long-Term Capital Priorities: 15.0% Pro Forma(1)

Appendix
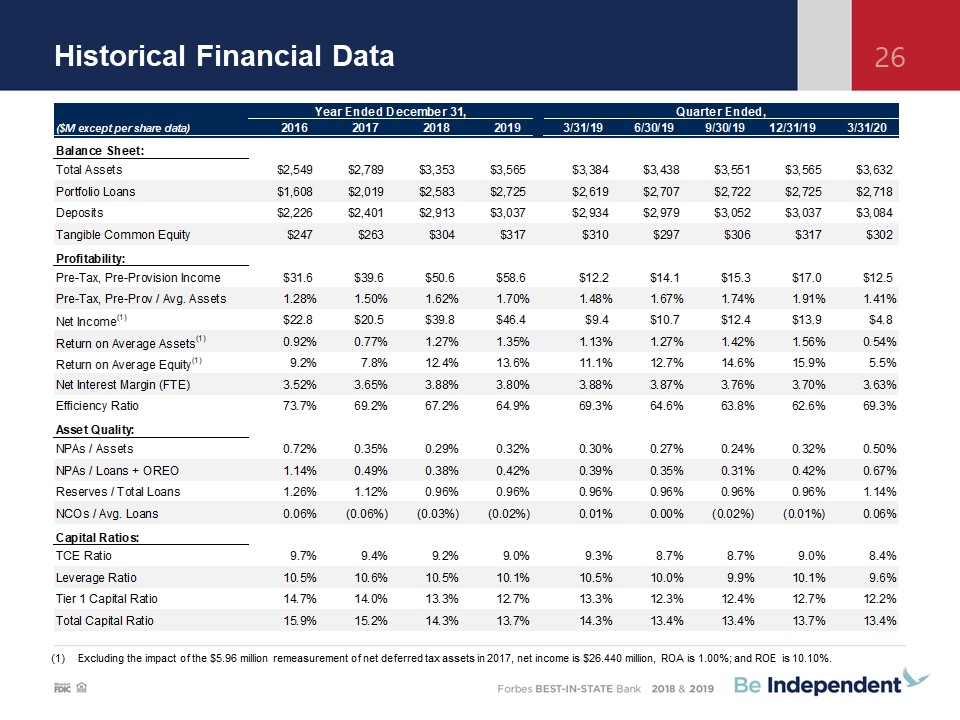
Historical Financial Data 26 Excluding the impact of the $5.96 million remeasurement of net deferred
tax assets in 2017, net income is $26.440 million, ROA is 1.00%; and ROE is 10.10%.
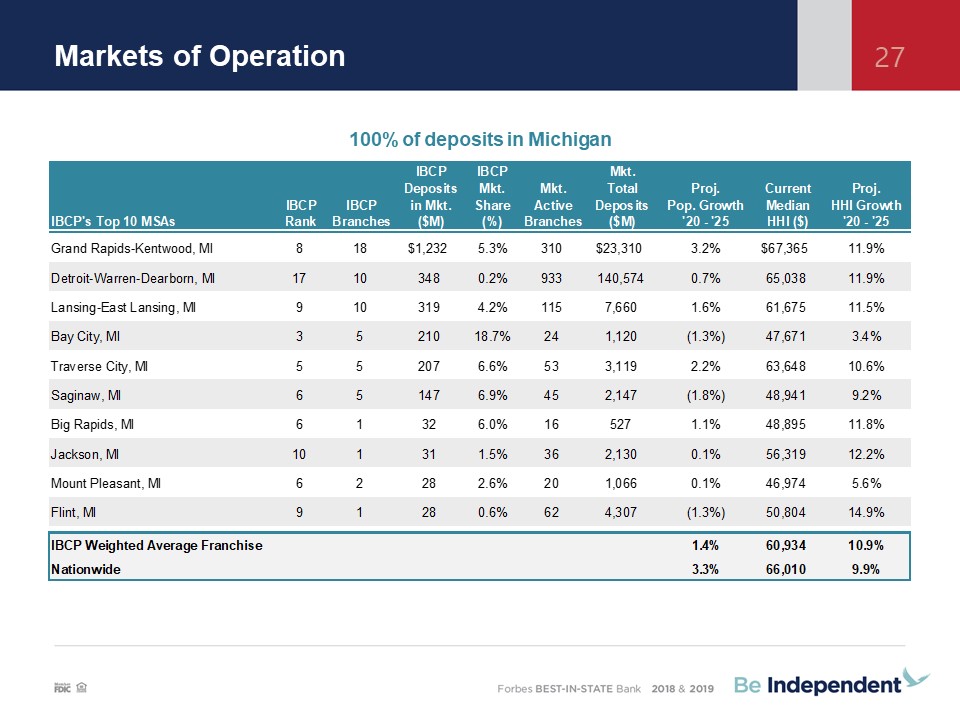
Markets of Operation 27 100% of deposits in Michigan
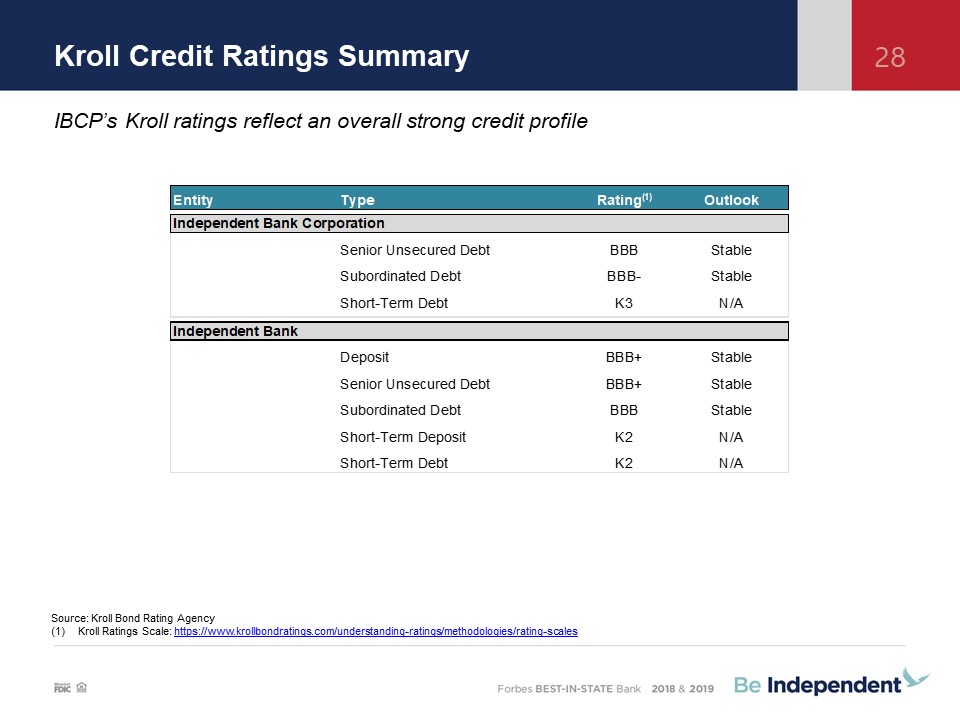
Kroll Credit Ratings Summary 28 IBCP’s Kroll ratings reflect an overall strong credit profile Source:
Kroll Bond Rating AgencyKroll Ratings Scale: https://www.krollbondratings.com/understanding-ratings/methodologies/rating-scales
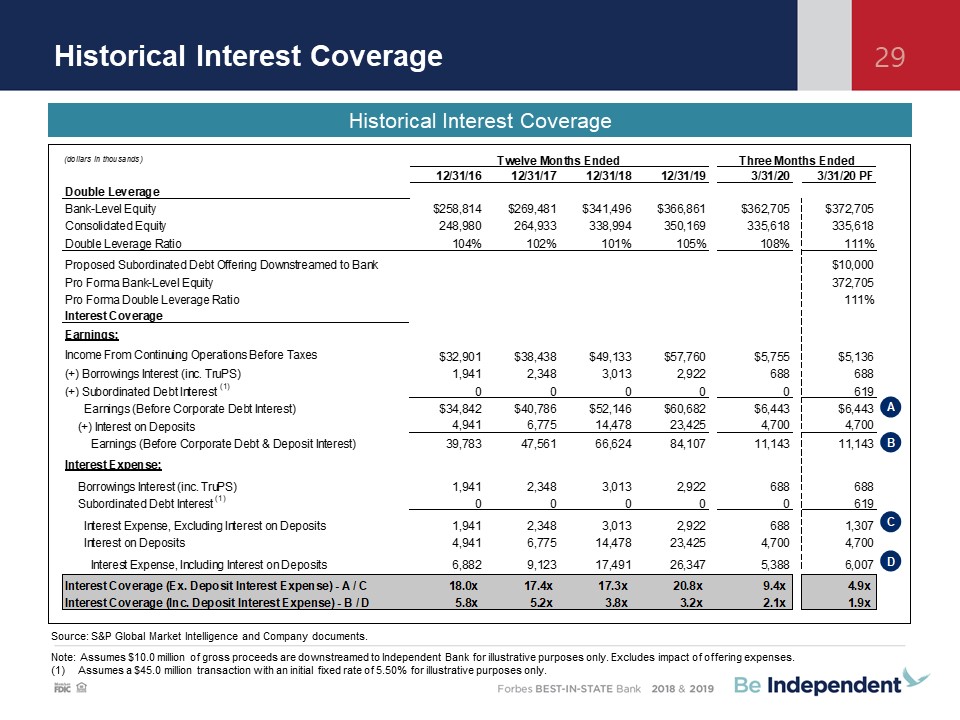
Historical Interest Coverage 29 Source: S&P Global Market Intelligence and Company documents.Note:
Assumes $10.0 million of gross proceeds are downstreamed to Independent Bank for illustrative purposes only. Excludes impact of offering expenses. Assumes a $45.0 million transaction with an initial fixed rate of 5.50% for illustrative purposes
only. Historical Interest Coverage