Attached files
| file | filename |
|---|---|
| EX-99.3 - EX-99.3 - FS KKR Capital Corp. II | d863291dex993.htm |
| EX-99.1 - EX-99.1 - FS KKR Capital Corp. II | d863291dex991.htm |
| 8-K - 8-K - FS KKR Capital Corp. II | d863291d8k.htm |

Thank you for joining Please submit your questions using the Q&A box. Google Chrome is the optimal browser for viewing this webinar. If you are experiencing difficulties viewing the slides please refresh your browser and ensure that you have enabled Adobe Flash Media Player. If you are experiencing difficulties with audio, listen by phone using the dial-in number on the bottom left-hand side of the screen. To learn more Call 877-628-8575 visit www.fsinvestments.com Exhibit 99.2
FS KKR Capital Corp. II Q1 2020 performance update & listing preparations MAY 27, 2020
1 Credit market overview 2 Q1 2020 portfolio & performance highlights (FS KKR Capital Corp. & FS KKR Capital Corp. II) 3 Liquidity plan update 4 Next steps & Operational considerations 5 Resources for client conversations Agenda
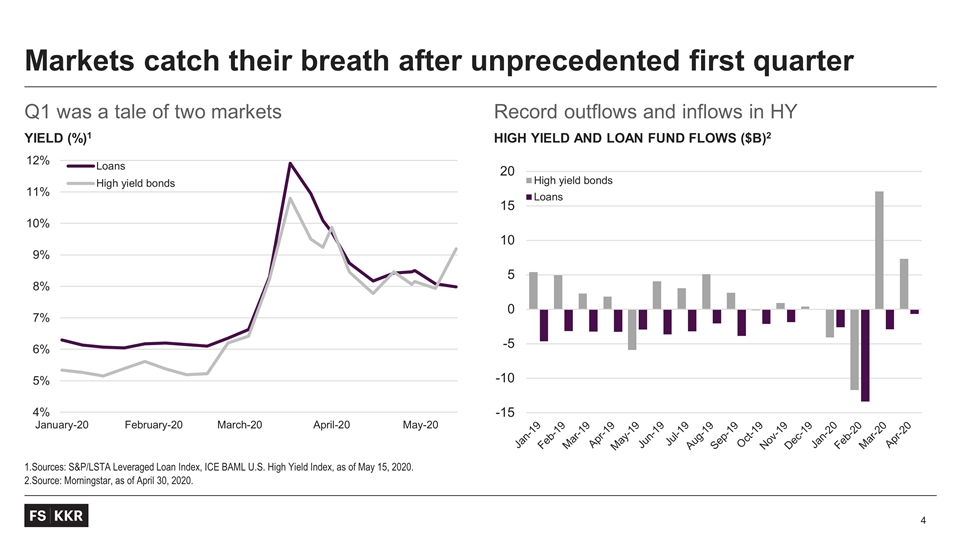
Q1 was a tale of two markets Yield (%)1 Record outflows and inflows in HY High yield and Loan fund flows ($B)2 Sources: S&P/LSTA Leveraged Loan Index, ICE BAML U.S. High Yield Index, as of May 15, 2020. Source: Morningstar, as of April 30, 2020. Markets catch their breath after unprecedented first quarter
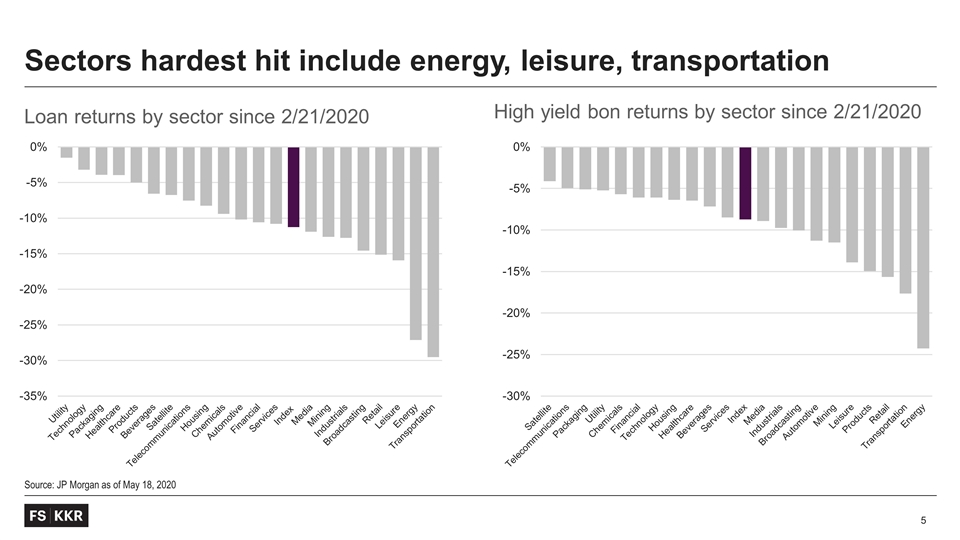
Loan returns by sector since 2/21/2020 High yield bon returns by sector since 2/21/2020 Source: JP Morgan as of May 18, 2020 Sectors hardest hit include energy, leisure, transportation
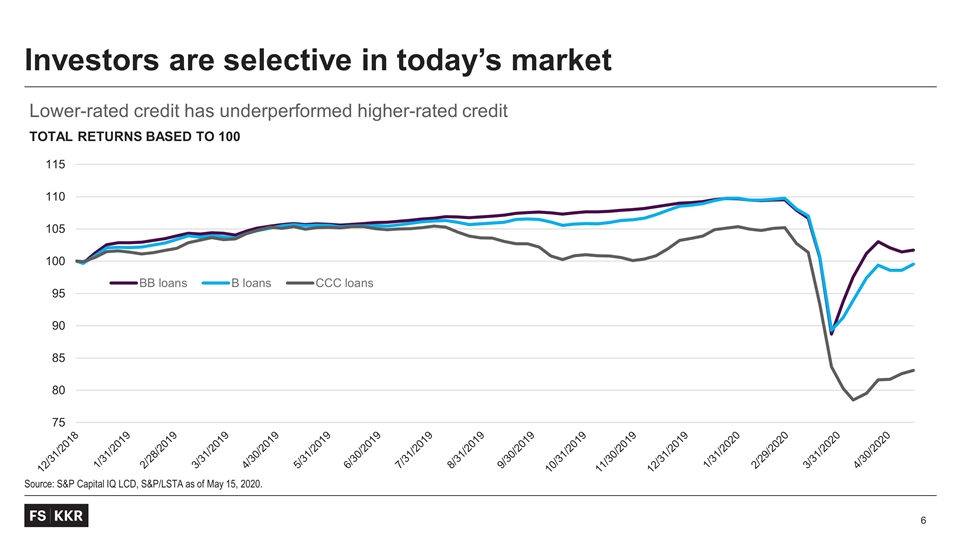
Investors are selective in today’s market Source: S&P Capital IQ LCD, S&P/LSTA as of May 15, 2020. Lower-rated credit has underperformed higher-rated credit Total returns based to 100
Q1 2020 Portfolio & Performance Overview
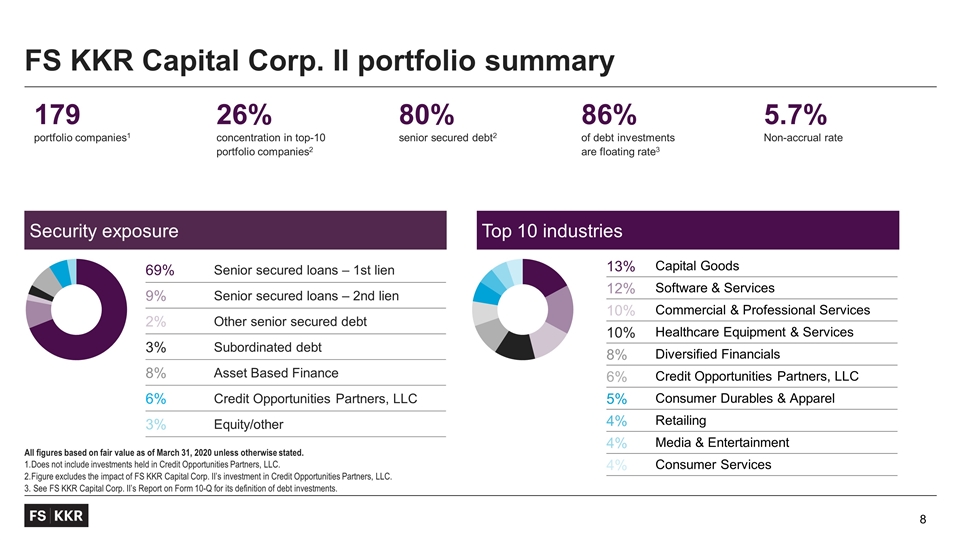
FS KKR Capital Corp. II portfolio summary All figures based on fair value as of March 31, 2020 unless otherwise stated. Does not include investments held in Credit Opportunities Partners, LLC. Figure excludes the impact of FS KKR Capital Corp. II’s investment in Credit Opportunities Partners, LLC. See FS KKR Capital Corp. II’s Report on Form 10-Q for its definition of debt investments. 69% Senior secured loans – 1st lien 9% Senior secured loans – 2nd lien 2% Other senior secured debt 3% Subordinated debt 8% Asset Based Finance 6% Credit Opportunities Partners, LLC 3% Equity/other Security exposure Top 10 industries 179 portfolio companies1 26% concentration in top-10 portfolio companies2 80% senior secured debt2 86% of debt investments are floating rate3 5.7% Non-accrual rate 13% Capital Goods 12% Software & Services 10% Commercial & Professional Services 10% Healthcare Equipment & Services 8% Diversified Financials 6% Credit Opportunities Partners, LLC 5% Consumer Durables & Apparel 4% Retailing 4% Media & Entertainment 4% Consumer Services
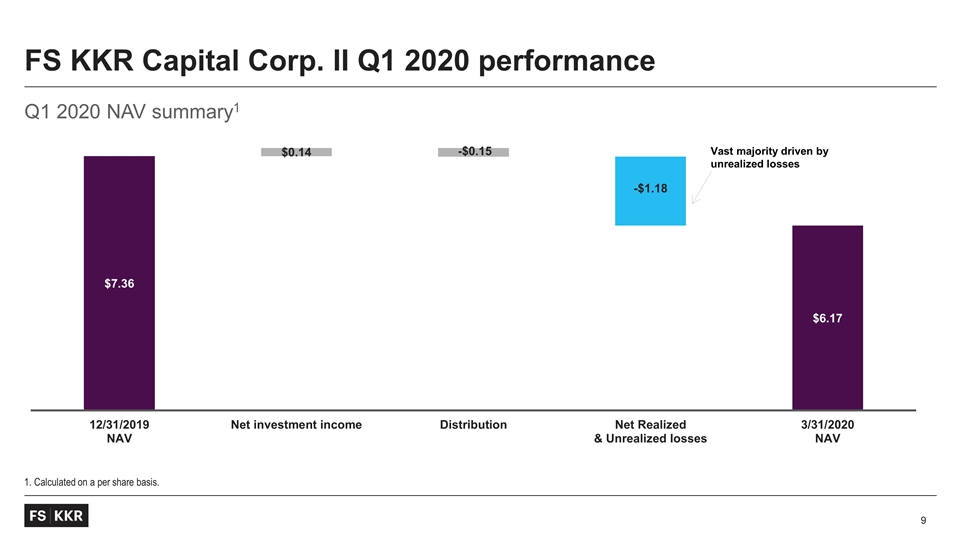
Q1 2020 NAV summary1 1. Calculated on a per share basis. FS KKR Capital Corp. II Q1 2020 performance Vast majority driven by unrealized losses
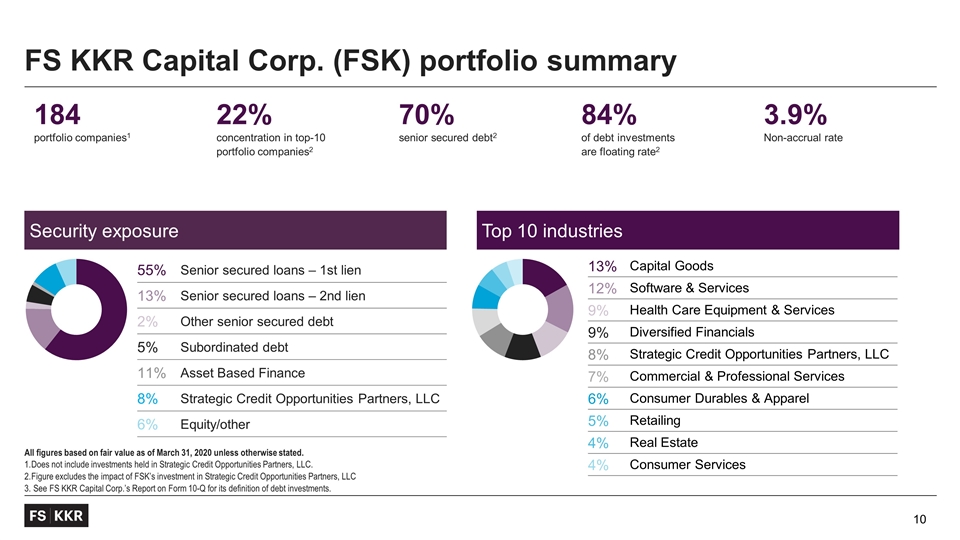
FS KKR Capital Corp. (FSK) portfolio summary All figures based on fair value as of March 31, 2020 unless otherwise stated. Does not include investments held in Strategic Credit Opportunities Partners, LLC. Figure excludes the impact of FSK’s investment in Strategic Credit Opportunities Partners, LLC See FS KKR Capital Corp.’s Report on Form 10-Q for its definition of debt investments. 55% Senior secured loans – 1st lien 13% Senior secured loans – 2nd lien 2% Other senior secured debt 5% Subordinated debt 11% Asset Based Finance 8% Strategic Credit Opportunities Partners, LLC 6% Equity/other Security exposure Top 10 industries 184 portfolio companies1 22% concentration in top-10 portfolio companies2 70% senior secured debt2 84% of debt investments are floating rate2 3.9% Non-accrual rate 13% Capital Goods 12% Software & Services 9% Health Care Equipment & Services 9% Diversified Financials 8% Strategic Credit Opportunities Partners, LLC 7% Commercial & Professional Services 6% Consumer Durables & Apparel 5% Retailing 4% Real Estate 4% Consumer Services
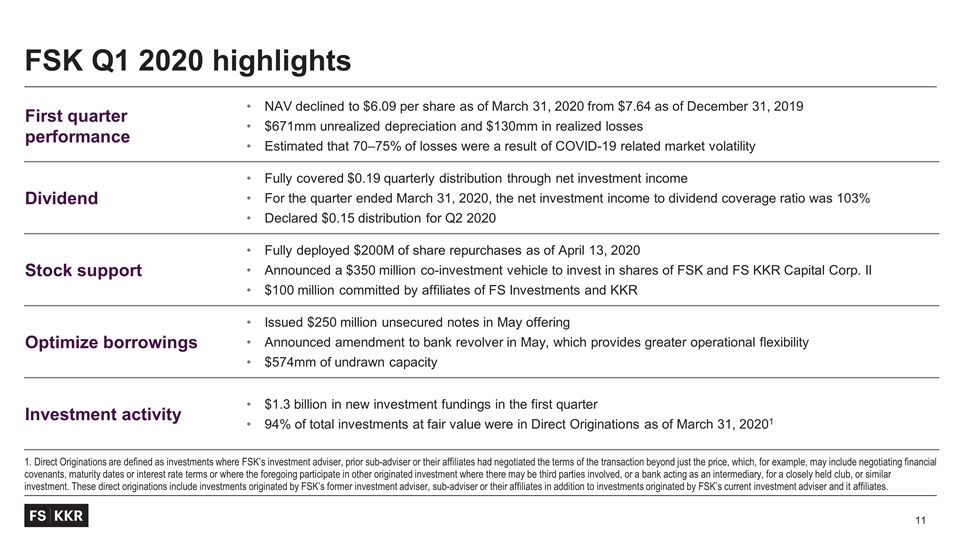
FSK Q1 2020 highlights First quarter performance NAV declined to $6.09 per share as of March 31, 2020 from $7.64 as of December 31, 2019 $671mm unrealized depreciation and $130mm in realized losses Estimated that 70–75% of losses were a result of COVID-19 related market volatility Dividend Fully covered $0.19 quarterly distribution through net investment income For the quarter ended March 31, 2020, the net investment income to dividend coverage ratio was 103% Declared $0.15 distribution for Q2 2020 Stock support Fully deployed $200M of share repurchases as of April 13, 2020 Announced a $350 million co-investment vehicle to invest in shares of FSK and FS KKR Capital Corp. II $100 million committed by affiliates of FS Investments and KKR Optimize borrowings Issued $250 million unsecured notes in May offering Announced amendment to bank revolver in May, which provides greater operational flexibility $574mm of undrawn capacity Investment activity $1.3 billion in new investment fundings in the first quarter 94% of total investments at fair value were in Direct Originations as of March 31, 20201 1. Direct Originations are defined as investments where FSK’s investment adviser, prior sub-adviser or their affiliates had negotiated the terms of the transaction beyond just the price, which, for example, may include negotiating financial covenants, maturity dates or interest rate terms or where the foregoing participate in other originated investment where there may be third parties involved, or a bank acting as an intermediary, for a closely held club, or similar investment. These direct originations include investments originated by FSK’s former investment adviser, sub-adviser or their affiliates in addition to investments originated by FSK’s current investment adviser and it affiliates.
FS KKR Capital Corp. II Listing Overview
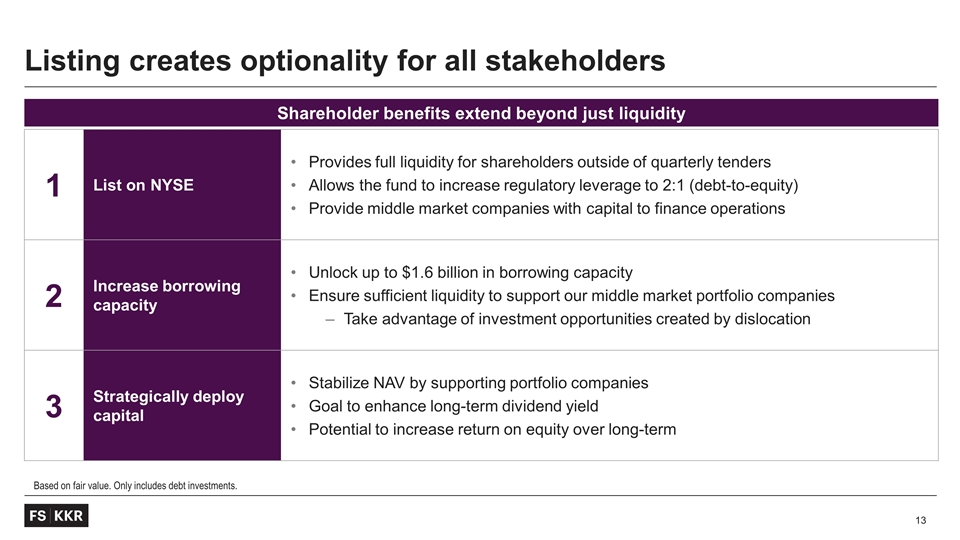
Listing creates optionality for all stakeholders 1 List on NYSE Provides full liquidity for shareholders outside of quarterly tenders Allows the fund to increase regulatory leverage to 2:1 (debt-to-equity) Provide middle market companies with capital to finance operations 2 Increase borrowing capacity Unlock up to $1.6 billion in borrowing capacity Ensure sufficient liquidity to support our middle market portfolio companies Take advantage of investment opportunities created by dislocation 3 Strategically deploy capital Stabilize NAV by supporting portfolio companies Goal to enhance long-term dividend yield Potential to increase return on equity over long-term Shareholder benefits extend beyond just liquidity Based on fair value. Only includes debt investments.
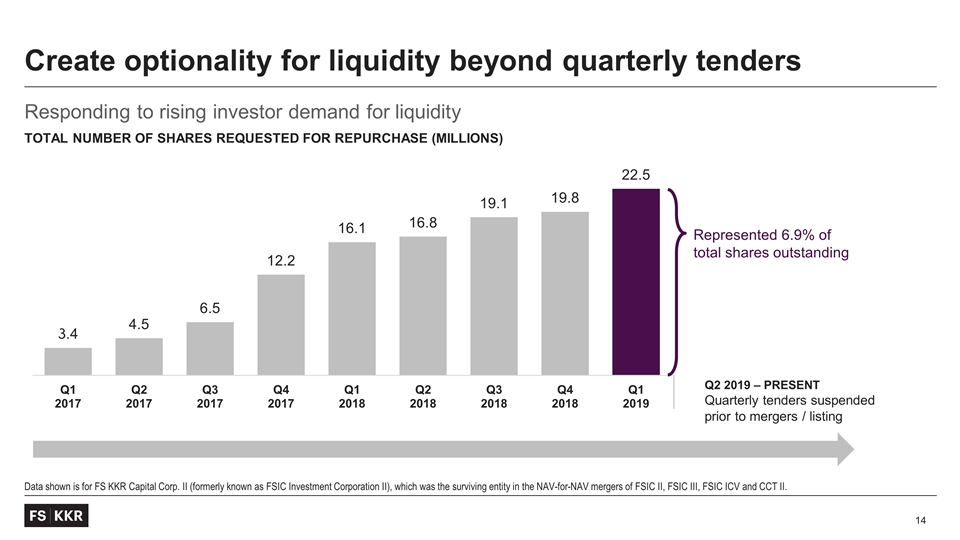
Responding to rising investor demand for liquidity Total Number of shares requested for repurchase (millions) Data shown is for FS KKR Capital Corp. II (formerly known as FSIC Investment Corporation II), which was the surviving entity in the NAV-for-NAV mergers of FSIC II, FSIC III, FSIC ICV and CCT II. Create optionality for liquidity beyond quarterly tenders Q1 Q2 Q2 2019 – PRESENT Quarterly tenders suspended prior to mergers / listing Represented 6.9% of total shares outstanding
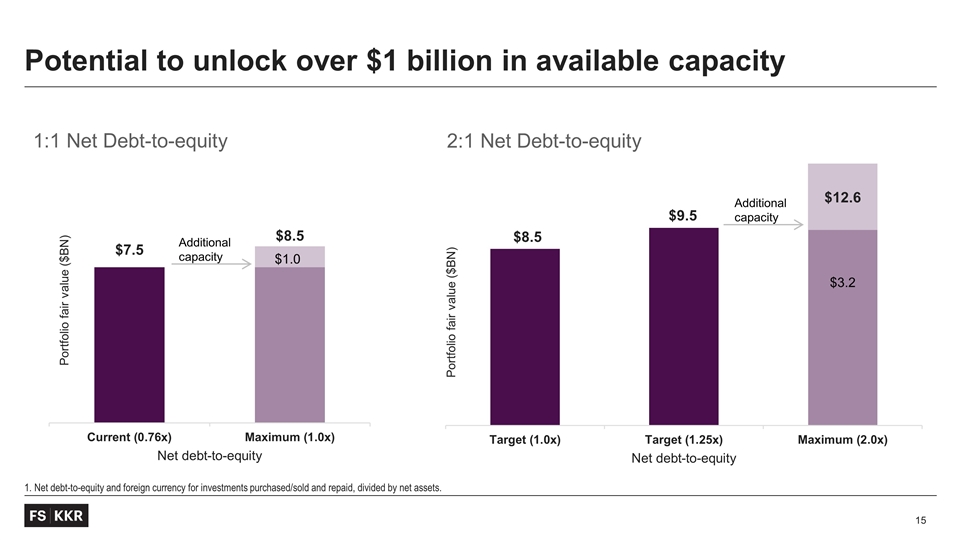
1. Net debt-to-equity and foreign currency for investments purchased/sold and repaid, divided by net assets. Potential to unlock over $1 billion in available capacity 1:1 Net Debt-to-equity 2:1 Net Debt-to-equity $1.0 Additional capacity $3.2 Additional capacity
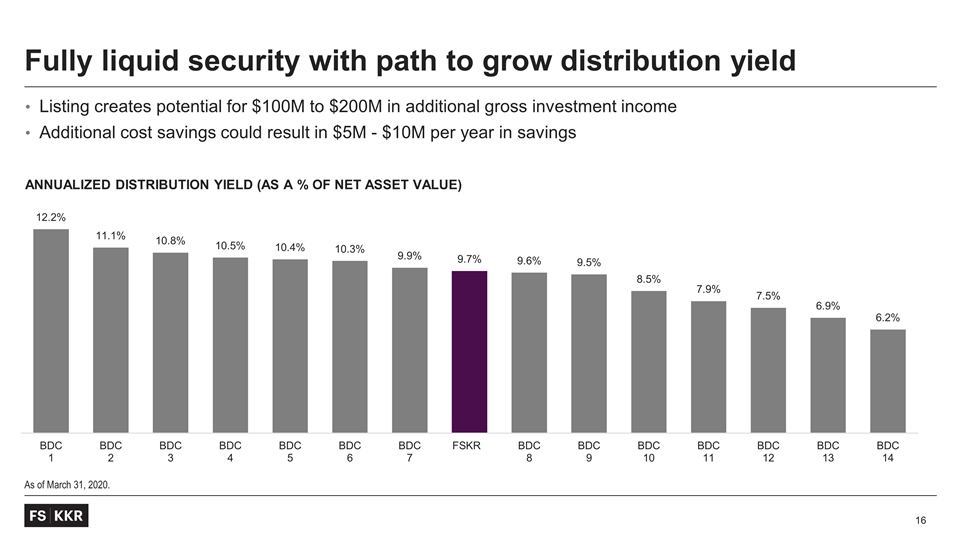
As of March 31, 2020. Fully liquid security with path to grow distribution yield Annualized distribution yield (as a % of net asset value) Listing creates potential for $100M to $200M in additional gross investment income Additional cost savings could result in $5M - $10M per year in savings
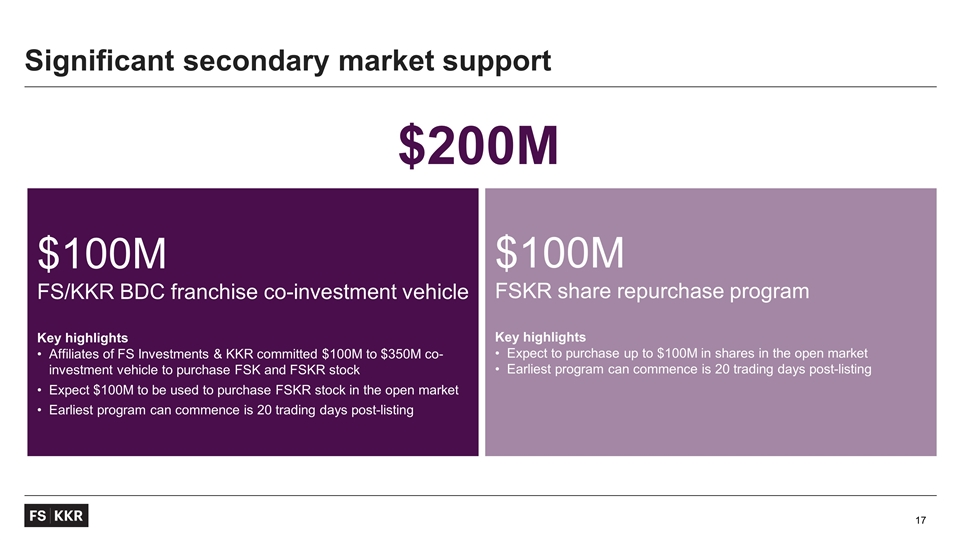
Significant secondary market support $100M FS/KKR BDC franchise co-investment vehicle Key highlights Affiliates of FS Investments & KKR committed $100M to $350M co-investment vehicle to purchase FSK and FSKR stock Expect $100M to be used to purchase FSKR stock in the open market Earliest program can commence is 20 trading days post-listing $100M FSKR share repurchase program Key highlights Expect to purchase up to $100M in shares in the open market Earliest program can commence is 20 trading days post-listing $200M
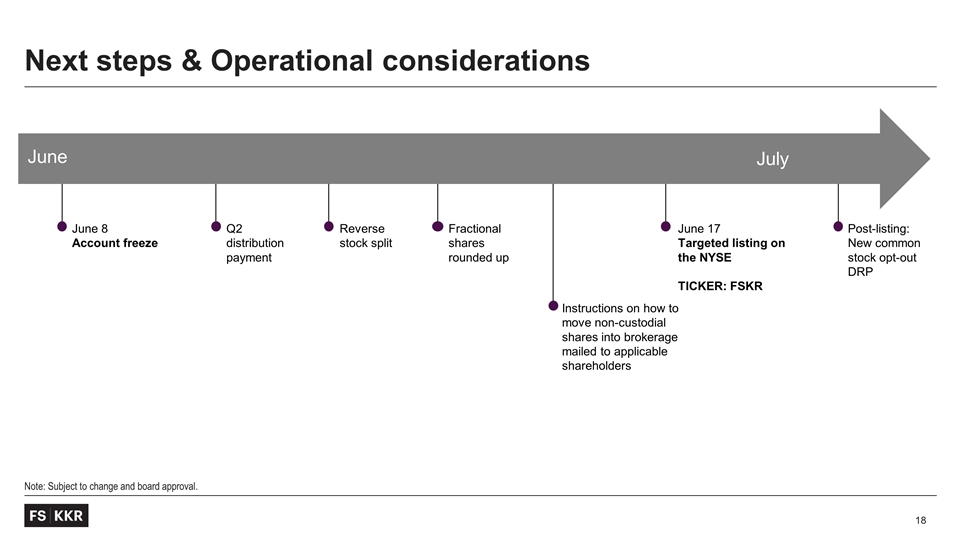
Note: Subject to change and board approval. Next steps & Operational considerations June 8 Account freeze Reverse stock split June July Q2 distribution payment June 17 Targeted listing on the NYSE TICKER: FSKR Instructions on how to move non-custodial shares into brokerage mailed to applicable shareholders Post-listing: New common stock opt-out DRP Fractional shares rounded up
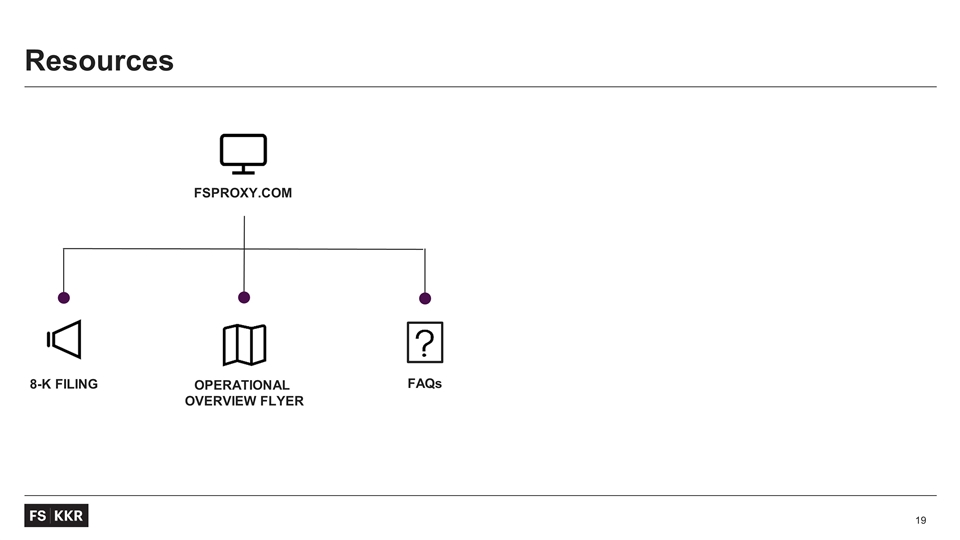
Resources FSPROXY.COM OPERATIONAL OVERVIEW FLYER 8-K FILING FAQs

Questions?
Forward-Looking Statements Securities offered through FS Investment Solutions, LLC (member FINRA/SIPC). FS Investment Solutions, LLC is an affiliated broker-dealer that serves as the wholesaling distributor of non-traded funds sponsored by FS Investments. An investment in any fund sponsored by FS Investments involves a high degree of risk and may be considered speculative. Investors are advised to consider the investment objectives, risks, and charges and expenses of the applicable fund carefully before investing. The applicable fund’s prospectus contains this and other information. Investors may obtain a copy of the applicable fund’s prospectus free of charge at http://www.fsinvestments.com or by contacting FS Investments at 201 Rouse Blvd., Philadelphia, PA 19112 or by phone at 877-628-8575. Investors should read and carefully consider all information found in the applicable fund’s prospectus and other reports filed with the U.S. Securities and Exchange Commission before investing. Statements included herein may constitute “forward-looking” statements as that term is defined in Section 27A of the Securities Act of 1933, as amended, and Section 21E of the Securities Exchange Act of 1934, as amended by the Private Securities Litigation Reform Act of 1995, including statements with regard to future events or the future performance or operations of FS KKR Capital Corp. II (the “Fund”). Words such as “believes,” “expects,” “projects,” and “future” or similar expressions are intended to identify forward-looking statements. These forward-looking statements are subject to the inherent uncertainties in predicting future results and conditions. Certain factors could cause actual results to differ materially from those projected in these forward-looking statements. Factors that could cause actual results to differ materially include changes in the economy, risks associated with possible disruption to the Fund’s operations or the economy generally due to terrorism or natural disasters, future changes in laws or regulations and conditions in a Fund’s operating area, failure to obtain requisite shareholder approval for the Proposals (as defined below) set forth in the Proxy Statement (as defined below), unexpected costs, charges or expenses resulting from the business combination transaction involving the Fund, failure to realize the anticipated benefits of the business combination transaction involving the Fund, failure to consummate the recapitalization transaction and failure to list the common stock of FSK II on a national securities exchange. Some of these factors are enumerated in the filings the Fund made with the Securities and Exchange Commission (the “SEC”). The inclusion of forward-looking statements should not be regarded as a representation that any plans, estimates or expectations will be achieved. Any forward-looking statements speak only as of the date of this communication. Except as required by federal securities laws, the Fund undertakes no obligation to update or revise any forward-looking statements, whether as a result of new information, future events or otherwise. Readers are cautioned not to place undue reliance on any of these forward-looking statements. The total return for each period presented is historical and is calculated by determining the percentage change in net asset value, assuming the reinvestment of all distributions in additional common shares of the Company at the Company’s net asset value per share as of the share closing date occurring on or immediately following the distribution payment date. The total return does not consider the effect of the sales load from the sale of the Company’s common shares. An investment in FS KKR Capital Corp. II Fund (the Company) involves a high degree of risk and may be considered speculative. Investors are advised to consider the investment objectives, risks, and charges and expenses of the Company carefully before investing. This is neither an offer to sell nor a solicitation of an offer to buy the securities described herein. An offering is made only by a prospectus, which must be made available to you in connection with this offering. No offering is made to New York investors except by a prospectus filed with the Department of Law of the State of New York. Disclosures
