Attached files
| file | filename |
|---|---|
| 8-K - 8-K - FIRST MIDWEST BANCORP INC | fmbi-20200527.htm |
Exhibit 99.1 PRESENTATION MATERIALS MAY 2020

WHAT DRIVES US VISION MISSION VALUES To be the partner of choice for financial To help our clients achieve To serve our clients with integrity, services in the markets we serve, and one financial success. excellence, responsibility and of the nation's top performing financial passion. institutions. Our vision, mission and values drive a culture that is centered on client needs, rooted in service excellence, dedicated to bettering our communities, focused on attracting top industry talent and influenced by technological change. 2

FIRST MIDWEST TODAY A Premier Commercial Bank With a Robust Distribution Network • Multi-state, Midwestern reach ▪ $20bn in total assets ▪ $11bn in AUM ▪ Chicago's 3rd largest independent bank – Top 10 deposit share in Chicago MSA – #2 deposit share in South Metro – 3rd largest wealth management platform in IL Assets have grown at 18% CAGR since 2016 $20bn $18bn Park Bank $16bn Bridgeview ($1.2bn) $14bn NorStates $11bn Standard Bank Bank ($1.1bn) Bank ($0.6bn) ($2.6bn) 2016 2017 2018 2019 Q1 '20 EXPANSION DRIVEN BOTH ORGANICALLY AND THROUGH DISCIPLINED ACQUISITIONS Source: Company filings and SNL Financial Note: See the accompanying "Non-GAAP Financial Information," "Glossary of Terms," and "Footnotes" slides for details on the calculations of these metrics, definitions of certain terms, and footnotes used. 3

OUR STRATEGIC PRIORITIES Building the Build the BalancingStrongest Team Strongest Team Risk & Investment Inspire, engage and reward Investment in capabilities, processes colleagues and technology Empower leaders to build high Maintain risk and information security performing teams standards Attract and retain top talent Enhance process efficiency Increase and encourage diversity and inclusion Strategic Growing & Priorities Diversifying Expanding Revenues Strategically Retain customers and enhance Execute targeted geographic expansion cross-selling for banking and related businesses Seek net new client growth Build scale, market share and core Leverage technology to enhance funding within our footprint and across digitization adjacent markets 4

GUIDANCE THROUGH UNPRECEDENTED TIMES Global pandemic, national emergency declared mid-March 2020 Rapidly evolving environment, ~15% unemployment Radical pivot and response, with energy and focus shifted to health, safety and well-being of clients, colleagues and communities Numerous accomplishments that fell outside of the ordinary course of business: – Adapted platforms, distribution and operating model – Heighten safety and expanded support for colleagues – Recognized and assisted with the stress on individual and business cash flow needs – Enhanced community support Displayed strength and character of our Company and team Tremendous "can do" spirit 5

WE ARE ALL IN THIS TOGETHER Virtually all non-client facing colleagues Supporting Our Colleagues working remotely • Provided bonus and pay premiums for non-remote colleagues • On-site colleagues using enhanced • Enhanced health insurance programs and access to retirement benefits to health and safety protocols provide greater flexibility, coverage and additional support • Expanded paid time off programs ~85% of all locations remain open with • Added provisions for emergency medical and hardship loans access to drive-up and lobby appointment service Supporting Our Clients ~95% ATMs operating at full capacity • Branches accessible with enhanced health and safety protocols • Offering payment deferral and fee assistance programs and services: – Consumer, mortgage, auto loan deferrals and fee assistance Helped ~4,000 clients through payment – Commercial loan deferrals and fee assistance deferrals and fee assistance programs – Suspension of foreclosure and repossession actions • Ongoing participation in the SBA's Paycheck Protection Program Funded nearly $1.2bn of PPP loans for ~6,000 clients; impacted the lives of Supporting Our Communities over 125,000 small business employees • Additional contribution from the First Midwest Charitable Foundation and their families • Aiding individuals and families through affordable housing and financial sustainability and supporting small businesses Committed $2.5mm to supporting our • Enhanced matching gifts programs to support colleague donations communities LEVERAGING OUR STRENGTHS TO SUPPORT OUR CLIENTS AND COMMUNITIES Note: See the accompanying "Glossary of Terms" slide definitions of certain terms used. 6

OUR COMMITMENT TO CORPORATE SOCIAL RESPONSIBILITY Driving an Building Diversity Deepening Strong Inclusive Workplace in Our Organization Colleague Engagement Corporate Governance • Launched unconscious bias • Recognized for board diversity • Our commitment to strong, training sessions to develop Recognized as one transparent corporate governance of the 2019 Chicago inclusive leadership and cultural 47% of our hires into senior and ethical business practice starts competency skills. roles were women Tribune Top Places with our Board of Directors and to Work. executive leadership team. • Redesigned our learning of our hires into senior roles curriculum to emphasize the 24% were racial minorities • All colleagues adhere to a power of inclusive leadership to Recognized and as one comprehensive Code of Ethics and of Forbes' Best-In- inspire high-performing teams of our rotational development Standards of Conduct. State Banks in 2019. and colleagues. 50% class represented racial and gender diversity Commitment to Community Development Sustainable Business Operations • Implemented an enhanced shredding and recycling program 20+ 8,000 • Increased hoteling stations for colleagues with flexible work consecutive years - participants in saving and budgeting, schedules, resulting in fewer vehicles on the roads and a Outstanding CRA rating homeownership and other financial reduction in carbon emissions. literacy education programs • In 2019, we recycled 826,000 pounds = 413 tons of material $1.5mm $186mm translating to: 7,000 saved trees of donations to nonprofit organizations of community development 24,000 pounds of eliminated pollutants in our local communities in 2019 loans in 2019 1.6mm kilowatts in saved energy 7

INVESTMENT HIGHLIGHTS ü Premier Midwest-based Commercial Bank with Attractive Operational Footprint ü Relationship-driven Strategy, Supported by Leading Core Deposit Foundation ü Diversified Loan Portfolio and Disciplined Underwriting Drive Strong Credit ü Underlying Operating Performance, Aided by "Delivering Excellence"(1) ü Platform for and Track Record of Integrating Accretive, Attractive Acquisitions ü Capital Levels Provide Future Flexibility Note: See the accompanying "Glossary of Terms" and "Footnotes" slides for details on the definitions of certain terms and footnotes used. 8
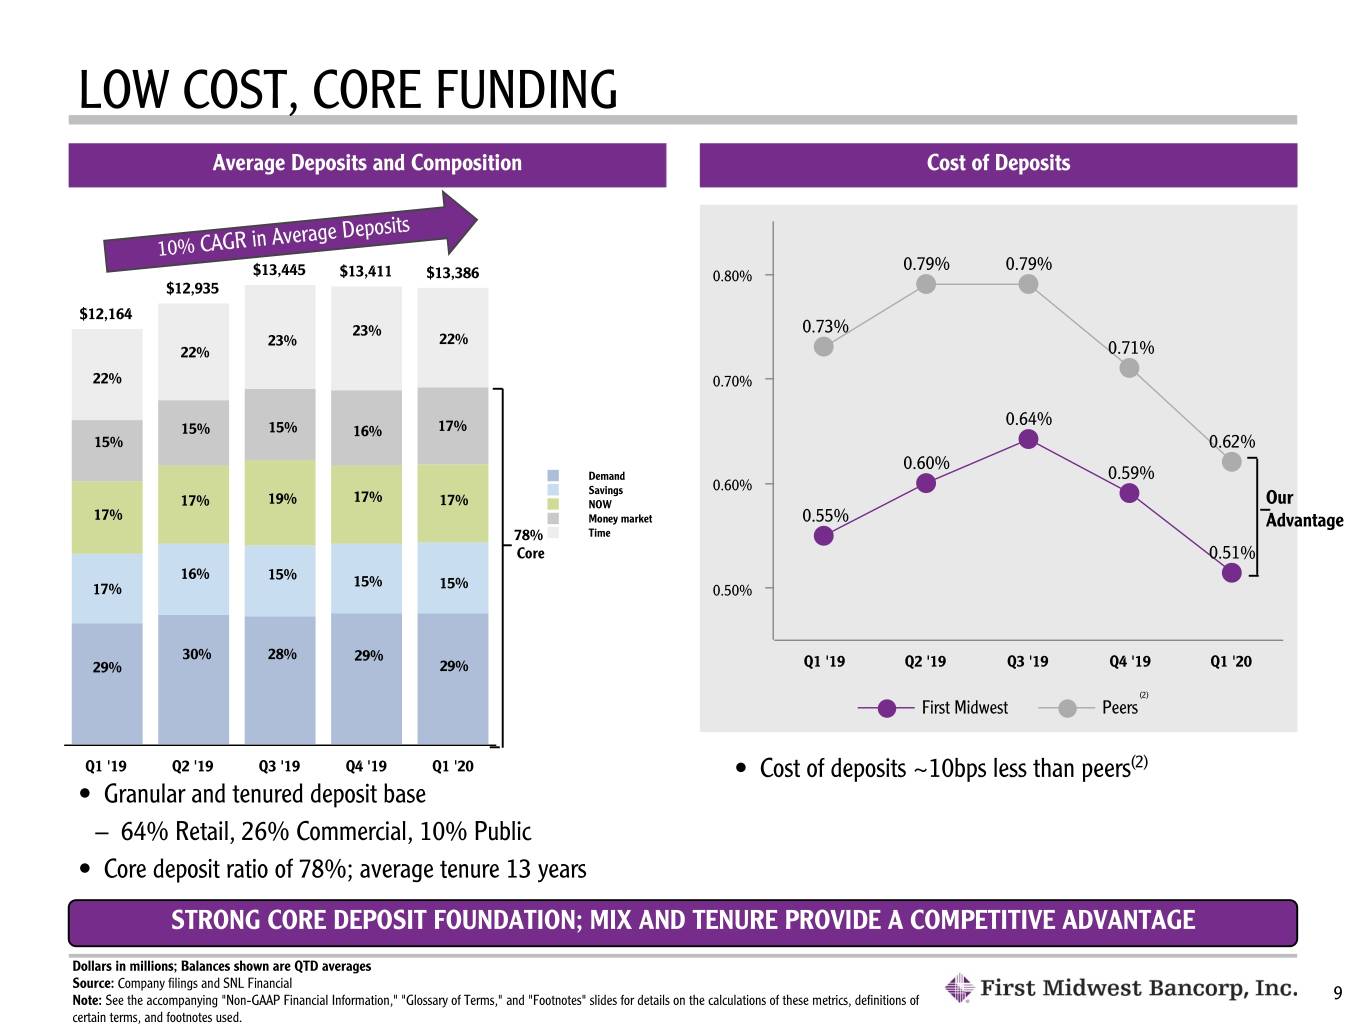
LOW COST, CORE FUNDING Average Deposits and Composition Cost of Deposits 10% CAGR in Average Deposits 0.79% 0.79% $13,445 $13,411 $13,386 0.80% $12,935 $12,164 23% 0.73% 23% 22% 22% 0.71% 22% 0.70% 0.64% 15% 15% 16% 17% 15% 0.62% 0.60% Demand 0.59% 0.60% 17% Savings 17% 19% 17% NOW Our 17% Money market 0.55% Advantage 78% Time Core 0.51% 16% 15% 15% 17% 15% 0.50% 30% 28% 29% 29% 29% Q1 '19 Q2 '19 Q3 '19 Q4 '19 Q1 '20 (2) First Midwest Peers Q1 '19 Q2 '19 Q3 '19 Q4 '19 Q1 '20 • Cost of deposits ~10bps less than peers(2) • Granular and tenured deposit base – 64% Retail, 26% Commercial, 10% Public • Core deposit ratio of 78%; average tenure 13 years STRONG CORE DEPOSIT FOUNDATION; MIX AND TENURE PROVIDE A COMPETITIVE ADVANTAGE Dollars in millions; Balances shown are QTD averages Source: Company filings and SNL Financial Note: See the accompanying "Non-GAAP Financial Information," "Glossary of Terms," and "Footnotes" slides for details on the calculations of these metrics, definitions of 9 certain terms, and footnotes used.

STRONG FUNDING AND LIQUIDITY Funding Profile Highlights • $13bn of very stable long-term deposit base is primary source of liquidity Time | 17% • Line of credit draws during Q1 '20 of Interest-bearing | 42% Brokered CD's | 2% ~$100mm, up 1% from Q1 '19 activity – Increase funded with deposits Borrowed funds | 14% – Line of credit draws distributed across a variety of industries within C&I Demand | 25% • Over $6bn in additional funding sources provide ample capacity to support our clients, Core Deposits Time Deposits Borrowed Funds colleagues, and communities – Nearly $4bn comprised of unencumbered securities and cash, FHLB capacity and Fed availability - meaningfully higher than undrawn commitments • Flexibility to utilize PPPLF or other sources to fund PPP demand AMPLE LIQUIDITY PROVIDES FLEXIBILITY TO MEET EXPECTED DEMAND Data as of March 31, 2020 Funding Profile data reflects QTD averages Note: See the accompanying "Non-GAAP Financial Information," "Glossary of Terms," and "Footnotes" slides for details on the calculation of these metrics, definitions 10 of certain terms, and footnotes used.

DIVERSIFIED LOAN PORTFOLIO Growing, Diversifying Our Loan Portfolio Credit Trends 21% CAGR in Total Loans $13,965 $12,773 $12,841 0.40% $12,520 0.37% 26% $11,568 23% 25% 22% 0.33% 20% 0.32% 0.32% 24% 0.30% 0.31% 28% 27% 27% 28% 0.29% 12% 11% 11% 10% 12% 2% 3% 4% 3% 3% 0.20% 36% Q1 '19 Q2 '19 Q3 '19 Q4 '19 Q1 '20 35% 36% 36% 36% NCOs/Avg Loans(3) NCOs/Avg Loans, excluding PCD Loans(3)(8) • Granular, diversified mix Q1 '19 Q2 '19 Q3 '19 Q4 '19 Q1 '20 • NCOs/Avg Loans, excluidng PCD loans, of 0.32% within normalized range C&I Agricultural Owner-occupied CRE Investor CRE Consumer Dollars in millions Source: Company filings and reports Note: See the accompanying "Non-GAAP Financial Information," "Glossary of Terms," and "Footnotes" slides for details on the calculations of these metrics, definitions of 11 certain terms, and footnotes used.

MEANINGFULLY DIVERSIFIED AND WELL-RESERVED First Midwest's Portfolio Has Meaningfully Diversified Well-Reserved for Potential Losses 2.00% (5) Change in 1.62% Q4 '09 Q1 '20 Composition C&I 28% 36% 8% 1.24% 1.29% Agricultural 4 2 (2) 1.00% CRE 87% 75% 0.91% Multifamily 7 7 — Construction 11 4 (7) 0.00% Owner-Occ CRE 14 12 (2) Q1 '20 Investor CRE 23 14 (9) ACL/Loans Consumer ACL/Loans, excluding PCD loans(4) NPAs/Loans + Foreclosed Assets (4) 1-4 family 13% 3 25% 14 11 NPAs/Loans + Foreclosed Assets, excluding PCD loans Other 10 11 1 Highlights • Rebalanced mix of corporate and consumer loans • Lower levels of construction and investor CRE loans within the corporate portfolio • ACL levels leave us well-positioned in the current environment Source: SNL Financial and FactSet. Note: Financial data as of the most recently reported quarter. Note: See the accompanying "Non-GAAP Financial Information," "Glossary of Terms," and "Footnotes" slides for details on the calculations of these metrics, definitions of 12 certain terms, and footnotes used.

LOAN DIVERSIFICATION - CORPORATE $10.5bn 75% of Total Loans 36% C&I / 37% CRE / 2% Agricultural Services Balance % of Sector ( in mm) total loans Risk Elements Other C&I Loans Manufacturing Selectively positioned national Health Care Franchises $ 204 1.5% QSRs; moderately leveraged Elevated All major brands, avg. LTV Hotels 127 0.9% 50% Agricultural Risk Recreation/ Very granular, real estate Segments Entertainment 107 0.8% secured (both C&I and CRE Temporary disruption to vital categories) Dental 105 0.8% industry Owner Multi-family Other Occupied CRE Restaurants 74 0.5% Modest exposure Construction Retailers 62 0.4% Modest exposure Other Total $ 679 4.9% Investor CRE C&I CRE Agricultural GRANULAR, DIVERSIFIED PORTFOLIO REDUCES EXPOSURE TO STRESSED SECTORS Data as of March 31, 2020 Note: See the accompanying "Non-GAAP Financial Information," "Glossary of Terms" and "Footnotes" slides for details on the calculations of these metrics, definitions of certain terms, and footnotes used. 13

LOAN DIVERSIFICATION - CONSUMER $3.4bn 25% of Total Loans Home Equity Avg. FICO - 764 Avg. LTV - 73% Other Installment Avg. FICO - 749 Balance % of Elevated Risk Sector ( in mm) total loans Risk Elements Segment Unsecured ~90% have FICO > 700; Installment $ 289 2.1% Avg loan size ~$10k 1-4 Family Avg. FICO - 775 Avg. LTV - 69% HIGH QUALITY CREDIT - GEOGRAPHICALLY DISPERSED Data as of March 31, 2020. Note: See the accompanying "Non-GAAP Financial Information," "Glossary of Terms" and "Footnotes" slides for details on the calculations of these metrics, definitions of certain terms, and footnotes used. 14

CURRENT EXPECTED CREDIT LOSSES ("CECL") Day 1 Impact - Adoption Implementation • $76mm (69%) total ACL increase compared to Q4 '19, $16 $28 $227 consisting of: $76 $(2) – $32mm (29%), excluding acquired loans – $44mm (40%) for acquired loans $109 1.62% 1.39% ◦ $36mm for PCD loans 0.85% • Elected CECL transition for regulatory capital relief – Retains ~20bps of CET1 and tier 1 capital ACL Adoption Economic Park Net Q1 ACL (12/31/19) of CECL Factors Acquisition Activity (3/31/20) ACL to Total Loans Day 2 Impact Allowance / Provision • ACL adjusted to incorporate estimated impact of COVID-19 2.00% based upon: 1.62% – Multiple forecast scenarios of GDP, unemployment and 1.22% 0.91% 0.85% 0.86% 0.85% HPI 1.00% $40 – Detailed portfolio reviews 0.38% 0.40% 0.37% 0.30% – Effects of relief programs $10 $11 $12 $10 —% • ACL to total loans, excluding PCD loans(4) of 1.29% Q1 '19 Q2 '19 Q3 '19 Q4 '19 Q1 '20 (3) Allowance / Loans Provision / Avg Loans Provision DAY 1 IMPACT AS EXPECTED; DAY 2 ADJUSTED TO INCREASE ACL BY 15% DUE TO ECONOMIC OUTLOOK Dollar amounts in millions Note: See the accompanying "Non-GAAP Financial Information," "Glossary of Terms," and "Footnotes" slides for details on the calculation of these metrics, definitions 15 of certain terms, and footnotes used.

OPERATING PERFORMANCE STRONG NIM, Adjusted(4) Fee Income Ratio(4) 4.00% 30% Compression due to the impact of Reflects strong noninterest income 3.86% the low interest rate environment growth through Q4 '19, lower ratio in 3.78% Q1 '20 impacted by economic conditions. 3.80% and current economic conditions due to COVID-19. 25% 22% 3.59% 21% 3.60% 20% 3.48% 19% - Benefits of higher rates and growth more 20% 19% than offset higher funding costs 3.37% 3.40% 15% Q1 '19 Q2 '19 Q3 '19 Q4 '19 Q1 '20 Q1 '19 Q2 '19 Q3 '19 Q4 '19 Q1 '20 Efficiency Ratio(3)(4) EPS, Adjusted(4) 62% $0.60 Recurring benefits of Delivering Excellence(1) 60% $0.52 $0.51 $0.50 60% through 2019 and controlled expenses. Q1 '20 impacted by lower noninterest income. $0.50 $0.46 58% $0.41 56% 56% $0.40 56% COVID-19 Q1 '20 reflects the impact of the low interest rate ACL impact $0.30 of $.19 54% 55% environment and the current economic conditions 54% due to COVID-19. $0.22 52% $0.20 Q1 '19 Q2 '19 Q3 '19 Q4 '19 Q1 '20 Q1 '19 Q2 '19 Q3 '19 Q4 '19 Q1 '20 Source: Company filings and reports Note: See the accompanying "Non-GAAP Financial Information," "Glossary of Terms," and "Footnotes" slides for details on the calculations of these metrics, definitions of certain terms, and footnotes used. 16

RECENT ACQUISITIONS Recent Acquisition History Driving Operating Leverage Year Close At Announcement 3.10% Target Company Founded Date Assets Deposits AUM Bank Acquisitions 2.98% Park Bank 1915 Mar. 2020 $1.0 $0.8 $0.2 3.00% Bridgeview Bank 1971 May 2019 $1.3 $1.0 — NorStates Bank 1962 Oct. 2018 $0.5 $0.4 — 2.81% Standard Bank 1947 Jan. 2017 $2.5 $2.2 $0.3 2.80% National Bank & Trust 1867 Mar. 2016 $0.6 $0.6 $0.7 Peoples Bank 1999 Dec. 2015 $0.1 $0.1 — Great Lakes Bank 1896 Dec. 2014 $0.6 $0.5 — 2.60% Branch Acquisitions and Non-Bank Acquisitions 2.56% 2.60% Popular Community Bank – Aug. 2014 $0.7 $0.7 Northern Oak 1975 Jan. 2019 — — $0.8 2016 2017 2018 2019 Q1 '20 Premier Asset Management 2001 Feb. 2017 — — $0.6 Noninterest Expenses / Avg Assets Total, excluding pending acquisitions $7.3 $6.3 $2.6 Balance of Acquired and Organic Asset Growth(6) Organic Growth Acquisitions $20 17%; Organic Asset CAGR of 10% $18 Total Asset Growth CAGR of $16 $7 $14 $6 $11 $5 $10 $4 $2 $12 $13 $2 $11 $9 $10 $8 2015 2016 2017 2018 2019 Q1 '20 Dollars in billions Source: Company regulatory filings and SNL Financial Note: See the accompanying "Non-GAAP Financial Information," "Glossary of Terms," and "Footnotes" slides for details on the calculations of these metrics, definitions of 17 certain terms, and footnotes used.
FINANCIAL REVIEW AND OUTLOOK 18

Q1 '20 EARNINGS HIGHLIGHTS Earnings Per Share Earnings Per Share Earnings EPS of $0.18, compared to $0.47 for Q4 '19 and $0.43 for $0.6 $0.50 $0.52 $0.51 Q1 '19; current quarter impacted by: $0.46 $0.41 • $0.19 per share, or $28mm, of loan loss provision for the $0.4 $0.37 estimated impact of COVID-19 on the ACL • $0.04 per share, or $5.4mm, of acquisition and integration $0.49 $0.43 $0.43 $0.47 $0.2 $0.22 related expenses $0.18 Pre-Tax, Pre-Provision Earnings $— Q1 '19 Q2 '19 Q3 '19 Q4 '19 Q1 '20 Down 14% from Q4 '19 impacted by: • NII lower 3%, NIM down 18bps and NIM, adj. down 11bps (4) EPS, adjustedEPS, adjusted EPS EPS COVID-19 due to: – lower interest rates, $2.9mm lower accretion, fewer days Pre-Tax, Pre-Provision Earnings • Noninterest income down 15%, impacted by: – seasonality, record Q4 '19 capital market and mortgage $100 $89 $85 $84 banking levels and impact of market conditions and $76 $72 $80 COVID-19 $60 $40 Down 5% from Q1 '19 impacted by: • NII up 3% while NIM and NIM, adj.(4) down ~50bps due to $20 lower interest rate environment more than offset by higher $— volumes including acquisitions Q1 '19 Q2 '19 Q3 '19 Q4 '19 Q1 '20 (3)(4) Period Ending • Noninterest expense, adjusted well controlled at 2.44% of (4) average assets vs. 2.54% a year ago Pre-tax, pre-provision earnings RESULTS IMPACTED BY COVID-19 AND LOWER RATE ENVIRONMENT Amounts in millions, except per share data Note: See the accompanying "Non-GAAP Financial Information," "Glossary of Terms" and "Footnotes" slides for details on the calculations of these metrics, definitions of certain terms, and footnotes used. 19

CAPITAL Q1 '19 Q2 '19 Q3 '19 Q4 '19 Q1 '20 Highlights Regulatory Capital Ratios: • As expected, Q1 '20 capital ratios decreased due to Park acquisition (~50bps), stock repurchases • CET1 capital to RWA 10.52% 10.11% 10.18% 10.52% 9.64% (~15bps), and loan growth • Tier 1 capital to RWA 10.52% 10.11% 10.18% 10.52% 9.64% • Elected CECL transition for regulatory capital relief • Total capital to RWA 12.91% 12.57% 12.62% 12.96% 12.00% – Retains ~20bps of CET1 and tier 1 capital Tangible book value per share $12.63 $12.86 $13.31 $13.60 $13.14 • Strong excess capital position, solid operating leverage and credit reserves Robust Capital Levels – Capital levels remain sufficient in a severely adverse economic scenario Excess Capital Above Conservation Buffer – Consistent with mid-size, regional, and national peers 4.50% 7.0% CET1 Capital • Suspended stock repurchase program to shift focus $411mm 9.64% on capital deployment supporting our clients, colleagues, communities, and the broader economy 6.00% 8.50% Tier 1 Capital • Q1 '20 dividend of $0.14 per common share up 9.64% $177mm 17% from a year ago – Dividend maintained for Q2 '20 as announced in 8.00% 10.5% May 2020 Total Capital 12.00% $234mm • Raised $100mm in fixed for life preferred stock at 7% on May 13, 2020; increases Tier 1 and Total Minimum Requirement FMBI Capital Conservation Buffer Capital by ~60bps, minimal impact to CET1 Source: Company filings and reports Note: See the accompanying "Non-GAAP Financial Information," "Glossary of Terms," and "Footnotes" slides for details on the calculations of these metrics, definitions of 20 certain terms, and footnotes used.

OVERVIEW OF PARK BANK Strategically Compelling Branch Network • Completed acquisition on March 9th • Expands market presence in SE Wisconsin • Attractive business with quality relationships ~$700mm in loans, ~95% are commercial ~$1.0bn in deposits, ~87% considered core • Established management team led by Dave Werner, President since 2010, 30+ year industry experience Integration & Conversion • Systems conversion on track for June 12-14 • Project plan reflects current environment – Remote systems conversion, same data processor – Leverage virtual training – Experienced conversion team COVID-19 Response • Efficiently executed pandemic plan; work from home, social distancing and branches open for drive-up as well as lobby access by appointment • Partnership and collaboration with First Midwest to implement SBA Paycheck Protection Program and client accommodations • Cultural synergies between the two organizations help mitigate COVID-19 impact Park FMB Note: See the accompanying "Non-GAAP Financial Information," "Glossary of Terms," and "Footnotes" slides for details on the calculations of these metrics, definitions of certain terms, and footnotes used. 21

OUTLOOK RECAP (For the Year Ended 2020; includes Park Bank) We no longer affirm previous FY2020 guidance given the inability to estimate the impact of COVID-19. We offer commentary on factors influencing FY2020 outlook for key categories. Comments below are subject to and dependent upon the length and impact of COVID-19, customer behavior and Federal stimulus, including the SBA's Paycheck Protection Program and the funding thereof, and other factors. Loans and Deposits • Dependent upon economic conditions, customer behavior and stimulus • SBA's Paycheck Protection Program will further impact NII and NIM • Modestly lower NII, excluding accretion – Accretion of ~$22mm reflecting CECL transition, ~$3mm reclass to lower provision – NIM, adj.(4) continued near-term compression • Excludes potential impacts from the SBA's Paycheck Protection Program Noninterest Income • Modestly down YOY, as acquisition benefits are offset by Q2 COVID-19 impacts • Assuming recovery begins in second half of 2020 Noninterest Expense, Adjusted • Q1 run rate annualized for full year; Q2 elevated, reflective of COVID-19 impacts Asset Quality • Dependent upon economic conditions, customer behavior and stimulus Taxes • Effective tax rate expected to be approximately 25% Capital • Strong capital provides flexibility to navigate the impact of the pandemic Note: See the accompanying "Non-GAAP Financial Information," "Glossary of Terms," and "Footnotes" slides for details on the calculations of these metrics, definitions of certain terms, and footnotes used. 22

BUILDING OUR FUTURE 23
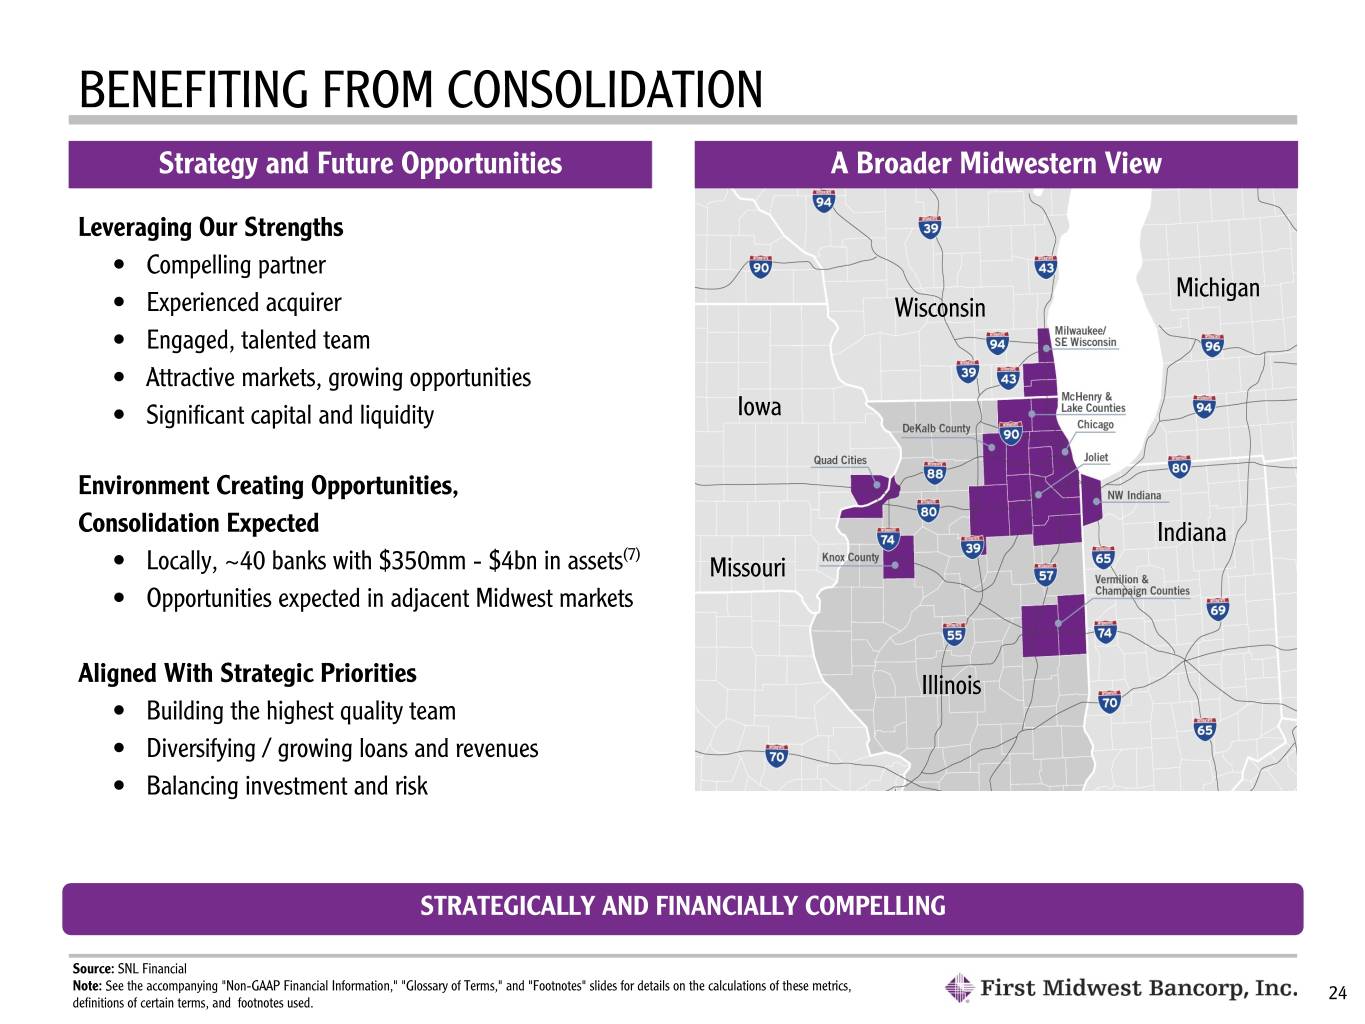
BENEFITING FROM CONSOLIDATION Strategy and Future Opportunities A Broader Midwestern View Leveraging Our Strengths • Compelling partner Michigan • Experienced acquirer Wisconsin • Engaged, talented team • Attractive markets, growing opportunities • Significant capital and liquidity Iowa Environment Creating Opportunities, Consolidation Expected Indiana (7) • Locally, ~40 banks with $350mm - $4bn in assets Missouri • Opportunities expected in adjacent Midwest markets Aligned With Strategic Priorities Illinois • Building the highest quality team • Diversifying / growing loans and revenues • Balancing investment and risk STRATEGICALLY AND FINANCIALLY COMPELLING Source: SNL Financial Note: See the accompanying "Non-GAAP Financial Information," "Glossary of Terms," and "Footnotes" slides for details on the calculations of these metrics, definitions of certain terms, and footnotes used. 24

AS WE GO FORWARD, BUILDING ON A SOLID FOUNDATION Unprecedented times, future difficult to predict Better read on a "return" to a new normal as well as economic and credit outlook over the next few quarters Near term, financial impact will be influenced by: ▪Interest rates ▪Colleague incentives and client accommodations ▪Business and consumer distraction We are well-positioned for the long term, committed to supporting our clients, communities ▪Strong balance sheet with stable funding and robust capital ▪Talented, engaged team ▪Mission focused and aligned priorities 25
LOOKING AHEAD As course of business begins to normalize, we remain focused on: Our business priorities: talent, Investing in and working to better Systems conversion and diversification, risk management leverage resources, technology and onboarding Park Bank's full and systems investments. processes to drive more efficiency team and clients - remains and a better client experiences. on schedule for June. EVERY ENVIRONMENT CREATES OPPORTUNITY Note: See the accompanying "Non-GAAP Financial Information," "Glossary of Terms," and "Footnotes" slides for details on the calculations of these metrics, definitions of certain terms, and footnotes used. 26

INVESTMENT HIGHLIGHTS ü Premier Midwest-based Commercial Bank with Attractive Operational Footprint ü Relationship-driven Strategy, Supported by Leading Core Deposit Foundation ü Diversified Loan Portfolio and Disciplined Underwriting Drive Strong Credit ü Underlying Operating Performance, Aided by "Delivering Excellence"(1) ü Platform for and Track Record of Integrating Accretive, Attractive Acquisitions ü Capital Levels Provide Future Flexibility Note: See the accompanying "Glossary of Terms" and "Footnotes" slides for details on the definitions of certain terms and footnotes used. 27

FORWARD-LOOKING STATEMENTS This presentation, as well as any oral statements made by or on behalf of First Midwest, may contain certain "forward-looking statements" within the meaning of the Private Securities Litigation Reform Act of 1995. In some cases, forward-looking statements can be identified by the use of words such as "may," "might," "will," "would," "should," "could," "expect," "plan," "intend," "anticipate," "believe," "estimate," "outlook," "predict," "project," "probable," "potential," "possible," "target," "continue," "look forward," or "assume" and words of similar import. Forward-looking statements are not historical facts or guarantees of future performance but instead express only management's beliefs regarding future results or events, many of which, by their nature, are inherently uncertain and outside of management's control. It is possible that actual results and events may differ, possibly materially, from the anticipated results or events indicated in these forward-looking statements. First Midwest cautions you not to place undue reliance on these statements. Forward-looking statements speak only as of the date made, and First Midwest undertakes no obligation to update any forward-looking statements. Forward-looking statements may be deemed to include, among other things, statements relating to First Midwest's future financial performance, including the related outlook for 2020, the performance of First Midwest's loan or securities portfolio, the expected amount of future credit reserves or charge-offs, corporate strategies or objectives, including the impact of certain actions and initiatives, anticipated trends in First Midwest's business, regulatory developments, acquisition transactions, estimated synergies, cost savings and financial benefits of announced and completed transactions, growth strategies, including possible future acquisitions, and the potential effects of the COVID-19 pandemic on our business, financial condition, liquidity, loans and results of operations. These statements are subject to certain risks, uncertainties and assumptions, including the duration, extent and severity of the COVID-19 pandemic, including its effects on our business, operations and employees, as well as on our customers and service providers, and on economies and markets more generally and other risks, uncertainties and assumptions that are discussed under the sections entitled "Risk Factors" and "Management's Discussion and Analysis of Financial Condition and Results of Operations" in First Midwest's Annual Report on Form 10-K for the year ended December 31, 2019, and in First Midwest's subsequent filings made with the Securities and Exchange Commission ("SEC"), including First Midwest's Form 10-Q for the quarter ended March 31, 2020. These risks and uncertainties are not exhaustive, and other sections of these reports describe additional factors that could adversely impact First Midwest's business and financial performance. Note: See the accompanying "Glossary of Terms" slide for definitions of certain terms used. 28
APPENDIX 29
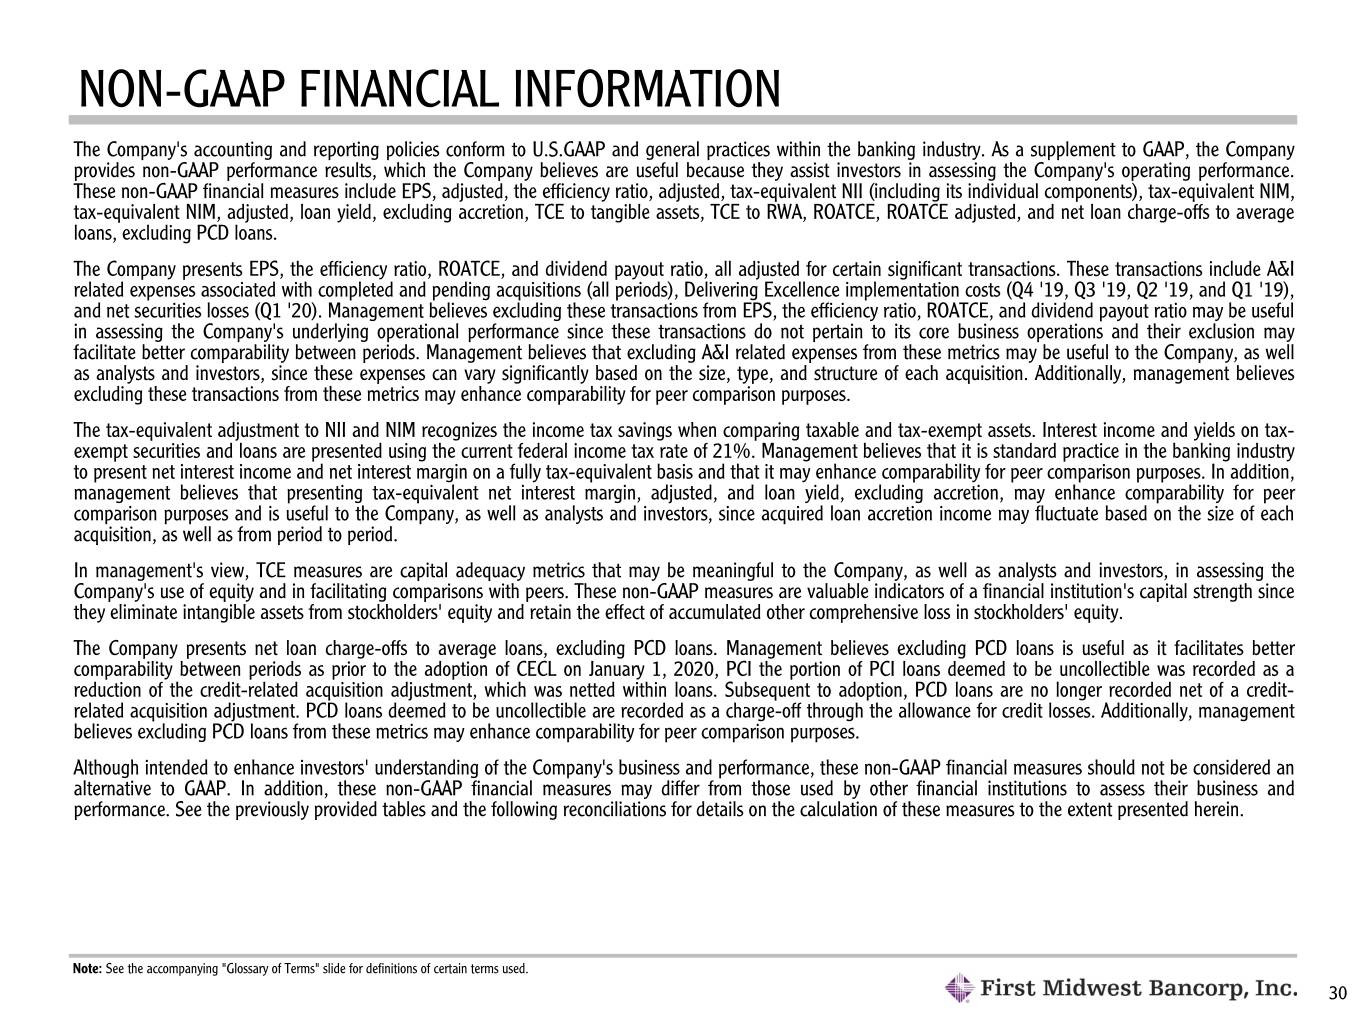
NON-GAAP FINANCIAL INFORMATION The Company's accounting and reporting policies conform to U.S.GAAP and general practices within the banking industry. As a supplement to GAAP, the Company provides non-GAAP performance results, which the Company believes are useful because they assist investors in assessing the Company's operating performance. These non-GAAP financial measures include EPS, adjusted, the efficiency ratio, adjusted, tax-equivalent NII (including its individual components), tax-equivalent NIM, tax-equivalent NIM, adjusted, loan yield, excluding accretion, TCE to tangible assets, TCE to RWA, ROATCE, ROATCE adjusted, and net loan charge-offs to average loans, excluding PCD loans. The Company presents EPS, the efficiency ratio, ROATCE, and dividend payout ratio, all adjusted for certain significant transactions. These transactions include A&I related expenses associated with completed and pending acquisitions (all periods), Delivering Excellence implementation costs (Q4 '19, Q3 '19, Q2 '19, and Q1 '19), and net securities losses (Q1 '20). Management believes excluding these transactions from EPS, the efficiency ratio, ROATCE, and dividend payout ratio may be useful in assessing the Company's underlying operational performance since these transactions do not pertain to its core business operations and their exclusion may facilitate better comparability between periods. Management believes that excluding A&I related expenses from these metrics may be useful to the Company, as well as analysts and investors, since these expenses can vary significantly based on the size, type, and structure of each acquisition. Additionally, management believes excluding these transactions from these metrics may enhance comparability for peer comparison purposes. The tax-equivalent adjustment to NII and NIM recognizes the income tax savings when comparing taxable and tax-exempt assets. Interest income and yields on tax- exempt securities and loans are presented using the current federal income tax rate of 21%. Management believes that it is standard practice in the banking industry to present net interest income and net interest margin on a fully tax-equivalent basis and that it may enhance comparability for peer comparison purposes. In addition, management believes that presenting tax-equivalent net interest margin, adjusted, and loan yield, excluding accretion, may enhance comparability for peer comparison purposes and is useful to the Company, as well as analysts and investors, since acquired loan accretion income may fluctuate based on the size of each acquisition, as well as from period to period. In management's view, TCE measures are capital adequacy metrics that may be meaningful to the Company, as well as analysts and investors, in assessing the Company's use of equity and in facilitating comparisons with peers. These non-GAAP measures are valuable indicators of a financial institution's capital strength since they eliminate intangible assets from stockholders' equity and retain the effect of accumulated other comprehensive loss in stockholders' equity. The Company presents net loan charge-offs to average loans, excluding PCD loans. Management believes excluding PCD loans is useful as it facilitates better comparability between periods as prior to the adoption of CECL on January 1, 2020, PCI the portion of PCI loans deemed to be uncollectible was recorded as a reduction of the credit-related acquisition adjustment, which was netted within loans. Subsequent to adoption, PCD loans are no longer recorded net of a credit- related acquisition adjustment. PCD loans deemed to be uncollectible are recorded as a charge-off through the allowance for credit losses. Additionally, management believes excluding PCD loans from these metrics may enhance comparability for peer comparison purposes. Although intended to enhance investors' understanding of the Company's business and performance, these non-GAAP financial measures should not be considered an alternative to GAAP. In addition, these non-GAAP financial measures may differ from those used by other financial institutions to assess their business and performance. See the previously provided tables and the following reconciliations for details on the calculation of these measures to the extent presented herein. Note: See the accompanying "Glossary of Terms" slide for definitions of certain terms used. 30

NON-GAAP FINANCIAL INFORMATION Quarters Ended Q1 '19 Q2 '19 Q3 '19 Q4 '19 Q1 '20 EPS Net income $ 46,058 $ 47,014 $ 54,545 $ 52,121 $ 19,606 Net income applicable to non-vested restricted shares (403) (389) (465) (424) (192) Net income applicable to common shares $ 45,655 $ 46,625 $ 54,080 $ 51,697 $ 19,414 Net securities losses, net of tax — — — — 754 A&I related expenses, net of tax 2,768 7,135 2,548 3,943 4,104 Delivering Excellence implementation costs, net of tax(1) 193 331 175 167 — Total adjustments to net income, net of tax 2,961 7,466 2,723 4,110 4,858 Net income applicable to common shares, adjusted $ 48,616 $ 54,091 $ 56,803 $ 55,807 $ 24,272 Weighted-average common shares outstanding (basic) 105,770 108,467 109,281 109,059 109,922 Dilutive effect of common stock equivalents — — 381 519 443 Weighted-average diluted common shares outstanding 105,770 108,467 109,662 109,578 110,365 Basic EPS $ 0.43 $ 0.43 $ 0.49 $ 0.47 $ 0.18 Diluted EPS $ 0.43 $ 0.43 $ 0.49 $ 0.47 $ 0.18 Diluted EPS, adjusted(10) $ 0.46 $ 0.50 $ 0.52 $ 0.51 $ 0.22 Dividends declared per share $ 0.12 $ 0.14 $ 0.14 $ 0.14 $ 0.14 Dividend payout ratio 27.9 % 32.6 % 28.6 % 29.8 % 77.8 % Efficiency Ratio Calculation Noninterest expense $ 102,110 $ 114,142 $ 108,395 $ 116,748 $ 117,331 Net OREO expense (681) (294) (381) (1,080) (420) A&I related expenses (3,691) (9,514) (3,397) (5,258) (5,472) Delivering Excellence implementation costs(1) (258) (442) (234) (223) — Total noninterest expense for efficiency ratio calculation $ 97,480 $ 103,892 $ 104,383 $ 110,187 $ 111,439 Tax-equivalent NII(8) $ 140,132 $ 151,492 $ 152,019 $ 149,711 $ 144,728 Noninterest income 34,906 38,526 42,951 46,496 39,362 Less: net securities losses — — — — 1,005 Total $ 175,038 $ 190,018 $ 194,970 $ 196,207 $ 185,095 Efficiency ratio 56 % 55 % 54 % 56 % 60 % Amounts in thousands, except per share data Note: See the accompanying "Glossary of Terms" and "Footnotes" slides for definitions of certain terms and footnotes. 31

NON-GAAP FINANCIAL INFORMATION Q1 '19 Q2 '19 Q3 '19 Q4 '19 Q1 '20 Return on Average Tangible Common Equity Net income applicable to common shares, adjusted $ 48,616 $ 54,091 $ 56,803 $ 55,807 $ 24,272 Intangibles amortization, net of tax 1,772 1,968 2,062 2,058 2,077 Net income applicable to common shares, excluding intangible amortization, adjusted $ 50,388 $ 56,059 $ 58,865 $ 57,865 $ 26,349 Average stockholders' equity $ 2,138,281 $ 2,241,569 $ 2,327,279 $ 2,359,197 $ 2,415,157 Less: average intangible assets (803,408) (832,263) (877,069) (874,829) (887,600) Average tangible common equity $ 1,334,873 $ 1,409,306 $ 1,450,210 $ 1,484,368 $ 1,527,557 ROATCE 14.4 % 13.8 % 15.4 % 14.4 % 5.7 % ROATCE, adjusted 15.3 % 16.0 % 16.1 % 15.5 % 6.9 % TCE Stockholders' equity $ 2,159,471 $ 2,300,573 $ 2,339,599 $ 2,370,793 $ 2,435,707 Less: goodwill and other intangible assets (808,852) (878,802) (876,219) (875,262) (935,241) TCE $ 1,350,619 $ 1,421,771 $ 1,463,380 $ 1,495,531 $ 1,500,466 Total assets $ 15,817,769 $ 17,462,233 $ 18,013,454 $ 17,850,397 $ 19,753,300 Less: goodwill and other intangible assets (808,852) (878,802) (876,219) (875,262) (935,241) Tangible assets $ 15,008,917 $ 16,583,431 $ 17,137,235 $ 16,975,135 $ 18,818,059 RWA $ 13,131,237 $ 14,056,482 $ 14,294,011 $ 14,225,444 $ 15,573,684 TCE to tangible assets 9.0 % 8.6 % 8.5 % 8.8 % 8.0 % TCE to RWA 10.3 % 10.1 % 10.2 % 10.5 % 9.6 % Tax-Equivalent NII / NIM NII $ 139,024 $ 150,312 $ 150,787 $ 148,359 $ 143,575 Tax-equivalent adjustment 1,108 1,180 1,232 1,352 1,153 Tax-equivalent NII(8) $ 140,132 $ 151,492 $ 152,019 $ 149,711 $ 144,728 Less: acquired loan accretion (6,369) (10,308) (9,244) (9,657) (6,946) Tax-equivalent NII, adjusted(8) $ 133,763 $ 141,184 $ 142,775 $ 140,054 $ 137,782 Average interest-earning assets $ 14,035,361 $ 14,952,044 $ 15,800,915 $ 15,969,287 $ 16,431,320 NIM(8) 4.04 % 4.06 % 3.82 % 3.72 % 3.54 % NIM, adjusted(8) 3.86 % 3.78 % 3.59 % 3.48 % 3.37 % Fee Income Ratio Noninterest income $ 34,906 $ 38,526 $ 42,951 $ 46,496 $ 39,362 Less: other noninterest income (2,494) (2,753) (2,920) (3,419) (3,065) Less: securities losses — — — — 1,005 Fee-based revenues 32,412 35,773 40,031 43,077 37,302 Tax-equivalent net interest income(8) 140,132 151,492 152,019 149,711 144,728 Total revenue for fee income ratio $ 172,544 $ 187,265 $ 192,050 $ 192,788 $ 182,030 Fee income ratio(9) 19 % 19 % 21 % 22 % 20 % Amounts in thousands, except per share data Note: See the accompanying "Glossary of Terms" and "Footnotes" slides for definitions of certain terms and footnotes. 32

NON-GAAP FINANCIAL INFORMATION Quarters Ended March 31, June 30, September 30, December 31, March 31, 2019 2019 2019 2019 2020 Net Charge-offs to average loans Total net charge-offs $ 9,084 $ 9,341 $ 9,199 $ 10,600 $ 12,114 Less: net charge-offs for PCD loans — — — — (1,720) Total net charge-offs, excluding PCD loans $ 9,084 $ 9,341 $ 9,199 $ 10,600 $ 10,394 Total average loans $ 11,456,267 $ 12,020,820 $ 12,538,189 $ 12,752,389 $ 13,073,005 Less: average PCD loans — — — — (165,906) Total average loans, excluding PCD loans $ 11,456,267 $ 12,020,820 $ 12,538,189 $ 12,752,389 $ 12,907,099 Net charge-offs to loans, excluding PCD loans 0.32 % 0.31 % 0.29 % 0.33 % 0.32 % Amounts in thousands, except per share data Note: See the accompanying "Glossary of Terms" and "Footnotes" slides for definitions of certain terms and footnotes. 33

GLOSSARY OF TERMS Allowance, ACL - Allowance for credit losses NCOs - Net charge-offs A&I - Acquisition and integration expense NII - Net interest income ATM - Automated teller machine NIM - Tax-equivalent net interest margin AUM - Assets under management NorStates Bank - Northern States Financial Corporation bn - Billion Northern Oak - Northern Oak Wealth Management, Inc. bps - Basis points NOW - Negotiable order of withdrawal Bridgeview Bank - Bridgeview Bancorp, Inc. NPAs - Non-performing assets C&I - Commercial and industrial Park Bank - Bankmanagers Corp. CAGR - Compound annual growth rate PCD - Purchased credit deteriorated CECL - Current Expected Credit Losses PPP - Paycheck Protection Program CET1 - Common equity Tier 1 PPPLF - Paycheck Protection Program Liquidity Facility CD - Certificate of deposit OREO - Other real estate owned Core Deposits - Represents demand, savings, NOW, and money market QSR - Qualified special representative agreement deposits QTD - Quarter-to-date CRE - Commercial real estate ROATCE - Return on average tangible common equity EPS - Earnings per share SBA - Small Business Administration FICO - Fair Issac Corporation RWA - Risk-weighted assets FHLB - Federal Home Loan Bank SEC - Securities and Exchange Commission First Midwest Bancorp, Inc. - the Company or First Midwest Standard Bank- Standard Bancshares, Inc. Foreclosed Assets - OREO and other foreclosed assets TCE - Tangible common equity - represents common stockholders' equity FY - Full year less goodwill and identifiable intangible assets GAAP - U.S. Generally accepted accounting principles U.S. - United States GDP - Gross domestic product YoY. - Year-over-year HPI - House price index LTV - Loan-to-value mm - Million MSA - Deposit market share 34

FOOTNOTES (1) The Company initiated certain actions in connection with its Delivering Excellence initiative in the second quarter of 2018, demonstrating the Company's ongoing commitment to provide service excellence to its clients and maximizing both the efficiency and scalability of its operating platform. (2) Refer to the Company's 2020 Annual Meeting Proxy Statement for a detailed list of the Company's peer group. (3) Annualized based on the number of days for each period presented. (4) This financial measure includes certain adjustments. See the accompanying "Non-GAAP Financial Information" slides for detail. (5) Loan data as of December 31, 2009 excludes covered loans. (6) Assumes reported assets less acquired assets (based on closed acquisitions at that time, unless otherwise noted) is equivalent to organic asset growth. (7) Reflects data for the Chicago-Naperville-Elign, IL-IN-WI (Metro) MSA. (8) Presented on a tax-equivalent basis, assuming the applicable federal income tax rate of 21%. (9) Fee-based revenues, adjusted divided by total revenue for fee income ratio. (10) Adjustments to net income for each period presented are detailed in the EPS non-GAAP reconciliation in the accompanying "Non-GAAP Financial Information" slides. 35
